PARAGUAY CLIMATE RISK COUNTRY PROFILE - ReliefWeb
←
→
Page content transcription
If your browser does not render page correctly, please read the page content below

CLIMATE RISK COUNTRY PROFILE

       PARAGUAY
COPYRIGHT
© 2021 by the World Bank Group
1818 H Street NW, Washington, DC 20433
Telephone: 202-473-1000; Internet: www.worldbank.org

This work is a product of the staff of the World Bank Group (WBG) and with external contributions. The opinions, findings,
interpretations, and conclusions expressed in this work are those of the authors and do not necessarily reflect the views or the
official policy or position of the WBG, its Board of Executive Directors, or the governments it represents.

The WBG does not guarantee the accuracy of the data included in this work and do not make any warranty, express or implied,
nor assume any liability or responsibility for any consequence of their use. This publication follows the WBG’s practice in
references to member designations, borders, and maps. The boundaries, colors, denominations, and other information shown
on any map in this work, or the use of the term “country” do not imply any judgment on the part of the WBG, its Boards, or the
governments it represents, concerning the legal status of any territory or geographic area or the endorsement or acceptance
of such boundaries.

The mention of any specific companies or products of manufacturers does not imply that they are endorsed or recommended
by the WBG in preference to others of a similar nature that are not mentioned.

RIGHTS AND PERMISSIONS
The material in this work is subject to copyright. Because the WBG encourages dissemination of its knowledge, this work may
be reproduced, in whole or in part, for noncommercial purposes as long as full attribution to this work is given.

Please cite the work as follows: Climate Risk Profile: Paraguay (2021): The World Bank Group.

Any queries on rights and licenses, including subsidiary rights, should be addressed to World Bank Publications, The World Bank
Group, 1818 H Street NW, Washington, DC 20433, USA; fax: 202-522-2625; e-mail: pubrights@worldbank.org.

Cover Photos: © Oscar Mendoza/Food and Agricultural Organization, “Paraguay familias productoras” May 24, 2017” via Flickr,
Creative Commons CC BY-NC-ND 2.0. © Oscar Mendoza/World Bank “Mesoamérica Sin Hambre” May 25, 2017 via Flickr,
Creative Commons CC BY-NC-ND 2.0.

Graphic Design: Circle Graphics, Reisterstown, MD.

CLIMATE RISK COUNTRY PROFILE: PARAGUAY                                                                                        ii
ACKNOWLEDGEMENTS
This profile is part of a series of Climate Risk Country Profiles developed by the World Bank Group (WBG). The country profile
synthesizes most relevant data and information on climate change, disaster risk reduction, and adaptation actions and policies
at the country level. The country profile series are designed as a quick reference source for development practitioners to
better integrate climate resilience in development planning and policy making. This effort is managed and led by Veronique Morin
(Senior Climate Change Specialist, WBG) and Ana E. Bucher (Senior Climate Change Specialist, WBG).

This profile was written by Fernanda Zermoglio (Senior Climate Change Consultant, WBG). Additional support was provided by
Jason Johnston (Operations Analyst, WBG).

Climate and climate-related information is largely drawn from the Climate Change Knowledge Portal (CCKP), a WBG online
platform with available global climate data and analysis based on the latest Intergovernmental Panel on Climate Change (IPCC)
reports and datasets. The team is grateful for all comments and suggestions received from the sector, regional, and country
development specialists, as well as climate research scientists and institutions for their advice and guidance on use of climate
related datasets.

CLIMATE RISK COUNTRY PROFILE: PARAGUAY                                                                                       iii
CONTENTS

FOREWORD  .  .  .  .  .  .  .  .  .  .  .  .  .  .  .  .  .  .  .  .  .  .  .  .  .  .  .  .  .  .  .  .  .  .  .  . 1

COUNTRY OVERVIEW .   .   .   .   .   .   .   .   .   .   .   .   .   .   .   .   .   .   .   .   .   .   .   .   .   .   .   .   .   .   .  2

CLIMATOLOGY  .   .   .   .   .   .   .   .   .   .   .   .   .   .   .   .   .   .   .   .   .   .   .   .   .   .   .   .   .   .   .   .   .   .   4
   Climate Baseline .  .  .  .  .  .  .  .  .  .  .  .  .  .  .  .  .  .  .  .  .  .  .  .  .  .  .  .  .  .  .  .  .  .  .  .  .  .  .  .           4
      Overview  .  .  .  .  .  .  .  .  .  .  .  .  .  .  .  .  .  .  .  .  .  .  .  .  .  .  .  .  .  .  .  .  .  .  .  .  .  .  .  .  .  .         4
      Key Trends .  .  .  .  .  .  .  .  .  .  .  .  .  .  .  .  .  .  .  .  .  .  .  .  .  .  .  .  .  .  .  .  .  .  .  .  .  .  .  .  .           6
   Climate Future .  .  .  .  .  .  .  .  .  .  .  .  .  .  .  .  .  .  .  .  .  .  .  .  .  .  .  .  .  .  .  .  .  .  .  .  .  .  .  .  .          7
      Overview  .  .  .  .  .  .  .  .  .  .  .  .  .  .  .  .  .  .  .  .  .  .  .  .  .  .  .  .  .  .  .  .  .  .  .  .  .  .  .  .  .  .         7
      Key Trends .  .  .  .  .  .  .  .  .  .  .  .  .  .  .  .  .  .  .  .  .  .  .  .  .  .  .  .  .  .  .  .  .  .  .  .  .  .  .  .  .           9

CLIMATE RELATED NATURAL HAZARDS .   .   .   .   .   .   .   .   .   .   .   .   .   .   .   .   .   .   .   .   .   . 10
   Overview .  .  .  .  .  .  .  .  .  .  .  .  .  .  .  .  .  .  .  .  .  .  .  .  .  .  .  .  .  .  .  .  .  .  .  .  .  .  .  .  .  .  . 10
   Key Trends .  .  .  .  .  .  .  .  .  .  .  .  .  .  .  .  .  .  .  .  .  .  .  .  .  .  .  .  .  .  .  .  .  .  .  .  .  .  .  .  .  . 11
   Implications for DRM .  .  .  .  .  .  .  .  .  .  .  .  .  .  .  .  .  .  .  .  .  .  .  .  .  .  .  .  .  .  .  .  .  .  .  .  .  . 13

CLIMATE CHANGE IMPACTS TO KEY SECTORS .   .   .   .   .   .   .   .   .   .   .   .   .   .   .   .   .   .   . 13
   Agriculture  .  .  .  .  .  .  .  .  .  .  .  .  .  .  .  .  .  .  .  .  .  .  .  .  .  .  .  .  .  .  .  .  .  .  .  .  .  .  .  .  .  . 14
   Water  .  .  .  .  .  .  .  .  .  .  .  .  .  .  .  .  .  .  .  .  .  .  .  .  .  .  .  .  .  .  .  .  .  .  .  .  .  .  .  .  .  .  .  . 17
   Energy  .  .  .  .  .  .  .  .  .  .  .  .  .  .  .  .  .  .  .  .  .  .  .  .  .  .  .  .  .  .  .  .  .  .  .  .  .  .  .  .  .  .  .  . 19
   Health .  .  .  .  .  .  .  .  .  .  .  .  .  .  .  .  .  .  .  .  .  .  .  .  .  .  .  .  .  .  .  .  .  .  .  .  .  .  .  .  .  .  .  . 22

ADAPTATION .   .   .   .   .   .   .   .   .   .   .   .   .   .   .   .   .   .   .   .   .   .   .   .   .   .   .   .   .   .   .   .   .   .   . 25
   Institutional Framework for Adaptation .  .  .  .  .  .  .  .  .  .  .  .  .  .  .  .  .  .  .  .  .  .  .  .  .  .  .  .  . 25
   Policy Framework for Adaptation  .  .  .  .  .  .  .  .  .  .  .  .  .  .  .  .  .  .  .  .  .  .  .  .  .  .  .  .  .  .  .  . 25
   Recommendations .  .  .  .  .  .  .  .  .  .  .  .  .  .  .  .  .  .  .  .  .  .  .  .  .  .  .  .  .  .  .  .  .  .  .  .  .  . 26
      Research Gaps .  .  .  .  .  .  .  .  .  .  .  .  .  .  .  .  .  .  .  .  .  .  .  .  .  .  .  .  .  .  .  .  .  .  .  .  .  .  . 26
      Data and Information Gaps .  .  .  .  .  .  .  .  .  .  .  .  .  .  .  .  .  .  .  .  .  .  .  .  .  .  .  .  .  .  .  .  . 26
      Institutional Gaps  .  .  .  .  .  .  .  .  .  .  .  .  .  .  .  .  .  .  .  .  .  .  .  .  .  .  .  .  .  .  .  .  .  .  .  .  .  . 27

CLIMATE RISK COUNTRY PROFILE: PARAGUAY                                                                                                               iv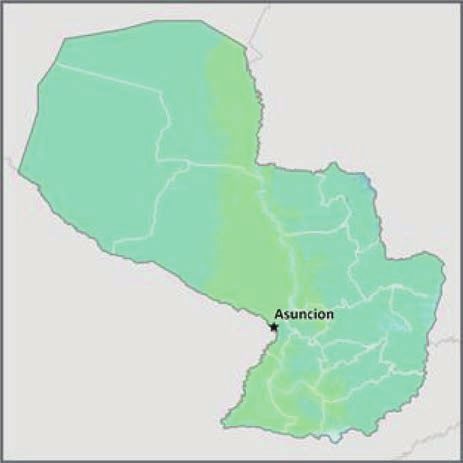
FOREWORD

Climate change is a major risk to good development outcomes, and the World Bank Group is committed to playing
an important role in helping countries integrate climate action into their core development agendas. The World
Bank Group is committed to supporting client countries to invest in and build a low-carbon, climate-resilient future,
helping them to be better prepared to adapt to current and future climate impacts.

The World Bank Group is investing in incorporating and systematically managing climate risks in development
operations through its individual corporate commitments.

A key aspect of the World Bank Group’s Action Plan on Adaptation and Resilience (2019) is to help countries shift
from addressing adaptation as an incremental cost and isolated investment to systematically incorporating climate
risks and opportunities at every phase of policy planning, investment design, implementation and evaluation of
development outcomes. For all International Development Association and International Bank for Reconstruction
and Development operations, climate and disaster risk screening is one of the mandatory corporate climate
commitments. This is supported by the Bank Group’s Climate and Disaster Risk Screening Tool which enables all
Bank staff to assess short- and long-term climate and disaster risks in operations and national or sectoral planning
processes. This screening tool draws up-to-date and relevant information from the World Bank’s Climate Change
Knowledge Portal, a comprehensive online ‘one stop shop’ for global, regional, and country data related to climate
change and development.

Recognizing the value of consistent, easy-to-use technical resources for client countries as well as to support
respective internal climate risk assessment and adaptation planning processes, the World Bank Group’s Climate
Change Group has developed this content. Standardizing and pooling expertise facilitates the World Bank Group in
conducting initial assessments of climate risks and opportunities across sectors within a country, within institutional
portfolios across regions, and acts as a global resource for development practitioners.

For developing countries, the climate risk profiles are intended to serve as public goods to facilitate upstream
country diagnostics, policy dialogue, and strategic planning by providing comprehensive overviews of trends
and projected changes in key climate parameters, sector-specific implications, relevant policies and programs,
adaptation priorities and opportunities for further actions.

It is my hope that these efforts will spur deepening of long-term risk management in developing countries and our
engagement in supporting climate change adaptation planning at operational levels.

Bernice Van Bronkhorst
Global Director
Climate Change Group (CCG)
The World Bank Group (WBG)

CLIMATE RISK COUNTRY PROFILE: PARAGUAY                                                                               1
COUNTRY OVERVIEW

T
        he Republic of Paraguay, a landlocked
        country in South America, is bordered by             FIGURE 1.  Topography of Paraguay2
        Argentina, Brazil, and Bolivia, and has a
Mediterranean climate with almost seven million
inhabitants.1 60% of the country lives in the urban
centers of Encarnación, Ciudad del Este, and the
capital city of Asunción. Political and economic
stability have given the country the largest economic
growth in Latin America in the last 30 years.
Considered an upper middle-income economy,
in recent years the country has positioned itself
as an attractive and orderly place for investments,
further fueling economic growth. Paraguay is a
country of countless natural resources, with a
growing and productive agricultural and livestock
sector. Clean and renewable energy is abundant
and exported regionally. As shown in Figure 1,
the country is largely flat with low-lying hill regions
62% of Paraguay’s approximately 7 million inhabitants
reside in urban areas, and the annual urban growth rates are 1.7%.3 Population projections for 2030 point to an
additional 1 million people living in the country, and a 65.7% residing in urban areas, while in 2050, the country’s
estimated population will top 9 million inhabitants, of which 74.3% will reside in urban areas. Paraguay has made
significant strides in poverty reduction and lowering inequality, reducing the number of people living in poverty in
2011 from 37% to 24.2% in 2018 (Table 1).4 GDP per capita in 2017 was estimated to be US$5.335 with an
annual growth rate of 4.8%.5,6 Nevertheless, significant challenges regarding access to land and the inequitable

TABLE 1.  Data snapshot: Key development indicators

    Indicator                                                                               2018
    Life expectancy at birth, total (years)                                                      74.1
    Population density (people per sq. km land area)                                             17.5
    % of Population with access to electricity                                                  100%
    GDP per capita (current US$)                                                            $5,805.70

1
     World Bank (2020). Open Data, DataBank–Paraguay. [Data Retrieved: July 2020]. URL: https://data.worldbank.org/country/
     paraguay
2
     World Bank Group (2019). Internal Climate Migration Profile – Paraguay.
3
     World Bank (2020). Open Data, - Paraguay. [Data Retrieved August 2020]. URL: https://databank.worldbank.org/source/
     world-development-indicators
4
     World Bank (2020). Open Data, DataBank – Paraguay. [Data Retrieved July 2020]. URL: https://databank.worldbank.org/views/
     reports/reportwidget.aspx?Report_Name=CountryProfile&Id=b450fd57&tbar=y&dd=y&inf=n&zm=n&country=PRY
5
     CIA Factbook (2020). Paraguay. URL: https://theodora.com/wfbcurrent/paraguay/paraguay_economy.html
6
     FOCUS Economics (2020). Paraguay. URL: https://www.focus-economics.com/countries/paraguay

CLIMATE RISK COUNTRY PROFILE: PARAGUAY                                                                                           2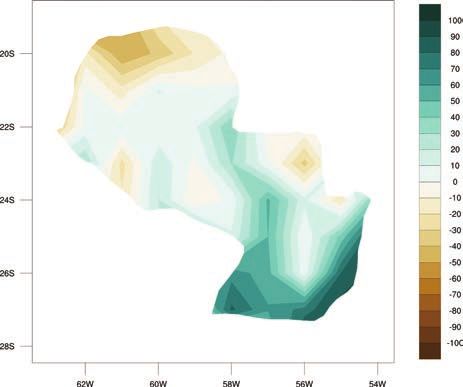
distribution of the country’s wealth remain. Major economic sectors are principally commodity based, and include
exports of energy, beef and soy. The country has taken significant steps in recent years to diversity the economy
and has a growing informal commerce and services sector. With the support of the World Bank, the Paraguayan
government aims to promote sustainable growth and institutional strengthening, while supporting investments in
human capital and advancing the fight against corruption.7 The ongoing drought in Paraguay (beginning in late
2018 and projected to continue through early 2012), has hit the country’s production and trade of key economic
staples particularly hard, causing Paraguay’s central bank to cut back its annual growth projections.8

The ND-GAIN Index9 ranks 181 countries using
a score which calculates a country’s vulnerability
to climate change and other global challenges
                                                                       FIGURE 2.  ND-GAIN Index for Paraguay
as well as their readiness to improve resilience.
                                                                              52.5
This Index aims to help businesses and the public
sector better identify vulnerability and readiness
                                                                               50
in order to better prioritize investment for more
efficient responses to global challenges. Due to                              47.5
a combination of political, geographic, and social                    Score

factors, Paraguay is recognized as vulnerable                                  45

to climate change impacts, ranked 95 out of
181 countries in the 2019 ND-GAIN Index. The                                  42.5

more vulnerable a country is the lower their score,
while the more ready a country is to improve its                               40
                                                                                     1995   1997   1999 2001   2003   2005   2007   2009   2011   2013
resilience the higher it will be. Norway has the                                        Paraguay
highest score and is ranked 1st. Figure 2 is a
time-series plot of the ND-GAIN Index showing
Paraguay’s progress

Paraguay’s economic reliance on agriculture, animal husbandry and hydroelectric energy production make it
particularly vulnerable to the impacts of increasing climate variability and climate change. The country’s high rate of
deforestation, especially for a growing agriculture and livestock sector, is significant. More frequent extreme events
such as intense rainfall and heat waves are increasingly common, negatively impacting all sectors. Additionally,
a significant increase in total annual rainfall has been reported for the summer months of November to December,
corresponding with ENSO (El Niño Southern Oscillation) events, which are also associated with floods. La Niña
events bring the increasing occurrence and intensity of droughts.10

7
     World Bank (2020). Paraguay Country Partnership Strategy. URL: https://www.worldbank.org/en/country/paraguay/overview#2
8
     Desantis, D. (2019). Amid ‘many shocks,’ Paraguay cuts 2019 growth outlook again due to drought, trade. Reuters. URL: https://
     www.reuters.com/article/paraguay-economy/amid-many-shocks-paraguay-cuts-2019-growth-outlook-again-due-to-drought-
     trade-idUSL2N2780ZP
9
     University of Notre Dame (2020). Notre Dame Global Adaptation Initiative. URL: https://gain.nd.edu/our-work/country-index/
10
     Baéz Benitez, J. (2014). Analysis of Meteorological Drought Episodes in Paraguay. URL: https://link.springer.com/article/10.1007/
     s10584-014-1260-7

CLIMATE RISK COUNTRY PROFILE: PARAGUAY                                                                                                                   3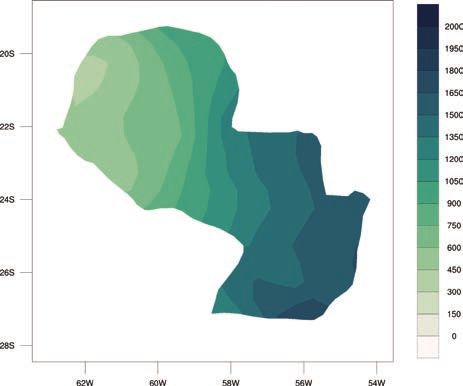
Paraguay submitted its Nationally Determined Contributions to the UNFCCC in 2016 and its Third National
Communication (NC3) in 2017, in support of the country’s efforts to realize its development goals and increase
its resilience to climate change by enhancing mitigation and adaptation implementation efforts.11 Adaptation is a
priority in the National Development Plan (2014–2030) across the following sectors: water resources, forests,
agriculture and livestock production, territorial planning, energy, infrastructure, health, disaster risk management
and early warning systems.12

CLIMATOLOGY

Climate Baseline
Overview
Paraguay’s climate overall is characterized by high humidity and warm temperatures year-round, with hot and rainy
summers, and mild winters with significant temperature variability that can bring both frosts to practically the entire
national territory, as well as heat waves.13 Paraguay’s landscape is characterized by three distinct ecosystems,
bordering the southward flowing Paraguay River. The eastern landscape is one of a humid sub-tropical climate
composed of verdant hills, meadows and forests, and include the great Parana Plateau, reaching altitudes of
300–600 meters (m) above sea level. Lowland plains, subject to annual floods, characterize the easternmost
reaches of the country, which have a tropical savanna climate. To the west lie the dry, vast alluvial plains and dry
grasslands of the Gran Chaco characterized by a hot, semi-arid climate.14

Average temperatures increase from south to north, while rainfall decreases from east to west. Warm temperatures
are present throughout most of the year, as average annual temperatures exceed 20°C throughout the country. In
the Eastern Region, the annual average temperature is between 20°C and 24°C, while in the Chaco or Western
Region, average annual temperatures hover around 25°C. The two periods of maximum rainfall in most of the
country are from March to May and from October to November. Rainfall in the Paraná region (southern Paraguay)
is abundant, averaging 1,900 millimeters (mm) per year and is regularly distributed across the year.15 Rainfall in the
central region, where the capital city of Asuncion is located, is typically 1,400 mm per annum and distributed across
all but the coldest months of the year (June-July). Downpours are common from September to April, where a large

11
     Paraguay (2016). Contribuciones Nacionales de la Republia del Paraguay. URL: https://www4.unfccc.int/sites/ndcstaging/
     PublishedDocuments/Paraguay%20First/Documento%20INDC%20Paraguay%2001-10-15.pdf
12
     Paraguay (2016). Tercera comunicación Nacional de la Republica de Paraguay. URL: https://unfccc.int/sites/default/files/resource/
     NC3%20PARAGUAY.pdf
13
     Paraguay (2018). Segundo Informe Bienal de Actualizacion del Paraguay. URL: https://unfccc.int/sites/default/files/
     resource/56910784_Paraguay-BUR2-1-Informe%20Bienal%20de%20Actualizacion_PY_Dic%202018_.pdf
14
     GERICS (2020). Climate-Fact Sheet: Paraguay. GERICS Climate Service Center. URL: https://www.climate-service-center.de/
     products_and_publications/fact_sheets/climate_fact_sheets/index.php.en
15
     Paraguay (2012). Political Nacional de Cambio Climático de Paraguay. URL: https://www.undp.org/content/dam/paraguay/docs/
     Politica%20Nacional%20CC.pdf

CLIMATE RISK COUNTRY PROFILE: PARAGUAY                                                                                               4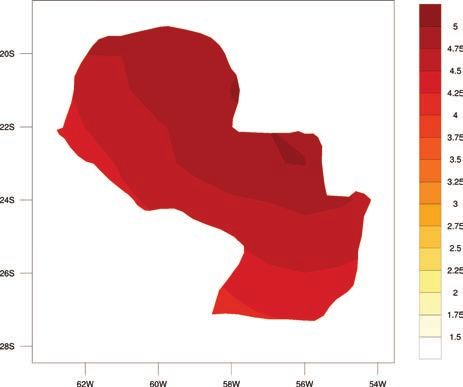
amount of rain falls in a few minutes and generally this occurs when tropical air masses are dominant, and humidity
is high. Light rains are common during the winter months, from May to August. In the Chaco, average annual
rainfall is between 500 to 1,000 mm, but concentrated in the summer months, bringing floods to this typically
dry region in winter.16

Analysis of data from the World Bank Group’s Climate Change Knowledge Portal (CCKP) (Table 2) shows
historical climate information for the period between1991–2019. Mean annual temperature for 24.7°C. Mean
annual precipitation is 2,652.8 mm, with year-round rainfall; the lowest rainfall occurs during the winter months
June to August (Figure 3).17 Figure 4 presents the spatial variation of observed average annual precipitation
and temperature.

TABLE 2.  Data snapshot: Country-level summary statistics

     Climate Variables                                                                                1991–2019
     Mean Annual Temperature (°C)                                                                       24.7°C
     Mean Annual Precipitation (mm)                                                                   2,652.8 mm
     Mean Maximum Annual Temperature (°C)                                                               29.3°C
     Mean Minimum Annual Temperature (°C)                                                               20.2°C

FIGURE 3.  Average monthly temperature and rainfall of Paraguay for 1991–201918
               30°C                                                                                  160 mm

               24°C                                                                                  120 mm
Temperature

                                                                                                              Rainfall

               18°C                                                                                  80 mm

               12°C                                                                                  40 mm

                6°C                                                                                  0 mm
                      Jan    Feb   Mar    Apr    May       Jun   Jul   Aug   Sep   Oct   Nov   Dec

                                                Rainfall          Temperature

16
              FAO (2020). Analysis and Mapping of Impacts Under Climate Change for Adaptation and Food Security Project: Paraguay. URL:
              http://www.fao.org/in-action/amicaf/en/
17
              WBG Climate Change Knowledge Portal (CCKP, 2020). Paraguay Historical Data. URL: https://climateknowledgeportal.worldbank.
              org/country/paraguay/climate-data-historical
18
              WBG Climate Change Knowledge Portal (CCKP, 2020). Paraguay Historical Data. URL: https://climateknowledgeportal.worldbank.
              org/country/paraguay/climate-data-historical

CLIMATE RISK COUNTRY PROFILE: PARAGUAY                                                                                                 5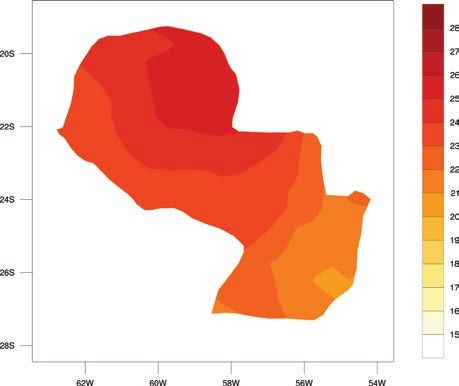
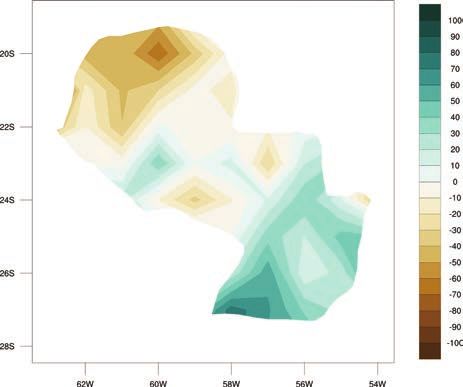
FIGURE 4.  Map of average annual precipitation (left); annual temperature (right) for Paraguay,
 1901–201919

Key Trends
Temperature
Temperatures in Paraguay, particularly maximum temperatures, were observed to increase from 1960 to 2010
in both winter and summer months, with greater increases seen in summer months.20 (Figure 5). Average
maximum temperatures, likewise, have also increased. The number of warm nights21 have increased, while the
number of cold nights22 have decreased.23

FIGURE 5.  Observed temperature for Paraguay, 1901–201924
                25°C
Temperature

                24°C

                23°C

                22°C
                   1901          1926          1941         1956          1971         1986         2001          2016

                          Annual Mean            5 Year Smoothing

19
              WBG Climate Change Knowledge Portal (CCKP, 2020). Paraguay Historical Data. URL: https://climateknowledgeportal.worldbank.
              org/country/paraguay/climate-data-historical
20
              Paraguay (2016). Tercera comunicación Nacional de la Republica de Paraguay. URL: https://unfccc.int/sites/default/files/resource/
              NC3%20PARAGUAY.pdf
21
              “Warm: night is defined by the temperature exceeded on 10% of days or nights in current climate of region or season.
22
              “Cold” night is defined by the temperature below which 10% of days or nights are recorded in current climate of that region or season.
23
              Paraguay (2016). Tercera comunicación Nacional de la Republica de Paraguay. URL: https://unfccc.int/sites/default/files/resource/
              NC3%20PARAGUAY.pdf
24
              WB Climate Change Knowledge Portal (CCKP, 2020). Paraguay URL: https://climateknowledgeportal.worldbank.org/country/
              paraguay/climate-data-historical

CLIMATE RISK COUNTRY PROFILE: PARAGUAY                                                                                                            6
Precipitation
Precipitation patterns exhibit a high degree of inter-annual variability in Paraguay. For example, annual rainfall in
Asuncion can vary between 2,000 mm and 500 mm. An increase in total annual rainfall has been reported for
the summer months of November to December, corresponding with ENSO (El Niño Southern Oscillation) events,
which are also associated with floods. La Niña events bring droughts. All locations also point to an increase in
the number of days receiving heavy rainfall.25
Climate Future
Overview
The main data source for the World Bank Group’s Climate Change Knowledge Portal is the CMIP5 (Coupled Inter-
comparison Project Phase 5) data ensemble, which builds the database for the global climate change projections
presented in the Fifth Assessment Report (AR5) of the Intergovernmental Panel on Climate Change (IPCC). Four
Representative Concentration Pathways (i.e. RCP2.6, RCP4.5, RCP6.0, and RCP8.5) were selected and defined by
their total radiative forcing (cumulative measure of GHG emissions from all sources) pathway and level by 2100. The
RCP2.6 for example represents a very strong mitigation scenario, whereas the RCP8.5 assumes business-as-usual
scenario. For more information, please refer to the RCP Database. For simplification, these scenarios are referred
to as a low (RCP2.6); a medium (RCP4.5) and a high (RCP8.5) emission scenario in this profile. Table 3 provides
CMIP5 projections for essential climate variables under high emission scenario (RCP 8.5) over 4 different time
horizons. Figure 6 presents the multi-model (CMIP5) ensemble of 32 Global Circulation Models (GCMs) showing
the projected changes in annual precipitation and temperature for the periods 2040–2059 and 2080–2099.
TABLE 3. Data snapshot: CMIP5 ensemble projection
CMIP5 Ensemble Projection 2020–2039 2040–2059 2060–2079 2080–2099
Monthly Temperature Anomaly (°C) +0.3 to +2.1 +0.7 to +3.2 +1.3 to +5.0 +1.7 to +6.6
(+1.2°C) (+2.1°C) (+3.2°C) (+4.3°C)
Monthly Precipitation Anomaly (mm) -17.3 to +20.5 -19.0 to +22.9 -20.2 to +28.0 -21.8 to +33.3
(-0.2 mm) (1.0 mm) (1.4 mm) (4.3 mm)
Note: The table shows CMIP5 ensemble projection under RCP8.5. Bold value is the range (10th–90th Percentile) and values in parentheses
show the median (or 50th Percentile).
25
Paraguay (2019). Tendencias de la pecipitación y temperature en Paraguay. URL: http://www.iea.usp.br/midiateca/apresentacao/
sic2_julianbaez.pdf/at_download/file
CLIMATE RISK COUNTRY PROFILE: PARAGUAY 7FIGURE 6. CMIP5 multi-model ensemble projected change (32 GCMs) in annual temperature (top)
and precipitation (bottom) by 2040–2059 (left) and by 2080–2099 (right), relative to 1986–2005
baseline under RCP8.526
26
WBG Climate Change Knowledge Portal (CCKP, 2020). Paraguay Projected Future Climate. URL: https://climateknowledgeportal.
worldbank.org/country/paraguay/climate-data-projections
CLIMATE RISK COUNTRY PROFILE: PARAGUAY 8Key Trends
Temperature
Temperatures across Paraguay are projected to continue rising, with mean monthly temperatures projected to rise
by +2°C by the 2050s and by 4°C by the end of the century under a high-emissions scenario (RCP8.5). Rising
temperatures are projected across all months. The highest temperature rise is projected for the northeast along the
Paraguay river watershed. Rising temperatures will have significant implications for water resources management
and hydroelectric power generation, as evaporation increases.27 Of critical importance is the increase in the number
of very hot days (where temperatures are above 35°C, which are projected to increase from approximately 24 to
113 days of the year by the end of the century.28
Across all emissions scenarios, temperatures are projected to continue to rise in Paraguay, through the end of the
century. As seen in Figure 7, under a high-emissions scenario (RCP8.5), average temperatures are projected to
rise rapidly after the 2040s. High temperatures, analyzed in terms of the number of days above 25 degrees, are
expected to rise significantly across the seasonal cycle, with the most pronounced changes occurring during May
to August (Figure 8). Rising temperatures and extreme heat conditions will result in significant implications for
human and animal health, agriculture, water resources, and ecosystems.
FIGURE 7. Historical and projected average FIGURE 8. Projected change in summer days
temperature for Paraguay from 1986 to 209929 (Tmax > 25°C)30
30 12
29 10
28
8
27
6
degC
days
26
4
25
2
24
23 0
22 –2
1980 2000 2020 2040 2060 2080 2100 Jan Feb Mar Apr May Jun Jul Aug Sep Oct Nov Dec
Year
Historical RCP 2.6 RCP 4.5 RCP 6.0 RCP 8.5
27
Pezzoli, A. et al. (2016). Vulnerability and Resilience to drought in the Chaco, Paraguay. URL: https://iris.polito.it/retrieve/
handle/11583/2654744/129731/Chapter%204_published_20161031.pdf
28
Paraguay (2016). Tercera comunicación Nacional de la Republica de Paraguay. URL: https://unfccc.int/sites/default/files/resource/
NC3%20PARAGUAY.pdf
29
WBG Climate Change Knowledge Portal (CCKP, 2020). Interactive Climate Indicator Dashboard - Transportation. URL http://crme.
rap.ucar.edu/CRMePortal/web/agriculture
30
WBG Climate Change Knowledge Portal (CCKP, 2020). Interactive Climate Indicator Dashboard – Agriculture: Paraguay URL
https://crme.rap.ucar.edu/CRMePortal/web/agriculture
CLIMATE RISK COUNTRY PROFILE: PARAGUAY 9Precipitation
Rainfall in Paraguay is subject to significant interannual variability due to the El Nino Southern Oscillation, which brings
floods and cooler weather, whereas La Niña episodes are associated with droughts and warmer weather in Paraguay.
Average monthly precipitation in the austral winter months (June-August) are projected to increase significantly,
particularly in the North, East and Southeast, while
precipitation during the austral summer months
is projected to either remain constant or slightly FIGURE 9. Annual average precipitation in
decrease in the northeastern regions. 31
Paraguay for 1986 to 209933
1600
Additionally, the amount of rain (maximum 5-day
1400
rainfall totals) will see a slight increase across
1200
the 21st Century. As shown in Figure 9, there
mm
is significant uncertainty on the future of rainfall 1000
patterns for Paraguay32 with most scenarios pointing 800
to an average projected increase in annual
600
precipitation is by the of the century under a high
400
emissions scenario for Paraguay as a whole (RCP8.5). 1980 2000 2020 2040 2060 2080 2100
Year
However, projections point to significant regional Historical RCP 2.6 RCP 4.5 RCP 6.0 RCP 8.5
variability.
CLIMATE RELATED NATURAL HAZARDS
Overview
Paraguay’s diverse landscape is subject to the impacts of extreme events. The alluvial plains and hills where most
of the country’s population is concentrated, are subject to landslides and significant flooding due to increased
surface run off from extreme rainfall on degraded forest and riparian ecosystems, which increase sediment loads.34
Droughts are also common in the western zone, particularly during La Niña events and during the months of
December through February, leading to water supply shortages for human, agriculture and livestock needs.35
In Paraguay, intense droughts can significantly reduce hydroelectric outputs. Abnormal climatic conditions associated
with the El Niño phenomenon can produce high temperatures and severe floods, particularly between the months
31
Paraguay (2017). Tercera comunicación Nacional de la Republica de Paraguay. URL: https://unfccc.int/sites/default/files/resource/
NC3%20PARAGUAY.pdf
32
CEPAL (2014). The economics of climate change in Paraguay. URL: https://repositorio.cepal.org/bitstream/handle/11362/37101/1/
S1420018_es.pdf
33
WBG Climate Change Knowledge Portal (CCKP, 2020). Climate Data-Projections. Paraguay. URL: https://climateknowledgeportal.
worldbank.org/country/paraguay/climate-data-projections
34
Paraguay (2016). Plan Nacional de Gestion de Riésgo de Desastres: 2015–2025. URL: https://repositorio.gestiondelriesgo.gov.co/
bitstream/handle/20.500.11762/756/PNGRD-2016.pdf?sequence=27&isAllowed=y
35
Ortigoza, J.G. (2019). Bases para la Estrategía Nacional de Sequía. URL: https://knowledge.unccd.int/sites/default/files/country_
profile_documents/1%2520FINAL_NDP_Paraguay.pdf
CLIMATE RISK COUNTRY PROFILE: PARAGUAY 10of November and December, damaging agricultural output and threatening operations at the hydroelectric power
projects which generate domestic energy supplies. Climate related disasters comprise most of the emergencies
reported in the country and represent significant economic and human losses. The floods of the Paraguay River
that occurred in March of 2019, for example, damaged 347 schools, forced 19,500 families to evacuate, affected
another 69,534 families and killed 16 people.36
Paraguay’s Third National Communication (2017) prioritized five departments with respect to their vulnerability to
climate driven disasters when combined with local socio-economic conditions: Very High Vulnerability (Index >3.5),
Caazapá, and High Vulnerability, Concepción, Canindeyú, Caaguazú and Itapúa (Index 2.5–3.5).37
Data from the Emergency Event Database: EM-Dat,38 presented in Table 4, shows the country has endured various
natural hazards, including droughts, floods, extreme temperatures, storms and wildfires.
TABLE 4. Natural Disasters in Paraguay, 1900–2020
Total
Natural Hazard Events Total Damage
1900–2020 Subtype Count Deaths Total Affected (’000 USD)
Drought Drought 9 16 1,791,290
Epidemic Viral Disease 9 97 244,326
Flood Riverine Flood 17 36 1,316,647 5,820
Extreme Temperature Cold Wave 3 20
Storm Convective Storm 7 7 147,980 27,000
Wildfire Forest Fire 2 8 125,000 30,000
Key Trends
As the climate changes, weather related disasters are likely to continue, exacerbating existing vulnerabilities in
Paraguay. Rising temperatures and altered rainfall patterns, particularly more intense rainfall events will pose
a significant challenge for water resource management and likely affect all sectors of society, especially the
critical sectors of agriculture and livestock, as well as energy production. The most significant disasters for the
country include droughts, extreme heat and floods, primarily riverine along the Paraguay river, and the Bermejo and
Pilcomayo rivers in the Chaco. Urban flooding is also a problem and is a result of drainage systems overwhelmed
by intense rainfall events (Figure 10). In 2019, for example, heavy rainfall flooded the Distrito Capital in Asuncion
city, displacing at least 2,000 people.39 Studies suggest that climate change could increase the frequency of
occurrence and the intensity of these phenomena. As such, the country is working to understand, anticipate and
36
ECHO (2019). Floods- Emergency Response Coordination Centre (ERCC). ReliefWeb: Paraguay. URL: https://reliefweb.int/map/
paraguay/paraguay-floods-emergency-response-coordination-centre-ercc-dg-echo-daily-map-17062019
37
Paraguay (2017). Tercera comunicación Nacional de la Republica de Paraguay. URL: https://unfccc.int/sites/default/files/resource/
NC3%20PARAGUAY.pdf
38
EM-DAT: The Emergency Events Database - Universite catholique de Louvain (UCL) - CRED, D. Guha-Sapir, Brussels, Belgium.
http://emdat.be/emdat_db/
39
ReliefWeb (2019). Paraguay Floods – March 2019. URL: https://reliefweb.int/disaster/fl-2019-000033-pry
CLIMATE RISK COUNTRY PROFILE: PARAGUAY 11take action to reduce their impacts. An increase in extreme rainfall events will likely continue to cause localized
flooding events. Coupled with the effects of the El Nino Southern Oscillation phenomenon, both the frequency of
floods and droughts will likely increase, increasing the risks for erosion and desertification.40
The areas most affected by the La Niña phenomenon (which generates shortages of rainfall and drought)
are those of the Central Chaco and the Pilcomayo River area, the districts of Irala Fernández and Mariscal
Estigarribia. In general, the western regions are the most affected by droughts. For example, during the
December 2010 to January and February 2011 quarter, the rainfall deficits in the northern Chaco brought about
significant droughts.41
Extreme heat, resulting in heat stress, will continue across Paraguay and combined with high humidity levels,
can affect the productivity of people and crop.42 As temperatures rise, these will likely (i) exacerbate existing
tensions for water between agricultural and livestock needs as well as human populations needs, especially
during the drier seasons; (ii) alter water quality from available surface sources; and (iii) increase pressures on
urban zones as urbanization rates grow. Soy farmers and livestock producers are particularly vulnerable to the
effects of climate change.
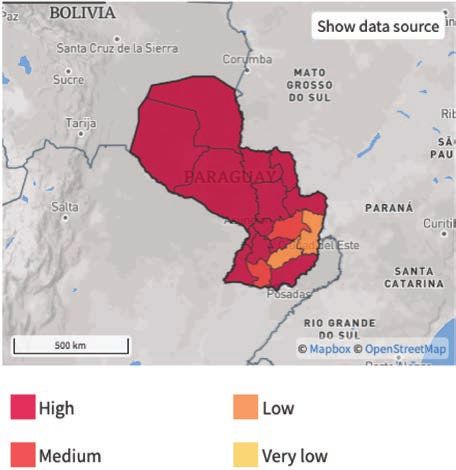
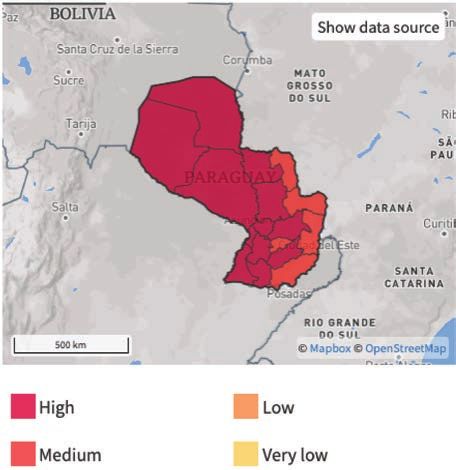
FIGURE 10. Risk of Urban Flood (left),43 Risk of Extreme Heat (right)44
40
Ortigoza, J.G. (2019). Bases para la Estrategía Nacional de Sequía. URL: https://knowledge.unccd.int/sites/default/files/
country_profile_documents/1%2520FINAL_NDP_Paraguay.pdf
41
Ortigoza, J.G. (2019). Bases para la Estrategía Nacional de Sequía. URL: https://knowledge.unccd.int/sites/default/files/
country_profile_documents/1%2520FINAL_NDP_Paraguay.pdf
42
Paraguay (2016). Plan Nacional de Gestion de Riésgo de Desastres: 2015–2025. URL: https://repositorio.gestiondelriesgo.gov.co/
bitstream/handle/20.500.11762/756/PNGRD-2016.pdf?sequence=27&isAllowed=y
43
ThinkHazard! (2020). Paraguay – Urban Flood. URL: https://thinkhazard.org/en/report/194-paraguay/UF
44
ThinkHazard! (2020). Paraguay – Extreme Heat URL: https://thinkhazard.org/en/report/194-paraguay/EH
CLIMATE RISK COUNTRY PROFILE: PARAGUAY 12Implications for DRM
Addressing these compounded risks will require a coordinated set of actions that begin with institutional strengthening
to improve emergency response capabilities in urban areas to floods.45 Additionally, local risk management with
sub-basin groups and communities needs to be promoted. Improved knowledge of the local risks and profiles
of vulnerability can help to identify critical hotspots for adaptation. Coordination, advocacy, and communication,
particularly for transboundary water management is required in order to build resilience and reduce risks. With
regards to the increased number and intensity of heat waves, measures should be taken to adapt building codes
and design and change working practices for outdoor workers to reflect the realities of the changing risk.46 The
stress of urban heat islands can be reduced with architectural practices that promote wind flows across the city
and green spaces. Identifying extreme heat and developing adequate forecasting systems can offer advance
warning for at risk populations, such as the elderly, pregnant women and children. These early warning systems
can be linked to trigger protocols (i.e. the deployment of heat health action plans and emergency response plans)
to mitigate the impacts of heat waves.
CLIMATE CHANGE IMPACTS TO KEY SECTORS
P
araguay is highly vulnerable to seasonal variability and long-term climate change. Increasing vulnerability
is expected to result in cumulative impacts across the country’s political, security, social, economic, and
environmental structures47. Heavy rainfall and floods, as well as droughts in particular will continue to have
significant consequences on the environment, society, food security, and the wider economy.48 Significant impacts are
expected for the country’s water resources, agriculture, health, and energy sectors. Extreme heat, flooding, increased
aridity, and soil erosion puts both urban and rural communities at risk, particularly for poor and vulnerable groups.
Environmental degradation, impacted water resources, and loss of biodiversity and ecosystem services constitute
serious obstacles to the country’s continued development and responsible management of its natural resources. In
addition, the increase in temperature will also have a negative impact on key parts of the economy, e.g. forestry,
agriculture and livestock.
Projected trends of climate variability and longer-term change are likely to exacerbate these concerns, as most
agricultural production is rainfed, and provides livelihoods for the majority of the population. Increased temperatures
and variable rainfall will also impact the country’s forests, also critical to livelihoods and ecosystem services, which
are already under threat from land use change and growing demand for land as the soy frontier extends. More
extreme weather events such as intense rainfall after prolonged dry spells can lead to erosion and flash flooding,
damage roads and infrastructure, wipe out crops and put additional lives at risk.49
45
Paraguay (2016). Plan Nacional de Gestion de Riésgo de Desastres: 2015–2025. URL: https://repositorio.gestiondelriesgo.gov.co/
bitstream/handle/20.500.11762/756/PNGRD-2016.pdf?sequence=27&isAllowed=y
46
Paraguay (2016). Plan Nacional de Gestion de Riésgo de Desastres: 2015–2025. URL: https://repositorio.gestiondelriesgo.gov.co/
bitstream/handle/20.500.11762/756/PNGRD-2016.pdf?sequence=27&isAllowed=y
47
Paraguay (2017). Tercera comunicación Nacional de la Republica de Paraguay. URL: https://unfccc.int/sites/default/files/resource/
NC3%20PARAGUAY.pdf
48
FAO (2013). Paraguay Country Profile. URL: http://www.fao.org/3/a-bp554s.pdf
49
FAO (2020). Analysis and Mapping of Impacts Under Climate Change for Adaptation and Food Security Project: Paraguay. URL:
http://www.fao.org/in-action/amicaf/en/
CLIMATE RISK COUNTRY PROFILE: PARAGUAY 13Agriculture
Overview
Agriculture accounts for more than 10% of Paraguay’s GDP (2018),50 employs 27% of the country’s workforce
and constitutes 90% of registered exports.51,52 The majority (91%) of producers are small rural families
(1–50 hectares [ha]), focused on beans, manioc, sugarcane, maize, tobacco and sesame. Nevertheless, these rural
producers use only 6% of the total cultivated area in Paraguay. The other 94% of the cultivated areas in Paraguay
are dedicated to larger farming enterprises, which specialize in soy, primarily for the export market and livestock
production.53 Farming in Paraguay is mainly rainfed although in recent years this situation is changing. Paraguay
is among the world’s five largest soy producers, occupying over 80% of agricultural lands. Corporate, owned soy
farms benefit from incentives, tax exemptions and access to credit, exacerbating tensions between small rural
food producing farms and large enterprises. The soy producing sector continues to expand rapidly, doubling in
the last decade. The expansion and success of soy production in the country has benefited from herbicide and
agrochemical use as well as the use of genetically modified soy crops.54
Livestock production in Paraguay is extensive and benefits from the natural pastures of the country’s landscape.
Recently, livestock production has expanded rapidly and significantly into the forested regions of the central and
northern Chaco. In the Chaco and southern regions of Missiones and Ñeembucú. While cattle raising is a historically
traditional activity with only 0.3 head per hectare, the sector has modernized substantially with significant increases
in stocking rates sue in part to implemented grasses, advances in animal husbandry and more intensive ranching
practices. The Paraguayan cattle herd totaled 13.8 million head in 2019, roughly 300,000 head more than the
previous year, albeit the first increase since 2014. The industry is heavily focused on beef production for export
to Chile, the Russian Federation, Taiwan and the European Union. Mennonite communities in the north western
regions provide nearly half of the country’s dairy products.55
Climate Change Impacts
The agriculture and livestock sectors are among the most vulnerable in Paraguay due to their dependence on the
natural environment and because they constitute one of the main economic activities of the country. The impacts
on agricultural production arise from more extreme and more frequent rainfall events, and more frequent high
temperatures and heat waves. Soy yields, for example, are likely to decrease as temperatures rise.56 Furthermore,
50
World Bank (2020). Open Data: DataBank- Paraguay: URL: https://databank.worldbank.org/views/reports/reportwidget.
aspx?Report_Name=CountryProfile&Id=b450fd57&tbar=y&dd=y&inf=n&zm=n&country=PRY
51
FAO (2013). Paraguay Country Profile. URL: http://www.fao.org/3/a-bp554s.pdf
52
FAO (2017). Socio-economic context and role of agriculture. URL: http://www.fao.org/3/a-i7752e.pdf
53
FAO (2013). Paraguay – Marco de Programacion Conjunta. URL: http://www.fao.org/3/a-bp554s.pdf
54
WWF (2016). Social, Economic and Environmental Analysis of Soybean and Meat Production in Paraguay. URL: http://
d2ouvy59p0dg6k.cloudfront.net/downloads/social__economic_and_environmental_analysis_of_soybean_and_meat_production_in_
paraguay_1.pdf
55
USDA (2019). GAIN Report: Paraguay Beef. URL: https://apps.fas.usda.gov/newgainapi/api/report/downloadreportbyfilename?filename=
Livestock%20and%20Products%20Annual_Buenos%20Aires_Paraguay_8-16-2019.pdf
56
Paraguay (2017). Tercera comunicación Nacional de la Republica de Paraguay. URL: https://unfccc.int/sites/default/files/resource/
NC3%20PARAGUAY.pdf
CLIMATE RISK COUNTRY PROFILE: PARAGUAY 14it is likely that the negative impacts of climate change due to increased temperature, droughts and floods will offset
the potential gain in yield from increased CO2 in the atmosphere, resulting in an overall decrease in soy yields in
Paraguay. Extreme weather presents the largest risk factor for crop production, especially from droughts and
floods. Projections for precipitation show a significant increase in rainfall form June to August, particularly in the
northern, eastern and southern regions of the country. This is expected to impact agricultural regions, with heavy
rainfall and flooding expected to impacts to key crops such as soy, affecting domestic markets and potentially
forcing some farmers to need to source alternative food for livestock.57
A 2020 study conducted by the Food and Agriculture Organization of the United Nations revealed significant
heterogeneity in terms of the future impacts on crop yields at the department level due to climate change. In the
case of upland rice, significant reductions in yields are projected in the departments of Itapúa and Canindeyú.
Irrigated rice yields, on the other hand, are projected to increase in the departments of Cordillera and Misiones.
Sugar cane yield projections point to widespread decreases, especially in the departments of Amambay, Caazapá,
Caaguazú, Canindeyú and Concepcion Departments under a low emissions scenario (RCP4.5), while future yields
are projected to rise in the department of Paraguarí under high emissions scenario (the RCP8.5). Cassava yields are
projected to increase under both emissions scenarios in the Departments of Alto Paraguay, Amambay, Canindeyú,
Caazapá and Concepción, offering a view of a positive future for a crop central to small scale subsistence farming
communities. Other crops included in the study, namely corn and wheat, showed no significant differences between
historical and future modelled yields.58
The livestock industry, which occurs throughout the country but is concentrated in the western regions, is a
key employment source for the country’s population and accounts for approximately 6% of Paraguay’s GDP.
Droughts, frosts and high temperatures negatively affect productivity. For example, the National Service of Health
and Environmental Quality (SENACSA) determined that in the year 2013 high temperatures (even as frosts
continued to occur in other areas of the country) caused the loss of 5,216 cattle heads.59 Climate variability can also
negatively impact pasture management, which is dependent on summer rains. Additionally, rising temperatures
and more frequent heat waves can decrease carrying capacity (cattle per hectare) by 0.1361 units in the
departments of Concepción, Caaguazú, Caazapá, Itapúa and Canindeyú. Rising temperatures, particularly daily
maximum temperatures, pose an increased risk of heat stress for livestock and could significantly reduce critical
crop yields for rural populations. Between 2005 and 2014, rising temperatures and heat waves are attributed
to have caused the loss of 0.1361 livestock per hectare in the departments of Concepción, Caaguazú, Caazapá,
Itapúa and Canindeyú.60 Under present climate conditions, heat stress already poses challenges for heat
57
FAO (2020). Analysis and Mapping of Impacts Under Climate Change for Adaptation and Food Security Project: Paraguay.
URL: http://www.fao.org/in-action/amicaf/en/
58
WWF (2016). Social, Economic and Environmental Analysis of Soybean and Meat Production in Paraguay. URL: http://
d2ouvy59p0dg6k.cloudfront.net/downloads/social__economic_and_environmental_analysis_of_soybean_and_meat_production_in_
paraguay_1.pdf
59
Paraguay (2017). Tercera comunicación Nacional de la Republica de Paraguay. URL: https://unfccc.int/sites/default/files/resource/
NC3%20PARAGUAY.pdf
60
Paraguay (2017). Tercera comunicación Nacional de la Republica de Paraguay. URL: https://unfccc.int/sites/default/files/resource/
NC3%20PARAGUAY.pdf
CLIMATE RISK COUNTRY PROFILE: PARAGUAY 15dissipation in livestock populations, rendering them
vulnerable to heat stress during certain periods FIGURE 11. Average daily max temperature
of the year. Heat stress can reduce milk production for Paraguay61
and reproduction, particularly for cattle. As heat 10
increases, so is the likelihood of altered growing 9
8
seasons. Figure 11 shows the projected change in
7
average daily maximum temperatures for Paraguay 6
degreesC
across the seasonal cycle. What is clear is that 5
higher temperatures are expected throughout 4
3
the year.
2
1
0
Adaptation Options Jan Feb Mar Apr May Jun Jul Aug Sep Oct Nov Dec
Adaptation strategies in the agricultural systems
of Paraguay, particularly the highly profitable soy,
cotton and sugarcane crops should be implemented to make productivity more resilient to both current and
projected changes in climate.62 The uncertainty associated with future climate is compounded by the fact that
climate change is occurring on top of significant existing interannual variability in climate. One approach is to pair
a package of locally relevant climate-smart agricultural practices with improved climate and weather information
for decision-making.63 This way, farmers can decide what will be the most effective adaptive strategy in a specific
year given their local context and constraints. The provision of climate and weather information to farmers and
other stakeholders within the value chain at decision-relevant timescales could safeguard agriculture and livestock
productivity.64 To strengthen the country’s capacity to adapt to climate change, investments should be focused on
data collection, capacity development, national programming, and comprehensive research. Strategies include:
dedicating necessary resources among the different ministries and institutions to update the basic data collection
in the field and collect new data; building capacity and ensure the resources to strengthen the institutional and
technical competences in terms of water management; strengthening national programs and plans such as National
Plan for the Disaster Risk Management65 to support small-scale family agriculture and rural extension offices;
building synergies among universities, research centers and government organizations in order to implement lines
of research that could include all dimensions of food security and promote adaptation to local conditions and
climate change.66
61
WBG Climate Change Knowledge Portal (CCKP, 2020). Paraguay Agriculture. Dashboard URL: http://crme.rap.ucar.edu/
CRMePortal/web/agriculture
62
Paraguay (2016). Contribuciones Nacionales de la Republia del Paraguay. URL: https://www4.unfccc.int/sites/ndcstaging/
PublishedDocuments/Paraguay%20First/Documento%20INDC%20Paraguay%2001-10-15.pdf
63
FAO (2020). Analysis and Mapping of Impacts Under Climate Change for Adaptation and Food Security Project: Paraguay.
URL: http://www.fao.org/in-action/amicaf/en/
64
Paraguay (2017). Tercera comunicación Nacional de la Republica de Paraguay. URL: https://unfccc.int/sites/default/files/resource/
NC3%20PARAGUAY.pdf
65
Paraguay (2018). Plan Nacional de Gestion y Reducción de Riesgos (2018). URL: https://www.sen.gov.py/application/
files/8015/9188/4586/Politica_Nacional_de_Gestion_y_Reduccion_de_Riesgos__2018.pdf
66
FAO (2020). Analysis and Mapping of Impacts Under Climate Change for Adaptation and Food Security Project: Paraguay.
URL: http://www.fao.org/in-action/amicaf/en/
CLIMATE RISK COUNTRY PROFILE: PARAGUAY 16Water
Overview
Paraguay’s extensive hydrographic network dominated by the Paraguay and Parana rivers makes the country
technically water rich. Both surface waters and water extraction, especially from the Patiño aquifer are used,
particularly across the major cities of Asunción, Fernando de la Mora, San Lorenzo, Capiatá, Itauguá, Ypacaraí,
Limpio, Luque, Villa Elisa, Ñemby, San Antonio, Ypané and Guarambaré. Nevertheless, reliance on the Patiño
aquifer is challenging, as an estimated 50% of the recharge is contaminated. Wells are used extensively across the
country for water provision. Nevertheless, surface waters remain the predominant source for the country and their
critical source springs, wetlands and associated territories face continual pressures from inadequate resource
management including deforestation, increased sedimentation and contamination from agrochemicals.67,68 Water
availability and quality is important both for human consumption and for agricultural use. Currently, over 75% of
the Paraguayan population has access to piped water, while only 15% has access to sanitation. Despite abundant
water resources, access to potable water varies significantly. For example, in the departments of Concepción,
Caaguazú, Caazapá, Itapúa, and Canindeyú, 475,345 people have access to improved drinking water, representing
approximately 29% of the population of these departments. There are also differences on access to water
services between urban (87%) and rural areas (58%). In the hot and dry Chaco region, surface water sources
are limited during the dry periods and underground resources are often saline. Rainwater harvesting is common,
though rainfall amounts of approximately 400 mm per year, it is insufficient to meet demands. The competing
demands of water for human consumption, livestock rearing, and agriculture pose a significant challenge for water
resources management across Paraguay, but especially in the Chaco, in spite of the new aqueduct system that
was recently built.69
Climate Change Impacts
Altered rainfall patterns will inevitably impact water resource availability across Paraguay. Although projected
increases in rainfall will likely increase river flows. Nevertheless, the potential gains from these rising flows are likely
to be offset significantly by the loss of forests, increased siltation, and pollution, particularly from agrochemicals.
Flows of the Paraná and Paraguay rivers will be altered as temperatures rise as well as changes in run off from
critical source streams.70 A compounding challenge is that 90% of the Parana’s basin is in Brazilian territory,
subject to changes in land use practices outside of the country. Nevertheless, the future of water resources in the
country under a changing climate remains uncertain, except for in Paraguay’s northern and central Chaco regions,
where flows are projected to reduce significantly by a combined change in rainfall and rising temperatures. Floods,
67
Secretaría Técnica de Planificación - Dirección General de Estadística, Encuestas y Censos (DGEEC) (2012). URL: https://www.
dgeec.gov.py/
68
Paraguay (2017). Tercera comunicación Nacional de la Republica de Paraguay. URL: https://unfccc.int/sites/default/files/resource/
NC3%20PARAGUAY.pdf
69
Género y agua: la experiencia de l inclusión del enfoque de género en los proyectos de agua potable y saneamiento en Paraguay
(2020). Documento para Discución Nro IDB-00756. URL: https://publications.iadb.org/publications/spanish/document/
G%C3%A9nero_y_agua_La_experiencia_de_la_inclusi%C3%B3n_del_enfoque_de_g%C3%A9nero_en_los_proyectos_de_agua_potable_y_
saneamiento_en_Paraguay.pdf
70
Paraguay (2018). Plan Nacional de Gestion y Reducción de Riesgos (2018). URL: https://www.sen.gov.py/application/files/8015/
9188/4586/Politica_Nacional_de_Gestion_y_Reduccion_de_Riesgos__2018.pdf
CLIMATE RISK COUNTRY PROFILE: PARAGUAY 17particularly in areas with limited sanitation, can pollute water courses, carrying away human waste and exposing the
population to disease transmitting vectors and water borne illnesses such as diarrhea.71 Paraguay has worked to
improve sanitation services and access, however while 80% of populations in urban areas are served by network
water connections, only 15% of urban residents have access to network sewage connections as of 2019. In
contrast, just 44% of rural populations have access to network water connections and with extremely limited basic
sanitation services available for rural communities.72
In general, the Western Region, with ephemeral water resources, is the most affected by droughts brought about
by the La Niña phenomenon (which brings drought conditions). This includes the Central Chaco and the Pilcomayo
River area, the districts of Irala Fernández and Mariscal Estigarribia. During the December 2010 - January and
February 2011 quarter, the center and north of the Chaco were influenced by rainfall deficits from La Niña.73 The
country is currently undergoing a severe drought, which is projected to continue through at least February 2021.
Water deficits for the Paraguay River as especially dire, impacting river activities and water usage in Paraguay as
well as neighbors which also rely on the river’s resources. Deficits are most pronounced in central and eastern
Paraguay as well as into much of norther Argentina.74
Paraguay’s Third National Communication established a water scarcity index that incorporated population
as well as livestock and agriculture needs, as well as those of industry, and identifies the most vulnerable
departments across all emissions scenarios for
the near future (2021–2030) to be: Alto Paraguay,
and Boquerón, while the Departments of Presidente FIGURE 12. Annual SPEI Drought Index in
Hayes, Ñeembucú, Concepción in addition to Alto Paraguay for the period, 1986 to 209977
Paraguay will face increasing water scarcity through
2.0
the 2050s.75 Likewise, a basin analysis pointed to
1.5
the Rio Apa basin is likely to be most affected by 1.0
projected changes in rainfall and temperatures.76 0.5
0
unitless
–0.5
Figure 12 shows the projected annual Standardized
–1.0
Precipitation Evapotranspiration Index (SPEI), –1.5
an index which represents the measure of the –2.0
given water deficit in a specific location, account –2.5
–3.0
ing for contributions of temperature-dependent Historical RCP 2.6 RCP 4.5 RCP 6.0 RCP 8.5
evapotranspiration and providing insight into
71
Paraguay (2017). Tercera comunicación Nacional de la Republica de Paraguay. URL: https://unfccc.int/sites/default/files/resource/
NC3%20PARAGUAY.pdf
72
World Bank (2019). Addressing Challenges in Water, Road and Energy Infrastructure in Paraguay – Results Briefs. [October 16, 2019].
URL: https://www.worldbank.org/en/results/2019/10/16/addressing-challenges-in-water-road-and-energy-infrastructure-in-paraguay
73
Pezzoli, P.E. (2016). Vulnerability and resilience to drought in the Chaco, Paraguay. URL: https://iris.polito.it/retrieve/
handle/11583/2654744/129731/Chapter%204_published_20161031.pdf
74
iSciences (2020). South America: Intense water deficits on the Paraguay River. [June 19, 2020]. URL: https://www.isciences.com/
blog/2020/06/15/south-america-intense-water-deficits-on-the-paraguay-river
75
Paraguay (2017). Tercera comunicación Nacional de la Republica de Paraguay. URL: https://unfccc.int/sites/default/files/resource/
NC3%20PARAGUAY.pdf
76
Paraguay (2017). Tercera comunicación Nacional de la Republica de Paraguay. URL: https://unfccc.int/sites/default/files/resource/
NC3%20PARAGUAY.pdf
77
WBG Climate Change Knowledge Portal (CCKP, 2020). Paraguay Agriculture Sector Dashboard. URL: https://climatedata.
worldbank.org/CRMePortal/web/agriculture/crops-and-land-management?country=PAR&period=2080-2099
CLIMATE RISK COUNTRY PROFILE: PARAGUAY 18You can also read