Supplementary Materials for - Structure reveals the activation mechanism of the MC4 receptor to initiate satiation signaling - Science
←
→
Page content transcription
If your browser does not render page correctly, please read the page content below
science.sciencemag.org/cgi/content/full/science.abf7958/DC1

 Supplementary Materials for
 Structure reveals the activation mechanism of the MC4 receptor to initiate
 satiation signaling
 Hadar Israeli†, Oksana Degtjarik†, Fabrizio Fierro, Vidicha Chunilal, Amandeep Kaur Gill,
 Nicolas J. Roth, Joaquin Botta, Vadivel Prabahar, Yoav Peleg, Li F. Chan, Danny Ben-Zvi*,
 Peter J. McCormick*, Masha Y. Niv*, Moran Shalev-Benami*
 †These authors contributed equally to this work.
 *Corresponding author. Email: moransb@weizmann.ac.il (M.S.-B.); p.mccormick@qmul.ac.uk (P.J.M.);
 masha.niv@mail.huji.ac.il (M.Y.N.); danny.ben-zvi@mail.huji.ac.il (D.B.-Z.)

 Published 15 April 2021 on Science First Release
 DOI: 10.1126/science.abf7958

This PDF file includes:

 Materials and Methods
 Figs. S1 to S10
 Tables S1 to S5
 References

Other Supporting Online Material for this manuscript includes the following:
(available at science.sciencemag.org/cgi/content/full/science.abf7958/DC1)

 MDAR Reproducibility Checklist (.pdf)
Materials and Methods
Construct design and cloning
For the structural studies, human MC4R cDNA (hMC4R, ORFeome 90/90 collection) was cloned
into pFASTBAC1 (bac-to-bac, Thermofischer Scientific) containing a 3C protease sequence
followed by a C-terminus hexa-histidine tag. Cloning was performed using EcoRI-XbaI restriction
endonucleases following amplification of the hMC4R cDNA. The following primers were used:
5’-GGATCCCGGTCCGAAGCGCGCGGAATTCATGGTGAACTCCACCCACCGTGGGATGC-3’ (forward);
5’TACCTTCTAGATTAGTGATGGTGATGATGGTGTCCGGAGCCGCTTGGACCCTGGAACAGTACCTCAAGATATCTG
CTAGACAAGTCACAAAGGCC-3’ (reverse). Gαs (human) was modified with the N-terminal helix of
Gαi1 (Gαs-Ni) as in Madea et al. (24) and was cloned in pFASTBAC-dual under polyhedrin
promoter that also contained Ric8a under a secondary MCS. Cloning was performed by the
restriction-free (RF) method as in Unger et al. (63) using
5’-GATCGACCGCAACCTCCGTGAGGACGGCGAGAAGGCGGCGGCCACGCACCGCCTGCTGCTGCTGGGTGCTG-3’
(forward); 5’-GATCGACCGCAACCTCCGTGAGGACGGCGAGAAGGCGGCGGCCACGCACCGCCTGCTGCTGCTG
GGTGCTG-3’ (reverse) primers. A construct with WT Gαs was a generous gift of Prof. Gregory Tall.
Rat Gβ1 with an N- terminal hexa-histidine tag and human Gγ2 in pFASTBAC-dual and ScFV16
in pVL1393 were cloned as in Madea et al. (24). Virus production has been conducted using the
bac-to-bac system (Thermofischer Scientific) for the pFASTBAC constructs or the BestBac 2.0
linearized DNA system (Expression systems LLC) for pVL1393. Viruses were prepared according
to manufacturer’s instructions in Spodoptera frugiperda (SF9) cells grown at ESF921 media
(Expression systems LLC).
For the signaling assays the pcDNA3.1 plasmid encoding the N-terminal 3xHA-tagged human
MC4R was obtained from the cDNA Resource Centre (#MCR040TN00). Mutagenesis was
generated by TPCR using the reverse primers: 5’-TAATAGGGTGATGACA
ATGGTTGCTGATCCATTTGAAACGCTCACC-3’ (E100A); 5’-GATCACCGAGTCAATGACATTATTAATATTCACTG

TGAAACTCTG-3’ (D122N); 5’-CAAGGAGCTACAGATCACCGAGTAAATGACATTATCAAT ATTCAC-3’ (D126Y)
and 5’-CAGGCTGCAAATGGATGCAAGCATGGAGCTACAGATCACCGAGTC-3’ (L133M). 5’-ATTGACGCAAATG
GGCGGTAGGC-3’ was used as a forward primer for all reactions.
MC4R fusion constructs were generated using the Gibson assembly method. Linearized PCR
products were first generated through the PCR. Detailed information regarding the primers,
backbone vectors and inserts are in Table S5.
The Sm114 labelled mini-Gs was a kind gift from Dr. Nicholas Holliday, University of
Nottingham. The sequences were synthesized in human codon optimized versions by GeneArt and
are cloned into pcDNA3.1zeo. The Sm114, NanoBiT tag is between HindIII and BamH1, with the
mini G sequence (no start codon) between BamH1 and XbaI. Cloning details regarding the SmBit-
β-arrestin 2 are provided in Table S5.

 2
Protein expression and purification
hMC4R, Gαs-Ni, rGβ1 and Gγ2 were co-expressed in Sf9 cells at a ratio of 1:2:1. The cells were
cultured in ESF921 (Expression systems LLC) at 27°C and harvested by centrifugation after 48h.
Cell pellets were lysed in a buffer consisting of 20 mM HEPES pH 7.4, 100 mM NaCl, 10 mM
MgCl2, 5 mM CaCl2, 100 μM TCEP and protease inhibitor cocktail (PIC, cOmplete™ Protease
Inhibitor Cocktail, EDTA Free, Roche). Complex formation was instigated at room temperature
for 1h by the addition of 25 mU/mL apyrase (Sigma), 20 μg/mL ScFV16 and 10 μM agonist
(Setmelanotide, MedChemExpress). The membranes were then solubilized using 0.5% (w/v)
lauryl maltose neopentylglycol (LMNG, Anatrace) and 0.1% (w/v) cholesterol hemisucinate
(CHS, Anatrace) in 20 mM HEPES pH 7.4, 100 mM NaCl, 10 mM MgCl2, 5 mM CaCl2, 100 μM
TCEP, 10uM agonist and PIC, and was incubated for 1.5h at 4°C. Insoluble material was removed
by centrifugation at 37,000 ×g for 30 min and clarified supernatant was incubated with Cobalt
resin (TALON® Metal Affinity Resin, TaKaRa) and stirred for 1h at 4°C. Resin was loaded onto
a gravity flow column and washed with 20 column volumes of wash buffer containing 20 mM
HEPES pH 7.4, 100 mM NaCl, 2 mM MgCl2, 100 μM TCEP, 2 mM CaCl2, 15 mM Imidazole,
0.075% (w/v) LMNG, 0.025% (w/v) glyco-diosgenin (GDN, Anatrace), 0.004% (w/v) CHS and 1
μM agonist. Bound material was eluted in a buffer containing 20 mM HEPES pH 7.4, 100 mM
NaCl, 250 mM Imidazole, 2 mM MgCl2, 2 mM CaCl2, 100 μM TCEP, 1 μM agonist, 0.075%
(w/v) LMNG, 0.025% (w/v) GDN, and 0.004% (w/v) CHS. Sample was concentrated using an
Amicon Ultra Centrifugal Filter (MWCO 100kDa, Merck-Millipore) and loaded onto
Superdex200 10/300 GL column (GE Healthcare) with running buffer containing 20 mM HEPES
pH 7.4, 100 mM NaCl, 2 mM MgCl2, 2 mM CaCl2, 100 μM TCEP, 10 μM agonist, 0.00075%
(w/v) LMNG, 0.00025% GDN and 0.00015% (w/v) CHS. The fractions for the monomeric
complex were collected and concentrated individually for the EM-experiments. For the Western
blot analysis of MC4R a polyclonal anti-MC4 receptor Ab (Alomone labs) has been used in a
1:400 dilution, with a secondary anti-rabbit-HRP (Jackson ImmunoResearch laboratories) at
1:10,000. Further experimental details are provided in Fig. S1.
ScFv16 production
ScFv16 production has been performed as previously described (24). In brief, a C-terminus octa-
his tagged scFv16 with a 3C cleavage site was expressed in a secreted form of Trichoplusia ni Hi5
cells (Tni, Expression systems LLC). Cells were grown for 48h at 27°C and harvested by
centrifugation. Supernatant was pH adjusted with Tris buffer to pH 7.5 and supplemented with 1
mM NiCl2, 5 mM CaCl2 and PIC. The solution was stirred for 1h at room temperature (RT). and
clarified by centrifugation at 5000 rpm for 15 min. The supernatant was loaded onto nickel resin
(TaKaRa) and washed with 20 mM HEPES pH 7.5, 500 mM NaCl and 20 mM imidazole. Elution
was performed with 20 mM HEPES pH 7.5, 100 mM NaCl and 250 mM imidazole. His tag has
been removed by 3C protease cleavage (PreScission Protease from human rhinovirus - HRV 3C;
GeneScript) 16h at 4°C while equilibrating through dialysis with 20 mM HEPES pH 7.5 and 100
mM NaCl. Cleaved ScFV16 was further purified through reverse Ni binding that allowed for the
removal of the cleaved tag and his-tagged protease and was loaded onto a Superdex200 10/300

 3
GL column (GE Healthcare) with running buffer containing 20 mM HEPES pH 7.4 and 100 mM
NaCl. Purified fractions were pooled, concentrated, flash-frozen in the presence of 15% glycerol
and kept in -80°C until further use.
Cryo-EM
3.5 μL of purified MC4R-Gs complex at 14 mg/ml were applied on glow-discharged (90 sec, 15
mA, PELCO easiGlow™, TED PELLA Inc.) holey carbon gold grids (Quantifoil R1.2/1.3, 200
mesh). The grids were blotted using a Vitrobot Mark IV (FEI) with 3 s blotting time, 10 sec wait
time and blot force -1 at 22°C in 100% humidity, and plunge-frozen in liquid ethane. A total of
10,870 movies were recorded on a Titan Krios electron microscope (Thermofischer Scientific -
FEI) operating at 300 kV at a calibrated magnification of x105K and corresponding to a magnified
pixel size of 0.86 Å. BioQuantum energy filter (Gatan) was operated with an energy slit width of
20 eV. Micrographs were recorded using a K3 direct electron camera (Gatan) with an exposure
rate of ∼30.6 electrons/Å2/s and defocus values ranging from −0.8 μm to −2.3 μm. The total
exposure time was 1.49 s and intermediate frames were recorded in 0.033 s intervals resulting in
an accumulated dose of ∼45.5 electrons per Å2 and a total of 45 frames per micrograph. Automatic
data acquisition was done using EPU (Thermofischer Scientific - FEI).
Micrographs were subjected to beam-induced motion correction using MotionCor2 (64). CTF
parameters for each micrograph were determined by CTFFIND4 (65). Initial particle selection in
RELION 3.0 (66) was done manually followed by particle extraction and 2D classification for a
template guided particle picking that resulted in an initial set of 5,076,884 particle projections. The
particles were subjected to reference-free two-dimensional classifications (200 classes, tau fudge=
2, 25 iterations) and three-dimensional (3D) classifications (8 classes, tau fudge=4, 25 iterations)
in RELION 3.1 (66, 67). The map of CB1 receptor (EMDB-0339) low pass filtered to 40 Å was
used as an initial reference model for maximum-likelihood-based 3D classifications.
Conformationally homogeneous groups accounting for 531,298 particles, forming class averages
with well-resolved features, were subjected to 3D refinement by which the alpha-helical domain
has been masked out to allow for better particle alignment. Particle sorting was further performed
through 3D classification using the refined assignments obtained in 3D refine to allow for the
selection of a better homogeneous receptor particle population. The final particle sorting was
performed with a mask that encompasses only MC4R. Following these steps, 366,496 particles
were used for final map reconstruction, where 3D refinement process was followed by by-particle
CTF refinement and Bayesian polishing implemented in RELION 3.1. A binning factor of 2 (pixel
size 1.72 Å) was applied during 2D and 3D classifications, for all other processing steps an
unbinned data was used with a pixel size of 0.86 Å. A flowchart describing data processing steps
is in Fig. S1. The final map has an indicated global nominal resolution of 2.97 Å. Reported
resolution is based on the gold-standard Fourier shell correlation (FSC) using the 0.143 criterion
(Fig. S2). Local resolution was determined in RELION 3.1 with half map reconstructions as input
(Fig. S2C). FSC plots presented in Fig. S2A were calculated with EMAN2 (68).

 4
Model building and refinement
The initial template of MC4R was derived from the crystal structure of an antagonist-bound MC4R
(PDB 6W25). The CB1R receptor coordinates (PDB 6N4B) were used as initial models for the G-
proteins and scFv16, where the chimeric Gαs model was generated through homology modeling
in swiss model using the CB1R model as template (26). Agonist coordinates and geometry
restraints were generated using Phenix.elbow (69). Models were docked into the EM density map
using UCSF Chimera (70), followed by iterative manual building in Coot (71). The final model
was subjected to global refinement and minimization in real space using phenix.real_space_refine
implemented in Phenix (rotamer restrains; Ramachandran restrains; Ncs constrains) (72, 73).
Molprobity (74) was used to evaluate model geometry. FSC curves were calculated between the
resulting model and the half map used for refinement as well as between the resulting model and
the other half map for cross-validation (Fig. S2B). The final refinement parameters are provided
in Table S1.
Signaling assays
Human Embryonic Kidney (HEK293) cells (ATCC® CRL-1573TM) were grown in Dulbecco’s
Modified Eagle’s medium (DMEM) - high glucose (Sigma-Aldrich) supplemented with 100 U/mL
penicillin, 100 mg/mL streptomycin and 10% (v/v) heat-inactivated Fetal Bovine Serum (PAN
Biotech, Germany) at 37°C with 5% CO2. HEK293 were grown in T-75 cm2 flasks.
HEK293 cells were transiently transfected following the reverse transfection method using
LipofectamineTM 3000 (Thermofischer Scientific). Cells were washed with DPBS depleted of Ca2+
and Mg2+, trypsinised and centrifuged (1000 x g, 5 min, RT). The diluted DNA mix was added to
the LipofectamineTM mix dropwise, and incubated for 15 minutes at RT. The cell pellet was
resuspended in 8 mL DMEM-High Glucose media, counted and diluted at a density of 75,000
cells/well. 50 uL of the transfection mix was added into a poly-D-lysine (Sigma-Aldrich) coated
white clear F-bottom 96-well plate followed by 100 mL of the cell suspension. The plate was
incubated at 37°C in a 5% CO2 incubator for 24h.
24h post transfection, the cell culture media was removed and the cells were washed with cAMP
assay buffer (1X HBSS, 24 mM HEPES, 0.1% (w/v) BSA, 3.96 mM NaHCO3, 1 mM MgSO4, 1.3
mM CaCl2.2H2O). The plate was then equilibrated for 1h at 28°C with 90 mL of cAMP Buffer
supplemented with 0.45 mg/mL of Firefly D-Luciferin free acid (NanoLight Technology). Where
the use of antagonist was incorporated into the assay, 80 uL of D-Luciferin buffer was used to
equilibrate, thereafter 10 mL of the antagonist was pre-incubated for 15 minutes before stimulating
the cells with an agonist. Bioluminescence was measured using the CLARIOstar® Plus Plate
Reader (BMG LabTech, Germany). Before injecting the treatment ligand, 6 to 10 basal readings
were performed until stabilization was reached. An average of these basal reads was used to
normalize the response of each well. Bioluminescence was measured for a total of 66 cycles (1
min per cycle), with one second integration time and no lens.
In the case of testing the effects of divalent ions, 24h after transfection, the cell culture media was
removed and the cells were washed with cAMP assay buffer (1X HBSS, 24 mM HEPES, 0.1%

 5
(w/v) BSA, 3.96 mM NaHCO3). Thereafter, the cAMP buffer was supplemented with 0.45 mg/mL
of Firefly D-Luciferin free acid and the ion being investigated was added (1 mM Ca2+, 0.01 mM
Zn2+ or 0.2 mM Mg2+). In a 96-well plate assay, half the wells were equilibrated with cAMP buffer
without the ions being investigated and the other half in the presence of the ion. The plate was
incubated for 1h at 28°C, before initiating the bioluminescence basal readings. However, if the
assay incorporated the use of an antagonist, 10 mL was injected and incubated for 15 minutes at
28°C. An average of these basal reads was used to normalize the response of each well. As soon
as 10 mL of agonist treatment was injected, bioluminescence was measured for a total of 66 cycles
(1 min per cycle) with one second integration time and no lens.
The KB of Ca2+ was calculated by performing cross-titration curves of α-MSH and Ca2+ (0 – 1mM)
and then using Graph Pad Prism to calculate KB using a nonlinear regression analysis fit to an
allosteric EC50 shift model (Fig. S6M).
Mini-Gs recruitment assays
HEK 293 cells (75,000 cells/well) were seeded in poly-D-lysine coated white bottom 96-well plate
and reverse co-transfected with the plasmid encoding the MC4-LgBiT receptor (50 ng/well) and
the SmBiT-Mini Gs fusion at increasing concentrations to decide the optimal conditions required
for the assay to function. On the basis of these results, 10 ng/well of the SmBiT-Mini Gs was co-
transfected with 50 ng/well of MC4R-LgBiT. 24h post-transfection, the cells were washed once
with cAMP assay buffer and the plates were pre-equilibrated for 1h at 37°C with 90 μL of cAMP
assay buffer per well. 25 μL/well of a 5X solution of the Nano-Glo® Live cell reagent was added
and luminescence readings were taken every minute at 37°C until the signal was stable (3-5 min).
Immediately after, 10 μL of agonist/vehicle were added and luminescence was further recorded
for 60 min (no lens, 0.5 s integration time and 1 min intervals at 37°C using a CLARIOstar® Plus
Multimode Plate Reader (BMG Labtech, Germany). To account for differences in expression/cell
density, the average of at least 3 stable pre-readings was used to normalize each well response.
β-arrestin recruitment assays
To establish the optimal receptor: β-arrestin interactor pair, HEK293 cells (75,000 cells/well) were
seeded in poly-D-lysine coated white clear bottom 96-well plates and reverse co-transfected with
the plasmids encoding the receptor (50 ng/well) and the β-arrestin 2 fusions at increasing
concentrations to account for differences in the total amount of DNA/well. On the basis of these
results, 10 ng/well of SmBiT-β-arrestin 2 was co-transfected with 50 ng/well of MC4R-LgBiT.
24h post-transfection, the cells were rinsed once with cAMP assay buffer and the plates were pre-
equilibrated in the dark for 1h at 37°C with 90 μL of cAMP assay buffer. 25 μL/well of a 5X
solution of the Nano-Glo® Live cell reagent was added, and luminescence readings were taken
every minute at 37°C until the signal was stable (3-5 min). Immediately after, 10 μL of
agonist/vehicle were added and luminescence was further recorded for 60 min (no lens, 0.5 s
integration time and 1 min intervals at 37°C using a CLARIOstar® Plus Multimode Plate Reader
(BMG Labtech, Germany). To account for differences in expression/cell density, the average of at
least 3 stable pre-readings was used to normalize each well response.

 6
Flow cytometry analysis
HEK293 cells were plated into six-well plates, a single well for each mutant. Cells were transfected
with MC4R constructs using Lipotransfectamine 3000 (Invitrogen) according to the
manufacturer’s instructions. After 48h cells were harvested by gentle scraping and washed in PBS.
Cells were stained with the Zombie Violet Live / Dead stain (Biolegend) reagent according the
manufacturer’s instructions. Briefly, the viability stain was diluted 1:1000, cells were spun down
and resuspended in 100 µL of the diluted viability stain. Cells were then incubated for 20 minutes
at room temperature before quenched and washed in FACS buffer (PBS + 5% Fetal Bovine Serum
+ 1 mM EDTA + 0.1% Sodium Azide). Samples were then blocked using 5% Bovine Serum
Albumin for 1h at 4°C. After blocking cells were further washed in FACS buffer. HA-tag primary
mouse antibody staining (Invitrogen) was performed at a 1:5000 dilution in a staining volume of
150 µL for 1h at 4°C. Cells were then washed three times in FACS buffer before secondary
staining. Donkey anti-mouse Alexa Fluor 488 (Invitrogen) secondary antibody at a dilution of
1:5000 was incubated with cells for 1h at 4°C in a staining volume of 150 µL per sample. Cells
were further washed 3 times in FACS buffer. Samples were then fixed using 4% paraformaldehyde
for 10 minutes and washed 3 times in FACS buffer. Samples were finally resuspended in 350 µL
PBS and run on a BD LSRFortessa flow cytometer (BD Biosciences). Analysis was performed in
FlowJo software (FlowJo LLC).
Molecular dynamics simulations
Classical molecular dynamics simulations were run for MC4R in the presence and absence of
setmelanotide and excluding Ca2+ from the binding site, the G-protein heterotrimer and scFv16.
The input files were prepared with CHARMM_GUI (75), using the histidine protonation state
predicted by MolProbity (74). MC4R was capped with standard N- and C-termini, while
setmelanotide with the acetylated N-terminus and the amidated C-terminus. Through the PPM web
server (76), the protein was oriented within a membrane bilayer with the following lipid
composition (adapted from reference (77)): cholesterol (144 molecules), DOPE (48), POPC (24),
DPPC (15), SSM (15), SOPS (12), LSM (9), NSM (6), DOPC (6), SOPC (6). The systems were
solvated using circa 40,000 water molecules and neutralized using a 2 mM CaCl2 for a total of
circa 12 positive and 2 negative ions.
The molecular dynamics simulations were performed using GROMACS 2020-2 (78). The
charmm36m force field (79) parameters were employed for protein, peptide, ions and lipids, and
the CHARMM TIP3P water model for water. Each complex was energy minimized with three runs
of steepest descent, with the maximum minimization step size progressively increased by one order
of magnitude (from 0.001 to 0.01 to 0.1 nm). Each minimization was carried out until no further
changes in potential energy were detected. Six steps of equilibration, for a total of 10.875 ns were
performed. In each step, the harmonic restraints applied to the protein, peptide and lipids were
progressively decreased (see Table S3 for more details), with the only exception was represented
by the residues within 5 Å from the G-protein residues. In this case, restraints of 2000 kJ/mol*nm2

 7

on backbone and side chains were kept from the 2nd equilibration step for the entire equilibration
and production runs to avoid conformational rearrangement due to the absence of the G-protein.
The temperature in each step was controlled with a Berendsen thermostat and set to 310 K, while
from step 3 to 6 the pressure was set to 1 bar and controlled with semi-isotropic Berendsen barostat.
Bond lengths to hydrogen atoms were constrained using LINCS. Short range electrostatic and van
der Waals interactions were cut off at 1.2 nm, while long range electrostatic interactions were
computed using the particle mesh Ewald method. Periodic boundaries were employed.
Four production run replicas of 250 ns were performed for each complex with a time step of 2 fs
(see Table S4). The molecular dynamics were run in the NVT ensemble using the Nose-Hoover
thermostat at 310 K and sampling the trajectories every 50 ps.
A density-guided molecular dynamics simulation was also run using GROMACS 2020-2 (Table
S4) (80). In density-guided molecular dynamics simulations, additional forces were applied to
atoms to restrain the three-dimensional structure into the cryo-EM density map. Differently from
the classical molecular dynamics previously described, the Ca2+ was retained inside the MC4R ion
binding site. The complex with setmelanotide, membrane, water and neutralizing ions was
generated as for the classical molecular dynamics. Minimization and equilibration procedures were
also performed similarly to the classical molecular dynamics, with the exception of the positional
restraints applied on all the MC4R atoms, kept to 2000 kJ/mol*nm2 for the whole equilibration.
The cryo-EM map was aligned to the final coordinates of the equilibration step using USCF
Chimera (70). Using a time-step of 2 fs, a 10 ns density-guided molecular dynamics was run,
sampling the trajectory every 10 ps. The cryo-EM map derived forces were applied every 20 steps
on the MC4R and setmelanotide atoms, with an adaptive force scaling time constant of 100 ps.
Additional parameters were set as described for the classical molecular dynamics.
All the trajectories were analyzed using VMD (81) and GROMACS tools.
Docking Experiments
THIQ docking was performed using Glide (82) from the Schrödinger Release 2021-1. The
structure of the ligand was downloaded from the PubChem database (83) and prepared with
LigPrep tool (84), resulting in 9 conformations. The MC4R Cryo-EM structure was prepared for
docking using the Protein Preparation Wizard (85) in Schrödinger. The position of the HFRW
tetra-peptide from setmelanotide was used to determine the grids coordinates, setting the size of
each grid dimension to 17Å. Two docking grids were built through the Receptor Grid Generation
tool, one in the presence and one in the absence of the Ca2+ ion. The XP algorithm was employed
and the best docking THIQ pose according to the Glide score in each one of the two docking runs,
was selected for analysis.

 8
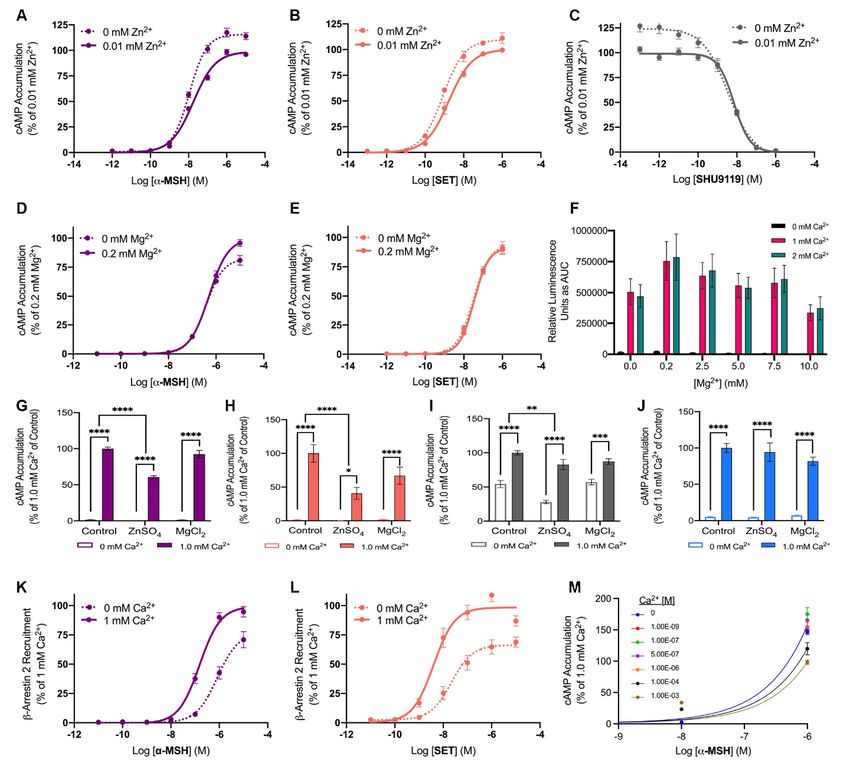
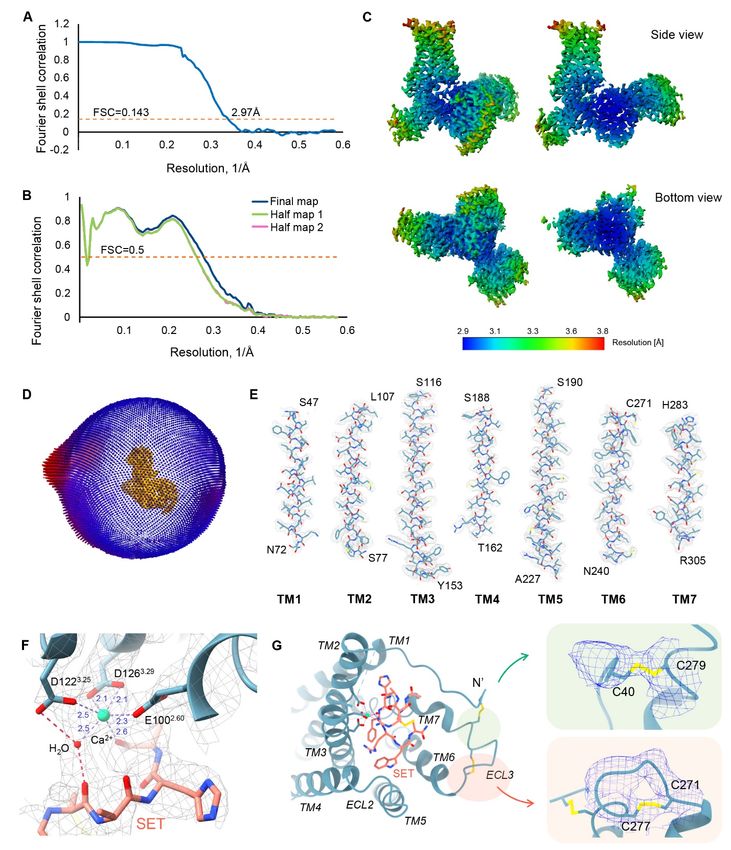
Fig. S1. Cryo-EM flow chart. (A) Size exclusion chromatography (SEC) profile of MC4R
complex. Fractions corresponding to the main peak of monomers (yellow) were combined and
used for the structural studies. (B) Ponceau red stain of the protein complex indicating G-protein
and ScFv16. (C) Western-blot analysis of the same membrane used in B with an anti-MC4R
antibody. (D) Representative cryo-EM micrograph of the MC4R-Gs complex. (E) Representative
reference free 2D class averages of the MC4R-Gs complex. The diameter of the circular mask is
20 nm. (F) Processing flow chart of MC4R cryo-EM data, including particle selection, 2D and 3D
classifications, particle sorting, masking and final map reconstruction. Pixel size is indicated in
parenthesis.

 9
Fig. S2 Map and Model Quality. (A) Gold standard Fourier shell correlation (FSC) curves of
half maps that were individually calculated indicating an averaged resolution of 2.97 Å at 0.143
FSC. (B) FSC curves of the model vs. the final map (blue) and two half maps (green and pink).
FSC plots were calculated with EMAN2. (C) Final density map colored by local resolution. Color
scheme for resolution values is presented in Å. Map contour level is 0.021. (D) Euler angle
distribution of the cryo-EM reconstruction. (E) MC4R helices in density (map contour level

 10
0.021). (F) A Ca2+ ion (green sphere) is bound within the canonical binding pocket of MC4R
maintaining direct interactions with three acidic residues in the receptor D1223.25, D1263.29 and
E1002.60, and the peptide backbone of the agonist (SET). The distances are shown in angstroms.
Additional contact is through a solvent molecule (red sphere), also observed in our molecular
dynamics simulations (Fig. S5A-B). MC4R residues are presented in blue, setmelanotide (SET) in
pink, EM map is contoured as grey mesh (map contour level 0.021). Residue numbers are indicated
in the figure. (G) MC4R has two disulfide bridges connecting ECL3 with the N-terminus and TM6
and 7. The two bridges are clearly indicated in our EM map. Density from unsharpened map is
presented in blue. Contour levels are 0.00782 and 0.0127 for the upper and lower panels,
respectively.

 11
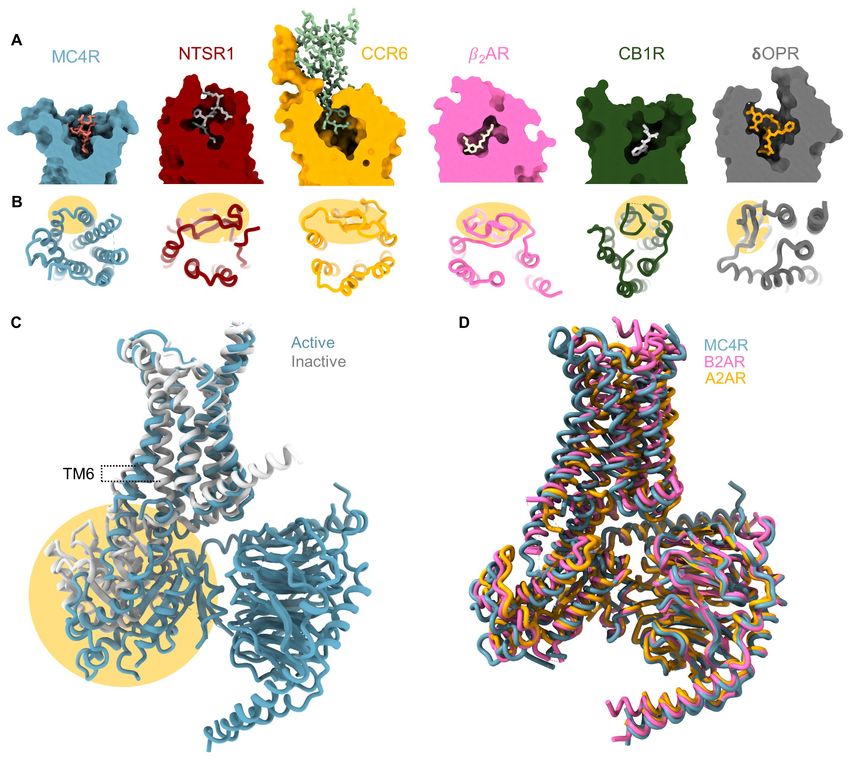
Fig. S3 MCR sequence conservation and comparison with other class-A GPCR members.
(A) Comparison of binding pocket volumes of selected class-A GPCRs. The MC4R is in blue, the
neurotensin receptor 1 (NTSR1, 4GRV) in red, the C-C chemokine receptor type 6 (CCR6,
6WWZ) in yellow, the 2-adrenergic receptor ( 2AR, 7BZ2) in pink, the cannabinoid receptor 1
(CB1R, 6N4B) in green and the delta-opioid receptor (µOPR, 6PT2) in grey. All receptors are
bound to agonists, thus representing the active conformation. Compared with other class A
members MC4R is relatively open, with the ligand exposed to the extracellular milieu. (B) Top
view of selected class-A GPCRs highlighting the short nature of ECL2 in MC4R and the lack of
secondary structure of this loop compared with other receptor subtypes. ECL2 is highlighted
yellow. Receptor selection and colors are as in A. (C) Superposition of active and inactive receptor
structures. Inactive receptor (PDB 6W25) is in grey, and the active receptor in blue. Yellow
highlight is the overlap between the glycogen synthase moiety used in the crystallographic studies
that overlaps with the position of the Gαs. (D) Superposition of GPCR-Gs complex structures.
MC4R in blue, β2 adrenergic receptor (B2AR, 6NI3) in pink and adenosine A2A receptor (A2AR,
6GDG) in yellow. Overlap indicates high conservancy between class members.

 12
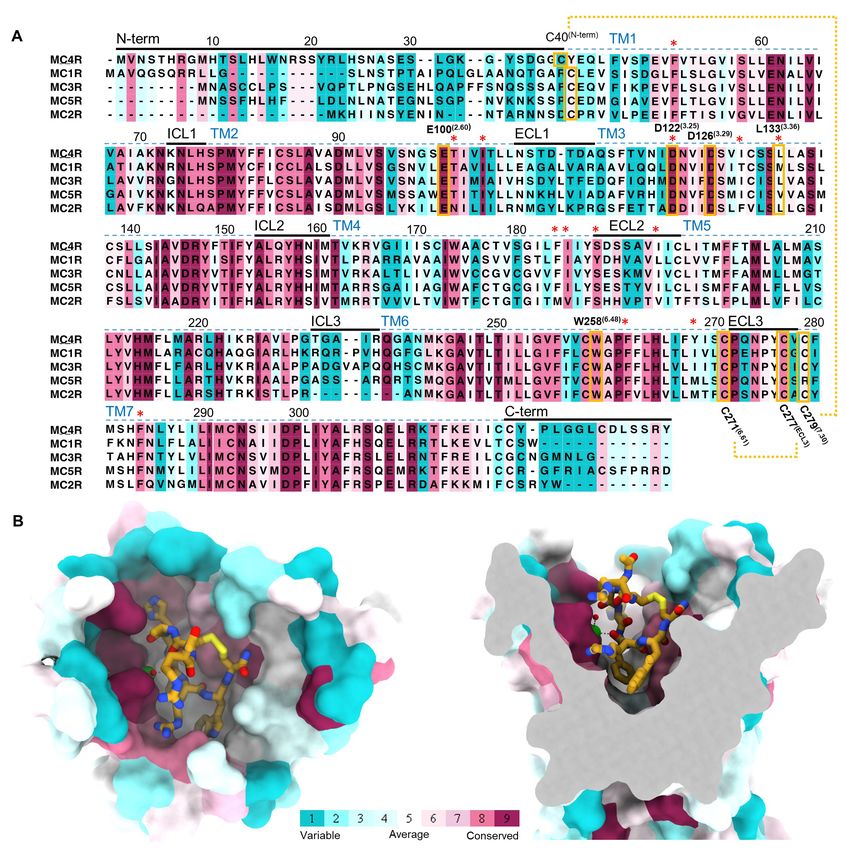
Fig. S4 Sequence and structural conservation of MCRs. (A) Analysis of human MCRs
indicating high sequence conservation among family members. Colors are according to the ladder
presented in B and correspond to the ConSurf analysis (https://consurf.tau.ac.il/) (87). Disulfide
bonds common to MCR are highlighted in yellow and connected with a dashed line, residues
involved in activation switch and Ca2+ coordinating are indicated. Residues involving
setmelanotide binding are marked with an asterisk. Numbers are according to MC4R. (B) 3D
representation of MCR binding pocket with bound agonist. Residues are color coded according to
the conservancy level. Setmelanotide is shown in orange. Residues involved in setmelanotide
binding are mostly conserved throughout the family and are marked in A.

 13
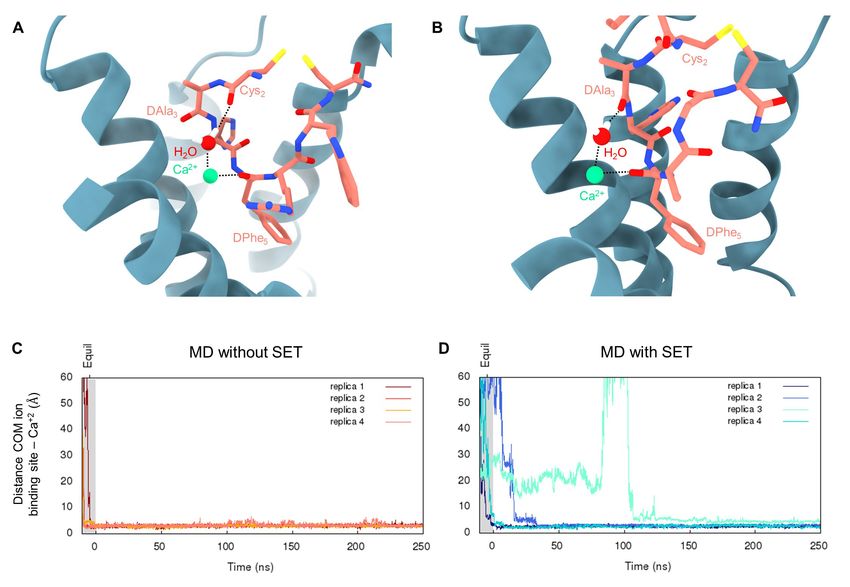
Fig. S5 Molecular dynamics simulations. (A-B) Setmelanotide involvement in Ca2+ ion
coordination observed during the cryo-EM guided molecular dynamics simulation. Setmelanotide
is in pink, Ca2+ is presented as a green sphere, MC4R as blue cartoon. Within the cryo-EM guided
molecular dynamics simulation, two main conformations were identified: (A) Cys2 was found to
interact with the ion through a water mediated hydrogen bond (observed during the first 3 ns).
Arg1 is not shown for clarity. (B) Cys2 backbone oxygen rotates in the opposite direction with
respect to the ion, the interaction with Ca2+ alternates through a hydrogen bond with the backbone
oxygen of the D-Ala3. The D-Phe5 backbone oxygen interacts with Ca2+ in both conformations.
(C-D) Evolution of the distance between the center of mass of the three ion binding residues
(D1223.25, D1263.29 and E1002.60) and the Ca2+ during equilibration and production run for the
classical molecular dynamics simulations. (C) Simulations run without setmelanotide in the
binding site show the Ca2+ ion entering the binding site during the equilibration step in all 4
replicas. (D) Simulations run in the presence of setmelanotide in the binding site indicate that the
ion binds the receptor during the equilibration step in 2 out of 4 replicas, while occurring during
the production run in replicas 2 and 3. Distances over 60Å are not shown.

 14
Fig. S6 Signaling assays. HEK293 cells were transfected with WT MC4R and were treated with
varying doses of α-MSH (A), setmelanotide (B), or SHU9119 (C) in the presence and absence of
divalent ions Zn2+ (A-C) or Mg2+ (D-E). In (F) a competition assay was performed at fixed
concentrations of Ca2+ and varying concentrations of Mg2+ and cAMP production measured as in
the materials and methods by stimulating the cells with a fixed concentration of 0.01 µM α-MSH.
In (G-J) cAMP production was measured after treating with 0.01 µM α-MSH (G), 0.00025 µM
setmelanotide (H), or in the case of (I-J) with prior treatment of 0.0032 µM SHU9119 (I) or 0.63
µM AgRP (J) followed by treatment with 1 µM α-MSH in the presence or absence of Ca2+ and
+/- 10 µM ZnSO4 or 200 µM MgCl2 as indicated. Statistical significance was evaluated using the
two-way (ANOVA) analysis (****p≤0.0001, ***p≤0.001, **p≤0.01 and *p≤0.05). (K-L) β-
arrestin 2 recruitment assay upon α-MSH (K), setmelanotide (L) binding. Experiments are in 3
independent repeats performed in triplicates. (M) Cross-titration curves of Ca2+ and α-MSH for
MC4R activation. Dose response curves measuring cAMP accumulation after stimulation with the

 15
agonist α-MSH were performed at varying concentrations of Ca2+ (see methods). Curves were
plotted using the Allosteric EC50 shift X is log (concentration) model (based on Christopoulos et
al. (86)) and fit using the GraphPad Prism 9 software, from which KB was calculated. Data
represented as mean ± SEM from 3 independent experiments done in triplicate.

 16
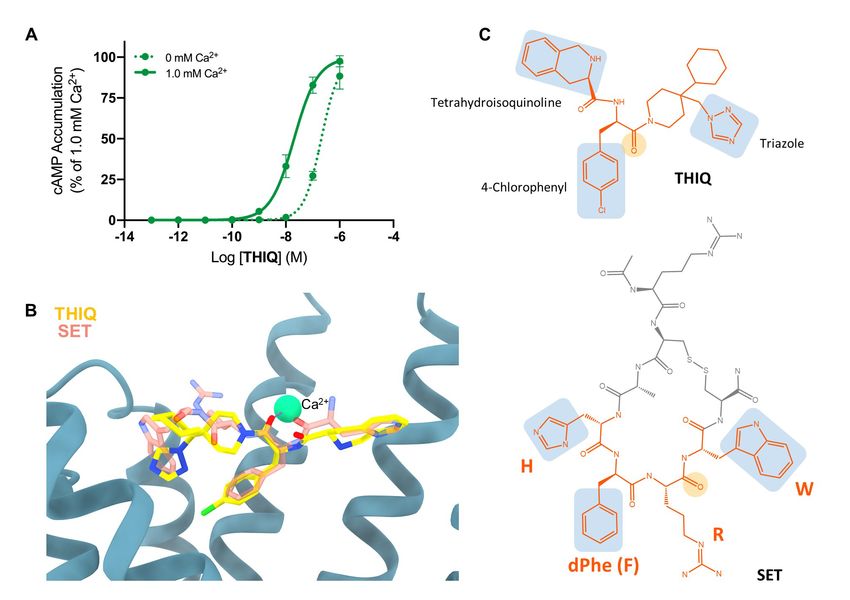
Fig. S7 Activation of MC4R by THIQ depends on Ca2+ presence in the binding pocket. (A)
cAMP accumulation measured in HEK293 cells in the presence and absence of Ca2+ with
increasing THIQ concentrations. Experiments have been performed in three repeats in triplicates.
(B) Superposition of setmelanotide (pink transparent licorice) and docked THIQ (yellow licorice)
in the MC4R (blue ribbon) binding pocket, depicting similar traits in Ca2+ (green sphere)
coordination and ligand binding. For both ligands, the oxygen of a carbonyl group is involved in
Ca2+ binding. (C) Chemical structure of THIQ and setmelanotide (SET). The chemical groups
mimicking the conserved HFRW motif side chains within the binding pocket are highlighted in
blue, backbone participating in Ca2+ coordination is in yellow.

 17
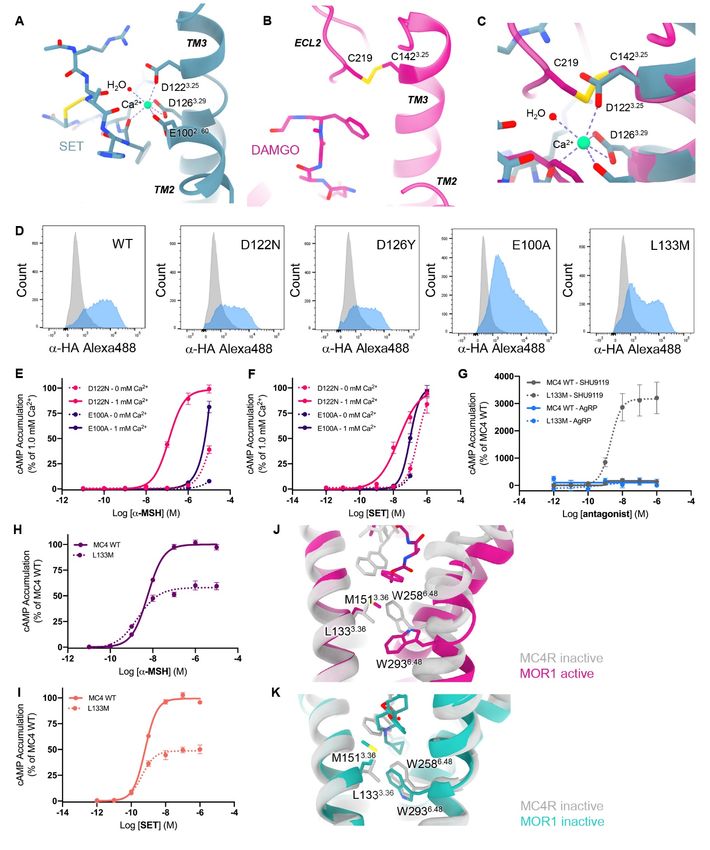
Fig. S8 Ca2+ replaces a conserved disulfide and MC4R mutations in key residues. (A-C)
D1223.25 position overlaps with a cysteine residue forming a disulfide bridge that is conserved in
class-A GPCRs. The same bridge is missing in MC4R (A). A typical class-A member, the -opioid
1 receptor (MOR1, pink, PDB 6DDE), is presented in (B). Superposition in (C) indicates that the
coordination of Ca2+ serves to replace the bridge in defining the orthosteric binding pocket for

 18
ligand agonists. Residue numbers are indicated in the figures. Agonists (DAMGO for the MOR1
and setmelanotide-SET for MC4R) are presented as sticks. (E-I) A series of mutant receptors was
designed to study the effect of residues highlighted through structural analysis. In (D) surface
expression of the WT and mutant receptors was measured by flow cytometry. HEK293 cells were
transfected with WT and mutant MC4R constructs as indicated. Cells stained with anti-HA
antibodies (blue) are compared to control cells stained only with secondary antibody (grey). The
influence of Ca2+ presence on MC4R mutants in residues involved in Ca2+ coordination is
demonstrated in (E) for α-MSH and (F) for setmelanotide. Experiments performed in the presence
or absence of 1 mM Ca2+. Each data point represents the mean ± SEM of at least three replicates
(N=3). (H-K) L1333.36 is a key modulator in class A GPCR activation, as it maintains direct
interactions with W2586.48 that plays a crucial role in TM6 displacement during receptor transition
to the active state. An L133M mutation significantly affects receptor’s reactivity to agonists and
antagonists. (G) Dose response curves for the antagonists SHU9119 and AgRP indicate elevation
in cAMP production upon SHU9119 binding to the receptor, but not AgRP. Curves are represented
as mean ± SEM from 3 independent experiments done in triplicate. These indicate that SHU9119
(but not AgRP) acts as an agonist rather than as an antagonist in the L133M mutant receptor.
Agonist activity of α-MSH (H) and setmelanotide (I) indicates reduction in Emax for both agonists
in the mutant receptor. Dose response curves for the agonists indicate elevation in cAMP
production and are represented as mean ± SEM from 3 independent experiments done in triplicate.
Reduction in receptors activity is mainly due to lower surface availability of the receptor as
indicated in (D). (J) Superposition of MC4R (grey, PDB 6W25) inactive conformation with MOR1
active (pink, PDB 6DDE) conformation indicates that M3.36 in the active state of MOR1 overlaps
with that of L1333.36 in the inactive MC4R; thus, explaining how an antagonist for MC4R could
serve as an agonist for the L133M mutant. (K) Superposition of MC4R bound to SHU9119
structure (grey, PDB 6W25) with an inactive structure of the opioid receptor (teal, PDB 4DKL)
indicates a clash between the naphthyl group and M3.36, thus further supporting the notion that
SHU9119 will more likely contribute to an agonistic activity in the mutant.

 19
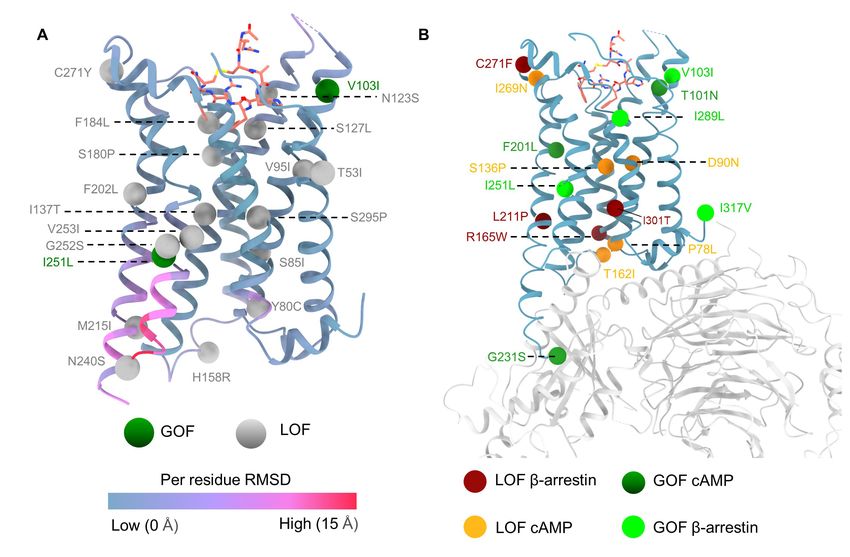
Fig. S9 Mapping of the frequent human MC4R mutations associated with receptor gain-of-
function (GoF) and loss-of-function (LoF). (A) Plotting of MC4R mutations on the active cryo-
EM structure. Mutations are adopted from Wade et al. (88). GoF mutations are represented as
green spheres, LoF mutations in grey. MC4R ribbon is colored based on the per-residue RMSD
between the active and inactive (PDB 6W25) structures, with blue regions corresponding to highly
similar conformations, red to the most diverging regions. Setmelanotide is presented as light pink
licorice. Mutations in MC4R that result in impaired receptor signaling spread across multiple
receptor regions, and are frequent around the agonist binding pocket (e.g. V103I, N123S, S127L
S180P and F184L). Some mutations are also found in regions that are of high residual mobility
upon receptor activation. These include M215I, N240S, I251L and G252S. (B) Mapping GoF and
LoF shown to induce bias to either cAMP or β-arrestin signaling pathways. MC4R is in blue, G-
proteins are in light grey. GoF mutations with bias towards cAMP production (Gs) and β-arrestin
recruitment are shown in dark and light green, respectively. LoF mutations with impaired cAMP
production and low β-arrestin recruitment are shown in orange and dark-red, respectively.
Mutations are adopted from the study of Lotta et al. (9). Examples with mechanistic implications
are S136 that stabilizes the toggle switch residue W258 by weak Van der Waals interaction. An
S136P LoF would disrupt this interaction and thus affect proper W258 positioning and an
impairment of Gs coupling. G231S that is positioned in the interface with Gs resulting in GoF by
elevating cAMP levels. Replacement of glycine to serine can increase the affinity to Gs by forming
additional contacts. T101N that is positioned in the orthosteric binding pocket and maintains
hydrophobic contacts with the HRFW motif. The T101N can increase the affinity to the agonist
due to the longer polar side chain thus elevate cAMP accumulation.

 20
Fig. S10 Schematic representation of the residues involved in MC4R-Gαs coupling. The
receptor is shown in blue, Gαs in yellow. Hydrogen bonds are shown as red dashed lines, cation-
π interaction in yellow, and hydrophobic interactions are in green. Interactions include hydrogen
bonds between H34S1.02, T329h4s6.03, Q363H5.16, R364H5.17, H366H5.19, Y370H5.23 and E371H5.24 of
Gαs and T1503.53, I1513.54, L15534.51, H2225.68, P230ICL3 and T2466.36 in MC4R. A class-A
conserved π-cation stacking between Y370H5.23 and R1473.50 is also present. Hydrophobic
interactions involve residues F355H5.08, I362H5.15, L367H5.20, Y370H5.23, L372H5.25, L373H5.26 of α5,
L325H4.16 of α4, and Y337h4s6.20 of α4-β6 loop of Gαs and residues in TM5 (M2155.61, A2195.65,
I2265.72), ICL2 (A15434.50 and L15534.51), ICL3 (L229ICL3, P230ICL3), TM3 (I1513.54) and TM6
(L2476.37) of MC4R.

 21
Table S1 Cryo-EM data collection and model refinement

Data collection and processing
Microscope Titan Krios G3i
Detector Gatan K3
Energy filter slit width [eV] 20
Magnification 105,000
Detector magnification 10,760
Voltage [kV] 300
Electron exposure [e–/Å2] 45.5
Exposure rate [e-/A2/sec] 30.6
Defocus range [μm] -0.8 – (-2.3)
Pixel size [Å] 0.86
Number of frames per movie 45
Automation software EPU
# Micrographs used 10,870
Initial particle images [no.] 5,076,884
Total # of particles used for 3D analyses 1,251,873
Final particle images [no.] 366,496
Estimated accuracy of translations [ Å] / rotations [°] 0.73/1.61
Map resolution (FSC 0.143) [Å]: masked (unmaked) 2.97 (3.39)
Map resolution (FSC 0.5) [Å]: masked (unmaked) 3.34 (3.94)
Local resolution range in [Å] (Relion) 2.87 – 4.19
Symmetry P1
Model Refinement

Refinement package Phenix

Initial model used (PDB code) 6W25
Model resolution [Å] 2.97
Map sharpening B factor [Å2] -107.631
Model composition
 Non-hydrogen atoms 8834
 Protein residues 1126 residues
 Ligands 1
B factors [Å2]
 Protein 44.39

 22
Ligand 61.95
R.M.S.D
 Bond lengths [Å] 0.006
 Bond angles [°] 1.031
Global and Local CC [CCvolume/CCmask] 0.77/0.81
C-beta deviations [%] 0.19
CaBLAM outliers [%] 2.8
EMRinger score [Sharpened/unsharpened map] 3.99/3.79
Validation
 MolProbity score 1.19
 Clashscore 1.55
 Poor rotamers [%] 0.11
Ramachandran plot
 Favored [%] 95.83
 Allowed [%] 7.25
 Disallowed [%] 0
PDB/EMDB codes 7AUE/ EMD-11927

 23
Table S2 Unmodeled residues due to low local resolution

 MC4R (Chain R)
 ECL1 S109, T110, D111, T112, D113, A114
 TM3 Q1153.18
 ICL3 T232, G233, A234, I235, R236
 TM6 Q2376.27, G2386.28, A2396.29

 GαS (Chain A)
 L56-S184, G205, Q206, R236-Q242

 ScFv16 (Chain S)
 E222, D223

 24
Table S3 Equilibration parameters for individual runs.

 BB restr. SC restr. Lipid restr. Thermostat Barostat Timestep Duration
Step (kJ/mol*nm2) (kJ/mol*nm2) (kJ/mol*nm2) (fs) (ns)

1 4000 2000 1000 Berendsen / 1 0.125

2 2000 1000 400 Berendsen / 1 0.125

3 1000 500 400 Berendsen Berendsen 1 0.125

4 500 200 200 Berendsen Berendsen 2 0.500

5 200 50 40 Berendsen Berendsen 2 5

6 50 0 0 Berendsen Berendsen 2 5

 BB=backbone, SC=sidechains, restr.=restraints

 25
Table S4 Summary of the differences among the molecular dynamics simulations performed in
this study.

 Trajectory name Setmelanotide Classical MD vs Total Ca2+ location
 presence Cryo-EM restraints length at time t=0
 MD (ns)

 MD with SET – Yes Classical 250 Solvent
 replica 1/2/3/4

 MD without SET – No Classical 250 Solvent
 replica 1/2/3/4

 Cryo-EM restraints Yes Cryo-EM restraints 10 MC4R ion
 guided MD binding site

 26
Table S5 Constructs used in the study and cloning.

Plasmid name Backbone Backbone primers (5’ 3’) Insert Insert primers (5’ 3’)

 GAGCTCGGAT
 GGAGGCTCGAGCGG CCACCATG
 FW FW
 TATGGGGGAGAAAC CCG GTGACCGGCT
CMV-SmBiT-β- ACC
 pcDNA3.1- ARRB2 pBiT2.1-N [TK/SmBiT]
arrestin 2 GGGTTTCTCC
 GTAGCCGGTCACCA T CCCATACC
 RV RV
 GGTGGATCCGAGCTC G GCTCGAGCCT
 CC
MVTGYRLFEEILGSSGGGGSGGGGSSGMGEKPGTRVFKKSSPNCKLTVYLGKRDFVDHLDKVDPVDGVVLVDPDYLKDRKVFVTLTCAFR
YGREDLDVLGLSFRKDLFIATYQAFPPVPNPPRPPTRLQDRLLRKLGQHAHPFFFTIPQNLPCSVTLQPGPEDTGKACGVDFEIRAFCAKSLE
EKSHKRNSVRLVIRKVQFAPEKPGPQPSAETTRHFLMSDRSLHLEASLDKELYYHGEPLNVNVHVTNNSTKTVKKIKVSVRQYADICLFSTAQ
YKCPVAQLEQDDQVSPSSTFCKVYTITPLLSDNREKRGLALDGKLKHEDTNLASSTIVKEGANKEVLGILVSYRVKVKLVVSRGGDVSVELPF
VLMHPKPHDHIPLPRPQSAAPETDVPVDTNLIEFDTNYATDDDIVFEDFARLRLKGMKDDDYDDQLC*

 27
References and Notes
1. World Health Organization, Obesity and overweight; www.who.int/news-room/fact-
 sheets/detail/obesity-and-overweight.
2. M. Blüher, Obesity: Global epidemiology and pathogenesis. Nat. Rev. Endocrinol. 15, 288–
 298 (2019). doi:10.1038/s41574-019-0176-8 Medline
3. K. L. J. Ellacott, R. D. Cone, The central melanocortin system and the integration of short-
 and long-term regulators of energy homeostasis. Recent Prog. Horm. Res. 59, 395–408
 (2004). doi:10.1210/rp.59.1.395 Medline
4. K. G. Mountjoy, M. T. Mortrud, M. J. Low, R. B. Simerly, R. D. Cone, Localization of the
 melanocortin-4 receptor (MC4-R) in neuroendocrine and autonomic control circuits in
 the brain. Mol. Endocrinol. 8, 1298–1308 (1994). Medline
5. J. Rossi, N. Balthasar, D. Olson, M. Scott, E. Berglund, C. E. Lee, M. J. Choi, D. Lauzon, B.
 B. Lowell, J. K. Elmquist, Melanocortin-4 receptors expressed by cholinergic neurons
 regulate energy balance and glucose homeostasis. Cell Metab. 13, 195–204 (2011).
 doi:10.1016/j.cmet.2011.01.010 Medline
6. B. P. Shah, L. Vong, D. P. Olson, S. Koda, M. J. Krashes, C. Ye, Z. Yang, P. M. Fuller, J. K.
 Elmquist, B. B. Lowell, MC4R-expressing glutamatergic neurons in the paraventricular
 hypothalamus regulate feeding and are synaptically connected to the parabrachial
 nucleus. Proc. Natl. Acad. Sci. U.S.A. 111, 13193–13198 (2014).
 doi:10.1073/pnas.1407843111 Medline
7. I. S. Farooqi, J. M. Keogh, G. S. H. Yeo, E. J. Lank, T. Cheetham, S. O’Rahilly, Clinical
 spectrum of obesity and mutations in the melanocortin 4 receptor gene. N. Engl. J. Med.
 348, 1085–1095 (2003). doi:10.1056/NEJMoa022050 Medline
8. A. S. Garfield, C. Li, J. C. Madara, B. P. Shah, E. Webber, J. S. Steger, J. N. Campbell, O.
 Gavrilova, C. E. Lee, D. P. Olson, J. K. Elmquist, B. A. Tannous, M. J. Krashes, B. B.
 Lowell, A neural basis for melanocortin-4 receptor-regulated appetite. Nat. Neurosci. 18,
 863–871 (2015). doi:10.1038/nn.4011 Medline
9. L. A. Lotta, J. Mokrosiński, E. Mendes de Oliveira, C. Li, S. J. Sharp, J. Luan, B. Brouwers,
 V. Ayinampudi, N. Bowker, N. Kerrison, V. Kaimakis, D. Hoult, I. D. Stewart, E.
 Wheeler, F. R. Day, J. R. B. Perry, C. Langenberg, N. J. Wareham, I. S. Farooqi, Human
 gain-of-function MC4R variants show signaling bias and protect against obesity. Cell
 177, 597–607.e9 (2019). doi:10.1016/j.cell.2019.03.044 Medline
10. K. K. Alharbi, E. Spanakis, K. Tan, M. J. Smith, M. A. Aldahmesh, S. D. O’Dell, A. A.
 Sayer, D. A. Lawlor, S. Ebrahim, G. Davey Smith, S. O’Rahilly, S. Farooqi, C. Cooper,
 D. I. W. Phillips, I. N. M. Day, Prevalence and functionality of paucimorphic and private
 MC4R mutations in a large, unselected European British population, scanned by
 meltMADGE. Hum. Mutat. 28, 294–302 (2007). doi:10.1002/humu.20404 Medline
11. L. H. T. Van der Ploeg, W. J. Martin, A. D. Howard, R. P. Nargund, C. P. Austin, X. Guan,
 J. Drisko, D. Cashen, I. Sebhat, A. A. Patchett, D. J. Figueroa, A. G. DiLella, B. M.
 Connolly, D. H. Weinberg, C. P. Tan, O. C. Palyha, S. S. Pong, T. MacNeil, C.
 Rosenblum, A. Vongs, R. Tang, H. Yu, A. W. Sailer, T. M. Fong, C. Huang, M. R. Tota,

 28
R. S. Chang, R. Stearns, C. Tamvakopoulos, G. Christ, D. L. Drazen, B. D. Spar, R. J.
 Nelson, D. E. MacIntyre, A role for the melanocortin 4 receptor in sexual function. Proc.
 Natl. Acad. Sci. U.S.A. 99, 11381–11386 (2002). doi:10.1073/pnas.172378699 Medline
12. M. Beltramo, M. Campanella, G. Tarozzo, S. Fredduzzi, L. Corradini, A. Forlani, R.
 Bertorelli, A. Reggiani, Gene expression profiling of melanocortin system in neuropathic
 rats supports a role in nociception. Brain Res. Mol. Brain Res. 118, 111–118 (2003).
 doi:10.1016/j.molbrainres.2003.08.001 Medline
13. B. K. Lim, K. W. Huang, B. A. Grueter, P. E. Rothwell, R. C. Malenka, Anhedonia requires
 MC4R-mediated synaptic adaptations in nucleus accumbens. Nature 487, 183–189
 (2012). doi:10.1038/nature11160 Medline
14. M. M. Ollmann, B. D. Wilson, Y. K. Yang, J. A. Kerns, Y. Chen, I. Gantz, G. S. Barsh,
 Antagonism of central melanocortin receptors in vitro and in vivo by agouti-related
 protein. Science 278, 135–138 (1997). doi:10.1126/science.278.5335.135 Medline
15. I. Suzuki, A. Tada, M. M. Ollmann, G. S. Barsh, S. Im, M. L. Lamoreux, V. J. Hearing, J. J.
 Nordlund, Z. A. Abdel-Malek, Agouti signaling protein inhibits melanogenesis and the
 response of human melanocytes to α-melanotropin. J. Invest. Dermatol. 108, 838–842
 (1997). doi:10.1111/1523-1747.ep12292572 Medline
16. J. Yu, L. E. Gimenez, C. C. Hernandez, Y. Wu, A. H. Wein, G. W. Han, K. McClary, S. R.
 Mittal, K. Burdsall, B. Stauch, L. Wu, S. N. Stevens, A. Peisley, S. Y. Williams, V.
 Chen, G. L. Millhauser, S. Zhao, R. D. Cone, R. C. Stevens, Determination of the
 melanocortin-4 receptor structure identifies Ca2+ as a cofactor for ligand binding. Science
 368, 428–433 (2020). doi:10.1126/science.aaz8995 Medline
17. P. Kühnen, K. Clément, S. Wiegand, O. Blankenstein, K. Gottesdiener, L. L. Martini, K.
 Mai, U. Blume-Peytavi, A. Grüters, H. Krude, Proopiomelanocortin deficiency treated
 with a melanocortin-4 receptor agonist. N. Engl. J. Med. 375, 240–246 (2016).
 doi:10.1056/NEJMoa1512693 Medline
18. T. H. Collet, B. Dubern, J. Mokrosinski, H. Connors, J. M. Keogh, E. Mendes de Oliveira, E.
 Henning, C. Poitou-Bernert, J. M. Oppert, P. Tounian, F. Marchelli, R. Alili, J. Le Beyec,
 D. Pépin, J. M. Lacorte, A. Gottesdiener, R. Bounds, S. Sharma, C. Folster, B.
 Henderson, S. O’Rahilly, E. Stoner, K. Gottesdiener, B. L. Panaro, R. D. Cone, K.
 Clément, I. S. Farooqi, L. H. T. Van der Ploeg, Evaluation of a melanocortin-4 receptor
 (MC4R) agonist (Setmelanotide) in MC4R deficiency. Mol. Metab. 6, 1321–1329 (2017).
 doi:10.1016/j.molmet.2017.06.015 Medline
19. K. Clément, H. Biebermann, I. S. Farooqi, L. Van der Ploeg, B. Wolters, C. Poitou, L. Puder,
 F. Fiedorek, K. Gottesdiener, G. Kleinau, N. Heyder, P. Scheerer, U. Blume-Peytavi, I.
 Jahnke, S. Sharma, J. Mokrosinski, S. Wiegand, A. Müller, K. Weiß, K. Mai, J. Spranger,
 A. Grüters, O. Blankenstein, H. Krude, P. Kühnen, MC4R agonism promotes durable
 weight loss in patients with leptin receptor deficiency. Nat. Med. 24, 551–555 (2018).
 doi:10.1038/s41591-018-0015-9 Medline
20. K. Clément, E. van den Akker, J. Argente, A. Bahm, W. K. Chung, H. Connors, K. De
 Waele, I. S. Farooqi, J. Gonneau-Lejeune, G. Gordon, K. Kohlsdorf, C. Poitou, L. Puder,
 J. Swain, M. Stewart, G. Yuan, M. Wabitsch, P. Kühnen, Setmelanotide POMC and
 LEPR Phase 3 Trial Investigators, Efficacy and safety of setmelanotide, an MC4R

 29
agonist, in individuals with severe obesity due to LEPR or POMC deficiency: Single-
 arm, open-label, multicentre, phase 3 trials. Lancet Diabetes Endocrinol. 8, 960–970
 (2020). doi:10.1016/S2213-8587(20)30364-8 Medline
21. U.S. Food and Drug Administration, “FDA approves first treatment for weight management
 for people with certain rare genetic conditions,” 27 November 2020;
 www.fda.gov/drugs/drug-safety-and-availability/fda-approves-first-treatment-weight-
 management-people-certain-rare-genetic-conditions.
22. R. Haws, S. Brady, E. Davis, K. Fletty, G. Yuan, G. Gordon, M. Stewart, J. Yanovski, Effect
 of setmelanotide, a melanocortin-4 receptor agonist, on obesity in Bardet-Biedl
 syndrome. Diabetes Obes. Metab. 22, 2133–2140 (2020). doi:10.1111/dom.14133
 Medline
23. A. Markham, Setmelanotide: First approval. Drugs 81, 397–403 (2021). doi:10.1007/s40265-
 021-01470-9 Medline
24. S. Maeda, A. Koehl, H. Matile, H. Hu, D. Hilger, G. F. X. Schertler, A. Manglik, G.
 Skiniotis, R. J. P. Dawson, B. K. Kobilka, Development of an antibody fragment that
 stabilizes GPCR/G-protein complexes. Nat. Commun. 9, 3712 (2018).
 doi:10.1038/s41467-018-06002-w Medline
25. A. Koehl, H. Hu, S. Maeda, Y. Zhang, Q. Qu, J. M. Paggi, N. R. Latorraca, D. Hilger, R.
 Dawson, H. Matile, G. F. X. Schertler, S. Granier, W. I. Weis, R. O. Dror, A. Manglik,
 G. Skiniotis, B. K. Kobilka, Structure of the µ-opioid receptor-Gi protein complex.
 Nature 558, 547–552 (2018). doi:10.1038/s41586-018-0219-7 Medline
26. K. Krishna Kumar, M. Shalev-Benami, M. J. Robertson, H. Hu, S. D. Banister, S. A.
 Hollingsworth, N. R. Latorraca, H. E. Kato, D. Hilger, S. Maeda, W. I. Weis, D. L.
 Farrens, R. O. Dror, S. V. Malhotra, B. K. Kobilka, G. Skiniotis, Structure of a signaling
 cannabinoid receptor 1-G protein complex. Cell 176, 448–458.e12 (2019).
 doi:10.1016/j.cell.2018.11.040 Medline
27. S. Maeda, Q. Qu, M. J. Robertson, G. Skiniotis, B. K. Kobilka, Structures of the M1 and M2
 muscarinic acetylcholine receptor/G-protein complexes. Science 364, 552–557 (2019).
 doi:10.1126/science.aaw5188 Medline
28. K. Kim, T. Che, O. Panova, J. F. DiBerto, J. Lyu, B. E. Krumm, D. Wacker, M. J. Robertson,
 A. B. Seven, D. E. Nichols, B. K. Shoichet, G. Skiniotis, B. L. Roth, Structure of a
 hallucinogen-activated Gq-coupled 5-HT2A serotonin receptor. Cell 182, 1574–1588.e19
 (2020). doi:10.1016/j.cell.2020.08.024 Medline
29. J. Yin, K. M. Chen, M. J. Clark, M. Hijazi, P. Kumari, X. C. Bai, R. K. Sunahara, P. Barth,
 D. M. Rosenbaum, Structure of a D2 dopamine receptor–G-protein complex in a lipid
 membrane. Nature 584, 125–129 (2020). doi:10.1038/s41586-020-2379-5 Medline
30. B. Holst, T. W. Schwartz, Molecular mechanism of agonism and inverse agonism in the
 melanocortin receptors: Zn2+ as a structural and functional probe. Ann. N. Y. Acad. Sci.
 994, 1–11 (2003). doi:10.1111/j.1749-6632.2003.tb03156.x Medline
31. A. J. Venkatakrishnan, X. Deupi, G. Lebon, C. G. Tate, G. F. Schertler, M. M. Babu,
 Molecular signatures of G-protein-coupled receptors. Nature 494, 185–194 (2013).
 doi:10.1038/nature11896 Medline

 30
32. J. P. L. Gonçalves, D. Palmer, M. Meldal, MC4R agonists: Structural overview on
 antiobesity therapeutics. Trends Pharmacol. Sci. 39, 402–423 (2018).
 doi:10.1016/j.tips.2018.01.004 Medline
33. L. Jiang, L. Lai, CH···O hydrogen bonds at protein-protein interfaces. J. Biol. Chem. 277,
 37732–37740 (2002). doi:10.1074/jbc.M204514200 Medline
34. R. Link, S. Veiksina, M. J. Tahk, T. Laasfeld, P. Paiste, S. Kopanchuk, A. Rinken, The
 constitutive activity of melanocortin-4 receptors in cAMP pathway is allosterically
 modulated by zinc and copper ions. J. Neurochem. 153, 346–361 (2020).
 doi:10.1111/jnc.14933 Medline
35. F. Stutzmann, K. Tan, V. Vatin, C. Dina, B. Jouret, J. Tichet, B. Balkau, N. Potoczna, F.
 Horber, S. O’Rahilly, I. S. Farooqi, P. Froguel, D. Meyre, Prevalence of melanocortin-4
 receptor deficiency in Europeans and their age-dependent penetrance in multigenerational
 pedigrees. Diabetes 57, 2511–2518 (2008). doi:10.2337/db08-0153 Medline
36. Z. Q. Wang, Y. X. Tao, Functional studies on twenty novel naturally occurring melanocortin-
 4 receptor mutations. Biochim. Biophys. Acta 1812, 1190–1199 (2011).
 doi:10.1016/j.bbadis.2011.06.008 Medline
37. B. A. Fleck, C. Chen, W. Yang, R. Huntley, S. Markison, S. A. Nickolls, A. C. Foster, S. R.
 J. Hoare, Molecular interactions of nonpeptide agonists and antagonists with the
 melanocortin-4 receptor. Biochemistry 44, 14494–14508 (2005). doi:10.1021/bi051316s
 Medline
38. Y. K. Yang, T. M. Fong, C. J. Dickinson, C. Mao, J. Y. Li, M. R. Tota, R. Mosley, L. H. T.
 Van Der Ploeg, I. Gantz, Molecular determinants of ligand binding to the human
 melanocortin-4 receptor. Biochemistry 39, 14900–14911 (2000). doi:10.1021/bi001684q
 Medline
39. S. D. McAllister, D. P. Hurst, J. Barnett-Norris, D. Lynch, P. H. Reggio, M. E. Abood,
 Structural mimicry in class A G protein-coupled receptor rotamer toggle switches: The
 importance of the F3.36(201)/W6.48(357) interaction in cannabinoid CB1 receptor
 activation. J. Biol. Chem. 279, 48024–48037 (2004). doi:10.1074/jbc.M406648200
 Medline
40. X. Li, T. Hua, K. Vemuri, J. H. Ho, Y. Wu, L. Wu, P. Popov, O. Benchama, N. Zvonok, K.
 Locke, L. Qu, G. W. Han, M. R. Iyer, R. Cinar, N. J. Coffey, J. Wang, M. Wu, V.
 Katritch, S. Zhao, G. Kunos, L. M. Bohn, A. Makriyannis, R. C. Stevens, Z. J. Liu,
 Crystal structure of the human cannabinoid receptor CB2. Cell 176, 459–467.e13 (2019).
 doi:10.1016/j.cell.2018.12.011 Medline
41. Q. Tan, Y. Zhu, J. Li, Z. Chen, G. W. Han, I. Kufareva, T. Li, L. Ma, G. Fenalti, J. Li, W.
 Zhang, X. Xie, H. Yang, H. Jiang, V. Cherezov, H. Liu, R. C. Stevens, Q. Zhao, B. Wu,
 Structure of the CCR5 chemokine receptor-HIV entry inhibitor maraviroc complex.
 Science 341, 1387–1390 (2013). doi:10.1126/science.1241475 Medline
42. E. I. Minder, J. Barman-Aksoezen, X. Schneider-Yin, Pharmacokinetics and
 pharmacodynamics of afamelanotide and its clinical use in treating dermatologic
 disorders. Clin. Pharmacokinet. 56, 815–823 (2017). doi:10.1007/s40262-016-0501-5
 Medline

 31
43. Y. Yang, M. Chen, Y. Lai, I. Gantz, K. E. Georgeson, C. M. Harmon, Molecular
 determinants of human melanocortin-4 receptor responsible for antagonist SHU9119
 selective activity. J. Biol. Chem. 277, 20328–20335 (2002).
 doi:10.1074/jbc.M201343200 Medline
44. Y. Minokoshi, T. Alquier, N. Furukawa, Y. B. Kim, A. Lee, B. Xue, J. Mu, F. Foufelle, P.
 Ferré, M. J. Birnbaum, B. J. Stuck, B. B. Kahn, AMP-kinase regulates food intake by
 responding to hormonal and nutrient signals in the hypothalamus. Nature 428, 569–574
 (2004). doi:10.1038/nature02440 Medline
45. K. G. Mountjoy, L. S. Robbins, M. T. Mortrud, R. D. Cone, The cloning of a family of genes
 that encode the melanocortin receptors. Science 257, 1248–1251 (1992).
 doi:10.1126/science.1325670 Medline
46. I. Gantz, H. Miwa, Y. Konda, Y. Shimoto, T. Tashiro, S. J. Watson, J. DelValle, T. Yamada,
 Molecular cloning, expression, and gene localization of a fourth melanocortin receptor. J.
 Biol. Chem. 268, 15174–15179 (1993). doi:10.1016/S0021-9258(18)82452-8 Medline
47. C. Avet, A. Mancini, B. Breton, C. Le Gouill, A. Hauser, C. Normand, H. Kobayashi, F.
 Gross, M. Hogue, V. Lukasheva, S. Morissette, E. Fauman, J.-P. Fortin, S. Schann, X.
 Leroy, D. E. Gloriam, M. Bouvier, Selectivity landscape of 100 therapeutically relevant
 GPCR profiled by an effector translocation-based BRET platform. SSRN 3586569
 [Preprint]. 15 May 2020; https://doi.org/10.2139/ssrn.3586569.
48. A. Inoue, F. Raimondi, F. M. N. Kadji, G. Singh, T. Kishi, A. Uwamizu, Y. Ono, Y. Shinjo,
 S. Ishida, N. Arang, K. Kawakami, J. S. Gutkind, J. Aoki, R. B. Russell, Illuminating G-
 protein-coupling selectivity of GPCRs. Cell 177, 1933–1947.e25 (2019).
 doi:10.1016/j.cell.2019.04.044 Medline
49. M. Ghamari-Langroudi, G. J. Digby, J. A. Sebag, G. L. Millhauser, R. Palomino, R.
 Matthews, T. Gillyard, B. L. Panaro, I. R. Tough, H. M. Cox, J. S. Denton, R. D. Cone,
 G-protein-independent coupling of MC4R to Kir7.1 in hypothalamic neurons. Nature
 520, 94–98 (2015). doi:10.1038/nature14051 Medline
50. J. Ballesteros, S. Kitanovic, F. Guarnieri, P. Davies, B. J. Fromme, K. Konvicka, L. Chi, R.
 P. Millar, J. S. Davidson, H. Weinstein, S. C. Sealfon, Functional microdomains in G-
 protein-coupled receptors. The conserved arginine-cage motif in the gonadotropin-
 releasing hormone receptor. J. Biol. Chem. 273, 10445–10453 (1998).
 doi:10.1074/jbc.273.17.10445 Medline
51. B. Carpenter, R. Nehmé, T. Warne, A. G. W. Leslie, C. G. Tate, Structure of the adenosine
 A2A receptor bound to an engineered G protein. Nature 536, 104–107 (2016).
 doi:10.1038/nature18966 Medline
52. X. Lin, M. Li, N. Wang, Y. Wu, Z. Luo, S. Guo, G. W. Han, S. Li, Y. Yue, X. Wei, X. Xie,
 Y. Chen, S. Zhao, J. Wu, M. Lei, F. Xu, Structural basis of ligand recognition and self-
 activation of orphan GPR52. Nature 579, 152–157 (2020). doi:10.1038/s41586-020-
 2019-0 Medline
53. G. E. Rovati, V. Capra, R. R. Neubig, The highly conserved DRY motif of class A G protein-
 coupled receptors: Beyond the ground state. Mol. Pharmacol. 71, 959–964 (2007).
 doi:10.1124/mol.106.029470 Medline

 32
You can also read


