UC Santa Barbara UC Santa Barbara Previously Published Works
←
→
Page content transcription
If your browser does not render page correctly, please read the page content below
UC Santa Barbara
UC Santa Barbara Previously Published Works

Title
Serotonergic Axons as Fractional Brownian Motion Paths: Insights Into the Self-
Organization of Regional Densities.

Permalink
https://escholarship.org/uc/item/0xg12733

Authors
Janušonis, Skirmantas
Detering, Nils
Metzler, Ralf
et al.

Publication Date
2020

DOI
10.3389/fncom.2020.00056

Peer reviewed

 eScholarship.org                               Powered by the California Digital Library
                                                                University of California
ORIGINAL RESEARCH
                                                                                                                                                published: 24 June 2020
                                                                                                                                        doi: 10.3389/fncom.2020.00056

                                            Serotonergic Axons as Fractional
                                            Brownian Motion Paths: Insights Into
                                            the Self-Organization of Regional
                                            Densities
                                            Skirmantas Janušonis 1*, Nils Detering 2 , Ralf Metzler 3 and Thomas Vojta 4
                                            1
                                              Department of Psychological and Brain Sciences, University of California, Santa Barbara, Santa Barbara, CA, United States,
                                            2
                                              Department of Statistics and Applied Probability, University of California, Santa Barbara, Santa Barbara, CA, United States,
                                            3
                                              Institute of Physics and Astronomy, University of Potsdam, Potsdam, Germany, 4 Department of Physics, Missouri University
                                            of Science and Technology, Rolla, MO, United States

                                            All vertebrate brains contain a dense matrix of thin fibers that release serotonin
                                            (5-hydroxytryptamine), a neurotransmitter that modulates a wide range of neural,
                                            glial, and vascular processes. Perturbations in the density of this matrix have been
                                            associated with a number of mental disorders, including autism and depression, but
                                            its self-organization and plasticity remain poorly understood. We introduce a model
                                            based on reflected Fractional Brownian Motion (FBM), a rigorously defined stochastic
                                            process, and show that it recapitulates some key features of regional serotonergic fiber
                                            densities. Specifically, we use supercomputing simulations to model fibers as FBM-paths
                                            in two-dimensional brain-like domains and demonstrate that the resultant steady state
                                            distributions approximate the fiber distributions in physical brain sections immunostained
                           Edited by:       for the serotonin transporter (a marker for serotonergic axons in the adult brain). We
                   Thomas Nowotny,          suggest that this framework can support predictive descriptions and manipulations of
University of Sussex, United Kingdom
                                            the serotonergic matrix and that it can be further extended to incorporate the detailed
                       Reviewed by:
                 Massimo Pasqualetti,
                                            physical properties of the fibers and their environment.
                University of Pisa, Italy
                                            Keywords: brain, 5-hydroxytryptamine, serotonin, fibers, density, stochastic process, anomalous diffusion,
                          Lianchun Yu,
                                            fractional Brownian motion
             Lanzhou University, China

                   *Correspondence:
                 Skirmantas Janušonis       INTRODUCTION
                  janusonis@ucsb.edu
                                            All cells in vertebrate brains are surrounded by a matrix of highly tortuous fibers that release
       Received: 27 December 2019           serotonin (5-hydroxytryptamine, 5-HT), a major neurotransmitter. Presently the self-organization
           Accepted: 19 May 2020            and dynamics of this matrix are not understood beyond neuroanatomical descriptions. Altered
          Published: 24 June 2020
                                            densities of serotonergic (serotonin-releasing) fibers have been associated with many mental
                              Citation:     disorders and conditions, including Autism Spectrum Disorder (Azmitia et al., 2011), Major
    Janušonis S, Detering N, Metzler R      Depressive Disorder (Numasawa et al., 2017), epilepsy (Maia et al., 2019), and exposure
and Vojta T (2020) Serotonergic Axons
                                            to 3,4-methylenedioxymethamphetamine (MDMA, Ecstasy) (Adori et al., 2011). Predictive
 as Fractional Brownian Motion Paths:
  Insights Into the Self-Organization of
                                            computational models can significantly advance this research and support its biomedical
                    Regional Densities.     applications. Motivated by this potential, we used a stochastic process framework to develop a
      Front. Comput. Neurosci. 14:56.       model of serotonergic fibers and reproduced some key features of their density distribution in the
      doi: 10.3389/fncom.2020.00056         mouse brain.

Frontiers in Computational Neuroscience | www.frontiersin.org                      1                                                   June 2020 | Volume 14 | Article 56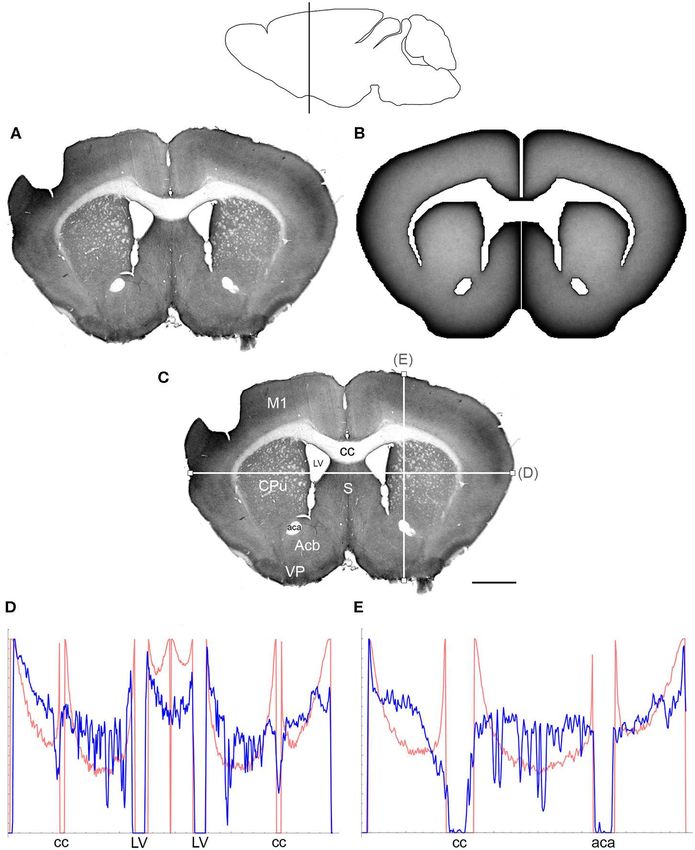
Janušonis et al.                                                                                         Serotonergic Fibers as Stochastic Process Paths

    Serotonergic fibers are axons of neurons whose bodies are                in some of them and producing profuse arborizations in others.
located in several brainstem clusters known as the raphe nuclei              However, true branching points are difficult to distinguish from
(Stuesse et al., 1991; Jacobs and Azmitia, 1992; Hornung, 2003).             highly tortuous fiber segments that simply pass each other,
In mammals, these neurons mature early in development. They                  especially in bright field microscopy (used in this study). A
begin synthesizing serotonin around embryonic day 11–13 in the               branching point can be unambiguously demonstrated only by
mouse and rat brains (Lidov and Molliver, 1982; Hendricks et al.,            examining an individual fiber at high resolution in all three-
1999; Hawthorne et al., 2010) and around 5 weeks of gestation in             dimensions, within the physical section (Pratelli et al., 2017).
the human brain (Sundstrom et al., 1993; Mai and Ashwell, 2004).             Even when a confocal system with high-power objectives is
In the adult mammalian brain, serotonergic axons are unusual                 used, a branching point can be difficult to distinguish from
in their ability to regenerate, with potential implications for the          fibers crossing each other at sub-micrometer distances (Janušonis
efforts to restore other axon systems after injury (Hawthorne                and Detering, 2019; Janušonis et al., 2019). The extent of
et al., 2011; Jin et al., 2016; Kajstura et al., 2018). A recent study       local sprouting in regeneration also remains an open problem
has shown that they may share this property with other axons in              (Hawthorne et al., 2010; Jin et al., 2016), but current evidence
the ascending reticular activating system (Dougherty et al., 2019).          suggests that it may not be significant (Jin et al., 2016). The
    Recent studies have revealed great diversity of serotonergic             rapidly developing methods of super-resolution microscopy and
neurons (Okaty et al., 2015, 2019), the functional significance              tissue expansion are well-positioned to provide definitive answers
of which is an active area of research (Ren et al., 2018).                   to some of these questions (Janušonis et al., 2019; Wassie et al.,
Paradoxically, transgenic mouse models with no serotonin                     2019).
synthesis in the brain during development have no gross                          If serotonergic fiber densities are determined by local
neuroanatomical abnormalities and show only mild behavioral                  arborization, it is unclear how fibers can be restricted to specific
deficits (Mosienko et al., 2015; Pratelli and Pasqualetti, 2019).            “terminal” regions, such as cerebral cortical layers (Linley et al.,
Serotonergic neurons can release other major neurotransmitters,              2013). Because of their high degree of tortuosity, they are likely
such as glutamate (Okaty et al., 2019) and perhaps GABA (Stamp               to cross over to adjacent areas, suggesting a subtle balance
and Semba, 1995; Okaty et al., 2019). In the raphe nuclei,                   between region-specific branching and a diffusion-like process.
serotonergic neurons coexist with many other neurons (Cardozo                Furthermore, the concept of “terminal region” is ambiguous for
Pinto et al., 2019; Schneeberger et al., 2019), some of which may            the serotonergic axons that typically do not form conventional
participate in stereotypic synaptic arrangements (Soiza-Reilly               synapses and can release serotonin at virtually any segment of
et al., 2013).                                                               their trajectory, based on in vivo and in vitro observations of
    The development of serotonergic fibers is currently                      axon varicosities (Benzekhroufa et al., 2009; Gagnon and Parent,
conceptualized to proceed in two or three stages: the initial                2014; Quentin et al., 2018). Serotonergic neurons also can release
growth in well-defined fiber tracts, followed by extensive                   serotonin from the soma, dendrites, and growth cones, effectively
arborization and eventual dispersal in “terminal” fields (Lidov              making their entire membrane surface active (Ivgy-May et al.,
and Molliver, 1982; Carrera et al., 2008; Kiyasova and Gaspar,               1994; Quentin et al., 2018). It should be noted that serotonergic
2011; Jin et al., 2016; Maddaloni et al., 2017; Donovan et al.,              axons may also form conventional synapses (Papadopoulos et al.,
2019). This orderly sequence is generally consistent with                    1987), but the extent of this “wiring” transmission (Agnati and
experimental observations at the level of local fiber populations,           Fuxe, 2014) is currently unknown and continues to be debated.
visualized with tract-tracing techniques or quantified with                      In this study, we model individual serotonergic fibers as paths
density measures. It is also theoretically appealing in that it              of a stochastic process that reflects their physical properties and
mirrors the development of brain projections that connect two                show that regional arborization or other local control is not
well-defined brain regions (e.g., the lateral geniculate nucleus             necessary to arrive at a good approximation of the observed
and the primary visual cortex).                                              fiber densities. Instead, these densities may strongly depend
    There is little doubt that the initial serotonergic projections          on the geometry of the brain. Our novel approach may offer
form well-defined paths, which we have studied in our own                    insights into the self-organization of serotonergic densities in
research (Janušonis et al., 2004; Slaten et al., 2010). These                development and may also explain their stability in adulthood,
paths are well-described because they are followed by axon                   without assuming the permanence of individual fiber trajectories.
bundles, thus facilitating their visualization in time and space.            Consistent with this hypothesis, a recent study has shown that
In contrast, the processes that lead to the formation of regional            in the adult mouse brain regenerating serotonergic fibers do not
fiber densities remain poorly understood. Fundamentally, they                follow the pathways left by degenerated fibers but can still restore
require a rigorous description of the behavior of single fibers,             the layer-specific densities after cortical injury (Jin et al., 2016).
each one of which has a unique, meandering trajectory. Since                     We focus on Fractional Brownian Motion (FBM), a process
these processes are the main focus of the present study, we note             first described under this name by Mandelbrot and Van
several important challenges.                                                Ness in 1968 (Mandelbrot and Van Ness, 1968). FBM and
    The first detailed morphological description of single                   related stochastic processes have emerged as flexible and
serotonergic axons has become available only recently (Gagnon                theoretically rich models in a variety of physical and biological
and Parent, 2014). This study has reconstructed a small set of               systems. In particular, they have been used to understand the
axons originating in the dorsal raphe nucleus and has concluded              behavior of filamentous objects, such as biopolymer chains and
that they travel through multiple brain regions, rarely branching            chromosomes (Polovnikov et al., 2018, 2019).

Frontiers in Computational Neuroscience | www.frontiersin.org            2                                            June 2020 | Volume 14 | Article 56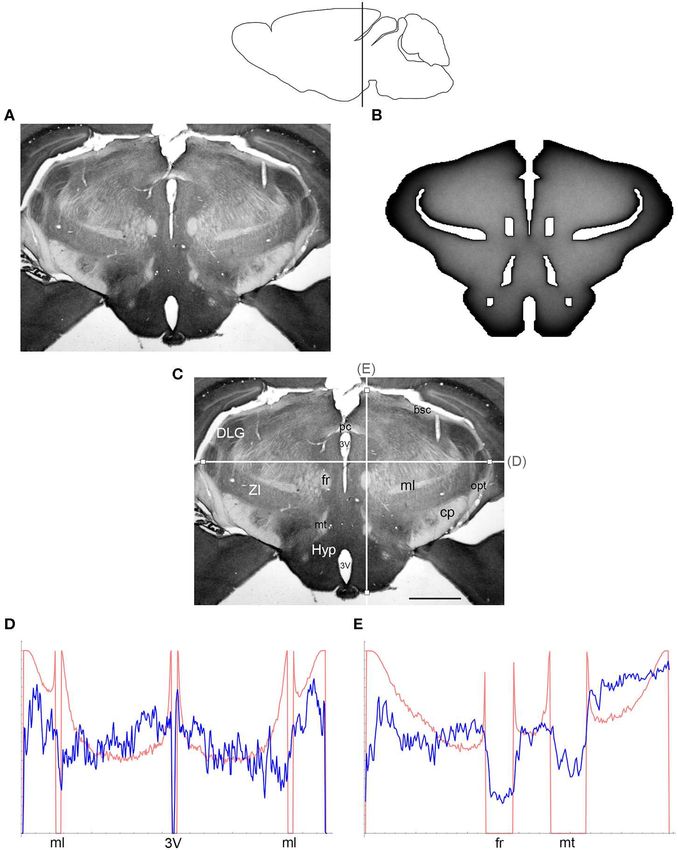
Janušonis et al.                                                                                       Serotonergic Fibers as Stochastic Process Paths

    The application of Brownian random walks to polymer chains             estimation of H does not depend on the discretization grid of
dates back to the seminal works of Paul Flory, a founder of                experimental observations. Since time-dependent information is
modern polymer physics and the winner of the 1974 Nobel Prize              difficult to obtain in growing fibers [e.g., with time-lapse imaging
in Chemistry (Flory, 1986). In this theoretical approach, a fully          in live animals Jin et al., 2016], this property ensures robustness.
flexible polymer in a poor solvent can be represented by a discrete        Fourth, its increments are normally distributed. Assuming that
random walk, in which each step corresponds to a monomer.                  randomness in the fiber trajectory arises from collision-like
However, these models are insufficient to reproduce polymer                events in its microenvironment and that each of these events has
behavior in good solvents. Self-avoiding walks (SAWs) on lattices          a small effect on the trajectory, the total effect of these collisions
may be useful in these systems, but they are difficult to treat            inevitably leads to a normal distribution (by the Central Limit
analytically and in computer simulations. FBM offers a more                Theorem). Importantly, FBM is the only stochastic process with
powerful theoretical solution, in which the fractal dimension              all of these properties (assuming mean-zero increments).
of the path (the polymer chain in space) can be reproduced                     Although FBM was introduced over a half-century ago, it
by a scaling exponent that controls the decay of the long-                 poses major challenges in theoretical analyses. This is due
range correlation of the FBM steps (Chakravarty and Sebastian,             to the fact that FBM is neither a Markovian process nor a
1997; Qian et al., 1998). This fractal dimension is a measure              semimartingale (in contrast to BM). A particularly important
of how often the chain intersects itself (Hu and Nualart, 2005;            problem for biological sciences is the behavior of FBM in
Polovnikov et al., 2019). The same mathematical framework also             bounded domains (e.g., in two- or three-dimensional shapes).
allows modeling active motion, for instance, in living biological          Reflected BM is well-understood (Ito and McKean, 1965),
cells (Reverey et al., 2015). In the polymer language, these               but it is not until very recently that the first description
trajectories correspond to long chains that can show persistence           of the properties of reflected FBM (rFBM) have become
in their spatial direction.                                                available, in one-dimensional domains (Wada and Vojta, 2018;
    Theoretically, FBM extends the normal Brownian motion                  Guggenberger et al., 2019; Wada et al., 2019). The present
(BM), which for over a century has served as a standard                    study is the first application of this theoretical framework to
model to describe simple diffusion and other similar processes             serotonergic fiber distributions, on the whole-brain scale. We
(e.g., simple polymer dynamics and stock markets). While BM                determine the steady state distributions of superdiffusive rFBM in
assumes independence between non-overlapping increments,                   constrained brain-like domains and show that they approximate
FBM expands this model by allowing non-zero correlations. The              neuroanatomical observations.
sign and strength of the increment correlation is determined by
the Hurst index (H), which defines two fundamentally different
FBM regimes. If 0 < H < ½, two neighboring increments                      MATERIALS AND METHODS
are negatively correlated, which produces highly jittery, “anti-
persistent” trajectories (also known as “rough paths”). If ½ <             Immunohistochemistry and Imaging
H < 1, two neighboring increments are positively correlated,               Two adult male mice (C57BL/6J, 8 months of age, The Jackson
which produces “persistent” trajectories that tend to maintain             Laboratory) were deeply anesthetized with a mixture of ketamine
their current direction. In precise terms, the correlation between         (200 mg/kg) and xylazine (20 mg/kg) and perfused transcardially
two neighboring increments is given by 22H−1 − 1 and the                   with saline, followed by 4% paraformaldehyde. Their brains
mean-square displacement follows the power law x2 ∼ n2H ,                  were dissected, postfixed in 4% paraformaldehyde overnight
where n is the number of performed steps. In this framework,               at 4◦ C, cryoprotected in 30% sucrose overnight at 4◦ C, and
BM becomes a special case of FBM, represented by H = ½.                    sectioned coronally at 40 µm thickness on a freezing microtome.
According to the scaling of the mean-square displacement, which            The sections were rinsed in 0.1 M phosphate-buffered saline
can be (in the number or steps) sublinear (for 0 < H < ½)                  (PBS, pH 7.2), incubated in 0.3% H2 O2 in PBS for 20 min
or superlinear (for ½ < H < 1), FBM can be classified as                   to suppress endogenous peroxidase activity, rinsed in PBS (3
subdiffusion or superdiffusion, respectively. Since the trajectories       times, 5 min each), blocked in 5% normal donkey serum (NDS)
of serotonergic fibers are considerably less jittery than BM and           and 0.3% Triton X-100 (TX), and incubated in rabbit anti-
have the tendency to maintain their current direction, one can             serotonin transporter (SERT) IgG (1:5000; ImmunoStar, #24330)
expect to capture their behavior with superdiffusive FBM. In               with 5% NDS and 0.3% TX in PBS for 2.5 days at 4◦ C on a
the polymer language, H < ½ would increase the tendency                    shaker. The sections were rinsed in PBS (3 times, 10 min each),
to create coiled configurations, whereas H > ½ would lead to               incubated in biotinylated donkey anti-rabbit IgG (1:1000; Jackson
more stretched configurations. The ballistic limit H = 1 would             ImmunoResearch, #711-065-152) with 2% NDS and 0.3% TX
correspond to a fully stretched chain.                                     in PBS, rinsed in PBS (3 times, 10 min each), incubated in the
    In addition, FBM has four convenient properties that make it           avidin-biotin-peroxidase complex (1:100; Vector Laboratories,
a natural choice in this context. First, it is a continuous process,       #PK-6100), rinsed in PBS (3 times, 10 min each), developed with
which is consistent with the time-continuity of axon growth.               3,3’-diaminobenzidine and H2 O2 using nickel intensification for
Second, it has stationary increments, which informally means               5 min (Vector Laboratories, #SK-4100), rinsed in PBS (3 times,
that its statistical properties do not change as the process evolves       5 min each), mounted onto gelatin/chromium-subbed slides,
(this assumption is reasonable from the biological perspective).           allowed to air-dry, and coverslipped with Permount. They were
Third, it is a self-similar process, which ensures that the                imaged on the Zeiss Axio Imager Z1 system with the following

Frontiers in Computational Neuroscience | www.frontiersin.org          3                                            June 2020 | Volume 14 | Article 56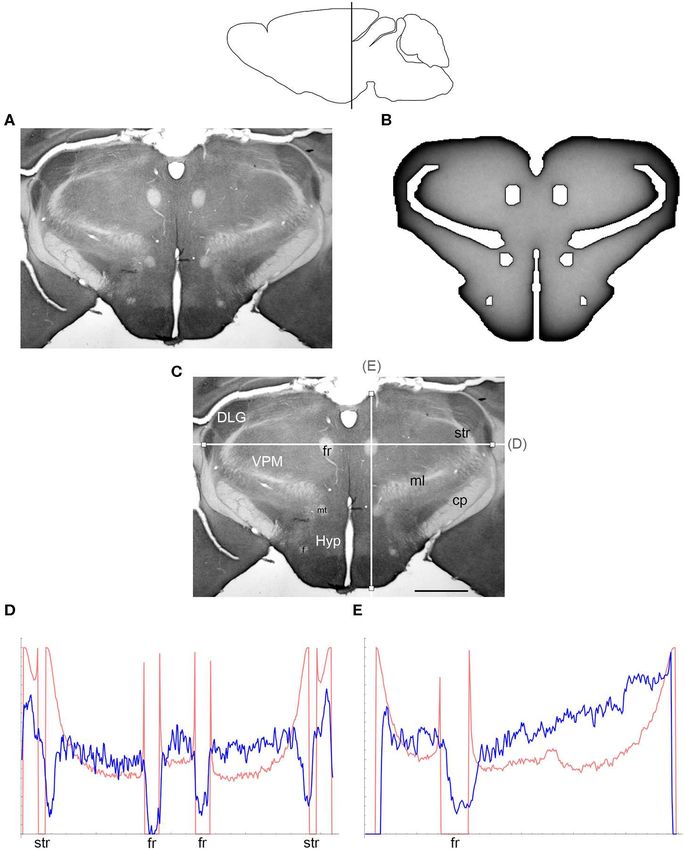
Janušonis et al.                                                                                       Serotonergic Fibers as Stochastic Process Paths

objectives: 1 × (NA = 0.025; used for whole sections), 10 ×                 between the steps (but the x and y motion are independent
(NA = 0.45), 20 × (NA = 0.80), and 40 × (NA = 1.30, oil).                   of each other). The corresponding covariance function is given
                                                                                                                        1   2          2H
All procedures have been approved by the UCSB Institutional                 by ξx,m ξx,n+m = ξy,m ξy,n+m =              2 σ [|n + 1|      −
Animal Care and Use Committee.                                                    2H          2H
                                                                            2 |n| + |n − 1| ], where H is the Hurst index. The Fourier-
                                                                            filtering method (Makse et al., 1996) was employed to generate
Preparation of 2D-Shapes                                                    these long-range correlated random numbers on the computer
The outer border, ventricular spaces, and major white matter                (Wada and Vojta, 2018).
tracts of imaged sections were hand-traced in Adobe Illustrator                 If the random walker encounters a boundary (i.e., an
CC by an expert trained in neuroanatomy. To reduce the number               outer or inner contour), it is reflected. This reflection can be
of contours, major tracts at the edge of the section were left out of       implemented in several different ways, including a repulsive
the border contour. The contours were imported into Wolfram                 potential force or a simple reflection condition that either
Mathematica 12. The outer border contour was split along the                prevents the trajectory from entering the forbidden region or
median (sagittal) symmetry line. The right side of the contour was          mirrors it at the reflecting wall. Extensive test calculations
smoothed with a moving average and reflected on the left side.              (Vojta et al., 2020) have demonstrated that the choice of the
The same procedure was used for internal contours symmetric                 reflection condition does not affect the resulting probability
with respect to the median line (e.g., the cerebral aqueduct).              density for rFBM outside a narrow region (just a few
Inner contours away from the median line (e.g., the fornix) were            steps wide) at the boundary. The following simulations thus
smoothed on the right side with a moving average and reflected              employed the condition that a step that would lead the
on the left side. Therefore, the final digitized contours (rational-        random walker into the forbidden region was simply not
valued arrays of X- and Y-coordinates) were perfectly bilaterally           carried out.
symmetric, compensating for minor sectioning plane deviations
and real (minor) brain asymmetries.                                         Reflected FBM-Paths in Brain-Like Shapes
    The obtained contours were next reformatted for FBM                     The goal of the FBM simulations in brain-like shapes was
simulations. They were transformed into N × 2 matrices,                     to model the two-dimensional distributions of serotonergic
the rows of which represented consecutive, integer-valued Y-                fiber densities at different rostro-caudal levels. The brain is a
coordinates and the two columns of which represented the                    three-dimensional structure, but two-dimensional simulations
leftmost and rightmost X-coordinates of the contour (also                   are sufficient to approximate the densities, provided that the
integer-valued). To arrive at this format, the original contour             brain geometry does not change too rapidly in the direction
coordinates were divided by an integer factor that after rounding           perpendicular to the selected section. Serotonergic fibers do not
produced at least four X-values for each consecutive Y-value,               form fascicles and show no preferred orientation (i.e., they are
and the minimal and maximal X-values were chosen. Since                     spatially isotropic) in terminal fields (Janušonis et al., 2019). As
this procedure effectively reduced the size of the contour,                 the three spatial coordinates in FBM are independent of each
it was enlarged back to its original size by multiplying the                other, this implies that the motion perpendicular to the selected
integer coordinates by the same factor and filling in the new,              section can be neglected [for further information, see Vojta et al.
empty rows with X-values obtained by linear interpolation                   (2020)].
between the nearest available X-coordinates. Because this format               Most simulations were performed with H = 0.8, but values
cannot encode concavities oriented along the Y-axis (e.g., the              between H = 0.3 and 0.9 were also studied for comparison.
third ventricle), such concavities were stored as separate inner            Each dataset consisted of 960 individual fibers (FBM trajectories)
contours. In the study, all such concavities were centered on the           starting from random positions inside the shape. Each trajectory
median line, which allowed their easy capture with the maximal              had 222 ≈ 4 million steps of size (standard deviation) σ =
X-value left to the line and the minimal X-value right to the line.         1.29 µm. Sample trajectories are shown in Figure 1. The local
For the purpose of this study, all inner contours were treated              density (ds ) was determined by counting the total number of
as impenetrable obstacles, irrespective of their physical nature            random walk segments inside each cell (of linear size 12.9 µm)
(ventricular spaces, outer border concavities, white matter tracts).        of a square grid covering the shape. The trajectories were
    The computer simulations described in detail below were                 sufficiently long for the relative densities to reach a steady
performed on the Frontera supercomputing system (NSF, Texas                 state (i.e., they did not change if the trajectory lengths were
Advanced Computing Center).                                                 increased further).
                                                                               For comparison between the simulated fiber densities and the
Discrete Reflected FBM                                                      densities observed in the actual (immunostained) sections, the
In the simulations, each individual serotonergic fiber was                  simulated densities were scaled to “optical densities” by the (Beer-
represented as the trajectory of a discrete two-dimensional FBM             Lambert law-like) transformation do = 1 − exp(−kds ), where
(Qian, 2003). Consider a random walker starting at position                 the attenuation parameter k was chosen such that the mean pixel
r0 and moving according to the recursion relation rn+1 =                    value in the simulated section matched the mean pixel value in
rn + ξn , where ξn is a two-component fractional Gaussian                   the image of the immunostained section. This transformation
noise. This means that the x and y components of ξn are                     removed the dependence on the arbitrarily chosen number and
Gaussian random numbers with zero average and variance                      length of the FBM trajectories, and it also realistically constrained
σ 2 , and that each component features long-range correlations              density values to a finite interval.

Frontiers in Computational Neuroscience | www.frontiersin.org           4                                           June 2020 | Volume 14 | Article 56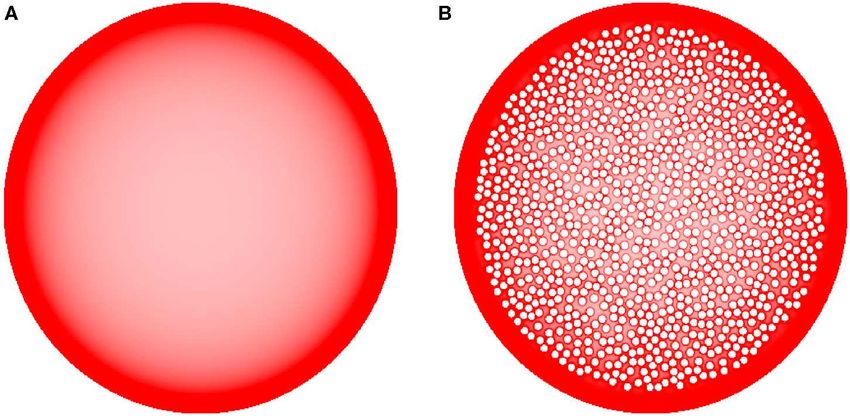
Janušonis et al.                                                                                                      Serotonergic Fibers as Stochastic Process Paths

 FIGURE 1 | (A) Serotonergic fibers visualized with SERT-immunohistochemistry at high resolution (40 ×, NA = 1.3 oil) in the mouse primary somatosensory cortex
 (S1). The image represents five focal levels (in a 40 µm-thick coronal section) that have been digitally merged. Scale bar = 20 µm. (B) Simulated FBM sample paths
 (H = 0.8).

Reflected FMB-Paths in a Ring With a Varying                                          deviation) σ = 0.4. In the subdiffusive case (H = 0.3), it was
Curvature                                                                             necessary to increase the step size to 1 to ensure that the
The boundary curvature may strongly affect the accumulation of                        simulations reached the stationary regime. As before, the local
fibers, which has direct implications for brain neuroanatomy. For                     fiber density (ds ) was determined by counting the total number
example, in the coronal plane the curvature of the cerebral cortex                    of random walk segments inside each cell (of linear size 1) of a
can be high near the sagittal plane, as the outer border turns                        square grid covering the shape.
toward the corpus callosum, and low in the lateral convexities.
The cortical gyri and sulci of the human brain create additional                      Simulation of Reflected FBM-Paths in a 2D-Disk With
variability of local curvature, which can further modulate the                        Crowding
accumulation of serotonergic fibers. Therefore, a qualitative                         The brain tissue is a highly crowded space, but little quantitative
relationship between boundary curvatures and fiber densities                          information is available about the extent and geometry of the
can allow theoretical predictions in neuroanatomy and may                             extracellular space in different brain regions (Hrabetova et al.,
obviate the need for detailed computer simulations for each                           2018). In order to assess the sensitivity of our results to crowding
individual shape. However, caution should be exercised in shapes                      effects, we performed FBM simulations in a large disk of radius
with complex geometry because superdiffusive rFBM is not                              R = 100, filled with 1,013 small disk-shaped obstacles of radius
a local process, due to its long-range correlations. Therefore,                       Robs = 2. The obstacles were located within a circle of radius 90,
its properties can be potentially affected by the geometry of                         leaving an outer ring of width 10 unoccupied. This shape was
the entire domain. A systematic quantitative analysis of rFBM                         intended to represent a highly abstracted neocortical region, with
in geometrically idealized spatial domains (in two and three                          the empty outer rim representing cortical layer I. In adulthood,
dimensions) falls outside the scope of the present analysis and                       this layer is nearly devoid of neuron somata (but contains
is presented elsewhere (Vojta et al., 2020).                                          many dendrites and axons that for simplicity were ignored in
    In order to gain an insight into how the density of FBM-                          the simulation).
trajectories varies as a function of H and the contour curvature,                         The simulations were performed with H = 0.8. Each dataset
especially in neuroanatomically-relevant shapes, we investigated                      consisted of 192 individual fibers (FBM trajectories) starting from
a ring-like shape bounded by the contours Router = 100(1 +                            random positions inside the shape. Each trajectory had 225 ≈
0.5 cos2 (4ϕ)) and Rinner = 50 (defined in polar coordinates,                         34 million steps of size (standard deviation) σ = 0.4. As before,
where ϕ ∈ [0, 2π)). This shape can represent a cross section                          the local fiber density (ds ) was determined by counting the total
through an abstracted vertebrate brain. Vertebrate brains develop                     number of random walk segments inside each cell (of linear size
from the neural tube and remain topologically tube-like in                            0.5) of a square grid covering the shape.
adulthood, where the “hollow” inside of the tube is the ventricular
space filled with the cerebrospinal fluid (CSF).                                      RESULTS
    These simulations were performed with H = 0.3, 0.5, and
0.8. Each data set consisted of 100 individual fibers (FBM                            Serotonergic fiber densities are typically described with regard to
trajectories), starting from random positions inside the shape.                       specific neuroanatomical brain regions, with the assumption that
Each trajectory had 220 ≈ 1 million steps of size (standard                           they reflect the region’s functional demands and are supported by

Frontiers in Computational Neuroscience | www.frontiersin.org                     5                                                 June 2020 | Volume 14 | Article 56
Janušonis et al. Serotonergic Fibers as Stochastic Process Paths FIGURE 2 | Serotonergic fibers visualized with SERT-immunohistochemistry in coronal sections of the mouse brain. (A) The primary somatosensory cortex (S1). (B) The cingulate cortex, area 29c (A29c). (C) The piriform cortex (Pir). (D) The habenula (MHb, medial habenula; LHb, lateral labenula; sm, stria medullaris) and the dentate gyrus (DG) of the hippocampus. (E) The periaqueductal region in the mesencephalon (Aq, cerebral aqueduct). (F) The region around the fasciculus retroflexus (fr) in the diencephalon. The inset is a high-magnification image of the border (marked with circles) between the fasciculus retroflexus and the surrounding brain tissue. The arrowheads indicate increased fiber densities. Scale bars = 50 µm in (A–D), 100 µm in (E,F), and 20 µm in the inset of F. local biological factors. Our immunolabeling results (Figure 2) knowledge has never been extended to the entire brain. We next are consistent with the previously reported density maps in the show that this tendency is consistent with the behavior of rFBM rat and hamster brains (Steinbusch, 1981; Morin and Meyer- in the superdiffusion regime. Bernstein, 1999). In particular, they show high fiber densities Supercomputing FBM simulations (with H = 0.8) were in the superficial layers of the cerebral cortex, consistent with performed in four two-dimensional shapes that closely observations in the rat and ferret (Voigt and de Lima, 1991a; approximated the shape of actual coronal sections. Since major Linley et al., 2013). white matter tracts may act as forbidden regions (Figure 2F), we In contrast to previous interpretations, we suggest that included them as “obstacles” in the simulations. Qualitatively, these data indicate a general tendency of serotonergic fibers FBM sample paths closely resembled the trajectories of individual to accumulate near the borders of neural tissue (at the pial serotonergic fibers (Figure 1). or ependymal surfaces) (Figures 2A–E). This observation has The comparisons between the simulated and actual fiber been previously made in some brain regions [e.g., in the densities are shown in Figures 3–6. These densities showed hamster thalamus Morin and Meyer-Bernstein, 1999] but to our similar increases at the outer brain border, irrespective of the Frontiers in Computational Neuroscience | www.frontiersin.org 6 June 2020 | Volume 14 | Article 56
Janušonis et al.                                                                                                      Serotonergic Fibers as Stochastic Process Paths

 FIGURE 3 | (A) The density of serotonergic fibers (immunostained for SERT) in a coronal section of the mouse telencephalon. (B) The equilibrium density of simulated
 fibers performing FBM-walks in the same 2D-shape (H = 0.8; 960 fibers). In both (A,B), darker regions represent higher densities. (C) The main neuroanatomical
 structures and two density cuts, plotted in (D,E). The end points of the plotted segments are marked with small squares. Acb, nucleus accumbens; aca, anterior
 commissure; cc, corpus callosum; CPu, caudate/putamen; LV, lateral ventricle; M1, primary motor cortex; S, septum; VP, ventral pallidum. Scale bar = 1 mm. In (D,E),
 the experimental and simulated densities are shown in blue and red, respectively. The simulated densities have been transformed to “optical densities,” as described
 in Materials and Methods (the Y-axis ranges from 0 to 1). The rostro-caudal level in the sagittal view is shown at the top.

rostro-caudal level. A similar trend was observed around the                          conjecture. It leads to verifiable predictions of how serotonergic
ventricles. Interestingly, high simulated fiber densities were                        fiber densities can vary across brain regions and may also
obtained in some neuroanatomically-defined brain regions,                             support comparative neuroanatomy, where differences in the
such as the lateral geniculate nucleus and the hypothalamus                           fiber densities across mammalian species may be caused, at least
(Figures 4, 5), even though these regions were not specifically                       in part, by differences in the brain shapes (despite the highly
modeled and the increase was induced purely by the contour                            similar neuroanatomical plans).
geometry. It should be noted that both of these regions                                  At the outer border, a considerable mismatch was observed
have a convex border with a relatively high curvature. We                             between some gradients of densities (e.g., Figure 4E).
investigated this potential association using a simple shape and                      Considering the neuroanatomical simplicity of the simulated
a range of H values (Figure 7), which further supported this                          shape (e.g., it contained no “cells”), this result is not surprising.

Frontiers in Computational Neuroscience | www.frontiersin.org                     7                                                 June 2020 | Volume 14 | Article 56
Janušonis et al.                                                                                                        Serotonergic Fibers as Stochastic Process Paths

 FIGURE 4 | (A) The density of serotonergic fibers (immunostained for SERT) in a coronal section of the mouse rostral diencephalon. (B) The equilibrium density of
 simulated fibers performing FBM-walks in the same 2D-shape (H = 0.8; 960 fibers). In both (A,B), darker regions represent higher densities. (C) The main
 neuroanatomical structures and two density cuts, plotted in (D,E). The end points of the plotted segments are marked with small squares. DLG, dorsal lateral
 geniculate nucleus; cp, cerebral peduncle; f, fornix; fr, fasciculus retroflexus; Hyp, hypothalamus; ml, medial lemniscus; mt, mammillothalamic tract; str, superior
 thalamic radiation; VPM, ventral posteromedial nucleus. Scale bar = 1 mm. In (D,E), the experimental and simulated densities are shown in blue and red, respectively.
 The simulated densities have been transformed to “optical densities,” as described in Materials and Methods (the Y-axis ranges from 0 to 1). The rostro-caudal level in
 the sagittal view is shown at the top.

Also, the simulated gradients depend on the value of H and                                 The strongest discrepancy was found between the strong
the attenuation parameter of “optical transformation” (e.g.,                           density spikes around white matter tracts in the simulations
they can be made less steep, with an effect on the overall                             (where the tracts were modeled as impenetrable “obstacles”) and
density intensity). Matching the simulated and actual gradients                        the virtual absence of such spikes in the actual (immunostained)
precisely is difficult because the true fiber density cannot                           sections. This suggests that these tracts cannot be modeled as
be determined in immunostained sections without tracing                                “hard” obstacles and that other FBM-reflection models may
every fiber. Also, many non-linear effects can take place                              reflect their properties more accurately.
between the section and the image sensor, even at optimal                                  Since a fixed H was used in the simulations, we investigated
illumination settings.                                                                 the sensitivity of the obtained results to a range of H

Frontiers in Computational Neuroscience | www.frontiersin.org                      8                                                   June 2020 | Volume 14 | Article 56
Janušonis et al.                                                                                                         Serotonergic Fibers as Stochastic Process Paths

 FIGURE 5 | (A) The density of serotonergic fibers (immunostained for SERT) in a coronal section of the mouse caudal diencephalon. (B) The equilibrium density of
 simulated fibers performing FBM-walks in the same 2D-shape (H = 0.8; 960 fibers). In both (A,B), darker regions represent higher densities. (C) The main
 neuroanatomical structures and two density cuts, plotted in (D,E). The end points of the plotted segments are marked with small squares. 3V, third ventricle; bsc,
 brachium of the superior colliculus; cp, cerebral peduncle; DLG, dorsal lateral geniculate nucleus; fr, fasciculus retroflexus; Hyp, hypothalamus; ml, medial lemniscus;
 mt, mammillothalamic tract; opt, optic tract; pc, posterior commissure; ZI, zona incerta. Scale bar = 1 mm. In (D,E), the experimental and simulated densities are
 shown in blue and red, respectively. The simulated densities have been transformed to “optical densities,” as described in Materials and Methods (the Y-axis ranges
 from 0 to 1). The rostro-caudal level in the sagittal view is shown at the top.

values (Figures 6, 7). The density distribution patterns varied                         about the variability of the crowding density in brain regions.
dramatically across the three diffusion regimes, as anticipated                         In the present study, we used a relatively simple model and
(Wada and Vojta, 2018). However, they were robust within the                            tested whether the accumulation of fibers at borders could be
superdiffusion regime, suggesting that the results can be safely                        reversed by many cell-like obstacles that can potentially retard
generalized to other H values, beyond the one that was used in                          or trap fibers in the interior region of the bounded domain
the simulations (0.8).                                                                  (Figure 8). Despite the presence of many obstacle surfaces,
   Finally, we examined the sensitivity of the results to cell                          the simulation produced only thin, high-density layers around
packing. Heterogeneous crowding is an essential property of                             the obstacles, with no major effect on the overall density
neural tissue (Hrabetova et al., 2018), but currently little is known                   distribution. This result supports the robustness of our findings

Frontiers in Computational Neuroscience | www.frontiersin.org                       9                                                   June 2020 | Volume 14 | Article 56
Janušonis et al.                                                                                                         Serotonergic Fibers as Stochastic Process Paths

 FIGURE 6 | (A) The density of serotonergic fibers (immunostained for SERT) in a coronal section of the mouse mesencephalon. (B) The equilibrium density of
 simulated fibers performing FBM-walks in the same 2D-shape (H = 0.8; 960 fibers). In both (A,B), darker regions represent higher densities. (C) The main
 neuroanatomical structures and two density cuts, plotted in (D,E). The end points of the plotted segments are marked with small squares. Aq, aqueduct; cp, cerebral
 peduncle; csc, commissure of the superior colliculus; fr, fasciculus retroflexus; MG, medial geniculate nucleus; ml, medial lemniscus; PAG, periaqueductal gray; SC,
 superior colliculus; SNR, substantia nigra pars reticulata. Scale bar = 1 mm. In (D,E), the experimental and simulated densities are shown in blue and red, respectively.
 For comparison, this figure shows simulated densities obtained with three other H values [thin lines: H = 0.3 (green), H = 0.5 (gray), H = 0.6 (pink)]. Note that H = 0.3
 produces drastically reduced densities at the border and obstacles and that H = 0.5 produces densities that remain constant along the cut, with no change at the
 border or obstacles. Neither of these results is consistent with the real densities, in contrast to H values in the superdiffusion regime (H > 0.5). For visualization of
 these patterns in two dimensions, see Figure 7. All simulated densities have been transformed to “optical” densities, as described in Materials and Methods (the
 Y-axis ranges from 0 to 1). The rostro-caudal level in the sagittal view is shown at the top.

and is generally consistent with experimental observations in the                        densely packed neurons) (Voigt and de Lima, 1991b). However,
cerebral cortex, where the high density of serotonergic fibers may                       this finding should not be overgeneralized without future
not be restricted to cortical layer I (which is virtually devoid of                      studies of the interactions among different shape geometries,
neuron somata) and may also include layers II-III (which contain                         heterogeneous crowding, and the physical constraints of the

Frontiers in Computational Neuroscience | www.frontiersin.org                       10                                                  June 2020 | Volume 14 | Article 56
Janušonis et al.                                                                                                         Serotonergic Fibers as Stochastic Process Paths

 FIGURE 7 | The dependence of equilibrium fiber density on the Hurst index (H). Two shapes were used: the cross-section of a cylinder with an outer boundary that
 has a non-constant curvature (representing an abstracted neural tube; left column) and a shape representing the coronal section of the mouse rostral diencephalon
 (also used in Figure 4; right column). The contour borders are shown in blue in the subdiffusion regime (H = 0.3); no borders are marked in the other regimes (but
 they are clearly visible due to the accumulation of fibers). The simulated densities are plotted with no transformation. One hundred fibers were used for the abstracted
 shape in the left column, while 960 trajectories were used for the coronal section in the right column. The simulated densities are mapped linearly to the color scale,
 such that darker regions represent higher densities.

serotonergic fibers (e.g., the simulated trajectories in our study                      replicate the behavior of these fibers at “hard” borders (such
had no physical width).                                                                 as the pial and ependymal surfaces of the brain). In contrast,
                                                                                        major white matter tracts do not appear to significantly “reflect”
                                                                                        serotonergic fibers, even though they constrain their trajectories
DISCUSSION                                                                              as obstacles. This phenomenon may be due to the fact that
                                                                                        many individual fibers can penetrate (and perhaps traverse) these
We introduce a novel approach to the self-organization of                               tracts (Figure 2F). The presence of serotonergic fibers in some
serotonergic fibers in the brain and demonstrate that rFBM can                          major pathways, such as the fasciculus retroflexus, has been noted

Frontiers in Computational Neuroscience | www.frontiersin.org                      11                                                   June 2020 | Volume 14 | Article 56
Janušonis et al. Serotonergic Fibers as Stochastic Process Paths FIGURE 8 | The sensitivity of equilibrium fiber density (A) to densely packed internal obstacles (B) (represented by the small, impenetrable white discs inside the large shape). Even though fibers accumulate around the border of each individual obstacle, the obstacles have only a minor effect on the overall density distribution, especially near the outer border (where the density is higher). In the simulations, H = 0.8 and 192 fibers were used. The simulated densities are mapped linearly to the color scale, such that darker regions represent higher densities. in early neuroanatomical studies (Lidov and Molliver, 1982). The brain can be viewed as a highly heterogeneous material. These phenomena can be included in our model by treating It is densely packed with cells, their processes, microvasculature, the boundaries of white matter tracts differently from other and other elements that serotonergic fibers cannot penetrate. boundaries, such as modeling them as soft repulsive potentials Axons can be assembled into major white matter tracts which (Vojta et al., 2020). may require detours; for example, the number of axons in the Our model does not include the rich brain architecture and primate corpus callosum can be on the order of 107 -108 (Doty, biological signals that may act on serotonergic fibers. While the 2007). The fine structure of the extracellular space (ECS) in simulated fiber densities are a good approximation of the actual the brain requires state-of-the-art experimental methods and fiber densities, some of these factors may be important for more currently is an active area of research (Nicholson and Hrabetova, accurate predictions. We briefly mention some of them. 2017; Hrabetova et al., 2018). The stochastic geometry of the We used two-dimensional shapes, even though the brain ECS may impose a particular covariance structure on traveling is a three-dimensional object. As explained in the section fibers (or a “memory effect”) (Morgado et al., 2002; Bénichou Reflected FBM-paths in Brain-like Shapes, the reduction to et al., 2013), possibly in a region-specific manner. Some of this two dimensions unlikely produced major distortions. However, geometry can be modeled with sphere packing (to represent some discrepancies between the actual and simulated densities cell bodies) (Picka, 2012). Similar problems arise in intracellular may be due to the geometry of coronal sections just rostral or environments (Smith et al., 2017). In addition to the “hard” caudal to the selected section, with some fibers “spilling into” geometry, the stochastic properties of fibers may be affected by or “leaking from” the examined section. This problem may be the viscoelastic properties of their environment (Cherstvy et al., particularly significant where the geometry of ventricular spaces 2019). In the case of FBM, it may lead to different H values in rapidly changes in the rostro-caudal direction (e.g., ventricular different brain regions, with implications for local fiber densities. spaces “fuse” or “separate” in two-dimensional projections). Conversely, the estimated H values of fibers can be potentially Conceptually, the computational approach can be easily extended used to obtain information about the structure and integrity of to three dimensions, provided a fully three-dimensional model the ECS, with possible biomedical applications. of the brain geometry is available. However, the numerical effort Since individual serotonergic fibers can be visualized, for such simulations would be significantly higher. Specifically, estimates of H can be obtained from experimental data. However, it would require the parametrization of a two-dimensional it requires overcoming a few technical challenges, which are a manifold (the boundary), leading to increased computational focus of our larger research program (in the present study, we costs close to the boundary (where the decision has to be made assumed H = 0.8 and demonstrated the robustness of the main whether the walker is in the allowed region or not). One potential results). For example, tracing a single fiber in immunostained solution is using two-dimensional brain shapes obtained in two brain sections (e.g., 40 µm in thickness) is difficult because or three perpendicular planes (e.g., coronal, sagittal, axial), which most fibers exit the section in the Z-direction, before advancing may allow a more accurate reconstruction of densities in all substantially in the X-Y plane (Janušonis et al., 2019). Modern three dimensions. tissue clearing methods and light-sheet microscopy allow direct Frontiers in Computational Neuroscience | www.frontiersin.org 12 June 2020 | Volume 14 | Article 56
Janušonis et al.                                                                                     Serotonergic Fibers as Stochastic Process Paths

3D-imaging with no sectioning (Mano et al., 2018; Hillman et al.,         parametrized by the waiting-time probability density (therefore,
2019), but light-sheet microscopy is only now approaching the             a Lévy flight can be viewed as a special CTRW). They are highly
sub-micrometer resolution needed for the imaging of individual            appropriate for some physical processes [e.g., the dynamics of
serotonergic fibers (Chakraborty et al., 2019). The high fiber            molecular complexes jumping from one segment of a polymer
densities in most brain regions presents another problem, where           to another, facilitated by folding-induced physical proximity
single-fiber tracing has to be performed in the presence of               Lomholt et al., 2005], but they do not well-represent axon growth
interfering signals, such as other fibers and potential branching         where instantaneous jumps are not biologically realistic. Also,
points. Advances in computer image analysis (Kayasandik et al.,           the trajectories of growing axons are likely to show long-range
2018; Falk et al., 2019), combined with transgenic technologies           temporal correlations that are an inherent property of FBM (in
that allow labeling individual neurons and their processes with           addition to other useful properties reviewed in the Introduction;
unique combinations of fluorophores [such as Brainbow 3.2 Cai             here we assume H 6= 1/2). It should be noted that the long-
et al., 2013], are well positioned to advance these efforts.              range correlations in FBM extend to arbitrarily large distances
    Our model assumes no self-avoidance or biological feedback            (Biagini et al., 2010), which may exceed biological reality, but
signals that depend on fiber density. Several factors have been           a possible theoretical refinement may be provided by stochastic
reported to control the growth of distribution of serotonergic            processes in which the long-range correlations are cut off at a
fibers, but this research has been heavily influenced by the              large but finite distance (Molina-Garcia et al., 2018). In addition,
notion that orderly distribution cannot be achieved without               branching FBM-like processes may offer insights into how the
tight biological control [see, e.g., Chen et al. (2017)]. The             bifurcation or arborization of serotonergic fibers can affect their
simulation results provide evidence that a considerable degree            steady state distribution. Direct simulations of macromolecular
of self-organization can be achieved with simple assumptions,             dynamics in confined domains can further enrich these studies;
but it does not rule out these factors. Early studies have                for example, in some simulations particles near the wall tend
found that S100β, a biologically active protein, may promote              to stay near the wall (Chow and Skolnick, 2015), which may
the development of serotonergic fibers. Interestingly, S100β              explain the tendency of serotonergic fibers to orient parallel
can be released from astrocytes, in response of activation of             to the edge immediately below the pia (for depths up to 25–
serotonin 5-HT1A receptors, suggesting a positive feedback                50 µm; Figure 2). Finally, it has been recently demonstrated
loop (Whitaker-Azmitia, 2001). Also, the absence of brain                 (Vojta et al., 2019) that the increased density close to a boundary
serotonin synthesis alters the development of normal fiber                arises from the non-equilibrium nature of FBM. A similar
densities, but this effect appears to be strongly region-dependent        anomalous diffusion process in thermal equilibrium, modeled by
(Migliarini et al., 2013). It may be mediated by the brain-derived        the fractional Langevin equation, does not lead to accumulation
neurotrophic factor (BDNF) which has long been implicated                 at the boundary. This property of FBM is consistent with the
in the growth of serotonergic fibers (Mamounas et al., 1995;              active growth of the serotonergic fibers.
Migliarini et al., 2013). It remains unclear how serotonin affects           In summary, the present study demonstrates that FBM
fiber densities under physiological conditions because a different        offers a promising theoretical framework for the modeling
genetic model (with a less severe reduction of brain serotonin            of serotonergic fibers. Since serotonin-releasing fibers are
levels) has failed to reproduce these effects (Donovan et al.,            a part of the larger ascending reticular activating system,
2019). Recently, protocadherin-αc2 has been strongly implicated           which releases other major neurotransmitters and has
in the distribution of serotonergic fibers, through homophilic            widespread projections, this framework may also be useful
interaction between individual axons (Katori et al., 2009, 2017;          in advancing the understanding of other stochastic axon systems
Chen et al., 2017). Intriguingly, protocadherin-α mutants show            in vertebrate brains.
pronounced increases in the fiber densities in layer I of the
primary motor cortex and in the lacunosum-moleculare layer
of the hippocampus, both of which are at the border of their
                                                                          DATA AVAILABILITY STATEMENT
respective brain regions. This study also has noted that in some          The datasets generated for this study are available on request to
other regions the “distribution of serotonin axonal terminals             the corresponding author.
was [. . . ] dense at the periphery of each region but sparse in
the center” (Katori et al., 2009). Our results suggest that this
experimental result may reflect either a more pronounced rFBM             ETHICS STATEMENT
behavior (in the absence of fiber interaction) or an rFBM with a
higher H (induced by the genetic mutation).                               The animal study was reviewed and approved by UCSB
    It is important to note that FBM is not the only mathematical         Institutional Animal Care and Use Committee.
model that allows superdiffusion (or anomalous diffusion, more
generally). Superdiffusion can also be modeled with Lévy flights          AUTHOR CONTRIBUTIONS
or with continuous-time random walks (CTRWs) that have a
heavy-tailed displacement probability density (Codling et al.,            SJ proposed the hypothesis of serotonergic fibers as paths of
2008; Schulz et al., 2013; Metzler et al., 2014). These two               a stochastic process, performed the immunostaining, prepared
processes allow large, instantaneous (spatially discontinuous)            the 2D-shape matrices for simulations, and wrote the first draft
jumps from one location to another, but CTRWs are additionally            of the manuscript. TV guided the computational analyses of

Frontiers in Computational Neuroscience | www.frontiersin.org        13                                           June 2020 | Volume 14 | Article 56
Janušonis et al. Serotonergic Fibers as Stochastic Process Paths
reflected FBM and performed all supercomputing simulations. ND), the California NanoSystems Institute (Challenge
ND suggested FBM as a potential model that allows scale- grants to SJ and ND), the Research Corporation for Science
invariance and made other theoretical contributions. RM led Advancement (a Cottrell SEED Award to TV), and the German
the development of the model within the theoretical framework Research Foundation (DFG grant #ME 1535/7-1 to RM).
of anomalous diffusion processes. All authors are the Principal RM acknowledges support from the Foundation of Polish
Investigators of their respective research programs. Science through an Alexander von Humboldt Polish Honorary
Research Scholarship.
FUNDING
ACKNOWLEDGMENTS
This research was supported by the National Science Foundation
(grants #1822517 and #1921515 to SJ and ND), the National We thank Kasie Mays (UCSB) for the assistance with
Institute of Mental Health (grant #MH117488 to SJ and tissue preparation.
REFERENCES Codling, E. A., Plank, M. J., and Benhamou, S. (2008). Random walk models in
biology. J. R Soc. Interface 5, 813–834. doi: 10.1098/rsif.2008.0014
Adori, C., Low, P., Ando, R. D., Gutknecht, L., Pap, D., Truszka, F., et al. Donovan, L. J., Spencer, W. C., Kitt, M. M., Eastman, B. A., Lobur, K. J., Jiao,
(2011). Ultrastructural characterization of tryptophan hydroxylase 2-specific K., et al. (2019). Lmx1b is required at multiple stages to build expansive
cortical serotonergic fibers and dorsal raphe neuronal cell bodies after MDMA serotonergic axon architectures. Elife 8:e48788. doi: 10.7554/eLife.48788.028
treatment in rat. Psychopharm. 213, 377–391. Doty, R. W. (2007). “Cortical commissural connections in primates,” in
Agnati, L. F., and Fuxe, K. (2014). Extracellular-vesicle type of volume transmission Evolution of Nervous Systems: A Comprehensive Reference, eds J. H.
and tunnelling-nanotube type of wiring transmission add a new dimension to Kaas and T. M. Preuss (New York, NY: Academic Press), 277–289.
brain neuro-glial networks. Philos. Trans. R Soc. Lond. B Biol. Sci. 369:20130505. doi: 10.1016/B0-12-370878-8/00011-2
doi: 10.1098/rstb.2013.0505 Dougherty, S. E., Kajstura, T. J., Jin, Y., Chan-Cortes, M. H., Kota, A., and Linden,
Azmitia, E. C., Singh, J. S., and Whitaker-Azmitia, P. M. (2011). Increased D. J. (2019). Catecholaminergic axons in the neocortex of adult mice regrow
serotonin axons (immunoreactive to 5-HT transporter) in postmortem following brain injury. Exp. Neurol. 323:113089. doi: 10.1101/737072
brains from young autism donors. Neuropharmacology 60, 1347–1354. Falk, T., Mai, D., Bensch, R., Cicek, O., Abdulkadir, A., Marrakchi, Y., et al.
doi: 10.1016/j.neuropharm.2011.02.002 (2019). U-Net: deep learning for cell counting, detection, and morphometry.
Bénichou, O., Bodrova, A., Chakraborty, D., Illien, P., Law, A., Mejía-Monasterio, Nat. Methods 16, 67–70. doi: 10.1038/s41592-018-0261-2
C., et al. (2013). Geometry-induced superdiffusion in driven crowded systems. Flory, P. (1986). Development of concepts in polymer science. A half
Phys. Rev. Lett. 111:260601. doi: 10.1103/PhysRevLett.111.260601 century in retrospect. Makromol. chem. Macromol. Symposia 1, 5–16.
Benzekhroufa, K., Liu, B., Tang, F., Teschemacher, A. G., and Kasparov, S. (2009). doi: 10.1002/masy.19860010103
Adenoviral vectors for highly selective gene expression in central serotonergic Gagnon, D., and Parent, M. (2014). Distribution of VGLUT3 in
neurons reveal quantal characteristics of serotonin release in the rat brain. BMC highly collateralized axons from the rat dorsal raphe nucleus as
Biotechnol. 9:23. doi: 10.1186/1472-6750-9-23 revealed by single-neuron reconstructions. PLoS ONE 9:e87709.
Biagini, F., Hu, Y., Oksendal, B., and Zhang, T. (2010). Stochastic Calculus for doi: 10.1371/journal.pone.0087709
Fractional Brownian Motion and Applications. London: Springer. Guggenberger, T., Pagnini, G., Vojta, T., and Metzler, R. (2019). Fractional
Cai, D., Cohen, K. B., Luo, T., Lichtman, J. W., and Sanes, J. R. (2013). Brownian motion in a finite interval: correlations effect depletion or
Improved tools for the Brainbow toolbox. Nat. Methods 10, 540–547. accretion zones of particles near boundaries. New J. Phys. 21:022002.
doi: 10.1038/nmeth.2450 doi: 10.1088/1367-2630/ab075f
Cardozo Pinto, D. F., Yang, H., Pollak Dorocic, I., de Jong, J. W., Han, V. J., Hawthorne, A. L., Hu, H., Kundu, B., Steinmetz, M. P., Wylie, C. J.,
Peck, J. R., et al. (2019). Characterization of transgenic mouse models targeting Deneris, E. S., et al. (2011). The unusual response of serotonergic neurons
neuromodulatory systems reveals organizational principles of the dorsal raphe. after CNS injury: lack of axonal dieback and enhanced sprouting within
Nat. Commun. 10:4633. doi: 10.1038/s41467-019-12392-2 the inhibitory environment of the glial scar. J. Neurosci. 31, 5605–5616.
Carrera, I., Molist, P., Anadon, R., and Rodriguez-Moldes, I. (2008). Development doi: 10.1523/JNEUROSCI.6663-10.2011
of the serotoninergic system in the central nervous system of a shark, the Hawthorne, A. L., Wylie, C. J., Landmesser, L. T., Deneris, E. S., and Silver, J.
lesser spotted dogfish Scyliorhinus canicula. J. Comp. Neurol. 511, 804–831. (2010). Serotonergic neurons migrate radially through the neuroepithelium
doi: 10.1002/cne.21857 by dynamin-mediated somal translocation. J. Neurosci. 30, 420–430.
Chakraborty, T., Driscoll, M. K., Jeffery, E., Murphy, M. M., Roudot, P., doi: 10.1523/JNEUROSCI.2333-09.2010
Chang, B. J., et al. (2019). Light-sheet microscopy of cleared tissues Hendricks, T., Francis, N., Fyodorov, D., and Deneris, E. S. (1999). The ETS
with isotropic, subcellular resolution. Nat. Methods 16, 1109–1113. domain factor Pet-1 is an early and precise marker of central serotonin neurons
doi: 10.1038/s41592-019-0615-4 and interacts with a conserved element in serotonergic genes. J. Neurosci. 19,
Chakravarty, N., and Sebastian, K. L. (1997). Fractional Brownian motion models 10348–10356. doi: 10.1523/JNEUROSCI.19-23-10348.1999
for polymers. Chem. Phys. Lett. 267, 9–13. doi: 10.1016/S0009-26149700075-4 Hillman, E. M. C., Voleti, V., Li, W., and Yu, H. (2019). Light-sheet
Chen, W. V., Nwakeze, C. L., Denny, C. A., O’Keeffe, S., Rieger, M. A., microscopy in neuroscience. Annu. Rev. Neurosci. 42, 295–313.
Mountoufaris, G., et al. (2017). Pcdhαc2 is required for axonal tiling doi: 10.1146/annurev-neuro-070918-050357
and assembly of serotonergic circuitries in mice. Science 356, 406–411. Hornung, J. P. (2003). The human raphe nuclei and the serotonergic system. J.
doi: 10.1126/science.aal3231 Chem. Neuroanat. 26, 331–343. doi: 10.1016/j.jchemneu.2003.10.002
Cherstvy, A. G., Thapa, S., Wagner, C. E., and Metzler, R. (2019). Non-Gaussian, Hrabetova, S., Cognet, L., Rusakov, D. A., and Nagerl, U. V. (2018). Unveiling the
non-ergodic, and non-Fickian diffusion of tracers in mucin hydrogels. Soft. extracellular space of the brain: from super-resolved microstructure to in vivo
Matter. 15, 2526–2551. doi: 10.1039/C8SM02096E function. J. Neurosci. 38, 9355–9363. doi: 10.1523/JNEUROSCI.1664-18.2018
Chow, E., and Skolnick, J. (2015). Effects of confinement on models of intracellular Hu, Y., and Nualart, D. (2005). Renormalized self-intersection local
macromolecular dynamics. Proc. Natl. Acad. Sci. U.S.A. 112, 14846–14851. time for fractional Brownian motion. Ann. Prob. 33, 948–983.
doi: 10.1073/pnas.1514757112 doi: 10.1214/009117905000000017
Frontiers in Computational Neuroscience | www.frontiersin.org 14 June 2020 | Volume 14 | Article 56You can also read