Transcriptome reconstruction and functional analysis of eukaryotic marine plankton communities via high-throughput metagenomics and ...
←
→
Page content transcription
If your browser does not render page correctly, please read the page content below

Downloaded from genome.cshlp.org on November 29, 2020 - Published by Cold Spring Harbor Laboratory Press

Method

Transcriptome reconstruction and functional
analysis of eukaryotic marine plankton communities
via high-throughput metagenomics and
metatranscriptomics
Alexey Vorobev,1,2,3 Marion Dupouy,1,4 Quentin Carradec,1,2 Tom O. Delmont,1,2
Anita Annamalé,1,5 Patrick Wincker,1,2 and Eric Pelletier1,2
1
 Metabolic Genomics, Genoscope, Institut de Biologie François Jacob, CEA, CNRS, Univ Evry, Université Paris Saclay, 91000 Evry,
France; 2Research Federation for the Study of Global Ocean Systems Ecology and Evolution, FR2022/Tara Oceans GOSEE,
75016 Paris, France

        Large-scale metagenomic and metatranscriptomic data analyses are often restricted by their gene-centric approach, limiting
        the ability to understand organismal and community biology. De novo assembly of large and mosaic eukaryotic genomes
        from complex meta-omics data remains a challenging task, especially in comparison with more straightforward bacterial and
        archaeal systems. Here, we use a transcriptome reconstruction method based on clustering co-abundant genes across a series of
        metagenomic samples. We investigated the co-abundance patterns of ∼37 million eukaryotic unigenes across 365 metage-
        nomic samples collected during the Tara Oceans expeditions to assess the diversity and functional profiles of marine plankton.
        We identified ∼12,000 co-abundant gene groups (CAGs), encompassing ∼7 million unigenes, including 924 metagenomics-
        based transcriptomes (MGTs, CAGs larger than 500 unigenes). We demonstrated the biological validity of the MGT collec-
        tion by comparing individual MGTs with available references. We identified several key eukaryotic organisms involved in
        dimethylsulfoniopropionate (DMSP) biosynthesis and catabolism in different oceanic provinces, thus demonstrating the po-
        tential of the MGT collection to provide functional insights on eukaryotic plankton. We established the ability of the MGT
        approach to capture interspecies associations through the analysis of a nitrogen-fixing haptophyte-cyanobacterial symbiotic
        association. This MGT collection provides a valuable resource for analyses of eukaryotic plankton in the open ocean by giving
        access to the genomic content and functional potential of many ecologically relevant eukaryotic species.
        [Supplemental material is available for this article.]

As an alternative to individual genome or transcriptome sequenc-                    direct assemblies of metagenomic reads to generate contigs that
ing, environmental genomics has been used for many years to                         encompass several genes. High recovery of bacterial and archaeal
access the global genomic content of organisms from a given envi-                   genomes has been achieved through traditional assembly
ronment (Joly and Faure 2015). However, large-scale metagenomic                     strategies from both high- and low-diversity environmental sam-
and metatranscriptomic data analyses are often restricted by their                  ples (Dick et al. 2009; Albertsen et al. 2013; Tully et al. 2018).
gene-centric approach, limiting the ability to draw an integrative                  However, when dealing with complex communities of organisms,
functional view of sampled organisms. Nevertheless, constructing                    traditional genome assembly approaches are often impaired by the
gene catalogs from environmental samples provides a useful frame-                   large amount of sequence data and the genome heterogeneity.
work for a general description of the structure and functional capa-                      To circumvent these limitations, approaches based on refer-
bilities of microbe-dominated communities (Venter et al. 2004; Qin                  ence genomes have been proposed (Caron et al. 2009; Pawlowski
et al. 2010; Brum et al. 2015; Sunagawa et al. 2015; Carradec et al.                et al. 2012). Other approaches are based on binning of assembly
2018). Gene-centric approaches allow deep and detailed explora-                     contigs across a series of samples to extract information (Sharon
tion of communities of organisms, but they are usually undermined                   et al. 2012; Albertsen et al. 2013). Significant results for bacteria
by limited contextual information for different genes, apart from                   and archaea have been achieved so far (Parks et al. 2017;
taxonomic affiliation based on sequence similarity.                                 Delmont et al. 2018; Nayfach et al. 2019; Pasolli et al. 2019).
      Several methods have been developed to shift the scientific                   However, eukaryotic organisms have larger, more complex ge-
paradigm from a gene-centric to an organism-centric view of envi-                   nomes that require significantly higher sequence coverage than
ronmental genomic and transcriptomic data. These methods use                        bacteria and archaea. Even in cases where significantly long con-
                                                                                    tigs can be obtained, the mosaic structure of eukaryotic genes
                                                                                    and the difficulty of predicting them de novo from a genome
Present addresses: 3INSERM U932, PSL University, Institut Curie,
75005 Paris, France; 4AGAP, Univ. Montpellier, CIRAD, INRA,
Montpellier SupAgro, 34398 Montpellier, France; 5Discngine SAS,                     © 2020 Vorobev et al. This article is distributed exclusively by Cold Spring
75012 Paris, France                                                                 Harbor Laboratory Press for the first six months after the full-issue publication
Corresponding authors: voralexey@gmail.com,                                         date (see http://genome.cshlp.org/site/misc/terms.xhtml). After six months, it
eric.pelletier@genoscope.cns.fr                                                     is available under a Creative Commons License (Attribution-NonCommercial
Article published online before print. Article, supplemental material, and publi-   4.0 International), as described at http://creativecommons.org/licenses/by-
cation date are at http://www.genome.org/cgi/doi/10.1101/gr.253070.119.             nc/4.0/.

30:1–13 Published by Cold Spring Harbor Laboratory Press; ISSN 1088-9051/20; www.genome.org                                        Genome Research                1
                                                                                                                                      www.genome.org
Downloaded from genome.cshlp.org on November 29, 2020 - Published by Cold Spring Harbor Laboratory Press

Vorobev et al.

sequence leads to poor gene recovery (Boeuf et al. 2019). Only eu-      occurrence signal in a single sample. The metagenomic RPKM-
karyotes possessing small genomes and a high proportion of              based abundance matrix of these unigenes was submitted to a can-
mono-exonic genes are expected to provide results similar to those      opy clustering process (see Methods) that regrouped unigenes
achieved for bacteria or archaea. Recently, a semisupervised meth-      based on the covariation of their genomic abundance across the
od based on a model trained with a set of diverse references allowed    samples. Of these unigenes, 7,254,163 (19.5%) were clustered
eukaryotic genome reconstruction from complex natural environ-          into 11,846 co-abundance gene groups with sizes varying from 2
ments (West et al. 2018; Olm et al. 2019).                              to 226,807 unigenes. Nine hundred twenty-four CAGs consisting
      Novel reference-independent clustering approaches that            of at least 500 unigenes were termed metagenomics-based tran-
produce genomes from metagenomic data have recently been de-            scriptomes (MGTs) as they may constitute a significant part of an
veloped (Albertsen et al. 2013; Imelfort et al. 2014; Nielsen et al.    organism’s transcriptome and which encompass 6,946,068 uni-
2014; Delmont et al. 2018; Kang et al. 2019) and successfully ap-       genes (Supplemental Table S1). For subsequent analyses, we focused
plied to prokaryote-dominated communities. One of these ap-             on these more complete 924 MGTs since they more accurately rep-
proaches efficiently delineated co-abundant gene groups (CAGs),         resent organisms’ transcriptomes (Supplemental Fig. S1). This MGT
the largest of which were termed metagenomic species (MGS),             collection recruited a significant number of metagenomic reads
across a series of human gut microbiome samples (Nielsen et al.         across Tara Oceans stations with an average of 58.5% (up to
2014). This method uses the metagenomic abundance profiles of           94.5% for some samples) of the reads (Supplemental Fig. S2). The av-
a reference gene catalog, determined by stringent mapping of            erage number of taxonomically assigned unigenes across the MGTs
raw metagenomic reads onto sequences in this catalog, and defines       was 44.6% (up to 99.5%). We have detected 22 MGTs with com-
clusters of genes showing similar variations of abundance profiles      pleteness higher than 50% (average contamination 16%) and 58
across a collection of samples.                                         MGTs with completeness higher than 20% (average contamina-
      The vast majority of the planktonic biomass in the global         tion 10.5%). Contamination was computed using a set of 83 pro-
ocean consists of single-cell eukaryotes and multicellular zoo-         tistan-specific single-copy core genes (Simão et al. 2015) or a set
plankton (Dortch and Packard 1989; Gasol et al. 1997). Globally,        of 139 bacterial-specific single-copy core genes (Campbell et al.
these organisms play an important role in shaping the biogeo-           2013) within the Anvi’o package (ver 5.2) (Eren et al. 2015).
chemical cycles of the ocean and significantly impact food webs         Since unigenes often represent not full genes but their fragments,
and climate. Despite recent advances in understanding their taxo-       single-copy core genes may map to multiple unigenes representing
nomic and gene functional compositions (Venter et al. 2004; Joly        the same gene, which may lead to artificially high levels of con-
and Faure 2015; Carradec et al. 2018), little is known about the bio-   tamination. MGT completeness significantly improved after the
geographical preferences and metabolic potential of many eukary-        CAP3 assembly step (see Supplemental Material), which resulted
otic plankton species from an organism-centric perspective.             in 74 MGTs with completeness higher than 50% and 131 MGTs
Several collections of reference marine eukaryote organisms’            with completeness higher than 20% (Supplemental Table S1).
sequences have been created, the largest one being the Marine
Microbial Eukaryotic Transcriptome Sequencing Project
(MMETSP) collection (Keeling et al. 2014). However, the majority        Taxonomic diversity of the MGT collection
of fully sequenced marine eukaryotic genomes or transcriptomes          We studied the distribution of taxonomically assigned unigenes
are derived from cultured organisms. Due to the limited availabil-      for each MGT across major planktonic taxa. In several cases, we
ity of cultured representatives of many dominant in the open            observed a homogeneous distribution of taxonomic affiliations,
ocean plankton, including zooplankton representatives, reference        suggesting that the MGTs represented transcriptomes of individu-
sequences represent only a small fraction of the natural biological     al organisms (Supplemental Table S1; Supplemental Fig. S11). The
diversity (De Vargas et al. 2015; Sibbald and Archibald 2017).          accuracy of the taxonomic affiliations of the unigenes varied
      Here, we used the rationale of this reference-independent,        throughout the samples and depended on (1) the conservation lev-
gene co-abundance method (Nielsen et al. 2014) to delineate             el of a given sequence across species and (2) the adequacy and ro-
transcriptomes by mapping metagenomic sequencing data ob-               bustness of a reference database in regard to a given taxonomic
tained from 365 metagenomic read sets generated from marine             unit (Carradec et al. 2018).
water samples collected from the global ocean during the Tara                 For each MGT, global taxonomic affiliation was determined
Oceans expedition onto the metatranscriptome-derived Marine             by the taxonomic node that covered at least 75% of the taxonom-
Atlas of Tara Oceans Unigenes (MATOU-v1 catalog [Carradec               ically assigned unigenes of that MGT (see Methods for more
et al. 2018]) obtained from the same set of Tara Oceans stations        detail). The MGT collection mostly comprised eukaryotic repre-
(Supplemental Fig. S1). The samples were collected from all the         sentatives (728 MGTs: 78%, 6,380,849 unigenes), followed by bac-
major oceanic provinces except the Arctic, typically from two pho-      teria (148 MGTs: 16%, 454,253 unigenes), archaea (2 MGTs: 0.2%,
tic zone depths (subsurface [SRF] and deep-chlorophyll maximum          2844 unigenes), and viruses (1 MGT: 0.1%, 877 unigenes).
[DCM]) and across four size fractions (0.8–5 µm, 5–20 µm, 20–180        Presence of bacteria and archaea in the MATOU-v1 catalog, despite
µm, and 180–2000 µm).                                                   using polyadenylated RNA for the sequencing step, can be ex-
                                                                        plained by (1) the true nonpolyadenylated nature of these tran-
                                                                        scripts or (2) the low level of eukaryotic annotations in regard to
Results                                                                 prokaryotes in reference databases (Carradec et al. 2018). In this
                                                                        study, we focused only on the MGTs from the domain Eukaryota.
Construction of the MGT collection                                            The overall taxonomic analysis of the MGT collection re-
Of the 116,849,350 metatranscriptomic-based unigenes of the             vealed that most of the major eukaryotic marine planktonic king-
MATOU-v1 catalog, 37,381,609 (32%) were detected by metage-             doms (Worden et al. 2012) were covered, with the exception of
nomic reads mapping in at least three different Tara Oceans sam-        Amoebozoa, Cryptophyta, and Rhodophyta (Fig. 1). Most of the
ples and displayed no more than 90% of their total genomic              MGTs with a low-resolution global taxonomic assignment (i.e.,

2    Genome Research
       www.genome.org
Downloaded from genome.cshlp.org on November 29, 2020 - Published by Cold Spring Harbor Laboratory Press

                                                                                 Reconstruction of marine eukaryotic transcriptomes

Figure 1. A taxonomic dendrogram representing the eukaryotic tree of life shows taxonomic positions of MGTs (orange circles) in relation to the major
eukaryotic lineages. The size of the circles represents the number of MGTs positioned at a given taxonomic node. The total number of MGTs assigned to
each taxonomic group is indicated on the outside of the tree.

those for which the taxonomic affiliation could be assigned only at          reference organisms in the MGT collection. We analyzed refer-
the kingdom level or higher) were related to the Opisthokonta                ence transcriptomes from a single-celled microeukaryote
group (447 out of 728 MGTs) or unclassified Eukaryota (105),                 Bathycoccus prasinos and a small multicellular zooplankton
whereas the well-defined eukaryotic MGTs (i.e., those for which              Oithona nana. The rationale for choosing these organisms as refer-
the taxonomic affiliation could be assigned at the class level or            ences was as follows: (1) They play an important role in the func-
deeper) belonged to unicellular algae: Stramenopiles (62),                   tioning of marine ecosystems; (2) their transcriptomes were
Alveolata (48), Viridiplantae (30), and Haptophyceae (29) lineages.          publicly available (Keeling et al. 2014; Madoui et al. 2017); (3)
This low taxonomic resolution of the MGTs could be due to (1) a              they were hypothesized to be present in the data sets because of
low number of zooplankton organisms, including representatives               their high abundance in marine waters as demonstrated by an
from the Opisthokonta group, in the reference databases or (2)               18S rDNA survey from the same samples (De Vargas et al. 2015);
the presence of associations of several organisms in a given MGT.            and (4) they cover a range of organisms with substantially differ-
Overall, these observations suggest that the MGTs correspond                 ent transcriptome sizes (5.6–24 Mb), from phytoplankton and
to either organisms with available transcriptomes or those with-             zooplankton groups, and from small and large size fractions of
out sequenced representatives. Taxonomic diversity of the                    planktonic communities. We were able to recover an average of
MGT collection differs significantly compared to the collections             68% (up to 77%) of the reference transcriptomes utilizing the
of reference transcriptomes derived from cultured organisms                  MGT unigenes with at least 95% sequence identity over at least
(Supplemental Fig. S3), including the MMETSP project (Keeling                50 amino acids (Fig. 2).
et al. 2014). Possible explanations for this include (1) the essentially
coastal origin of cultured strains and (2) the absence of zooplank-          Segregation of the Bathycoccus ecotypes
ton in the MMETSP selected organisms.
                                                                             To assess the potential of the MGT approach to segregate closely
       While 48.3% of the unigenes in the MATOU-v1 catalog and
                                                                             related biological entities, we focused on the MGTs highly similar
47.3% of the unigenes captured in the MGTs were taxonomically
                                                                             to the reference transcriptomes of Bathycoccus prasinos. Bathycoccus
assigned, we observed an uneven bimodal distribution of taxo-
                                                                             is a genus of green algae from the order Mamiellales which is eco-
nomically assigned unigenes among the MGTs resulting in two
                                                                             logically relevant because it is widely distributed in the global
distinct MGT groups (Fig. 2). The first group (228 MGTs, 24.7%)
                                                                             ocean and contributes significantly to primary production
consisted of well-defined MGTs (>75% of their unigenes had a tax-
                                                                             (Vannier et al. 2016; Limardo et al. 2017). Recent omics-based
onomic assignment), representing “known” organisms, whereas
                                                                             studies demonstrated the existence of at least two ecotypes of
the second group included 385 MGTs (41.7%) that were taxonom-
                                                                             Bathycoccus (B1 and B2) which have identical 18S rRNA sequences
ically poorly characterized (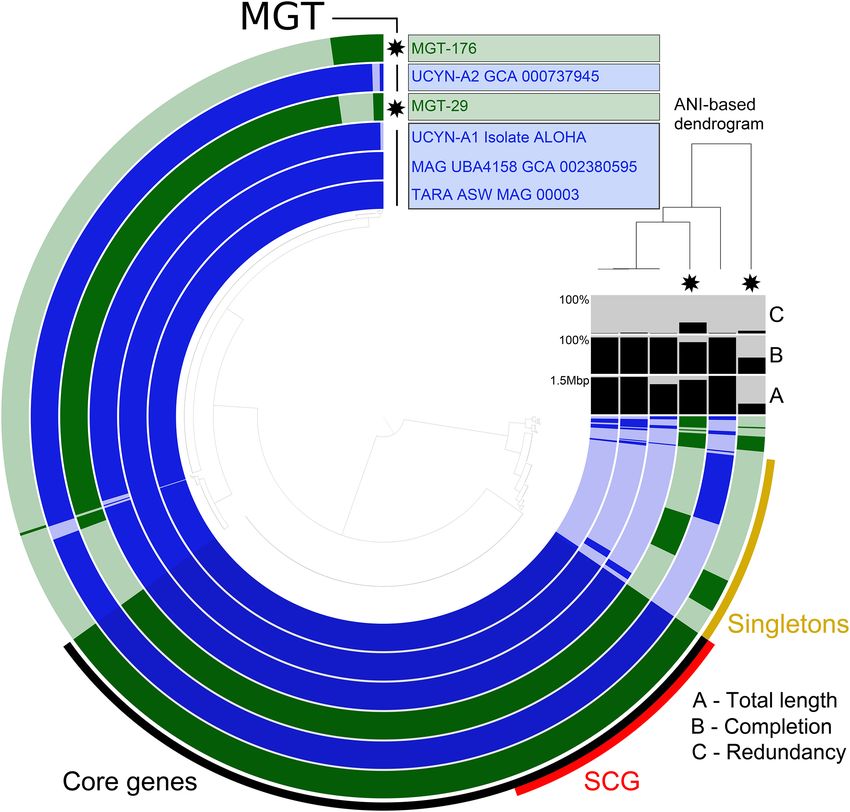
Downloaded from genome.cshlp.org on November 29, 2020 - Published by Cold Spring Harbor Laboratory Press

Vorobev et al.

                                                                                                          Biogeography of the genus Oithona
                                                                                                            Zooplankton, including cyclopoid cope-
                                                                                                            pods, also play an important role in
                                                                                                            marine ecosystems. They impact biogeo-
                                                                                                            chemical cycles and are key components
                                                                                                            of the oceanic food web (Roemmich and
                                                                                                            McGowan 1995; Keister et al. 2012;
                                                                                                            Steinberg and Landry 2017). However,
                                                                                                            only a few ecologically relevant references
                                                                                                            are currently available in public databases.
                                                                                                            Despite recent advances in the popula-
                                                                                                            tion genomics of the genus Oithona, one
                                                                                                            of the most abundant and widespread co-
                                                                                                            pepods in the pelagic ocean (Gallienne
                                                                                                            and Robins 2001; Madoui et al. 2017),
                                                                                                            more data are required to study the distri-
                                                                                                            bution of Oithona species and other cope-
                                                                                                            pods in the global ocean.
                                                                                                                  Ninety-eight percent of the Oithona-
                                                                                                            related unigenes were detected in four
                                                                                                            MGTs (MGT-5, MGT-9, MGT-56, and
                                                                                                            MGT-60), with MGT-5 and MGT-9 alone
                                                                                                            generating 87% of the signal (Supple-
Figure 2. A visual representation of the major MGT statistics including the MGT size (represented by
                                                                                                            mental Table S2). The estimated com-
the number of unigenes, x-axis) and the fraction of taxonomically assigned unigenes (y-axis). The circle
size and its opacity represent the number of samples in which a given MGT was detected. Taxonomic           pleteness of the assembled unigenes was
affiliation of the MGTs to major eukaryotic lineages is color-coded. Size distribution of MGTs based on     71% for MGT-5 and 87% for MGT-9
the number of unigenes is displayed on top of the main figure. Distribution of taxonomically assigned       (Fig. 3B). MGT-5 demonstrated highly
unigenes among MGTs is presented on the left-hand side panel of the figure. “Known” and “unknown”
                                                                                                            specific biogeographical preferences be-
sections of the panel indicate the MGTs comprising >75% and
Downloaded from genome.cshlp.org on November 29, 2020 - Published by Cold Spring Harbor Laboratory Press
Reconstruction of marine eukaryotic transcriptomes
A which allowed us to study their expres-
sion and biogeography from a genome-
centric point of view (Supplemental
Table S3).
Out of 1220 DSYB-related unigenes
detected in the MATOU-v1 catalog,
1214 were taxonomically assigned to eu-
karyotes (Supplemental Fig. S6A). They
were detected at all of the 66 sampling
stations of the Tara Oceans cruise ana-
lyzed in this study and were mainly at-
tributed to the pico-eukaryote size
fraction (0.8–5 µm) (Supplemental Fig.
S7). Forty-six DSYB-related unigenes
were detected in 20 different MGTs, and
their expression in 10 out of 20 MGTs
represented more than 10% of the total
DSYB expression in at least one sample.
This further confirms the importance of
the organisms related to these MGTs in
the DMSP production (Fig. 4A). Two
MGTs affiliated to the genus Phaeocystis
(MGT-4 and MGT-13) were prevalent
(up to 45% of the total DSYB expression
B signal) at the Southern Ocean stations
(82–85), whereas a Haptophyte-related
organism (MGT-29) was prevalent (from
10% to 35%, depending on the size frac-
tion) at station 80 in the southern
Atlantic. Phaeocystis-affiliated MGTs dem-
onstrated high levels of DSYB expression
both in the small size fraction (0.8–5
µm, corresponding to individual cells)
and in large size fractions (20–180 and
180–2000 µm, corresponding to multicel-
lular colonies which may form during P.
Figure 3. The pangenomes of (A) Bathycoccus prasinos and (B) Oithona nana compared to available se- antarctica blooms [Carlson et al. 1998;
quenced references. Each layer represents an MGT, a reference genome, or transcriptome. Gene clusters Smith et al. 1998; Wang et al. 2018]). A
are organized based on their distribution across samples. The dendrogram in the center organizes gene
large portion of the total DSYB expression
clusters based on their presence or absence in the samples. The top right dendrogram represents the hi-
erarchical clustering of the samples based on the abundance of gene clusters. (ANI) Average nucleotide (from 10% to 70%) was also attributed
identity, (SCG) single-copy core genes, (GC) gene cluster. to the Chloropicophyceae lineage (pre-
viously referred to as Prasinophytes clade
VII) (Lopes Dos Santos et al. 2017a,b;
Turmel et al. 2019): MGT-44 at the
(DMS), the largest natural source of sulfur to the atmosphere. This Pacific Ocean stations (93, 102, 109, 110, 122–125, 128, 136, 137,
compound is also important from an organismal point of view 139, and 144) and MGT-166 and MGT-179 at the Indian Ocean sta-
because of its ability to act as an osmolyte, antioxidant, predator tions (36, 38, 39, and 41). In addition to these differences in their
deterrent, and cryoprotectant in phytoplankton (Stefels et al. geographical distribution, MGT-166 and MGT-179 shared more ge-
2007; Bullock et al. 2017). nomic similarity between them (ANI = 95.23%), whereas MGT-44
We investigated the expression patterns and geographical dis- was more distantly related (ANI = 86.86 and ANI = 85.97% with
tribution of the genes involved in the production and degradation MGT-166 and MGT-179, respectively), suggesting that the former
of DMSP across Tara Oceans stations. While the role of bacteria in two may represent closely related organisms and the third one cor-
DMSP cycling is well described (Reisch et al. 2011; Johnston et al. responds to a different transcriptome. However, given the small
2016; Bullock et al. 2017; Curson et al. 2017), recent identification number of available Chloropicophyceae-related references in DNA
of eukaryote counterpart genes (1) DSYB, coding for a methyl-thi- databases, this hypothesis requires further investigation.
ohydroxybutyrate methyltransferase, a key enzyme involved in It is well established that organisms from the classes
the DMSP synthesis in eukaryotes (Curson et al. 2018), and (2) Dinophyceae (dinoflagellates) and Prymnesiophyceae (coccolitho-
Alma1 coding for dimethylsulfoniopropionate lyase 1, an enzyme phores) are major producers of DMSP, but only few studies are avail-
responsible for the cleavage of DMSP into dimethyl sulfide and ac- able that investigate the involvement of Chloropicophyceae in
rylate (Alcolombri et al. 2015; Johnson et al. 2016), allows investi- DMSP production (Keller 1989; Keller et al. 1989; Kiene et al.
gation of the role of marine phytoplankton in the global DMSP 1997). Our data suggest that there are at least two distinct represen-
cycle. Both of these genes were detected in the MGT collection, tatives of Chloropicophyceae involved in DMSP biosynthesis and
Genome Research 5
www.genome.orgDownloaded from genome.cshlp.org on November 29, 2020 - Published by Cold Spring Harbor Laboratory Press
Vorobev et al.
A B
Figure 4. Comparison of the DSYB (A) and Alma1 (B) relative gene expression per sample (x-axis) and per MGT (y-axis) across samples. Numbers near
each point represent a Tara Oceans station. (SRF) Surface, (DCM) deep chlorophyll maximum. Y-axis (to the left of panel A) and size fractionation (to the
right of panel B) are common for both figures. Tara Oceans provinces are applicable to both graphs and are specified on the right side of panel B. (ATLN)
North Atlantic Ocean, (ATLS) South Atlantic Ocean, (SO) Southern Ocean, (INDIAN) Indian Ocean, (MEDIT) Mediterranean Sea, (PACN) North Pacific
Ocean, and (PACS) South Pacific Ocean. (A) DSYB expression profiles across Tara Oceans stations and size fractions for 10 MGTs contributing significantly
to the overall DSYB expression (at least 10% of the total DSYB expression in at least one sample). Red circles (MGT-4 and MGT-13) represent MGTs taxo-
nomically assigned to the genus Phaeocystis; green circles (MGT-44, MGT-166, and MGT-179) represent Chloropicophyceae-affiliated MGTs; the rest of
the circles represent other organisms. (B) Alma1 expression profiles across Tara Oceans stations and size fractions for nine MGTs contributing significantly to
the overall Alma1 expression (at least 10% of the total Alma1 expression in at least one sample). Red circles (MGT-4, MGT-13, and MGT-67) represent MGTs
taxonomically assigned to the genus Phaeocystis; yellow circles (MGT-178) represent Pelagomonas spp.-affiliated MGTs; and the rest of the circles represent
other organisms.
provide preliminary results on a possible pathway for DMSP produc- were taxonomically assigned to Phaeocystis (MGT-4, MGT-13,
tion in this group. and MGT-67) and Pelagomonas spp. (MGT-178).
We also investigated the expression of the Alma1 gene coding
for a key enzyme of the DMSP degradation pathway (Alcolombri
et al. 2015). We detected 1059 Alma1-related unigenes in the Identification of interspecies associations
MATOU-v1 catalog (Supplemental Fig. S6B). The expression of We investigated the interspecies relationship between an unculti-
these unigenes was detected mostly in the smallest size fraction vated diazotrophic unicellular cyanobacterium Candidatus
(0.8–5 µm) at both depths (surface and DCM) at 66 sampled sta- Atelocyanobacterium thalassa (Zehr et al. 2008; Thompson et al.
tions (Supplemental Fig. S8). No taxonomic affiliation was found 2012) and a haptophyte picoplankton alga Braarudosphaera bigelo-
for 153 Alma1 unigenes. The highest levels of Alma1 abundance wii (B. bigelowii) from the class Prymnesiophyceae. Both members
and expression were detected at the Southern Ocean stations of this association are abundant and widely distributed in the
(Supplemental Fig. S8). Thirty-six Alma1-related unigenes were de- ocean and are ecologically relevant because of their ability to fix
tected in 13 MGTs. Most of these Alma1 unigenes were taxonom- N2 (Zehr and Kudela 2011; Farnelid et al. 2016). Several UCYN-A
ically affiliated to the clade Alveolates (78%), followed by the genomes have been previously sequenced (Tripp et al. 2010;
family Haptophyceae (5%). However, 30 out of the 36 Alma1-relat- Bombar et al. 2014), whereas no genomic information is currently
ed unigenes present in the MGT collection were concentrated in available for the algal host.
six MGTs taxonomically assigned to Haptophytes. Even though Detected in the MATOU-v1 catalog were 2616 UCYN-A-affil-
48 MGTs possessed unigenes assigned to Alveolates, we did not iated unigenes (see Methods). They were distributed among 41
detect any Alma1-containing MGTs affiliated to this group. In Tara Oceans stations and were mostly present in the small size frac-
nine out of 13 MGTs containing Alma1 unigenes, Alma1 expres- tion (0.8–5 µm). The majority of the UCYN-A-affiliated unigenes
sion contributed more than 10% (in some cases, up to 40%) to (96%) were detected in two MGTs: 1742 unigenes in MGT-29
the total Alma1 expression detected across 43 samples (Fig. 4B). and 771 unigenes in MGT-176 (Supplemental Fig. S9). In addition
MGTs demonstrating the highest levels of Alma1 expression to the unigenes affiliated with the diazotrophic cyanobacterium,
6 Genome Research
www.genome.orgDownloaded from genome.cshlp.org on November 29, 2020 - Published by Cold Spring Harbor Laboratory Press
Reconstruction of marine eukaryotic transcriptomes
MGT-29 also possessed ∼20,000 unigenes taxonomically assigned tose phosphate pathway, the GS-GOGAT cycle (ammonium assim-
to the Haptophyte clade and possibly representing the eukaryotic ilation through sequential actions of glutamine synthetase [GS]
host of this symbiosis, a Prymnesiophyte closely related to B. bige- and glutamate synthase [GOGAT]), as well as multiple genes affil-
lowii. Together with the observation that the host’s 18S rDNA V4 iated with the metabolism of fatty acids and amino acids. We also
region was identified in the same samples as MGT-29, this suggests observed the presence of the gene bacA, coding for the ABC trans-
that the non-UCYN-A-affiliated genes of MGT-29 may be a part of porter involved in the transport of vitamin B12.
the transcriptome of the host. Comparison of the MGTs compris- In addition to the UCYN-A symbiosis with a single-celled
ing UCYN-A-related unigenes with reference genomes (Tripp et al. haptophyte, we detected other known microbial associations in
2010; Bombar et al. 2014) and metagenome-assembled genomes the MGT collection (Supplemental Table S4). For example, MGT-
(MAGs) (Parks et al. 2017; Delmont et al. 2018) demonstrated 738 partially captured an association between a diatom from the
that MGT-29 unigenes covered 90.3% of the UCYN-A1 genome class Coscinodiscophyceae (47 unigenes) and the nitrogen-fixing
(Fig. 5). The estimated completeness of the UCYN-A genome com- heterocystous cyanobacteria, Richelia intracellularis (132 unigenes),
puted based on a set of 139 bacterial-specific single-copy core an abundant organism in tropical and subtropical waters (Janson
genes (Campbell et al. 2013) was 82.7% for MGT-29 and 42.4% et al. 1999; Lyimo 2011). This MGT collection also detected an as-
for MGT-176. The ANI value between MGT-29 and UCYN-A1 iso- sociation between a pennate diatom from the family Bacillariaceae
late ALOHA was 99.7%, which indicates a high genomic similarity. and a tintinnid ciliate, genes from both of which were detected in
We hypothesize that MGT-176 may represent UCYN-A2 or anoth- MGT-136 (243 and 192 unigenes affiliated to the diatom and tin-
er UCYN-A sublineage, because the ANI analysis demonstrated its tinnid, respectively) (Vincent et al. 2018).
higher genomic similarity with isolate SIO64986 (UCYN-A2) than
isolate ALOHA (UCYN-A1) (97.1% and 94.3%, respectively).
In addition to the UCYN-A-related genes, MGT-29 also con-
Discussion
tained multiple core metabolism genes taxonomically assigned Many eukaryotic lineages of ocean plankton remain largely under-
to the Haptophyte clade which may belong to the eukaryotic sampled, and as a result, there are few sequenced representatives
host of this symbiotic association, B. bigelowii (Supplemental for many ecologically important marine eukaryotic organisms. The
Data Set S2). More specifically, we detected genes coding for en- MGT collection reported here represents a valuable resource for
zymes driving major metabolic pathways in the haptophyte algae studying a range of eukaryotic planktonic organisms, including
including glycolysis, the tricarboxylic acid (TCA) cycle, the pen- those that are largely unexplored using traditional omics techniques.
The gene clustering approach ap-
plied here provides an organism-centric
view of the most abundant plankton
populations. This approach allowed us
to focus on the diversity and functional
potential of marine eukaryotic organisms
across major taxonomic lineages. The 924
MGTs generated from the Tara Oceans
data sets contain an impressive diversity
of taxa, allowing for comparative geno-
mic studies in major eukaryotic groups,
including Opisthokonta, Haptophytes,
Stramenopiles, Alveolates, Archaeplas-
tida, and Rhizaria (Fig. 1). Additionally,
this collection of MGTs provides the first
glimpse of the genomic content of a vari-
ety of organisms currently not available in
culture, including copepods, one of the
most prevalent zooplankton of the photic
open ocean. Only a small number of
MGTs have closely related cultured refer-
ences, suggesting that many MGTs repre-
sent organisms which have only distant
relatives within the publicly available col-
lections of sequenced genomes or tran-
scriptomes. These MGTs provide access
to valuable genomic information current-
ly not accessible through other DNA-
based resources. For example, limited
availability of full genomes or transcrip-
Figure 5. The pangenomes of MGT-29 and MGT-176 compared to available reference sequences of tomes representing heterotrophic organ-
UCYN-A. Each layer represents an MGT, a reference genome, or a MAG. Gene clusters are organized isms prevents advances in studying their
based on their distribution across samples. The dendrogram in the center organizes gene clusters based
distribution, population structure, and
on their presence or absence in the samples. The top right dendrogram represents the hierarchical clus-
tering of the samples based on the ANI values. (ANI) Average nucleotide identity, (SCG) single-copy core functional potential. Access to the zoo-
genes. plankton transcriptomes through the
Genome Research 7
www.genome.orgDownloaded from genome.cshlp.org on November 29, 2020 - Published by Cold Spring Harbor Laboratory Press
Vorobev et al.
MGT collection will increase our knowledge on their biogeography et al. 2017). MGT-29 from our collection encompasses genes sim-
and complement the general lack of references for the copepods ilar to those from UCYN-A1 strain ALOHA and genes taxonomical-
group. Alternatively, the analysis of the MGTs closely related to ly affiliated with the Haptophyte clade potentially representing
organisms which have sequenced representatives may lead to a re- the eukaryotic host. This suggests that MGT-29 may represent
evaluation of their genomic potential and provide additional infor- UCYN-A1 specifically associated with a closely related to B. bigelo-
mation on their ecology. wii prymnesiophyte. More information is needed about the geno-
mic content of the host cells for different UCYN-A sublineages to
DMSP biosynthesis and degradation by eukaryotes confidently state which symbiosis was detected.
No genomic information is available about these symbiotic
We demonstrated the ability of the MGT approach to assess the
hosts beyond 18S rRNA sequences (Hagino et al. 2013). As a result,
contribution of eukaryotic plankton to ecologically important
many questions remain unanswered regarding the evolution of
processes by focusing on the MGTs expressing genes coding for
this symbiosis and the exact nature of the relationship between
key enzymes involved in DMSP cycling. These genes included
the two organisms. Through partial reconstruction of the host
DSYB, coding for a methyl-thiohydroxybutyrate methyltransfer-
transcriptome, we provide the first glimpse of its genomic content,
ase, a key enzyme of the eukaryotic DMSP synthesis pathway
which will change the way in which this interspecies association
(Curson et al. 2018) and Alma1 coding for dimethylsulfoniopro-
can be studied. Better methods are needed for the accurate target-
pionate lyase 1, an algal enzyme that cleaves DMSP into DMS and
ing of distinct UCYN-A/host associations, which will improve the
acrylate (Alcolombri et al. 2015). We revealed the importance of
understanding of the evolution and ecological characteristics of
Phaeocystis spp. in the Southern Ocean as potential DMSP pro-
this symbiosis. Access to the genomic content of the host through
ducers and degraders. Our data also indicated the involvement
the MGT collection, used in conjunction with the two closed
of at least two representatives from Chloropicophyceae in the
UCYN-A genomes currently available in the databases (Tripp
biosynthesis of DMSP. One of them was primarily active at the ol-
et al. 2010; Bombar et al. 2014), will provide a much-needed
igotrophic equatorial Pacific stations, while the other one ap-
push in this direction.
peared to be restricted to the low oxygen stations (the Arabian
Other ecologically important microbial associations were de-
basin and upwelling stations in the East Pacific). However, in-
tected in the MGT collection. The diatom-cyanobacteria symbiotic
volvement of Chloropicophyceae in DMSP production is current-
populations captured in the MGT-738 which were previously
ly supported only by circumstantial evidence, mostly in early
observed in all major ocean basins (Foster and O’Mullan 2008)
studies (Keller 1989; Keller et al. 1989; Kiene et al. 1997), which
may encompass diatoms from several genera, including
demonstrates a clear need for more sequenced references of this
Hemiaulus, Rhizosolenia, and Chaetoceros. These associations may
group of organisms. Our results also support recent findings stat-
contribute as much new nitrogen (N) as the free-living diazotroph
ing that picoeukaryotes should be considered as important con-
Trichodesmium, which is widely regarded as the most important
tributors to DMSP production through the DSYB pathway
player responsible for N2 fixation in the open ocean (Capone
(Curson et al. 2018). These organisms may represent interesting
et al. 2008). It was reported that the contribution of the diatom
targets for the experimental validation of their role in the global
symbioses to the global pool of N had been underestimated and
biogeochemical sulfur cycle and their impact on climate change
that they should be included in global N models (Foster et al.
as proposed in the CLAW hypothesis (Charlson et al. 1987;
2011). In order to accurately do so, additional information on their
Ayers and Cainey 2007). Thus, the MGT approach allowed us
genomic potential is required and can be accessed through the
to identify candidate organisms responsible for a large part of
MGT collection.
the eukaryotic DMSP biosynthesis and catabolism in the different
Little is known about the nature of a diatom-tintinnid associ-
regions of the open ocean.
ation detected in MGT-136. One hypothesis suggests a mutualistic
Presence of different dominating groups of organisms in-
symbiosis, where diatoms acquire increased motility and tintin-
volved in the DMSP cycling across oceanic regions suggests the im-
nids benefit from silicification through increased protection
portance of environmental conditions in shaping microbial
(Vincent et al. 2018). Other data indicate that the tintinnid can
community composition that defines the DMSP fate in the ocean.
be the only beneficiary of the association, whereas the diatom
If environmental conditions change in a given ecological niche,
would play the role of the “victim” (Armbrecht et al. 2017).
we may expect that DMSP production and degradation rates would
Recent studies suggest that diatom–tintinnid associations may be
also change because of the transformations in the microbial com-
more common in the ocean than previously thought. However,
munity structure, which may lead to significant effects on climate
their global ecological and biogeographical patterns remain poorly
change.
characterized (references within Vincent et al. 2018).
The MGT collection provides a valuable resource for the eval-
Interspecies associations uation of these ecologically relevant associations by studying their
The importance of the MGT collection as a resource for studying distribution in major oceanic provinces and by exploring the ex-
marine interspecies interactions was demonstrated through detec- pression patterns of key genes. These findings illustrate the ability
tion of the ecologically relevant symbiosis between the metaboli- of the MGT collection to depict more interspecies relationships in
cally streamlined nitrogen-fixing cyanobacterium UCYN-A and a the ocean, thus potentially discovering previously unknown mi-
single-celled haptophyte picoplankton alga. Initially, this symbio- crobial associations (Supplemental Table S4), as well as to study
sis was discovered using a targeted approach that involved several their gene expression patterns.
culture-dependent and molecular techniques, proving it to be a
challenging task (Zehr et al. 2017). Several UCYN-A sublineages
have been defined, but limited information is currently available Fragmentation of the MGTs
regarding their global distribution and, for some, the identity of In addition to the MGTs, comprised of tens of thousands of uni-
the host (Thompson et al. 2014; Farnelid et al. 2016; Turk-Kubo genes, some of which cover eukaryotic reference transcriptomes
8 Genome Research
www.genome.orgDownloaded from genome.cshlp.org on November 29, 2020 - Published by Cold Spring Harbor Laboratory Press
Reconstruction of marine eukaryotic transcriptomes
with a high level of completeness, we also detected a number of Methods
smaller gene clusters which cannot reliably cover a full eukaryotic
transcriptome. Several reasons may lead to the presence of these Sampling of eukaryotic plankton communities
smaller MGTs representing partial eukaryotic transcriptomes. In The samples were collected during the 2009–2013 Tara Oceans
some cases, not all of the genes from a specific organism can expeditions from all the major oceanic provinces except the
be detected in all of the samples where this organism is present Arctic. For the majority of stations, samples were collected from
—some genes may be missing or present at levels below the two depths in the photic zone: subsurface and deep-chlorophyll
achieved sequence coverage. This may lead to the fragmentation maximum. Planktonic eukaryotic communities were collected in
of the MGTs, i.e., to the fact that genes from the same organism the 0.8- to 2000-µm range and divided into four size fractions
may be allocated to multiple CAGs and MGTs of various sizes (0.8–5 µm, 5–20 µm, 20–180 µm, and 180–2000 µm). A detailed
(comprised of a different number of unigenes). Several possible description of the sampling strategies and protocols is available
scenarios exist: (1) Some accessory genes may be present and ex- in the Supplemental Material and in Pesant et al. (2015).
pressed in some subpopulations and missing in others; or (2) a Biogeochemical data measured during the expedition are available
sufficient sequencing depth was not achieved for some of the in the Supplemental Material and in the Pangaea database (https://
samples, resulting in only a partial genomic coverage. Thus, for www.pangaea.de/).
organisms with sequencing depths below or near the limit of DNA and RNA libraries were constructed and sequenced as
detailed in Alberti et al. (2017) and processed as described in
detection, some genes may lack corresponding reads, which
Carradec et al. (2018). Briefly, the raw data were filtered and
would lead to incomplete coverage of the transcriptome by meta-
cleaned to remove low-quality reads, adapters, primers, and ribo-
genomic reads. The situation when several CAGs of various sizes
somal RNA-like reads. Resulting metatranscriptomic reads were as-
represent the same organism has been observed for the prokary-
sembled using Velvet v.1.2.07 (Zerbino et al. 2009) with a k-mer
otic compartment of a human gut microbiome (Nielsen et al. size of 63. Isoform detection was performed using Oases
2014). 0.2.08 (Schulz et al. 2012). Contigs smaller than 150 bp were re-
moved from further analysis. The longest sequence from each
cluster of contigs was kept as a reference for the gene catalog.
Limitations and advantages of the MGT method
The MATOU-v1 unigene catalog is accessible at https://www
General limitations relevant to interpreting the gene co-abun- .genoscope.cns.fr/tara/.
dance data obtained using the MGT approach described here in-
clude its inability to incorporate the accessory genes in the Abundance computing and canopy clustering
analysis due to their inherent nature of not being present in all
The raw metagenomic (metaG) reads from 365 samples were
strains and its intrinsic inability to segregate organisms that form
mapped against the MATOU-v1 catalog as described in Carradec
obligate symbioses because of their identical gene co-abundance
et al. (2018). Briefly, raw metagenomic reads from each sample
profiles.
were compared with the MATOU-v1 unigenes using the BWA
A recently developed computational tool may solve the for-
tool (version 0.7.4) (Li and Durbin 2009), and those covering at
mer problem (Plaza Oñate et al. 2019), although further analyses least 80% of the read length with at least 95% of identity were re-
on environmental data sets are needed to confirm its accuracy tained for further analysis. In the case of several possible best
and efficiency. Alternatively, postprocessing of the MGT collec- matches, a random one was picked. For each unigene in each sam-
tion using methods based on differential sequence coverage of ple, the metagenomic abundance was determined in RPKM (reads
genes may be effective in cases where a significant bias in genome per kilo base per million of mapped reads). To improve the cluster-
copy number of the associated organisms exists. Another caveat ing efficiency, we selected unigenes detected with metagenomic
specific to our data sets is that genes expressed below the level of reads in at least three different samples and which had no more
detection may be overlooked because the gene reconstruction than 90% of their total genomic occurrence signal in a single
has been performed using the metatranscriptomics data. sample. These two criteria are the default parameters of the
However, the MGT approach has a number of advantages com- canopy clustering tool (‐‐filter_min_obs 3 and ‐‐filter_max_top3_
pared to other metagenome and metatranscriptome assembly sample_contribution = 0.9). The metagenomic RPKM-based abun-
methods. These include: (1) access to genomic content of organ- dance matrix of these unigenes was submitted to the canopy clus-
isms not available in culture (including zooplankton species) tering algorithm described in Nielsen et al. (2014) (the original
because of the culture-independent assembly and clustering of se- code is available in Supplemental Code and at https://www
quence data; and (2) de novo definition of gene clusters which al- .genoscope.cns.fr/tara/), which is a density-based clustering that
lows for the reconstruction of transcriptomes with no need for does not take into account the sequence composition, as opposed
to most binning tools. We used a max Pearson’s correlation differ-
references.
ence of 0.1 to define clusters, and then clusters were merged if can-
In this study, we applied a gene co-abundance clustering ap-
opy centroids’ distances were smaller than 0.05 (250 k iterations,
proach on a series of samples provided by the Tara Oceans expedi-
default parameters).
tion and demonstrated its efficiency for reconstructing high-
A total of 7,254,163 unigenes were clustered into 11,846 co-
quality eukaryotic transcriptomes. The resulting MGT collection abundant gene groups of at least two unigenes. CAGs with more
provides a valuable resource for a comprehensive analysis of the than 500 unigenes are hereafter termed metagenomics-based tran-
eukaryotic plankton in the open sunlit ocean by providing access scriptomes. Nine hundred twenty-four MGTs were generated
to biogeography, genomic content, and functional potential of which encompassed 6,946,068 unigenes (95.8%). Since this meth-
many ecologically relevant eukaryotic species. This universal od has never been applied to eukaryotic data, a smaller cutoff of
methodological framework can be implemented for transcriptome 500 unigenes was used (compared to the original method applied
reconstruction of microscopic eukaryotic organisms in any envi- to prokaryote-dominated communities [Nielsen et al. 2014]) to in-
ronment provided that both metagenomic and metatranscrip- crease the number of resulting MGTs potentially representing indi-
tomic data are available. vidual organisms. For each sampling filter, we determined the
Genome Research 9
www.genome.orgDownloaded from genome.cshlp.org on November 29, 2020 - Published by Cold Spring Harbor Laboratory Press
Vorobev et al.
fraction of metagenomics reads captured by the unigenes that Comparison with reference transcriptomes
compose the MGTs (Supplemental Fig. S2).
To assess the biological validity of the resulting MGT, the reference
transcriptomes of Bathycoccus prasinos from the MMETSP database
Taxonomic assignment (release of 2014-07-30 [Keeling et al. 2014]) and the reference tran-
Taxonomic assignment of the unigenes is described in Carradec scriptome of Oithona nana from Genoscope (Madoui et al. 2017)
et al. (2018). Briefly, to determine a taxonomic affiliation for were used. Sequence similarities between the unigenes and the ref-
each of the unigenes, a reference database was built from erence transcriptomes were computed in protein space using
UniRef90 (release of 2014–09–04) (Suzek et al. 2015), the DIAMOND (version 0.7.9) (Buchfink et al. 2015) with the follow-
MMETSP project (release of 2014–07–30) (Keeling et al. 2014), ing parameters: -e 1Ee-5 -k 500 -a 8, and positive matches were de-
and Tara Oceans Single-cell Amplified Genomes (PRJEB6603). fined as ≥95% identity over at least 50 amino acids.
The database was supplemented with three Rhizaria trans-
criptomes (Collozoum, Phaeodaea, and Eucyrtidium), available Identification of potential interspecies interactions
through the European Nucleotide Archive under the reference We screened the MGT collection for potential interspecies associ-
PRJEB21821 (https://www.ebi.ac.uk/ena/data/view/PRJEB21821) ations by focusing on the MGTs that meet two criteria: (1) These
and transcriptomes of Oithona nana (Madoui et al. 2017), available MGTs must contain at least 10 unigenes from two different sub-
through the European Nucleotide Archive under the reference kingdom taxonomic units; and (2) the number of unigenes associ-
PRJEB18938 (https://www.ebi.ac.uk/ena/data/view/PRJEB18938). ated with one of these taxonomic units must account for at least
Sequence similarities between the gene catalog and the reference 5% of the number of unigenes associated with the other taxonom-
database were computed in protein space using DIAMOND (ver- ic unit. For example, MGT-29 contains 19,652 unigenes assigned
sion 0.7.9) (Buchfink et al. 2015) with the following parameters: to Haptophyceae and 1940 unigenes (9.9%) assigned to cyanobac-
-e 1E-5 -k 500 -a 8 ‐‐more-sensitive. Taxonomic affiliation was per- teria. All the MGTs that met these criteria are listed in
formed using a weighted Lowest Common Ancestor approach. Supplemental Table S4. See Supplemental Material for more detail.
Subsequently, for each MGT, representative taxonomic level was
determined by computing the deepest taxonomic node covering
Statistical analysis
at least 75% of the taxonomically assigned unigenes of that MGT.
All statistical analyses and graphical representations were conduct-
ed in R (v 3.3.2) (R Core Team 2019) with the R package ggplot2
Completeness and contamination assessment
(v 2.2.1). The taxonomic dendrogram shown in Figure 1 was built
For each MGT, unigenes were further assembled using CAP3 (ver- using the phyloT and NCBI Taxonomy (https://www.ncbi.nlm
sion date: 02/10/15) (Huang and Madan 1999). Assembled contigs .nih.gov/taxonomy) toolkits of the Python ETE3 package and visu-
and singletons were pooled, and completeness and contamination alized using iTOL (Letunic and Bork 2016). The world maps were
were computed using the Anvi’o package (ver 5.2) (Eren et al. obtained using the R packages grid (v 3.3.2) and maps (v 3.2.0).
2015) with default parameters and a set of 83 protistan-specific sin- Inkscape 0.92.3 was used to finalize the figures.
gle-copy core genes (Simão et al. 2015) for eukaryotes or a set of
139 bacterial-specific single-copy core genes (Campbell et al.
2013) for bacteria (Supplemental Table S1). Average nucleotide Data access
identity was computed using the dnadiff tool from the MUMmer Sequencing data generated in this study have been submitted to
package (ver 3.23) (Kurtz et al. 2004). the European Nucleotide Archive (ENA; https://www.ebi.ac.uk/
ena) under accession number PRJEB4352 for the metagenomics
Functional characterization data and PRJEB6609 for the metatranscriptomics data. The uni-
DSYB-related unigenes were identified using Hidden Markov gene catalog generated in this study has been submitted to the
Models (HMMs) generated from 135 sequences extracted from ENA under accession number ERZ480625. The MGT collection
Curson et al. (2018). These sequences were clustered using data and environmental data are available in Supplemental
MMseqs2 (Steinegger and Söding 2017), and for each of the result- Material in Supplemental Data Set S1, at https://www.genoscope
ing 24 clusters, sequences were aligned using MUSCLE (Edgar .fr/tara/, and in the Pangaea database (https://www.pangaea.de/).
2004). HMM construction and unigenes catalog scanning were MGT nucleic sequences in FASTA format and MGT post-assemblies
performed using HMMer (Wheeler and Eddy 2013). The DSYB generated through CAP3 are available at https://www.genoscope
HMM profile had significant matches (e-value ≤ 10−50) with 1220 .fr/tara/. See Supplemental Material for more detail.
unigenes in the MATOU-v1 catalog, 46 of which were found in
the MGT collection (Supplemental Table S3). Competing interest statement
Alma1-related unigenes were identified using HMMs generat-
ed from five sequences with demonstrated DMSP lyase activity, ex- The authors declare no competing interests.
tracted from Alcolombri et al. (2015). These sequences were
clustered using MMseqs2 (Steinegger and Söding 2017), and for
each of the two resulting clusters, sequences were aligned using
Acknowledgments
MAFFT v7.407 (Katoh and Standley 2013). HMM construction We thank the following people and sponsors whose commitment
and unigenes catalog scanning were performed using HMMer made this singular expedition possible: Centre National de la
(Wheeler and Eddy 2013). We identified 1069 positive unigenes Recherche Scientifique (CNRS) (in particular, Groupement de
(e ≤ 10−50) from the MATOU-v1 catalog; 36 of them were found Recherche GDR3280), the European Molecular Biology Laboratory
in the MGT collection (Supplemental Table S3). (EMBL), Genoscope/CEA (Commissariat à l’Énergie Atomique
Unigene expression values were computed in RPKM. The ex- et aux Énergies Alternatives), the French Government
pression of DSYB- and Alma1-related unigenes was normalized to “Investissement d’Avenir” programs Oceanomics (ANR-11-BTBR-
the total number of reads mapped to a given MGT and to the total 0008), and FRANCE GENOMIQUE (ANR-10-INBS-09), Fund for
number of reads in a given sample (Fig. 4). Scientific Research – Flanders, VIB, Stazione Zoologica Anton
10 Genome Research
www.genome.orgDownloaded from genome.cshlp.org on November 29, 2020 - Published by Cold Spring Harbor Laboratory Press
Reconstruction of marine eukaryotic transcriptomes
Dohrn, UNIMIB, agnès b., the Veolia Environment Foundation, Curson ARJ, Liu J, Bermejo Martínez A, Green RT, Chan Y, Carrión O,
Region Bretagne, World Courier, Illumina, Cap L’Orient, the EDF Williams BT, Zhang S-H, Yang G-P, Bulman Page PC, et al. 2017.
Dimethylsulfoniopropionate biosynthesis in marine bacteria and iden-
Foundation EDF Diversiterre, FRB, the Prince Albert II de Monaco tification of the key gene in this process. Nat Microbiol 2: 17009. doi:10
Foundation, Etienne Bourgois, the Tara schooner and its captain .1038/nmicrobiol.2017.9
and crew. Tara Oceans would not exist without continuous support Curson ARJ, Williams BT, Pinchbeck BJ, Sims LP, Martínez AB, Rivera PPL,
from 23 institutes (https://oceans.taraexpeditions.org). We also Kumaresan D, Mercadé E, Spurgin LG, Carrión O, et al. 2018. DSYB ca-
thank C. Scarpelli for support in high-performance computing. talyses the key step of dimethylsulfoniopropionate biosynthesis in
many phytoplankton. Nat Microbiol 3: 430–439. doi:10.1038/s41564-
Computations were performed using the platine, titane, and curie 018-0119-5
HPC machine provided through Grand Équipement National de Delmont TO, Quince C, Shaiber A, Esen ÖC, Lee ST, Rappé MS, McLellan SL,
Calcul Intensif (GENCI) grants (t2011076389, t2012076389, Lücker S, Eren AM. 2018. Nitrogen-fixing populations of
t2013036389, t2014036389, t2015036389, and t2016036389). Planctomycetes and Proteobacteria are abundant in surface ocean meta-
genomes. Nat Microbiol 3: 804–813. doi:10.1038/s41564-018-0176-9
This article is contribution number 104 of Tara Oceans.
De Vargas C, Audic S, Henry N, Decelle J, Mahé F, Logares R, Lara E, Berney
Author contributions: A.V., P.W., and E.P. designed the re- C, Le Bescot N, Probert I, et al. 2015. Eukaryotic plankton diversity in the
search; A.V., Q.C., and E.P. generated the data; A.V., M.D., Q.C., sunlit ocean. Science 348: 1261605. doi:10.1126/science.1261605
A.A., T.O.D., and E.P. analyzed the data; and A.V. and E.P. wrote Dick GJ, Andersson AF, Baker BJ, Simmons SL, Thomas BC, Yelton AP,
the paper, with assistance from all authors. All authors approved Banfield JF. 2009. Community-wide analysis of microbial genome se-
quence signatures. Genome Biol 10: R85. doi:10.1186/gb-2009-10-8-r85
the final manuscript. Dortch Q, Packard TT. 1989. Differences in biomass structure between oligo-
trophic and eutrophic marine ecosystems. Deep Sea Res Part Oceanogr Res
Pap 36: 223–240. doi:10.1016/0198-0149(89)90135-0
Edgar RC. 2004. MUSCLE: multiple sequence alignment with high accuracy
References and high throughput. Nucleic Acids Res 32: 1792–1797. doi:10.1093/
nar/gkh340
Alberti A, Poulain J, Engelen S, Labadie K, Romac S, Ferrera I, Albini G, Aury
Eren AM, Esen ÖC, Quince C, Vineis JH, Morrison HG, Sogin ML, Delmont
JM, Belser C, Bertrand A, et al. 2017. Viral to metazoan marine plankton
nucleotide sequences from the Tara Oceans expedition. Sci Data 4: TO. 2015. Anvi’o: an advanced analysis and visualization platform for
170093. doi:10.1038/sdata.2017.93 ‘omics data. PeerJ 3: e1319. doi:10.7717/peerj.1319
Albertsen M, Hugenholtz P, Skarshewski A, Nielsen KL, Tyson GW, Nielsen Farnelid H, Turk-Kubo K, Muñoz-Marín MdC, Zehr JP. 2016. New insights
PH. 2013. Genome sequences of rare, uncultured bacteria obtained by into the ecology of the globally significant uncultured nitrogen-fixing
differential coverage binning of multiple metagenomes. Nat Biotechnol symbiont UCYN-A. Aquat Microb Ecol 77: 125–138. doi:10.3354/
31: 533–538. doi:10.1038/nbt.2579 ame01794
Alcolombri U, Ben-Dor S, Feldmesser E, Levin Y, Tawfik DS, Vardi A. 2015. Foster RA, O’Mullan GD. 2008. Nitrogen-fixing and nitrifying symbioses in
Identification of the algal dimethyl sulfide-releasing enzyme: a missing the marine environment. In Nitrogen in the marine environment, 2nd ed.
link in the marine sulfur cycle. Science 348: 1466–1469. doi:10.1126/sci (ed. Capone DG, et al.), pp. 1197–1218. Academic Press, San Diego.
ence.aab1586 Foster RA, Kuypers MMM, Vagner T, Paerl RW, Musat N, Zehr JP. 2011.
Armbrecht LH, Eriksen R, Leventer A, Armand LK. 2017. First observations Nitrogen fixation and transfer in open ocean diatom–cyanobacterial
of living sea-ice diatom agglomeration to tintinnid loricae in East symbioses. ISME J 5: 1484–1493. doi:10.1038/ismej.2011.26
Antarctica. J Plankton Res 39: 795–802. doi:10.1093/plankt/fbx036 Gallienne CP, Robins DB. 2001. Is Oithona the most important copepod in
Ayers GP, Cainey JM. 2007. The CLAW hypothesis: a review of the major de- the world’s oceans? J Plankton Res 23: 1421–1432. doi:10.1093/plankt/
velopments. Environ Chem 4: 366–374. doi:10.1071/EN07080 23.12.1421
Boeuf D, Edwards BR, Eppley JM, Hu SK, Poff KE, Romano AE, Caron DA, Gasol JM, del Giorgio PA, Duarte CM. 1997. Biomass distribution in marine
Karl DM, DeLong EF. 2019. Biological composition and microbial dy- planktonic communities. Limnol Oceanogr 42: 1353–1363. doi:10.4319/
namics of sinking particulate organic matter at abyssal depths in the ol- lo.1997.42.6.1353
igotrophic open ocean. Proc Natl Acad Sci 116: 11824–11832. doi:10 Hagino K, Onuma R, Kawachi M, Horiguchi T. 2013. Discovery of an endo-
.1073/pnas.1903080116 symbiotic nitrogen-fixing cyanobacterium UCYN-A in Braarudosphaera
Bombar D, Heller P, Sanchez-Baracaldo P, Carter BJ, Zehr JP. 2014. bigelowii (Prymnesiophyceae). PLoS One 8: e81749. doi:10.1371/journal
Comparative genomics reveals surprising divergence of two closely re- .pone.0081749
lated strains of uncultivated UCYN-A cyanobacteria. ISME J 8: 2530– Huang X, Madan A. 1999. CAP3: a DNA sequence assembly program.
2542. doi:10.1038/ismej.2014.167 Genome Res 9: 868–877. doi:10.1101/gr.9.9.868
Brum JR, Ignacio-Espinoza JC, Roux S, Doulcier G, Acinas SG, Alberti A, Imelfort M, Parks D, Woodcroft BJ, Dennis P, Hugenholtz P, Tyson GW.
Chaffron S, Cruaud C, de Vargas C, Gasol JM, et al. 2015. Patterns and 2014. GroopM: an automated tool for the recovery of population ge-
ecological drivers of ocean viral communities. Science 348: 1261498. nomes from related metagenomes. PeerJ 2: e603. doi:10.7717/peerj.603
doi:10.1126/science.1261498 Janson S, Wouters J, Bergman B, Carpenter EJ. 1999. Host specificity in the
Buchfink B, Xie C, Huson DH. 2015. Fast and sensitive protein alignment Richelia–diatom symbiosis revealed by hetR gene sequence analysis.
using DIAMOND. Nat Methods 12: 59–60. doi:10.1038/nmeth.3176 Environ Microbiol 1: 431–438. doi:10.1046/j.1462-2920.1999.00053.x
Bullock HA, Luo H, Whitman WB. 2017. Evolution of dimethylsulfoniopro- Johnson WM, Kido Soule MC, Kujawinski EB. 2016. Evidence for quorum
pionate metabolism in marine phytoplankton and bacteria. Front
sensing and differential metabolite production by a marine bacterium
Microbiol 8: 637. doi:10.3389/fmicb.2017.00637
in response to DMSP. ISME J 10: 2304–2316. doi:10.1038/ismej.2016.6
Campbell JH, O’Donoghue P, Campbell AG, Schwientek P, Sczyrba A,
Johnston AW, Green RT, Todd JD. 2016. Enzymatic breakage of dimethyl-
Woyke T, Söll D, Podar M. 2013. UGA is an additional glycine codon
sulfoniopropionate—a signature molecule for life at sea. Curr Opin
in uncultured SR1 bacteria from the human microbiota. Proc Natl Acad
Chem Biol 31: 58–65. doi:10.1016/j.cbpa.2016.01.011
Sci 110: 5540–5545. doi:10.1073/pnas.1303090110
Capone DG, Bronk DA, Mulholland MR, Carpenter EJ. 2008. Nitrogen in the Joly D, Faure D. 2015. Next-generation sequencing propels environmental
marine environment. Elsevier, Amsterdam. genomics to the front line of research. Heredity (Edinb) 114: 429–430.
Carlson CA, Ducklow HW, Hansell DA, Smith WO. 1998. Organic carbon doi:10.1038/hdy.2015.23
partitioning during spring phytoplankton blooms in the Ross Sea po- Kang D, Li F, Kirton ES, Thomas A, Egan RS, An H, Wang Z. 2019. MetaBAT
lynya and the Sargasso Sea. Limnol Oceanogr 43: 375–386. doi:10 2: an adaptive binning algorithm for robust and efficient genome recon-
.4319/lo.1998.43.3.0375 struction from metagenome assemblies. PeerJ 7: e7359. doi:10.7717/
Caron DA, Worden AZ, Countway PD, Demir E, Heidelberg KB. 2009. peerj.7359
Protists are microbes too: a perspective. ISME J 3: 4–12. doi:10.1038/ Katoh K, Standley DM. 2013. MAFFT multiple sequence alignment software
ismej.2008.101 version 7: improvements in performance and usability. Mol Biol Evol 30:
Carradec Q, Pelletier E, Da Silva C, Alberti A, Seeleuthner Y, Blanc-Mathieu 772–780. doi:10.1093/molbev/mst010
R, Lima-Mendez G, Rocha F, Tirichine L, Labadie K, et al. 2018. A global Keeling PJ, Burki F, Wilcox HM, Allam B, Allen EE, Amaral-Zettler LA,
ocean atlas of eukaryotic genes. Nat Commun 9: 373. doi:10.1038/ Armbrust EV, Archibald JM, Bharti AK, Bell CJ, et al. 2014. The marine
s41467-017-02342-1 microbial eukaryote transcriptome sequencing project (MMETSP): illu-
Charlson RJ, Lovelock JE, Andreae MO, Warren SG. 1987. Oceanic phyto- minating the functional diversity of eukaryotic life in the oceans
plankton, atmospheric sulphur, cloud albedo and climate. Nature 326: through transcriptome sequencing. PLoS Biol 12: e1001889. doi:10
655–661. doi:10.1038/326655a0 .1371/journal.pbio.1001889
Genome Research 11
www.genome.orgYou can also read