Reconstructing past hydrology of eastern Canadian boreal catchments using clastic varved sediments and hydro-climatic modelling: 160 years of ...
←
→
Page content transcription
If your browser does not render page correctly, please read the page content below
Clim. Past, 17, 653–673, 2021
https://doi.org/10.5194/cp-17-653-2021
© Author(s) 2021. This work is distributed under
the Creative Commons Attribution 4.0 License.

Reconstructing past hydrology of eastern Canadian boreal
catchments using clastic varved sediments and hydro-climatic
modelling: 160 years of fluvial inflows
Antoine Gagnon-Poiré1,2,3 , Pierre Brigode4 , Pierre Francus1,2,3 , David Fortin1,5 , Patrick Lajeunesse6 ,
Hugues Dorion6 , and Annie-Pier Trottier6
1 Institut
         national de la recherche scientifique, Centre Eau Terre Environnement, Québec, QC, Canada
2 Geotop, Research Centre on the Dynamics of the Earth System, Montréal, QC, Canada
3 Centre d’études nordiques, Québec, QC, Canada
4 Université Côte d’Azur, CNRS, OCA, IRD, Géoazur, Nice, Alpes-Maritimes, France
5 Department of Geography and Planning, University of Saskatchewan, Saskatoon, SK, Canada
6 Département de géographie, Université Laval, Québec, QC, Canada

Correspondence: Antoine Gagnon-Poiré (antoine.gagnon-poire@ete.inrs.ca)

Received: 29 June 2020 – Discussion started: 20 July 2020
Revised: 21 January 2021 – Accepted: 7 February 2021 – Published: 25 March 2021

Abstract. Analysis of short sediment cores collected in             constructed Naskaupi River discharge based on varve phys-
Grand Lake, Labrador, revealed that this lake is an excel-          ical parameters. The Grand Lake varved sequence contains
lent candidate for the preservation of a laminated sediment         a regional hydrological signal, as suggested by the statisti-
record. The great depth of Grand Lake, the availability of          cally significant relation between the combined detrital layer
fine sediments along its tributaries and its important seasonal     thickness series and the observed Labrador region Q-mean
river inflow have favoured the formation of a 160-year-long         series extracted from five watersheds of different sizes.
clastic varved sequence. Each varve represents 1 hydrolog-
ical year. Varve formation is mainly related to spring dis-
charge conditions with contributions from summer and au-            1   Introduction
tumn rainfall events. The statistically significant relation be-
tween varve parameters and the Naskaupi River discharge             Climate changes caused by rising concentrations of green-
observations provided the opportunity to develop local hy-          house gases can alter hydro-climatic conditions on inter- and
drological reconstructions beyond the instrumental period.          intra-regional scales (Linderholm et al., 2018; Ljungqvist et
The combined detrital layer thickness and the particle size         al., 2016; Stocker et al., 2014). Hydropower, which is con-
(99th percentile) series extracted from each varve yield the        sidered as a key renewable energy source to mitigate global
strongest correlations with instrumental data (r = 0.68 and         warming, has strong sensitivity to changes in hydrological
0.75 respectively) and have been used to reconstruct the re-        regime, especially in vulnerable northern regions (Cherry et
spective Naskaupi River mean and maximum annual dis-                al., 2017). Therefore, a clear understanding of the regional
charges over the 1856–2016 period. The reconstructed Q-             impacts that recent climate change combined with natural
mean series suggest that high Q-mean years occurred during          climate variability can have on river discharge and hydro-
the 1920–1960 period, and a slight decrease in Q-mean took          electric production is needed. However, the lack of instru-
place during the second half of the 20th century. Indepen-          mental records and the uncertainty related to hydroclimate
dent reconstructions based on rainfall–runoff modelling of          variability projections (Collins et al., 2013) are obstacles to
the watershed from historical reanalysis of global geopoten-        sustainable management of these water resources.
tial height fields display a significant correlation with the re-      The Labrador region in eastern Canada is a critical area
                                                                    for hydropower generation, hosting the Churchill River hy-

Published by Copernicus Publications on behalf of the European Geosciences Union.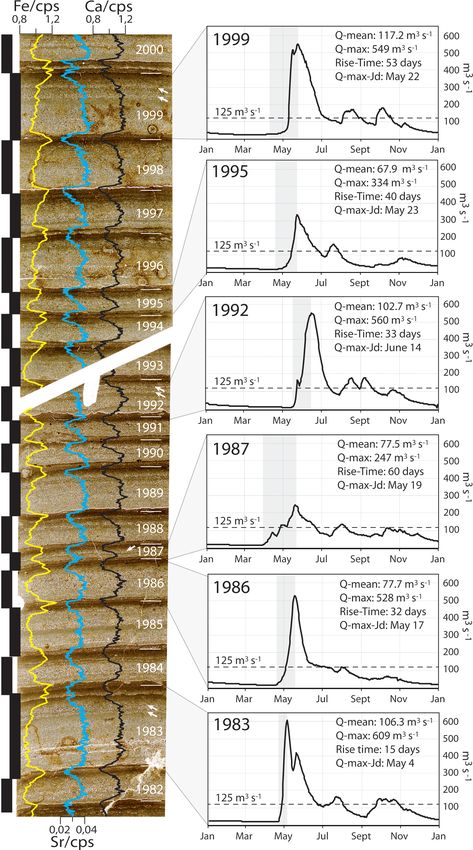
654                         A. Gagnon-Poiré et al.: Reconstructing past hydrology of eastern Canadian boreal catchments

droelectric project, one of the largest hydropower systems         excellent candidate for the preservation of the recent fluvial
in the world. Average annual streamflow has been variable          clastic laminated sediment record (Zolitschka et al., 2015).
in eastern Canada during the last 50 years, with higher river      The objectives of this paper are to (1) confirm the annual
discharges from 1970 to 1979 and from 1990 to 2007, and            character of the laminations record, (2) establish the relation
lower discharges from 1980 to 1989 (Mortsch et al., 2015;          between the physical parameters of laminations and local hy-
Déry and Wood, 2005; Jandhyala et al., 2009; Sveinsson et          drological conditions to examine the potential proxy for hy-
al., 2008; Zhang et al., 2001). These changes in streamflow        drological reconstructions, (3) reconstruct the hydrology of
represent a significant economic challenge for the long-term       the last 160 years and compare its similarities and differences
management of hydropower generation. The few decades of            with Brigode et al. (2016) rainfall–runoff modelling over the
available instrumental observations (100 years), but such
long-time series are non-existent for the Labrador region. Re-     2   Regional setting
cently, rainfall–runoff modelling approaches have been used
to expand instrumental streamflow datasets, using long-term        Grand Lake is a 245 m deep (Trottier et al., 2020) elongated
climatic reanalysis as inputs. Rainfall–runoff modelling was       (60 km long) fjord lake located in a valley connected to the
used by Brigode et al. (2016) to reconstruct daily streamflow      Lake Melville graben in central Labrador (53◦ 410 25.5800 N,
series over the 1881–2011 period in northern Quebec. Never-        60◦ 320 6.5300 W; ∼ 15 m above sea level) (Fig. 1). The re-
theless, this type of method suffers from limited observations     gion is part of the Grenville structural province and is
with respect to evaluating and validating the reconstructed        dominated by Precambrian granite, gneiss and acidic intru-
hydro-climatic temporal series. The deficiency in observa-         sive rocks. Grand Lake watershed deglaciation began after
tions led to the exploration of various natural archives for       ∼ 8.2 ka cal BP (Trottier et al., 2020). During deglaciation,
reconstructing past hydro-climatic conditions. Long hydro-         the marine limit reached an elevation of 120–150 m above
climatic series based on natural proxies in eastern Canada         modern sea level and invaded further upstream in the mod-
are rare, limited to a tree ring (Boucher et al., 2017; Bé-        ern fluvial valleys that are connected to the lake (Fizthugh,
gin et al., 2015; Naulier et al., 2015; Nicault et al., 2014;      1973). This former glaciomarine/marine sedimentary fjord
Boucher et al., 2011; Bégin et al., 2007; D’Arrigo et al.,         basin has been glacio-isostatically uplifted and isolated by
2003) and pollen datasets (Viau and Gajewski, 2009), and           a morainic sill to become a deep fjord lake (Trottier et
have mainly focused on temperature reconstructions. Recon-         al., 2020). The regional geomorphology is characterized by
structing river hydrological series using dendrological anal-      glacially sculpted bedrock exposures, glacial deposits con-
ysis is complex in the boreal region due to the indirect rela-     sisting of till plateaus of various elevations, glacial lineations,
tion between tree ring indicators and streamflow. One study        drumlins, kames, eskers and raised beaches (Fulton, 1986).
has reconstructed streamflow variations over the last 2 cen-       Podzolic soils dominate, with inclusions of brunisols and
turies in Labrador based on tree-ring isotopes series (Dinis       wetlands.
et al., 2019). Still, the spatial coverage of palaeohydrological      Grand Lake is located in the high boreal forest ecore-
records from independent proxies must be increased in this         gion, one of the most temperate climates in Labrador, host-
region. From this perspective, annually laminated sediments        ing mixed forests dominated by productive, closed stands
composed of minerogenic particles (clastic varves) formed          of Abies balsamea, Picea mariana, Betula papyrifera and
when seasonal runoff carrying suspended sediment enters a          Populus tremuloides (Riley et al., 2013). This region is in-
lake (Sturm, 1979) have the potential to produce long palaeo-      fluenced by temperate continental (westerly and southwest-
hydrological series. The direct relationship between clastic       erly winds) and maritime (Labrador Current) conditions with
varves and hydrological conditions makes this type of varve a      cool humid summers (June, July and August) (∼ 8.5 ◦ C)
specific and powerful proxy for streamflow reconstructions.        and cold winters (December, January, February and March)
Clastic varves can provide, in favourable settings, annually       (∼ −13 ◦ C). The Grand Lake watershed extends upstream
to seasonally resolved information about downstream sedi-          over the low subarctic Nipishish–Goose ecoregion, a broad
ment transport from a catchment area into a lake basin de-         bedrock plateau (
A. Gagnon-Poiré et al.: Reconstructing past hydrology of eastern Canadian boreal catchments 655
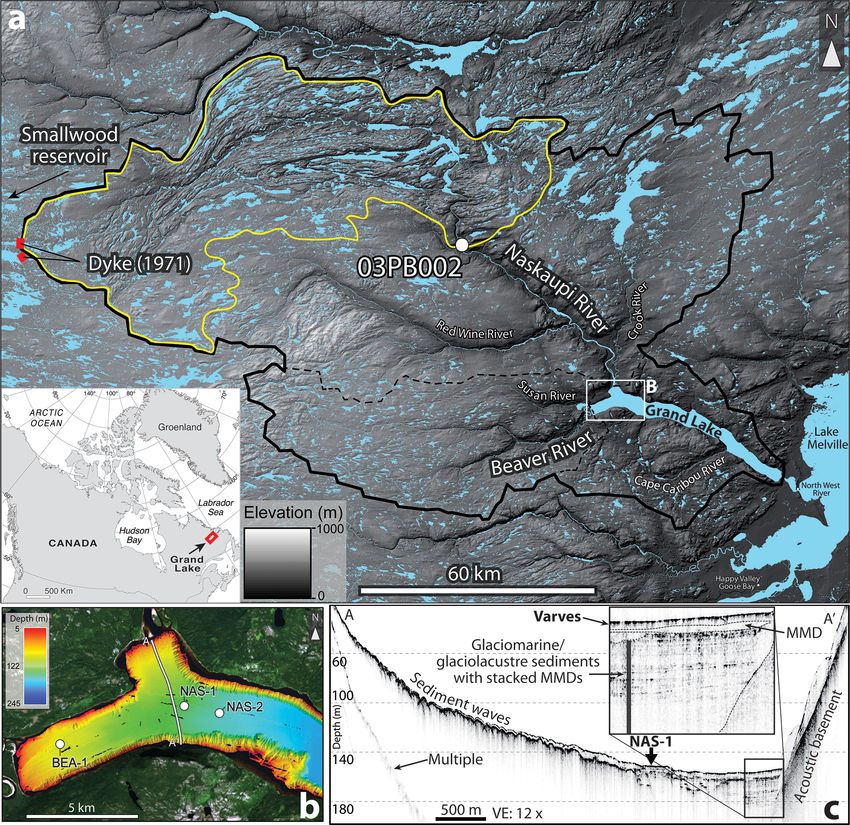
Figure 1. (a) Location of the Grand Lake watershed (black line) and its principal tributaries. The Naskaupi River hydrometric station
(03PB002, white dot) covering an area of 4480 km2 (yellow line). The locations of the dykes constructed in 1971 to divert water from the
Naskaupi River to the Smallwood Reservoir hydroelectric system are also shown by the red bars. (b) High-resolution swath bathymetry (1 m
resolution) of Grand Lake (Trottier et al., 2020) coupled with a Landsat image (USGS) and core site locations. The white line indicates the
location of (c) a typical 3.5 kHz sub-bottom profile of the Naskaupi River delta (A–A0 ) showing the approximate location of core NAS-1.
MMD denotes a mass movement deposit.
sion (Fig. 2). Snowmelt in the Grand Lake region takes place duced the drainage area of the Naskaupi River from 23 310
from April to June. to 12 691 km2 (Anderson, 1985).
The main tributary of Grand Lake is the Naskaupi River Hydroacoustic data were collected in Grand Lake in 2016
located at the lake head (Fig. 1a). The downstream part of (Trottier et al., 2020). The swath bathymetric imagery and
the Naskaupi River is fed by the Red Wine and the Crook 3.5 kHz sub-bottom profile show that the prodelta slopes
rivers. The Beaver River is the secondary tributary of Grand present well-defined sediment waves at the Naskaupi River
Lake. The Naskaupi and Beaver river structural valleys that mouth (Trottier et al., 2020; Fig. 1b). The upper acoustic unit
connect to the Grand Lake Basin have a well-developed flu- is composed of a high-amplitude acoustic surface changing
vial plain and a generally sinuous course that remobilize into low-amplitude acoustic parallel reflections (Fig. 1c), a
former deltaic systems and terraces composed of glacioma- type of acoustic facies which can be associated with succes-
rine, marine, fluvio-glacial, lacustrine and modern fluvial de- sive sedimentary layers of contrasting particle sizes (Gilbert
posits. Upstream river terraces show mass movement scarps and Desloges, 2012).
and are affected by gully and aeolian activity. Grand Lake
flows into a small tidal lake (Little Lake) and subsequently
3 Methods
towards Lake Melville. On 28 April 1971, by closing a sys-
tem of dykes, the headwaters of Naskaupi River watershed 3.1 Sediment coring and processing
(Lake Michikamau) were diverted into the Churchill River
hydropower development (Fig. 1a). This diversion has re- Four short sediment cores (BEA-1, NAS-1A, NAS-1B and
NAS-2) were collected using a UWITEC percussion corer
https://doi.org/10.5194/cp-17-653-2021 Clim. Past, 17, 653–673, 2021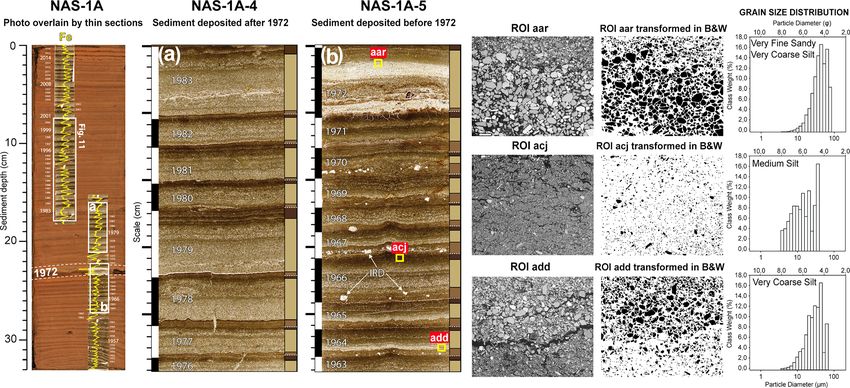
656                          A. Gagnon-Poiré et al.: Reconstructing past hydrology of eastern Canadian boreal catchments

Figure 2. Observed mean daily discharges of the Naskaupi River (hydrometric station 03PB002) for the 1978–2012 period (black line). The
grey zone represents the minimum and maximum observed discharges.

in March 2017 that was deployed from the lake ice cover.              line-scan camera mounted on an ITRAX core scanner (RGB
These cores were collected in undisturbed areas according to          colour images, 50 µm pixel size) at INRS-ETE. Geochemi-
the swath bathymetry and sub-bottom profiling data (Trot-             cal non-destructive X-Ray fluorescence (XRF) analysis was
tier et al., 2020). Core BEA-1 was collected at the axis              performed on the core half (30 kV and 30 mA). XRF element
of the Beaver River at a depth of 93 m. Core NAS-1 was                profiles were used to visualize the structures and boundaries
collected at the axis of the Naskaupi River at a depth of             of the laminations and estimate particle size variability in
146 m (Fig. 1b). BEA-1 and NAS-1 were collected from lo-              sediment cores (Kylander et al., 2011; Cuven et al., 2010;
cations sharing relative similarities: at the distal frontal slope    Croudace et al., 2006). Elements were normalized by the to-
of the Beaver and Naskaupi river deltas (Fig. 1c). NAS-               tal counts per second (cps) for each spectrum. Continuous
2 was collected away from the Naskaupi River delta, at a              XRF measurements were also carried out on overlapping im-
depth of 176 m at the beginning of the deep lake basin.               pregnated sediment blocks in order to superpose element rel-
The site where NAS-2 was collected is mainly fed by sed-              ative intensity profiles on thin sections.
iments from the Naskaupi River, but it is also in a distal
position to the Beaver River. Duplicate cores of different
lengths have been retrieved at each site to maximize undis-           3.2   Chronology and thickness measurement
turbed sediment recovery. Following the extraction of each
core, wet floral foam was gently inserted through the top of          Surface sediments from cores BEA-1 and NAS-1A were
the filled coring tube and slowly pushed towards the sedi-            dated with the Cesium-137 (137 Cs) method (Ritchie and
ment surface to seal and preserve the sediment–water inter-           McHenry, 1990) using a high-resolution germanium diode
face. A plastic cap was then installed on top of the foam to          gamma detector and multichannel analyzer gamma counter.
secure its position in contact with the intact sediment sur-          The 137 Cs activity was used to identify sediment deposited
face and avoid disturbance during transport of the cores. The         during the 1963–1964 peak of nuclear tests and validate the
cores were scanned using a Siemens SOMATOM Defini-                    annual character of the layers. A sampling interval of 2 cm
tion AS + 128 medical CT scanner at the Multidisciplinary             was used to approximately identify the depth at which the
Laboratory of CT Scan for Non-medical Use of the Insti-               137 Cs peaks were located. Subsequently, a sampling inter-
tut National de la Recherche Scientifique–Eau Terre Envi-             val of ±0.5 cm was used to sample each lamination for the
ronnement (INRS-ETE). The CT scan images allowed the                  1961–1965 period to determine the exact 137 Cs peak loca-
identification of sedimentary structures (i.e., laminated fa-         tion (1963–1964). In order to establish a chronology for each
cies, perturbation and hiatus). Expressed as CT numbers or            core, detailed lamination counts were executed on CT scan
Hounsfield units (HU), X-Ray attenuation is a function of             images and high-resolution photographs using the ImageJ
density and the effective atomic number and, hence, sensitive         2.0.0 and Adobe Illustrator CC software packages (Fran-
to contrasts in mineralogy, grain size and sediment poros-            cus et al., 2002b). As all of the core surface has been well
ity (St-Onge et al., 2007). CT numbers were extracted at a            preserved, the first complete lamination below the sediment
resolution of 0.06 cm using the ImageJ software 2.0.0 (http:          surface was considered to represent the topmost year (i.e.,
//imagej.net, last access: 22 June 2017). The cores were then         2016 CE). Chronology on each core was confirmed by cross-
opened, described and photographed with a high-resolution             correlation between thick laminations selected as distinctive

Clim. Past, 17, 653–673, 2021                                                             https://doi.org/10.5194/cp-17-653-2021
A. Gagnon-Poiré et al.: Reconstructing past hydrology of eastern Canadian boreal catchments                                 657

marker layers along the different sediment sequences (A to        from thin sections (Francus, 1998) for the last 160 years
M; Fig. 4).                                                       (1856–2016) for cores BEA-1 and NAS-1, and for the last
   Thin sections of sediments were sampled from cores BEA-        47 years (1968–2016) for core NAS-2, from 795, 717 and
1 (1856-2016), NAS-1A (1953–2016), NAS-1B (1856–                  132 BSE images respectively (Fig. 4).
1952) and NAS-2 (1968–2016) (see Fig. 4 for thin section
locations) following Francus and Cosby (2001) and Lam-            3.4   Hydrological variables
oureux (1994). Digital images of the thin sections were ob-
tained using a transparency flatbed scanner at 2400 dpi res-      Hydrological variables (Table 1) were calculated from the
olution (1 pixel = 10.6 µm) in plain light and were used          time series of daily discharges recorded by the Naskaupi
to characterize lamination substructure. Lamination counts        River hydrometric station over the 1978–2011 period (miss-
and thickness measurements using a thin section image             ing data from the years 1996, 1997 and 1998).
analysis software developed at INRS-ETE (Francus and                 The Naskaupi River hydrological variables have been
Nobert, 2007) were performed to duplicate and validate            compared with four other hydrometric stations’ data avail-
previous chronologies established on CT scan images and           able around the study region (Fig. 3a, Table 2), which are
high-resolution photographs. Two counts were made from            devoid of anthropogenic perturbations. Q-mean series from
thin section by the same observer (Antoine Gagnon-Poiré).         the five stations have been normalized for the common 1979–
The total varve thickness (TVT) and detrital layer thickness      2011 period and averaged in order to produce a Labrador re-
(DLT) of each year of sedimentation were measured from            gion mean annual discharge series. This allows one to extend
images of thin sections. Lamination counts made on CT scan        instrumental data series for the period from 1969 to 2011 and
images, high-resolution photographs and thin sections are         to fill in data for the missing years. The Labrador hydromet-
identical, whereas TVT measurements show negligible dif-          ric station data used in this study come from a Government
ference (R 2 = 0.96; p0 to validate the model skill. Statistical analysis
cessed to obtain black and white images where clastic grains      was realized using the “treeclim” package (Zang and Biondi,
(>3.5 µm) and clay matrix appeared in black and white re-         2015) in the R project environment (R Core Team, 2019,
spectively (Francus, 1998).                                       http://www.r-project.org/, last access: 15 January 2019).
   Each sedimentary particle (an average of 2225 particles
per image) was measured according to the methodology used         3.6   Hydro-climatic reconstruction based on
by Lapointe et al. (2012), Francus et al. (2002a) and Francus           rainfall–runoff modelling
and Karabanov (2000) in order to calculate the particle size
distribution on each ROI image. Due to the thickness of the       The applied reconstruction method is based on rainfall–
laminations, results from several ROI images were merged to       runoff modelling. Firstly, it aims at producing, for the
obtain measurements for each year of sedimentation, with an       Naskaupi River hydrometric station catchment (Fig. 1a),
average of four images per lamination. Only clastic facies re-    daily climatic time series using a historical reanalysis of
lated to spring and summer discharges were used for particle      global geopotential height fields extracted over the studied
size analysis in order to exclude ice-rafted debris (microme-     region for a given time period (here 1880–2011). Secondly,
tre to millimetre scale) observed in the early spring layers      the produced climatic series are used as inputs to a rainfall–
(see Fig. 5 for details). The 99th percentile (P99D0 ) of the     runoff model previously calibrated on the studied catchment
particle size distribution for each detrital layer was obtained   in order to obtain daily streamflow time series. The recon-

https://doi.org/10.5194/cp-17-653-2021                                                         Clim. Past, 17, 653–673, 2021
658 A. Gagnon-Poiré et al.: Reconstructing past hydrology of eastern Canadian boreal catchments
Table 1. Hydrological variables used in this paper.
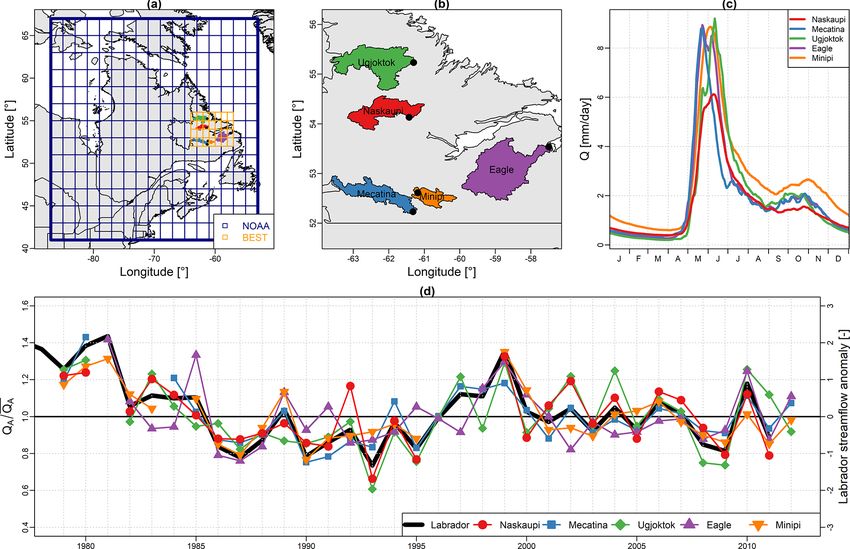
Figure 3. (a) Dataset used for the hydro-climatic reconstruction based on rainfall–runoff modelling: the extension of the 20CR grid used
is shown in blue, and the BEST grid used is highlighted in orange. (b) Spatial distribution of hydrometric stations used in this study (black
dots) and their catchment areas. (c) Observed mean daily discharges of each hydrometric station for the 1978–2012 period. (d) Labrador
streamflow anomaly and the Labrador region mean annual discharge series (thick black line).
struction method is fully described in Brigode et al. (2016) These daily series have been used to calibrate the GR4J
and was recently applied over southeastern Canadian catch- rainfall–runoff model (Perrin et al., 2003) and its snow ac-
ments in Dinis et al. (2019). It is summarized in the following cumulation and melting module, CemaNeige (Valéry et al.,
paragraphs. 2014a), using the airGR package (Coron et al., 2017). This
The available observed hydro-climatic series for the combination of GR4J and CemaNeige (hereafter denoted Ce-
Naskaupi River hydrometric station catchment have been ag- maNeigeGR4J) has been recently applied over eastern Cana-
gregated at the catchment scale. Climatic series (daily air dian catchments and showed good modelling performance
temperature and precipitation) have been extracted from the (e.g., Seiller et al., 2012; Valéry et al., 2014b, Brigode et al.,
CANOPEX dataset (Arsenault et al., 2016), built using En- 2016). CemaNeigeGR4J has been calibrated on the recorded
vironment Canada weather stations and Thiessen polygons period of the Naskaupi River hydrometric station catchment
to calculate climatic series at the catchment scale. Daily air using the Kling–Gupta efficiency criterion (Gupta et al.,
temperature series have been used to calculate daily poten- 2009) as the objective function.
tial evapotranspiration at the catchment scale, via the Oudin The observed climatic series have then been resampled
et al. (2005) formula designed for rainfall–runoff modelling. over the 1880–2011 period, based on both season and sim-
ilarity of geopotential height fields (Kuentz et al., 2015). The
Clim. Past, 17, 653–673, 2021 https://doi.org/10.5194/cp-17-653-2021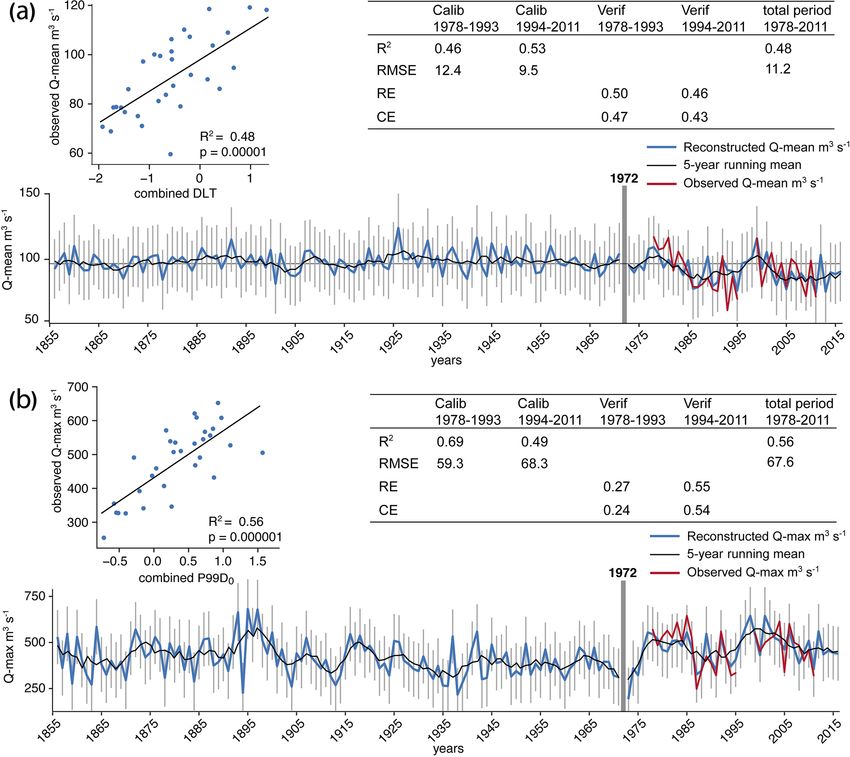
A. Gagnon-Poiré et al.: Reconstructing past hydrology of eastern Canadian boreal catchments                                    659

Table 2. Description of hydrometric stations used in this study.

resampling is performed by calculating Teweles and Wobus           charcoal fragments are observed throughout the detrital lay-
(1954) distances between four geopotential height fields: (i)      ers. The third topmost lamination layer is formed by a fine
1000 hPa at 0 h, (ii) 1000 hPa at 24 h, (iii) 500 hPa at 0 h and   to medium silty layer with abundant clay rich in Fe and in-
(iv) 500 hPa at 24 h. The NOAA 20th Century Reanalysis en-         terpreted as an autumn and winter layer, also known as a
semble (Compo et al., 2011; hereafter denoted 20CR) has            clay cap (Zolitschka et al., 2015). Hence, the Fe peak val-
been used as a source of geopotential height fields (Fig. 3b).     ues in autumn and winter layers are used to determine the
   As in Brigode et al. (2016), the resampled series of air tem-   upper lamination boundary (Fig. 4) (Zolitschka et al., 2015),
perature have been corrected at the catchment scale using a        as previously performed in other varved sequences (Cuven et
regression model calibrated with the Berkeley Earth Surface        al., 2010; Saarni et al., 2016).
Temperature analysis (Rohde et al., 2013; hereafter denoted           The lamination deposited in 1972 from sites at the axis
BEST). BEST is a gridded air temperature product starting          of the Naskaupi River (NAS-1, Fig. 5b, and NAS-2, Fig. 4),
in 1880 at the daily time step (Fig. 3b).                          present a thick (8.2 mm) and coarse (67.8 µm) detrital layer
   Finally, the daily climatic series are used as inputs to the    composed of very fine sandy and very coarse silt (Fig. 5b)
CemaNeigeGR4J model in order to obtain daily streamflow            representing the highest particle size measured in all se-
time series on the same 1880–2011 period. Thus, the outputs        quences. Furthermore, there is a difference in lamination
of the hydro-climatic reconstruction are an ensemble of daily      physical parameters and microfacies deposited before and
meteorological series (air temperature, potential evapotran-       after the 1972 marker bed, especially in core NAS-1, the
spiration and precipitation) and an ensemble of daily stream-      proximal site from the Naskaupi River mouth. Laminations
flow series.                                                       deposited prior to 1972 have a well-developed substructure
                                                                   that is relatively constant among each annual lamination
                                                                   (Fig. 5b). The early spring layer of the pre-1972 laminations
4     Results                                                      is thicker and more clearly visible. Conversely, the detrital
                                                                   layer of laminations post-1972 is thicker, whereas the early
4.1    Lamination characterization
                                                                   spring layer is more difficult to discern and contributes less to
Sediment retrieved at the head of Grand Lake (Fig. 4) con-         the TVT (Fig. 5a). The mean contribution of the early spring
sist of dark greyish to dark yellowish brown (Munsell colour:      layer and the autumn and winter layer to the total lamination
10YR-4/2 to 10YR-4/4) laminated minerogenic material, in-          thickness is 52 % for the pre- and 35 % for the post-1972 in-
terpreted as clastic lamination of fluvial origin. Lamination      tervals. The early spring layer in lamination post-1971 from
structure can be divided in three seasonal layers (Fig. 5)         sites NAS-1 and NAS-2 no longer contains isolated coarse
based on their stratigraphic position and microfacies. Annual      debris. The changes in lamination facies are less noticeable
sedimentation starts with a layer composed of silt and clay        in core NAS-2, which was sampled further away from the
sediment matrix which sometimes contains ice-rafted de-            Naskaupi River mouth. The 1972 marker bed and related fa-
bris (micrometre to millimetre scale) interpreted as an early      cies changes are not found at the Beaver River mouth site
spring layer. The major lamination component is a spring and       BEA-1.
summer/autumn detrital layer. Its thick basal part is mostly
poorly sorted, graded and composed of coarse minerogenic           4.2   Varve chronology
grains comprising fine sand and silts (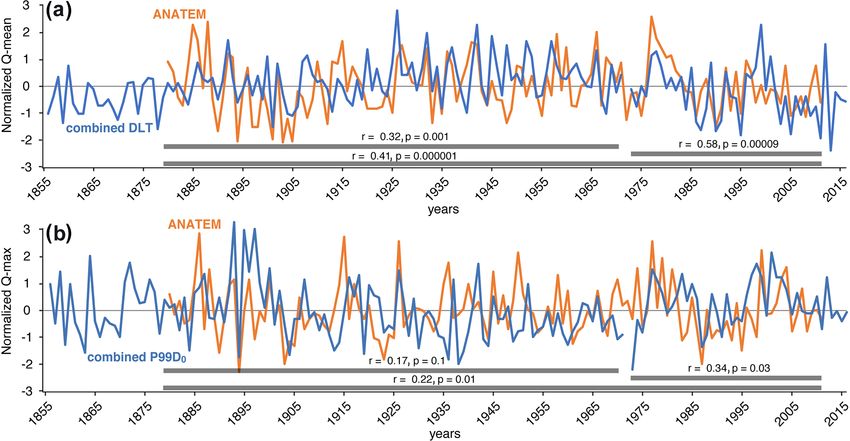
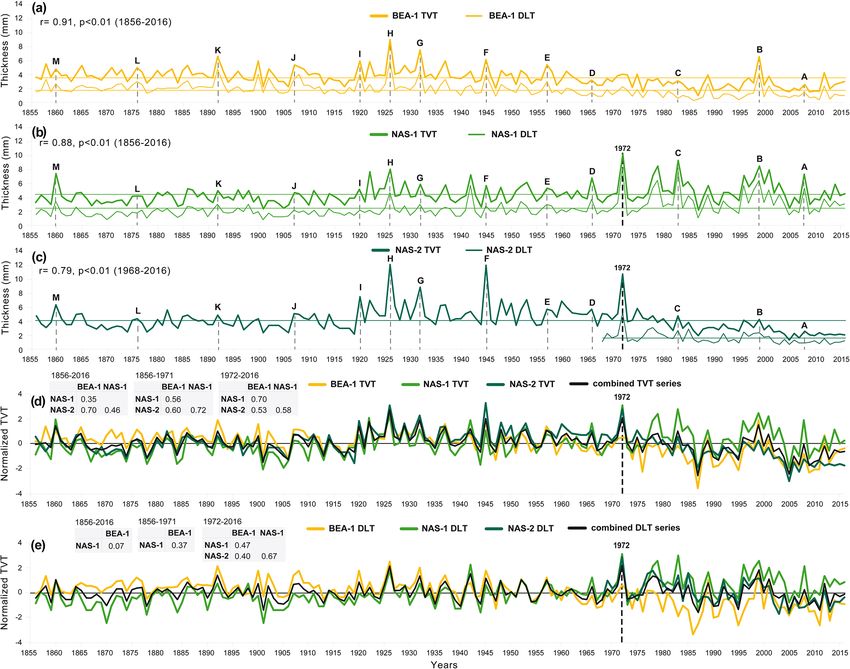
660                           A. Gagnon-Poiré et al.: Reconstructing past hydrology of eastern Canadian boreal catchments

Figure 4. Varve counts made on (left) CT scan and (right) high-resolution images from cores BEA-1, NAS-1A/B and NAS-2. Distinctive
marker layers are identified by the letters A to M. The 1972 marker layer is outlined by the thick dark grey line. The Fe relative intensity
and density (HU) profiles, represented by the yellow and black lines respectively, show rhythmic laminations. The activity profile of 137 Cs
in cores BEA-1 and NAS-1A is shown by the red line. Approximate thin section locations are outlined by white boxes. The age–depth model
of the three cores is also presented (Box 1 at the bottom of the figure). See Fig. 1b for core locations.

April 1971 (see Sect. 5.2 for details) supports the reliability         that was reproducible among cores to be constructed. De-
of the constructed chronologies.                                        spite the distance between the coring sites (1 to 5 km) and the
   Independent varve chronologies were established from                 two different sediment sources (Naskaupi and Beaver rivers;
sediment cores BEA-1, NAS-1 and NAS-2 (Fig. 4). A to-                   Fig. 1b), there is no varve count difference between the se-
tal of 160 varves were counted at each site, covering the               lected thick marker layers (A to M; Fig. 4) among cores.
1856–2016 period. The thickness and the good quality of the             The few counting difficulties occur within varve years 1952–
well-preserved varve structures allowed a robust age model              1953, 1935–1934 and 1918–1919, as they contain ambiguous

Clim. Past, 17, 653–673, 2021                                                                 https://doi.org/10.5194/cp-17-653-2021
A. Gagnon-Poiré et al.: Reconstructing past hydrology of eastern Canadian boreal catchments                                            661

Figure 5. (Left) Photo of core NAS-1A overlain by a thin section image and Fe relative intensity profile (yellow lines). The 1972 marker
layer is highlighted by the white dashed lines. Thin section images showing the sedimentary structure of varves deposited (b) before and (a)
after the 1972 marker bed. Varve boundaries are represented by the vertical black and white bars (left y axis). Varve layers are delimited
by the medium brown (early spring layer), pale brown (detrital layer) and dark brown (autumn and winter layer) bars (right y axis). Typical
ice-rafted debris (IRD) is shown by the white arrows in panel (b). (Right) BSE images of three ROIs transformed in black and white and
their associated particle size distribution (aar represents the 1972 marker layer, acj represents a typical autumn and winter layer, and add
represents the base of a typical detrital layer); see the yellow squares in panel (b) for the ROI locations.

coarse non-annual intercalated sub-layers with an intermedi-            thickness values. Overall, TVT and DLT vary similarly in
ate clay cap that can be interpreted as 1 year of sedimenta-            time between sites during the 1856–1971 period (Fig. 6d, e).
tion. Both varve counts performed on thin sections show a               However, after 1972, TVT and DLT series are more diver-
low overall counting error (±1.8 %) which demonstrated the              gent. From 1972 to 2016, there is a statistically significant
precision and accuracy of the varve sequences chronology.               decreasing trend in TVT and DLT in core NAS-2 (Fig. 6c),
The age–depth models (Fig. 4, Box. 1) show changes in sed-              and the amplitude of their variability tends to diminish. For
iment accumulation rates (thickness) among cores in 1920                core NAS-1 (Fig. 6b), the post-1971 period is associated with
and 1972.                                                               higher thickness values. Core NAS-1 has recorded a slight
                                                                        TVT and DLT decrease for the 1972–2016 period, but unlike
                                                                        the other cores, the variability tends to increase. The TVT
4.3   Thickness and particle size measurements                          and DLT are generally finer in the distal core NAS-2 com-
The TVTs from cores BEA-1, NAS-1 and NAS-2 vary                         pared with the more proximal core NAS-1 (Fig. 4, Box. 1,
between 0.9 and 12.9 mm, with an average thickness of                   Supplement Tables S1, S2).
4.09 mm (Fig. 6a, b, c, Supplement Fig. S1 and Table S1).                  The P99D0 of cores BEA-1, NAS-1 and NAS-2 vary be-
The DLTs vary between 0.3 and 8.3 mm, with an average                   tween 20 and 67.8 µm, with an average value of 34.3 µm
thickness of 1.9 mm (Fig. 6a, b, c, Supplement Fig. S2 and              (Fig. 7, Supplement Fig. S3 and Table S3). The grain size
Table S2). There are significant strong positive correlations           is finer in core NAS-2 compared with core NAS-1. Particle
between TVT and DLT for each core (r = 0.79 to 0.91;                    size data from the three sites have been normalized and aver-
p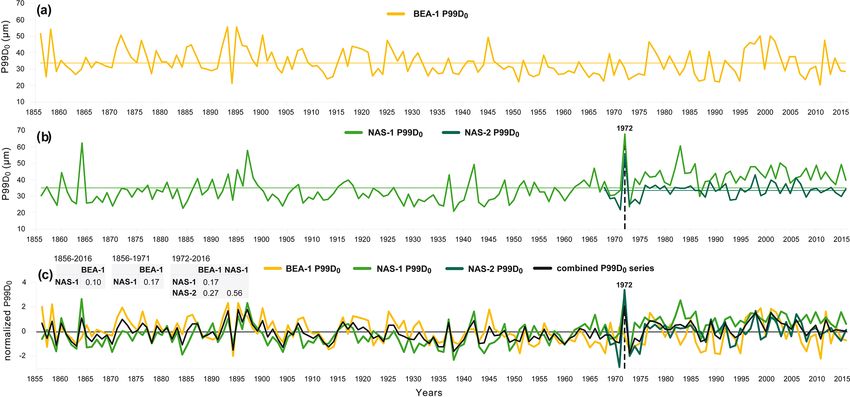
662                           A. Gagnon-Poiré et al.: Reconstructing past hydrology of eastern Canadian boreal catchments

Figure 6. Total varve thickness (TVT; thick line) and detrital layer thickness (DLT; thin line) time series of cores (a) BEA-1, (b) NAS-1 and
(c) NAS-2. Normalized (d) TVT and (e) DLT series and the combined series (mean of the normalized data from the three sites). Pearson
correlation coefficients between TVT and DLT for the 1856–2016, 1856–1971 and 1972–2016 periods are shown. The selected marker layers
are identified by the letters A to M, and the 1972 marker layer is outlined by the thick black dashed line.

   There is weak to moderate positive correlation be-                    4.4     Relation between varve series and instrumental
tween TVT and P99D0 from a same core (BEA-1: r =                                 record
0.41, p
A. Gagnon-Poiré et al.: Reconstructing past hydrology of eastern Canadian boreal catchments 663
1 have a better relation with Q-max. There is a significant 1972–2016 period presents a slightly better fit with the in-
negative correlation between the P99D0 of core NAS-1 and strumental data (lowest RMSE and the most significant and
Q-max-Jd (r = −0.38) and Rise-Time (r = −0.47). Sedi- highest R 2 ; Supplement Table S6). The model calibrations
ment parameters also present significant positive correla- based on a twofold cross-validation reveal that this DLT se-
tions with Q-Nival (r = 0.32 to 0.61) and Nb-days-SupQ80 ries has better overall predictive capacity to reconstructed Q-
(>125 m3 s−1 ) (r = 0.44 to 0.62). The combined DLT and mean (Supplement Table S7). The 1972–2016 period of core
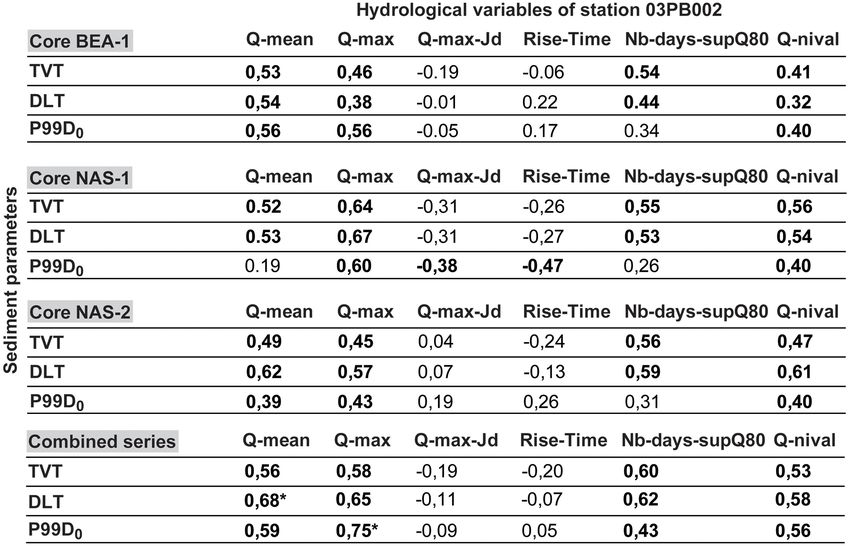
P99D0 series (Figs. 6d, e; 7c) yield the strongest correlations NAS-1 was then excluded from the combined DLT series
in our dataset (r = 0.68 and 0.75 respectively; Table 3) and used to perform the best reconstruction of Naskaupi River
have been used to reconstruct Naskaupi River Q-mean and Q-mean presented in Fig. 8a. However, significantly stronger
Q-max respectively (Fig. 8). calibration and validation statistical results were obtained by
keeping this period in the combined P99D0 series used to re-
construct Naskaupi River Q-max (Fig. 8b, Supplement Ta-
4.4.2 Labrador region
bles S8, S9). The varve of year 1972 is considered as an
To determine if there is a regional hydrological signal in outlier that originated from anthropogenic impacts and, thus,
Labrador and whether the Grand Lake varved sedimentary was not included in all reconstructions.
sequence has recorded this signal, the Naskaupi River hy- The reconstructed Naskaupi River Q-mean from com-
drological variables were compared with other Labrador hy- bined DLT series varies between 73 and 126 m3 s−1 , with an
drometric stations (Table 2). Despite specific local geomor- average of 96 m3 s−1 (Fig. 8a), and remains relatively stable
phological and climatic conditions, strong similarities exist from 1856 to 1920, generally close to the mean. Several years
between observed mean daily discharges (Fig. 3c) and an- with high Q-mean occurred during the 1920–1960 period. A
nual streamflow (Fig. 3d) recorded by hydrometric stations statistically significant downward trend of the Q-mean is ob-
in Labrador for the 1978–2011 period. The shape of the served over the last 90 years. Recently, high Q-mean periods
five annual regimes shows similar characteristics (i.e., flood- are observed from 1976 to 1985 and from 1996 to 2002, and
timing, strength, duration, snowmelt and rainfall response). lower Q-mean periods are observed from 1986 to 1995 and
The instrumental Naskaupi River mean annual discharge se- from 2003 to 2016. The reconstructed Naskaupi Q-max from
ries data show significant (p0 to validate the
der to propose the most relevant reconstructions (Supple- model skills; Supplement Tables S10, S11). The regional Q-
ment Figs. S4, S5). The observations and the reconstructed mean reconstruction for the 1856–2016 period is presented
Q-mean and Q-max extracted from the different series over in Fig. 9.
the 1978–2011 period are consistent. Despite differences, all
reconstructions tested using different sources of sedimento- 4.6 Hydrological reconstruction using the rainfall–runoff
logical data generally share common inter-annual and longer- modelling approach and comparison with the
term variability. varved-based reconstruction
Excluding the 1972–2016 measurements from NAS-1
from the combined series for reconstructions was also tested Naskaupi River Q-mean and Q-max (Fig. 8) were also
to remove the likely anthropogenic impact on sedimentation reconstructed using the ANATEM rainfall–runoff model
during this period. The combined DLT series without the (Fig. 10). The independent modelling approach results show
https://doi.org/10.5194/cp-17-653-2021 Clim. Past, 17, 653–673, 2021664 A. Gagnon-Poiré et al.: Reconstructing past hydrology of eastern Canadian boreal catchments Figure 7. P99D0 time series of cores (a) BEA-1, (b) NAS-1 (1856–2016) and NAS-2 (1968–2016). (c) Normalized P99D0 series and the combined series (mean of the normalized data from the three sites). The 1972 marker layer is outlined by the black dashed line. Pearson correlation coefficients between the P99D0 series for the 1856–2016, 1856–1971 and 1972–2016 periods are shown. Table 3. Matrix of correlation coefficients (Pearson r) of the hydrological variables defined in Table 1 with total varve thickness (TVT), detrital layer thickness (DLT) and particle size (P99D0 ) for the instrumental period (1978–2011; n = 31) for each core. Correlations between the hydrological variables and the combined TVT, DLT and P99D0 series (normalized and averaged varve parameters of cores BEA, NAS-1 and NAS-2) are also present. Correlations in boldface are significant at p
A. Gagnon-Poiré et al.: Reconstructing past hydrology of eastern Canadian boreal catchments                                              665

Figure 8. Naskaupi River (a) Q-mean and (b) Q-max reconstructed from combined DLT (without the NAS-1 1978-2016 period) and P99D0
series respectively, for the 1856–2016 period (blue line), with a 5-year moving average (black line). Error bars represent the 95 % confidence
interval. Observed Q-mean and Q-max are also shown for the 1978–2011 period (red line).

Figure 9. Labrador region Q-mean reconstructed from combined DLT series (without the NAS-1 1972–2016 period) for the 1856–2016
period (blue line), with a 5-year moving average (black line). Error bars represent the 95 % confidence interval. The observed Labrador
region Q-mean series is also shown for the 1969-2011 period (red line).

similarities with reconstructions based on varved series. The            similarities, especially during the 1973–2011 period (Q-
ANATEM reconstructions are statistically and positively cor-             mean: r = 0.58; Q-max: r = 0.34; n = 43; p
666                           A. Gagnon-Poiré et al.: Reconstructing past hydrology of eastern Canadian boreal catchments

Figure 10. Comparison between the Naskaupi River (a) Q-mean and (b) Q-max reconstruction using combined detrital layer thickness
(DLT) (without the NAS-1 1972–2016 period) and P99D0 series respectively (blue line) and the rainfall–runoff modelling (orange line) for
raw yearly data.

deed, high flow modelling requires good reconstruction per-           of Grand Lake covering the 1983–2018 period (courtesy of
formance on several hydro-climatic processes (i.e., snow ac-          the U.S. Geological Survey) show that Grand Lake ice cover
cumulation during the winter, timing of the snowmelt, spring          starts to melt at the Naskaupi and Beaver river mouths. This
precipitation). Moreover, the uncertainty of the hydrological         ice melting pattern creates open bays where drifting floating
reconstruction is less important for recent periods (>1950),          ice melts, thereby depositing ice-rafted debris (Lamoureux,
due to the better quality of the geopotential height field re-        1999, 2004) as observed in the early spring layer facies. The
analysis over recent decades, as more stations series are             overlying detrital layers are interpreted as flood-induced tur-
available and, thus, used in the reanalysis. The decrease in          bidites deposited at the lake bottom during the open-water
the uncertainty related to reanalysis over time might explain         season. High-energy sediment-laden river flows produce hy-
the better correlation between the two approaches for the re-         perpycnal flows allowing silt and sand-sized sediments to
cent period.                                                          reach the cored sites (Cockburn and Lamoureux, 2008). The
                                                                      sharp contact boundary between the early spring layer and
                                                                      the detrital layer at the top part of the early spring layer sup-
5     Discussion                                                      ports the hypothesis that the detrital layers originate from
                                                                      underflows (Mangili et al., 2005). The sediment waves on
5.1    Grand Lake varve formation                                     the Naskaupi and Beaver river delta slopes (Trottier et al.,
                                                                      2020) (Fig. 1b, c) also indicate significant downstream sedi-
Lakes containing well-defined and continuous varved se-               ment transport by supercritical density flows (Normandeau
quences that allow for the establishment of an internal               et al., 2016). The thick and grading upward basal part of
chronology are rare in boreal regions. However, the great             the detrital layers are deposited during the high spring dis-
depth of Grand Lake, the availability of fine sediments in its        charge period generated by snowmelt runoffs. The lack of
watershed due to the glacial and postglacial history of the re-       erosion marks between the early spring layer and the detrital
gion (Trottier et al., 2020), as well as its important seasonal       layer and the incorporation of rare cohesive sediment clasts
river inflow have favoured the formation and preservation of          within the detrital layer suggest that erosion of the underly-
exquisite and thick varves. The seasonal streamflow regime            ing early spring layers occurs in more proximal and energetic
plays a significant role in the annual cycle of sedimentation         settings. Three observations justify the combination of varve
in Grand Lake and is responsible for the formation of the             measurements from the three coring sites : (1) the sedimen-
three distinct varve layers. Due to the thickness and the clar-       tary processes inferred from the observation of thin sections,
ity of the varve structures, it is possible to infer the deposition   the high-resolution bathymetric and the sub-bottom surveys
mechanism for each layer and the season in which they were            are similar; (2) the similarity of the varve facies and proper-
deposited.                                                            ties for each single year at the three different sites suggests a
   The early spring layers are interpreted to be deposited dur-       sedimentary pattern devoid of disturbances due to local fac-
ing the river and lake ice break-up and disintegration pe-            tors; (3) grains-size differences are too subtle to infer differ-
riod, when erosion and resuspension of fine-grained sedi-             ent sedimentary processes and environments. The upper part
ments are initiated but still low. Available Landsat 8 images

Clim. Past, 17, 653–673, 2021                                                              https://doi.org/10.5194/cp-17-653-2021
A. Gagnon-Poiré et al.: Reconstructing past hydrology of eastern Canadian boreal catchments 667
of varve structure in core NAS-1 shows the most perceptible
difference after 1972 (see discussion below). In spring, river
discharge reaches annual peaks and sediment transport ca-
pacities that are then not reached again during the rest of the
summer and autumn (Figs. 2, 3c, 11). However, the presence
of thin coarser intercalated sub-layers in the upper part of the
detrital layer indicates that some rainfall events, as observed
in Fig. 11 (i.e., 1983, 1987, 1992 and 1999), also contribute
to the deposition of sediments in this layer. The overlying au-
tumn and winter layer resulted from the settling and floccu-
lation of fine particles under non-turbulent conditions from
autumn through to the onset of lake ice, forming a typical
clay cap.
5.2 Anthropogenic influences on recent sedimentation
Anthropogenic environmental impacts on watersheds can be
preserved in varved lake sediments (Zolitschka et al., 2015;
Saarni et al., 2016; Czymzik et al., 2018). Changes observed
in physical parameters of the varves deposited pre- and post-
1971 at the NAS sites suggest that the effect of the dyke
system on the Naskaupi River sediment inputs is percepti-
ble in the Grand Lake varved sequence. The well-developed
layers of varves deposited prior to 1972 from sites NAS-1
(Fig. 6b) and NAS-2 as well as the similarity between TVT
and DLT values and variations among all sites over the 1856–
1971 period (Fig. 6d) indicate that seasonal sedimentation
cycles appeared to have reached a relative state of equilib-
rium prior to the Naskaupi River diversion. The reduction of
nearly half of the area of the Naskaupi River watershed, due
to its diversion in April 1971, reduced the water inflows and
changed the base level of the downstream river system. The
rapid base level fall must have triggered modifications in the
fluvial dynamics from late-spring to winter 1971 (i.e., chan-
nel incision, bank destabilization, and upstream knickpoint
migration), likely increasing the availability of sediments in
the river system. The Naskaupi River spring/summer/autumn
flood(s) of 1972 then remobilized and transported a large
amount of newly available floodplain sediment. This major Figure 11. Qualitative comparison between NAS-1A varves from
sediment discharge plunged into Grand Lake and extended thin sections (delimited by the black bars) and the hydrographs
as hyperpycnal flow at the axis of the Naskaupi River, de- of the Naskaupi River. Observed annual Q-mean and Q-max as
positing a thick and coarse-grained turbidite following the well as the timing and rise time of the peak spring discharge
lake bathymetry. This 1972 marker bed suggests that the are shown. Black dotted lines represent the discharge threshold
Naskaupi River diversion had an impact on sedimentation at of ∼ 125 m3 s−1 . The years 1999, 1992, 1986 and 1983 represent
sites NAS-1 and NAS-2. strong spring floods associated with thick coarse varves. The years
The thin early spring layers free of ice-rafted debris in 1995 and 1987 represent low spring floods associated with thin
varve post-1971 in cores NAS-1 (Figs. 5a, 11) and NAS-2 varves. The years 1999, 1992, 1987 and 1983 represent coarser in-
tercalated sub-layers in the upper part of the detrital layer linked
indicate a decrease in the capacity of early spring discharge
with summer and autumn high-discharge events. The year 1986 rep-
to transport fine sediments and its ability to float ice to Grand resents a strong spring flood with a low summer and autumn flow
Lake (see Sect. 4.1) due to the reduction in water supply associated with a varve without substructure. Thin sections are over-
caused by the Naskaupi River diversion. The increases in the lain by iron (Fe, yellow line), strontium (Sr, blue line) and calcium
thickness and particle size values of the detrital layers post- (Ca, black line) relative intensities. See Fig. 5 for thin sections lo-
1971 in core NAS-1 (Figs. 5a, 6b, 7b, 11) suggest that the cations.
diversion has affected sedimentation at this site over time.
During the 1972–2016 period, the river floodplain morphol-
https://doi.org/10.5194/cp-17-653-2021 Clim. Past, 17, 653–673, 2021668 A. Gagnon-Poiré et al.: Reconstructing past hydrology of eastern Canadian boreal catchments ogy must have been in a re-equilibration phase favourable mentation dynamics but did not modify it drastically. Despite to erosion, sediment transport, and deposition of thicker and the observed post-diversion changes in varves’ physical pa- coarser detrital layers. Since the river diversion, detrital lay- rameters in cores NAS-1 and NAS-2, which are moderate, ers at the NAS-1 site appear to have become more sensitive the varves still responded directly to variations in river dis- to maximum spring discharge variations than to mean annual charge. In addition, the part of the watershed that has been discharges. The sensitivity of the more proximal NAS-1 site diverted is an area composed mainly of lakes, which are not to Naskaupi River extreme discharge variability may partly very hydrologically reactive. explain why better results are obtained without the 1972– 2016 period when reconstructing Q-mean and by keeping 5.3 The hydrological signal in the varve record this period when reconstructing Q-max. The negative corre- lations between P99D0 of core NAS-1 and the timing and rise The significant correlations between continuous varve thick- time of spring discharge (Table 3) also demonstrate reactiv- ness and particle size measurements with instrumental hy- ity to spring entrainment energy conditions at this site. The drological variables (Table 3) show that Grand Lake varved distal NAS-2 site shows that sedimentation seems to have sediments are reliable proxies to reconstruct past hydro- slightly lost sensitivity to river discharge post-1971 and that logic conditions through time at the annual to seasonal scale. sediment input continued to decline at the beginning of the The thick and/or coarse-grained varves correspond well to deep lake basin. The increase in sediment input at the NAS-1 years of high river discharges, whereas thin and/or fine- site after 1971 contrasts with the decrease in sediment input grained varves are related to years of low discharge. More- at the NAS-2 site. This recent difference in sedimentation over, Fig. 11 clearly demonstrates how the Grand Lake varve between these two sites could be explained by the increased record can be exploited to examine the interaction between availability of sediments for erosion on the floodplain, which meteorological conditions and river discharge at an inter- would have favoured the accumulation of additional sedi- seasonal scale, which is a temporal resolution rarely obtained ments mainly on the front of the delta (NAS-1), whereas the with natural proxies. reduction in maximum discharges due to a smaller watershed Data from the three sites were combined in order to better would have resulted in a decrease in the river’s transport ca- capture the regional hydrological signal and to somehow at- pacity to site NAS-2. tenuate the noise that is inherent from the analysis of a single It is indeed tempting to link the decrease in varve thick- core in a very large lake. A single core will be more sensitive ness in core NAS-2 over the 1972–2016 period to the dis- to local specificities and is probably less representative of the charge reduction due to the river diversion. However, similar- entire hydrogram. The Beaver and the Naskaupi rivers have ities with core BEA-1, a site devoid of anthropogenic pertur- adjacent catchments that share the same climatological and bations (unaffected by the Naskaupi River diversion) which geological characteristics, whereas the Beaver River’s catch- also shows a decline in varve thickness, suggest that this de- ment is devoid of anthropogenic modifications. The combi- crease could potentially be due to natural hydro-climatic con- nation of varve parameters from different coring sites with ditions. The observed Naskaupi River Q-mean series also distinct sediment sources (Fig. 1b) improved the correlations show a decrease in the 1978–2011 period. Indeed, because of with local and regional hydrological variables (Table 3) and, the distant location of site BEA-1 from the Naskaupi River thus, the reconstructions (Figs. 8, 9). Integrating core BEA mouth, the diversion is most likely not responsible for the de- into the combined data allows one to capture the hydrologi- crease in varve thickness in this sector. Moreover, it is quite cal signal from a larger region (Naskaupi and Beaver water- unlikely that the sedimentary input from the Naskaupi River sheds), and it helps to capture the natural hydrological signal contributed to sediment accumulation at the mouth of the in our combined series used for reconstructions. Beaver River. The absence of any traces of the 1972 marker As demonstrated by previous studies on varved sediments, bed at the Beaver River mouth (BEA-1) supports this hypoth- the use of both varve thickness and particle size analysis al- esis. Furthermore, the thickness decrease observed in BEA-1 lows for a more specific investigation of the range of hy- began after ∼ 1920 (Fig. 6a), which is before the 1971 diver- droclimate conditions recorded within varves (Francus et sion. al., 2002a; Cockburn and Lamoureux, 2008; Lapointe et al., Anthropogenic modification of the Naskaupi River water- 2012). For Grand Lake, the combined DLT is found to be shed makes it challenging to discuss natural hydroclimate- the best proxy to reconstruct all hydrological events occur- related variations before and after 1971. Some caution should ring throughout the year (Q-mean). DLT series are better be applied when comparing pre- and post-1972 reconstruc- at predicting Q-mean because the early spring layer’s and tions, given the changes in watershed conditions that hap- autumn and winter layers’ thickness are more variable and pened after the construction of the system of dykes. There are are included in the TVT measurements. This variability can no instrumental data available for the Naskaupi River water- be linked to specific climatic and geomorphological parame- shed before 1971 to confirm that the calibration model post- ters such as the duration of ice cover on Grand Lake and the diversion (1978–2011) is similarly robust for the preceding Naskaupi River ice break-up processes which induce noise period. The river diversion affected the Naskaupi River sedi- in the hydrologic signal contained in TVT series. The com- Clim. Past, 17, 653–673, 2021 https://doi.org/10.5194/cp-17-653-2021
A. Gagnon-Poiré et al.: Reconstructing past hydrology of eastern Canadian boreal catchments                                    669

bined P99D0 yields the strongest correlation in our dataset         2006 to 2016 (Fig. 10). These results agree with the down-
(Table 3) and is the best proxy to reconstruct maximum an-          ward trend of the annual streamflow observed in eastern
nual discharges (Q-max). This result is logical because the         Canada during the 20th century in other studies and also with
peak discharge is controlling the competence of the river and,      the reported higher river discharges from 1970 to 1979 and
consequently, the size of the particles that can be transported.    from 1990 to 2007, and lower discharges from 1980 to 1989
Moreover, this indicator is not sensitive to sediment com-          (Zhang et al., 2001; Sveinsson et al., 2008; Jandhyala et al.,
paction, which may affect other proxies based on thickness.         2009; Déry et al., 2009; Mortsch et al., 2015; Dinis et al.,
   The significant positive correlations between varve phys-        2019).
ical parameters and Q-max and Q-nival (Table 3) demon-                 In addition to providing a new high-quality varved record
strate that Grand Lake varve predominantly reflects spring          in eastern Canada, this research highlights the complemen-
discharge conditions (e.g., Ojala and Alenius, 2005; Lam-           tarity between palaeohydrological reconstructions extracted
oureux et al., 2006; Saarni et al., 2016; Czymzik et al., 2018),    from clastic varved sediments and rainfall–runoff modelling.
which is the major component of the regional streamflow             Both methods independently offer a similar, yet robust, cen-
regimes classified as nival (snowmelt dominated) (Bonsal et         tennial perspective on river discharge variability in an im-
al., 2019). In boreal regions, the intensity and length of spring   portant region for the economic and sustainable develop-
floods are controlled by the snow accumulation during win-          ment of water resources in Canada. Reconstructed long-term
ter and by the temperature of the melting period (Hardy et          mean and maximum annual river discharge series provide
al., 1996; Snowball et al., 1999; Cockburn and Lamoureux,           valuable quantitative information particularly for water sup-
2008; Ojala et al., 2013; Saarni et al., 2017). The negative        ply management for hydropower generation and the estima-
correlation between P99D0 of the NAS-1 and the timing and           tion of flood and drought hazards. The varved sediment of
rise time of spring discharge suggests that early spring flows      Grand Lake also allows for documentation of the effect of
that increase rapidly are conducive conditions for high en-         dyke systems on the downstream sediment transport dynamic
trainment energy and the deposition of coarser laminations          into a watershed and its implication for palaeohydrological
on the distal part of the delta slope (Fig. 11; site NAS-1). The    reconstruction. Further investigation of the impacts of the
erosion of detrital materials in early spring increases when        Naskaupi watershed reduction on sediment transport could
snowmelt runoffs occur on soils that are not yet stabilized and     help better refine these reconstructions. Future work in Grand
protected by vegetation (Ojala and Alenius, 2005; Czymzik           Lake should be directed towards the high-resolution analysis
et al., 2018).                                                      of long sediment cores in order to produce longer reconstruc-
   Intercalated sub-layers in the upper part of the detrital        tions. The Grand Lake deeper varved sequence potentially
layer are interpreted to be produced by summer or fall rain-        recorded the hydro-climatic variability that occurred during
fall events (Fig. 11). The significant positive correlations be-    the late Holocene in a region sensitive to the North Atlantic
tween varve thickness and Nb-days-SupQ80 suggests that a            climate, allowing interesting prospects into large-scale atmo-
daily discharge of ∼ 125 m3 s−1 represents an approximate           spheric and oceanic modes of variability.
threshold above which the deposition of coarse sediments in
Grand Lake (detrital layers) is more likely to occur (Fig. 11)      6    Conclusions
(e.g., Czymzik et al., 2010; Kämpf et al., 2014). According
to the instrumental data (Figs. 2, 11), such discharge can be       The great depth of Grand Lake, the availability of fine sedi-
generated during the summer/autumn period, confirming that          ments along its tributaries and its important seasonal river in-
rainfall events can indeed be triggering the deposition of the      flow have favoured the formation and preservation of fluvial
thin intercalated sub-layers observed in the upper part of the      clastic laminated sediments. By using a new varved record
detrital layers (Fig. 11).                                          in eastern Canada and a rainfall–runoff modelling approach,
   The comparison between the Naskaupi River hydrological           this paper provides a better understanding of the recording
variables and other Labrador hydrometric stations (Fig. 3)          of hydrological conditions in large and deep boreal lakes and
show that a coherent regional hydrological pattern exists in        allows for the extension of the discharge series beyond the
the Labrador region. The performed regional Q-mean recon-           instrumental period as well as the spatial coverage of the rare
stitution and validation (Fig. 9) indicated that the Labrador       annual palaeohydrological proxies in North America. The
region hydrologic signal is recorded in the Grand Lake varve        key results of this study are as follows:
sequence. The local and regional Q-mean reconstructions
                                                                        – The annual character of the 160-year-long lamination
from the combined DLT series (without the NAS-1 1972–
                                                                          sequence has been confirmed. Each varve, composed of
2016 period) suggest a statistically significant decreasing
                                                                          an early spring layer, a spring/summer/autumn detrital
trend in mean annual discharge during the last 90 years.
                                                                          layer, and an autumn and winter layer, represents 1 hy-
Naskaupi River Q-mean and Q-max reconstructions based
                                                                          drological year.
on both varve series and rainfall–runoff modelling revealed
high-value periods from 1975 to 1985 and from 1995 to                   – Grand Lake varve formation is mainly related to the
2005, and low-value periods from 1986 to 1994 and from                    largest hydrological event of the year, the spring dis-

https://doi.org/10.5194/cp-17-653-2021                                                            Clim. Past, 17, 653–673, 2021
You can also read