Body Temperature Is Associated With Cognitive Performance in Older Adults With and Without Mild Cognitive Impairment: A Cross-sectional Analysis ...
←
→
Page content transcription
If your browser does not render page correctly, please read the page content below
ORIGINAL RESEARCH
                                                                                                                                        published: 12 February 2021
                                                                                                                                    doi: 10.3389/fnagi.2021.585904

                                          Body Temperature Is Associated With
                                          Cognitive Performance in Older
                                          Adults With and Without Mild
                                          Cognitive Impairment: A
                                          Cross-sectional Analysis
                                          Patrick Eggenberger 1,2 *, Michael Bürgisser 1,2 , René M. Rossi 1 and Simon Annaheim 1
                                          1
                                           Empa, Swiss Federal Laboratories for Materials Science and Technology, Laboratory for Biomimetic Membranes and
                                          Textiles, St. Gallen, Switzerland, 2 Department of Health Sciences and Technology, Institute of Human Movement Sciences
                                          and Sport, ETH Zurich, Zurich, Switzerland

                                          Wearable devices for remote and continuous health monitoring in older populations
                                          frequently include sensors for body temperature measurements (i.e., skin and core
                                          body temperatures). Healthy aging is associated with core body temperatures that
                                          are in the lower range of age-related normal values (36.3 ± 0.6◦ C, oral temperature),
                                          while patients with Alzheimer’s disease (AD) exhibit core body temperatures above
                                          normal values (up to 0.2◦ C). However, the relation of body temperature measures with
                                          neurocognitive health in older adults remains unknown. This study aimed to explore
                           Edited by:     the association of body temperature with cognitive performance in older adults with
                   Annalena Venneri,
                                          and without mild cognitive impairment (MCI). Eighty community-dwelling older adults
           The University of Sheffield,
                    United Kingdom        (≥65 years) participated, of which 54 participants were cognitively healthy and 26
                     Reviewed by:         participants met the criteria for MCI. Skin temperatures at the rib cage and the scapula
                    Ricardo Osorio,       were measured in the laboratory (single-point measurement) and neuropsychological
  New York University, United States
                     Paolo Caffarra,
                                          tests were conducted to assess general cognitive performance, episodic memory, verbal
           University of Parma, Italy     fluency, executive function, and processing speed. In a subgroup (n = 15, nine healthy,
                *Correspondence:          six MCI), skin and core body temperatures were measured continuously during 12 h
                Patrick Eggenberger       of habitual daily activities (long-term measurement). Spearman’s partial correlation
   patrick.eggenberger@hest.ethz.ch
                                          analyses, controlled for age, revealed that lower median body temperature and higher
            Received: 21 July 2020        peak-to-peak body temperature amplitude was associated with better general cognitive
        Accepted: 19 January 2021         performance and with better performance in specific domains of cognition; [e.g., rib
       Published: 12 February 2021
                                          median skin temperature (single-point) vs. processing speed: rs = 0.33, p = 0.002;
                            Citation:
         Eggenberger P, Bürgisser M,
                                          rib median skin temperature (long-term) vs. executive function: rs = 0.56, p = 0.023;
           Rossi RM and Annaheim S        and peak-to-peak core body temperature amplitude (long-term) vs. episodic memory:
          (2021) Body Temperature Is
                                          rs = 0.51, p = 0.032]. Additionally, cognitively healthy older adults showed lower median
            Associated With Cognitive
Performance in Older Adults With and      body temperature and higher peak-to-peak body temperature amplitude compared
Without Mild Cognitive Impairment: A      to older adults with MCI (e.g., rib median skin temperature, single-point: p = 0.035,
             Cross-sectional Analysis.
  Front. Aging Neurosci. 13:585904.
                                          r = 0.20). We conclude that both skin and core body temperature measures are potential
     doi: 10.3389/fnagi.2021.585904       early biomarkers of cognitive decline and preclinical symptoms of MCI/AD. It may

Frontiers in Aging Neuroscience | www.frontiersin.org                            1                                     February 2021 | Volume 13 | Article 585904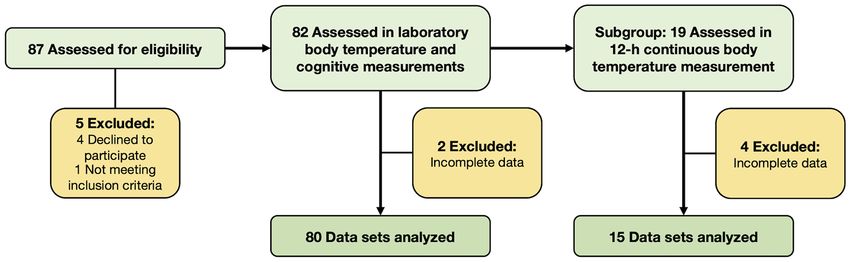
Eggenberger et al.                                                                                           Body Temperature and Cognitive Performance

                                          therefore be promising to integrate body temperature measures into multi-parameter
                                          systems for the remote and continuous monitoring of neurocognitive health in
                                          older adults.
                                          Keywords: mild cognitive impairment, dementia, Alzheimer’s disease, core body temperature, skin temperature,
                                          circadian temperature rhythm, cognitive performance, health monitoring

INTRODUCTION                                                                    including faster gait speed, reduced 400-m-walk time, and
                                                                                lower perceived exertion after walking 5 min at 0.67 m/s
The aging population is steadily growing worldwide and                          (Simonsick et al., 2016). Core body temperatures vary depending
age-related health issues and healthcare costs are concomitantly                on the measurement site, with rectal temperatures being 0.3◦ C
increasing. Therefore, novel approaches of remote and                           higher than ear-based, 0.7◦ C higher than oral, and 0.9◦ C
continuous health monitoring (telemonitoring) are becoming                      higher than axillary temperatures (Lu et al., 2010). Older
continuously more significant. The goal is to enable older                      adults’ normal average core body temperature is 37.1◦ C (range
adults to live at home independently for as long as possible                    across studies: 37.0–37.2◦ C) for rectal temperature measurement
and also provide older patients the opportunity to return                       (Lu et al., 2010) and 36.3 ± 0.6◦ C for oral temperature
home earlier after a stay in the hospital (Wagner et al.,                       measurement (Waalen and Buxbaum, 2011), respectively. In
2012). Remote and continuous health monitoring could allow                      comparison, in younger people, the average rectal temperature
detecting symptoms of illness and functional decline at the                     is about 0.4◦ C higher (37.5◦ C) and the oral temperature is
earliest possible stage. This facilitates the early implementation              higher for about 0.7◦ C (37.0◦ C; Lu et al., 2010; Blatteis,
of preventive or therapeutic measures and thus potentially                      2012). This difference is caused by age-related decrements
improves therapeutic efficacy (Pantelopoulos and Bourbakis,                     in vasomotor sweating function, skeletal muscle response,
2010). Together, early recognition and treatment may contribute                 temperature perception, and physical behaviors which affect
to reducing healthcare costs for expensive inpatient monitoring                 older adults’ ability to maintain optimal core body temperature
and long-term treatment at hospitals or nursing homes for the                   (Lu et al., 2010).
elderly (Deen, 2015; Majumder et al., 2017). Recent advances in                     In patients with Alzheimer’s disease (AD), core body
non-invasive sensor technologies and the mounting availability                  temperature (assessed by rectal temperature measurement) is
of wearable monitoring devices render the application of                        significantly elevated by 0.10◦ C on average (95% confidence
remote and continuous health monitoring increasingly feasible                   interval 0.0068–0.1950◦ C) in comparison to normal values of
(Wang et al., 2017). It needs to be considered, however,                        non-demented older persons. This finding was reported in a
that the accuracy of many of these devices has not yet been                     meta-analysis summarizing six independent studies including a
adequately validated (Dunn et al., 2018). Such monitoring                       total of 90 AD patients and 78 healthy controls (Klegeris et al.,
systems typically assess physical activity patterns, indoor and                 2007). The disturbance in core body temperature regulation
outdoor position of the person, as well as important vital                      represents a severe autonomic symptom of AD and might
signs, including heart rate, respiratory rate, blood pressure,                  be an early indicator or predictor of AD onset (Carrettiero
oxygen saturation, and body temperature (Pantelopoulos                          et al., 2015). The increased body temperature in AD pathology
and Bourbakis, 2010; Wang et al., 2017). In home-care                           might be related to neuroinflammation (Klegeris et al., 2007).
settings for older adults and in nursing homes for the                          Pro-inflammatory cytokines, comprising interleukin (IL)-1, IL-6,
elderly, core body temperature is commonly assessed with                        and tumor necrosis factor (TNF)-α, are upregulated in the brain
single-point measurements of oral or axillary temperature                       tissue and cerebrospinal fluid of patients affected by AD, which
to detect acute infections and fever (High et al., 2009;                        provides proof for brain inflammation (McGeer and McGeer,
Hamano and Tokuda, 2017). However, body temperature                             2002; Calsolaro and Edison, 2016). These specific circulating
may additionally provide valuable information to monitor                        cytokines are also believed to be the main endogenous pyrogens,
long-term overall health and neurocognitive health in older                     inducing fever, and affecting thermoregulation (Netea et al.,
adults as subsequently described.                                               2000). Nevertheless, whether neuroinflammation represents a
    Healthy older persons’ core body temperatures were found                    protective or harmful mechanism in neurodegenerative diseases
to be in the lower range of age-related normal values                           is still under debate (Calsolaro and Edison, 2016). Another
and, consequently, lower core body temperature represents                       hallmark of AD pathology (and other neurodegenerative
a biomarker for healthy aging and longevity (Flouris and                        disorders) that might be associated with the increased body
Piantoni, 2015; Simonsick et al., 2016). In a 25-year follow-up                 temperature in affected individuals are intracellular inclusions
study, older participants with core body temperatures in the                    of phosphorylated tau (p-tau) proteins in the brain (Carrettiero
lower 50% of the population, had significantly lower mortality                  et al., 2015). Notably, hypothermia related to anesthesia in
than those with core body temperatures in the upper 50%                         animal and human studies, significantly raises p-tau levels in the
(Roth et al., 2002; Waalen and Buxbaum, 2011). Furthermore,                     brain and cerebrospinal fluid, potentially impacting the genesis
lower early morning core body temperature (assessed by oral                     and/or progression of AD (Whittington et al., 2013). Within this
thermometer measurement) is related to better physical fitness,                 context, it was speculated that the increased body temperature

Frontiers in Aging Neuroscience | www.frontiersin.org                       2                                 February 2021 | Volume 13 | Article 585904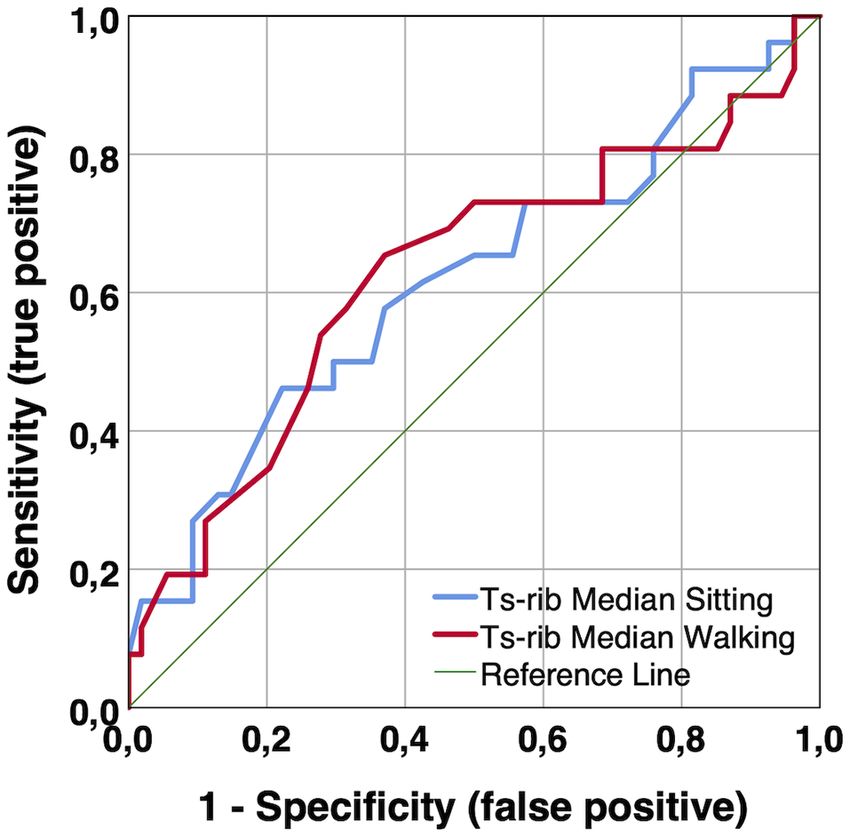
Eggenberger et al.                                                                                     Body Temperature and Cognitive Performance

in AD patients may be the result of a compensatory reaction                long-term continuous body temperature measures are related to
to counteract the elevated cytotoxic p-tau levels to preserve              cognitive performance in older adults and if these parameters
cognitive functioning (Carrettiero et al., 2015).                          are different in older persons with or without MCI. This
    Continuous 24-h body temperature measurements depict                   knowledge, however, would be critical to estimate the association
the typical rise and fall of body temperature over a day and               of body temperature with neurocognitive health of the aging
night, respectively, and reveal circadian rhythm disruptions               population and, consequently, to interpret body temperature
in aging. These are common in older adults, however, are                   data assessed with novel wearable systems for remote and
more severe in age-related neurodegenerative diseases, such                continuous health monitoring.
as AD, AD-related dementias, and Parkinson’s disease (Leng                    Therefore, this study aimed to investigate the association
et al., 2019). Dysfunctions of 24-h circadian rhythms encompass            of single-point and long-term continuous body temperature
disturbed sleep-wake and rest-activity cycles, as well as impaired         measures with cognitive performance in cognitively healthy
hormonal and body temperature rhythms, and manifest before                 older adults and in those with MCI. Thereby, this investigation
symptoms of neurodegeneration are clinically evident (Leng                 will allow us to evaluate the suitability of various body
et al., 2019). Therefore, parameters that reflect disruptions of           temperature parameters as early biomarkers of cognitive decline,
circadian function may not only serve as early biomarkers of               as well as preclinical and prodromal (i.e., MCI) symptoms
neurodegeneration but might also represent risk factors for                of AD. We hypothesized, that: (1) lower single-point and
the development of neurodegenerative diseases in healthy older             long-term body temperature averages; and (2) higher long-term
adults (Ju et al., 2017; Leng et al., 2018; Musiek et al., 2018).          body temperature amplitudes are associated with better
The amplitude of the circadian core body temperature rhythm                cognitive performance.
(assessed by rectal temperature measurement) is dampened by
20–40% in healthy older compared to younger adults, who                    MATERIALS AND METHODS
typically show a lower temperature nadir (i.e., the lowest value
during the circadian rhythm; Vitiello et al., 1986; Czeisler et al.,       Study Design and Participants
1992; Dijk et al., 2000; Hood and Amir, 2017). In patients with            The present study is a cross-sectional analysis that involves
AD, circadian core body temperature amplitude (also assessed               a single national center. Measurements were performed at
by rectal temperature measurement) was found to be reduced                 Empa in St. Gallen, Switzerland. The ethics committee of
by even 50% compared to young adults, and this effect appeared             eastern Switzerland approved the study protocol (project-ID
to be more pronounced than in healthy older persons (Harper                2019-01295, EKOS 19/105) and the study was registered at
et al., 2005). Likewise, in patients with Lewy body dementia,              ClinicalTrials.gov with the identification code NCT04262674
the nocturnal amplitude of core body temperature (assessed                 (ClinicalTrials.gov., 2017). The planned methods remained
by ingestible telemetric temperature pill measurement) was                 unchanged after the start of the experiments and our reporting
diminished in comparison to healthy controls (Raupach et al.,              of this study adheres to the STROBE guidelines for observational
2019). Harper et al. (2005) proposed that the reduced core                 studies (von Elm et al., 2014).
body temperature amplitude may be partially associated with                    Healthy older adults and patients with MCI at the age
lower levels of physical activity which are generally observable           of 65 years and above, living independently or in retirement
in both healthy older adults and patients with AD. Therefore,              homes for the elderly, were recruited from August until
behavioral alterations related to normal aging in combination              September 2019. Participants were recruited through local
with disease-specific changes may drive disruptions of circadian           organizations that offer a variety of activities for older adults,
rhythms in AD.                                                             including for instance lecture series or physical activities,
    Certain early circadian rhythm disturbances associated with            as well as through advertisement in retirement homes, at
AD are already evident in older adults with mild cognitive                 primary care physicians, and in the organization of retired
impairments (MCI). These include a phase advance of the wrist              employees of our research institution. An information event
skin temperature and motor activity circadian rhythm (i.e., a              was organized for interested persons. The measurement sessions
phase shift with minimum and maximum values occurring                      were conducted from mid-September until October 2019. For
earlier during the day) compared to healthy persons of the same            eligibility, participants had to sign an informed consent and
age (Ortiz-Tudela et al., 2014), as well as sleep disruptions based        had to be able to walk at least 8 min at their preferred walking
on polysomnography and melatonin measurements (Naismith                    speed for measurements during activity, with or without walking
et al., 2014). MCI is a condition referred to as a potential               aids. Older persons living in retirement homes and who are
prodromal state of AD, where the individual shows objective                classified 0, 1, or 2 within the Swiss classification system for
cognitive impairments but is still able to independently perform           health-care requirements (BESA-levels, a German abbreviation
activities of daily living (Langa and Levine, 2014; Vermunt et al.,        for Bewohner-Einstufungs- und Abrechnungs-System) could
2019). Consequently, these findings in MCI patients support                participate in the study. Level 0 indicates that the person
the above-mentioned assumption that parameters assessing                   does not need care or treatment; level 1–2 indicates that the
circadian rhythm, including body temperature measures among                person only needs little care or treatment. Older adults with
others, might serve as early biomarkers of preclinical and                 previously diagnosed dementia, e.g., Alzheimer’s disease, or
prodromal symptoms of AD. Nevertheless, to the best of our                 recent head injury were excluded. In the case of acute or unstable
knowledge, it has not been investigated yet if single-point and            chronic diseases (e.g., stroke, diabetes) and rapidly progressing

Frontiers in Aging Neuroscience | www.frontiersin.org                  3                                February 2021 | Volume 13 | Article 585904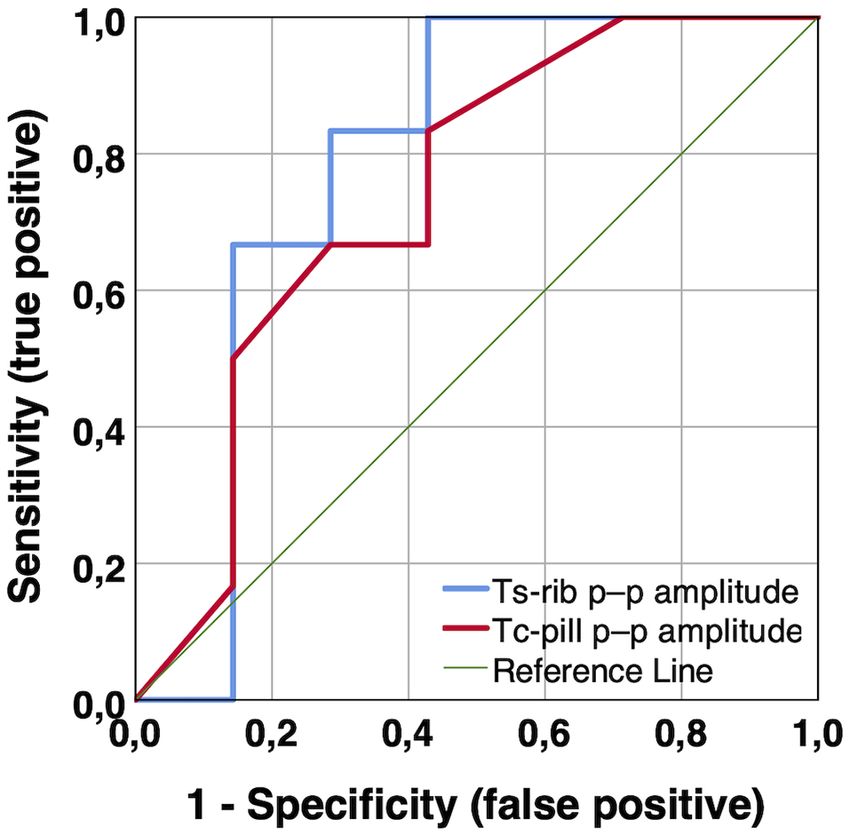
Eggenberger et al. Body Temperature and Cognitive Performance
or terminal illnesses, judgment by the participant’s primary care polyolefin cover). Data were recorded at a 0.1 Hz sampling
physician was required before inclusion in the study. Additional rate. Calibration of the temperature sensors (MSR thermistors)
exclusion criteria for the subgroup of participants who agreed was performed at steady states between 15◦ C and 40◦ C
to ingest the telemetric temperature pill, comprised history of (5◦ C intervals) with a calibration chamber (OptiCal, Michell
operations and/or disease related to the gastrointestinal tract Instruments, UK; Eggenberger et al., 2018). Temperature sensors
within the last 5 years, implanted medical devices, planned were attached to a textile one-lead electrocardiogram (ECG)
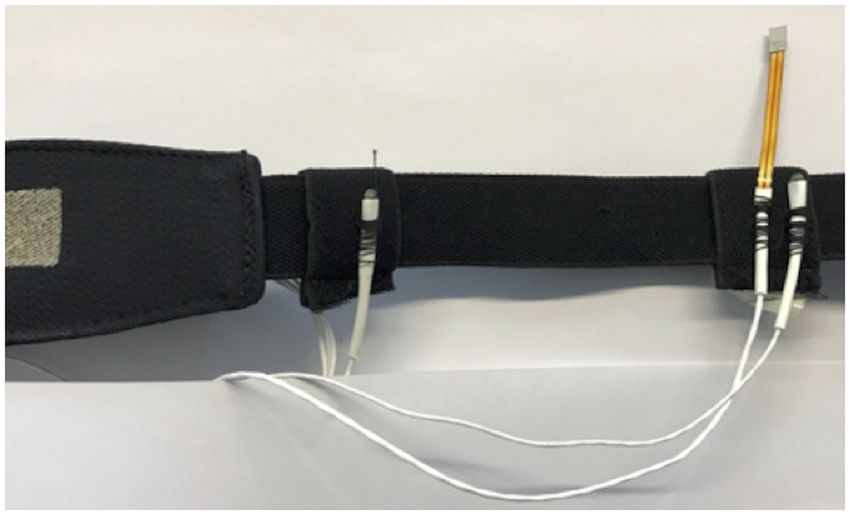
MRI examination, as well as nausea, vomiting, constipation chest belt as illustrated in Figure 1 (Unico swiss tex GmbH,
or abdominal pain within 1 month before the day of the Alpnachstad, Switzerland; Fontana et al., 2019). ECG data were
planned measurement. not analyzed in this study but were considered for another
This cross-sectional analysis represents the baseline aspect of the project. We chose the two skin temperature
measurement of a subsequent randomized controlled trial (RCT) measurement sites based on their previous application in a
including several additional measures. Therefore, a priori power prediction model for core body temperature (Eggenberger
analysis (G∗ Power 3.1.3 Software; Faul et al., 2007) was calculated et al., 2018) and compatibility with the described ECG
related to the requirements of the RCT. A total of 85 participants chest belt.
were needed to achieve 80% power for a two-group pre-and In a subgroup of 19 participants, core body temperature
post-test design. The α-level was set at 0.05 and effect size f at was measured continuously every minute over 16 h using
0.2, i.e., small to medium effect based on results of a similar an ingestible telemetric temperature pill (Tcpill ; e-Celsius
study with older adults (Eggenberger et al., 2016). Performance Pill, BodyCap, Hérouville Saint-Clair, France;
weight: 1.7 g; size: 17.7 × 8.9 mm). Thereby, data was
Experimental Protocol of Laboratory and stored on the pill during the participants’ habitual daily
Long-term Measurements activities and was retrieved upon return to the laboratory via a
All participants attended two testing sessions in the laboratory wireless transmission monitor (e-Viewer Performance monitor,
at Empa in St. Gallen, Switzerland. The sessions lasted 1 h BodyCap, Hérouville Saint-Clair, France) 16 h after ingestion,
each and were performed on separate days. The first test while the pill was not yet excreted by the body. The 16 h period
session comprised measurements of skin temperatures at rest for was chosen based on the large inter-individual variability of
10 min in a seated position at controlled climatic conditions transit times through the gastrointestinal tract (mean 27.4 h,
(22.1 ± 0.6◦ C, 46.9 ± 5.5% relative humidity). Participants range 4.6–82.8 h; Bongers et al., 2015). For data analyses, the
were required not to talk and move during the measurement. first 4 h after ingestion of the telemetric pill were omitted as
Thereafter, measurements of skin temperatures were performed during this time the measurements may be affected by food or
during activity, i.e., walking back and forth on a 20-m fluid intake as long as the pill has not transitioned into the
track at preferred speed for 8 min, under controlled climatic intestinal tract (Wilkinson et al., 2008). Hence, the long-term
conditions (21.0 ± 0.3◦ C, 50.7 ± 4.8% relative humidity). continuous body temperature measurement comprised 12 h in
These two test conditions were chosen to reflect potential total. Additionally, the subgroup participants were wearing the
body temperature differences among two typical daily activities. ECG chest belt with integrated skin temperature sensors for
The second test session included the neuropsychological test the same 16-h time period, to continuously assess long-term
battery to assess cognitive performance. Additionally, in a variations in skin temperatures (Tsrib , Tsscapula ). Participants
subgroup of the participants, long-term continuous skin and were instructed to follow their usual daily routines during the
core body temperature measurements were conducted during the measurement period. None of them reported that they habitually
participants’ habitual daily activities. This measurement period
lasted either from mid-evening until noon or from late evening
until mid-afternoon of the next day, respectively, depending
on when the participant was scheduled for the following test
session in the laboratory. Due to the uniform periodicity of
the circadian body temperature rhythm (i.e., the nadir in the
early morning, peak in the late afternoon; Czeisler et al., 1999),
the aforementioned slight variation of the measurement period
timing would not affect the outcomes. Participants were blinded
to the hypothesized study outcome; however, the investigators
supervised and conducted the testing sessions, and blinding was
therefore not applicable.
Primary Outcome Measures
Body Temperature
Skin temperatures (Ts) at the right lateral rib cage (ribs no. FIGURE 1 | Skin temperature sensors (white) and heat flux sensor (orange)
5/6; Tsrib ) and at the right scapula (inferior angle; Tsscapula ) attached to the ECG belt. Notes: ECG and heat flux data were not analyzed
in this study but were considered for another aspect of the project. ECG,
were measured using MSR thermistors (type DS18B20, MSR
electrocardiogram.
Electronics GmbH, Seuzach, Switzerland; 2 × 5 × 9 mm;
Frontiers in Aging Neuroscience | www.frontiersin.org 4 February 2021 | Volume 13 | Article 585904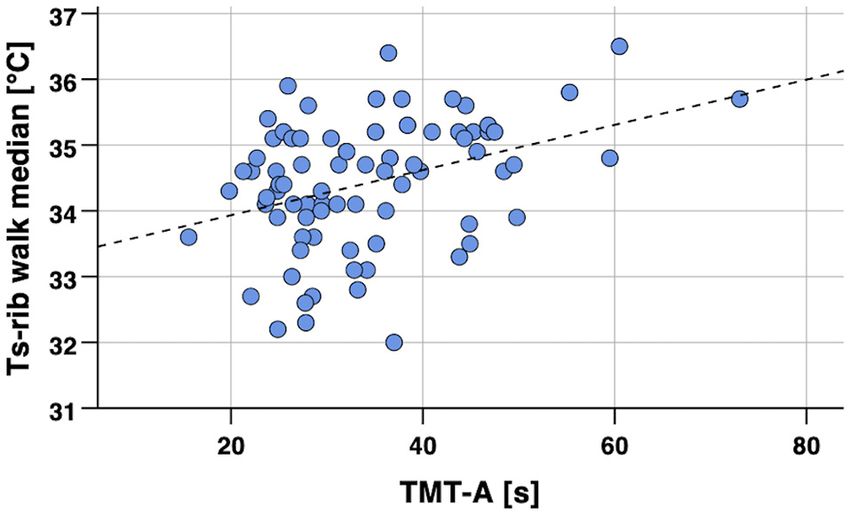
Eggenberger et al.                                                                                        Body Temperature and Cognitive Performance

pursue exceptionally prolonged or intense physical activities              Statistical Analyses
which could be deemed as atypical for this age-group.                      Independent t-tests were used to detect differences in
                                                                           demographic characteristics between the group including
Secondary Outcome Measures                                                 all participants and the subgroup, as well as differences in
Cognitive Performance and Mild Cognitive                                   single-point body temperature and cognitive performance values
Impairment                                                                 between women and men. We calculated Spearman’s partial
Seven neuropsychological tests were conducted to measure                   correlation coefficients to investigate relations between body
cognitive performance and to classify the participants as                  temperature parameters and cognitive performance scores
cognitively healthy or MCI. The test battery included the Quick            while controlling for age since this parameter is related to both
Mild Cognitive Impairment screen (QMCI) to assess general                  body temperature (Waalen and Buxbaum, 2011) and cognition
cognitive performance (O’Caoimh et al., 2016), the Face-Name               (Salthouse, 2019). Thereby, for the body temperature parameters
Associative Memory Exam (FNAME-12) for episodic memory                     assessed in the laboratory (single-point measurement), the
(Papp et al., 2014), the category and letter fluency tests to assess       median value during 10 min sitting and 8 min walking was
semantic and phonemic verbal fluency, respectively (Clark et al.,          used, respectively. For the body temperature parameters
2009; Mueller et al., 2015), the Trail Making Test B (TMT-B;               assessed during the 12-h continuous measurement, the median
Lezak et al., 2012) and the Stroop Word-Color Interference                 temperature and peak-to-peak (p–p) temperature amplitude
Test (Oswald and Fleischmann, 1997) representing the ‘‘shifting’’          (i.e., the range between minimum and maximum value) were
and ‘‘inhibition’’ executive functions, respectively (Miyake et al.,       calculated. Scatterplots of correlation analyses were visually
2000), and the Trail Making Test-A (TMT-A; Lezak et al., 2012)             inspected and z-scores were calculated to identify extreme
for processing speed.                                                      outliers which were defined as z-scores >3.29 (i.e., values
    The following objective criteria were used to classify the             deviating more than 3.29 SD from the mean; Field, 2018).
participants as cognitively healthy or MCI for this study.                 Thereby, it was assessed if outliers would unduly bias the
Cognitively healthy was defined with a QMCI score ≥65,                     results and, therefore, had to be excluded. Excluded values are
together with the other cognitive test scores differing by no              reported in the results section. Furthermore, we performed
more than 1.5 standard deviations (SD) from the group mean                 Mann–Whitney tests to assess differences in single-point
value. MCI was identified either if a QMCI score lower than                laboratory and 12-h continuous body temperature parameters
65 points was observed (O’Caoimh et al., 2016) or if one or                among cognitively healthy and MCI participants. Missing
more of the domain-specific cognitive test results were worse              values due to measurement error were not imputed and
than 1.5 SD’s in relation to the group mean value (Petersen                are also reported in the results section. Based on the use of
et al., 1999; Albert et al., 2011; Papp et al., 2020). The latter          preplanned hypotheses and the exploratory nature of this study,
criterion and the exclusion of participants that were previously           no adjustments of p-values were performed to account for
diagnosed with dementia correspond to the recommendations of               possible multiple comparison effects. Although procedures to
the National Institute on Aging and the Alzheimer’s Association            correct for multiple comparisons are discussed with controversy,
for diagnosing MCI (Albert et al., 2011). We did not include their         many researchers in the field of biomedical sciences recommend
further diagnostic criterion of subjective memory complaints as            not to apply them under the aforementioned premises (Perneger,
this was reported to increase misclassification rates (Edmonds             1998; Streiner and Norman, 2011; Armstrong, 2014; Ranstam,
et al., 2014). The QMCI is very accurate at distinguishing MCI             2016). Instead, effect sizes (i.e., biological or clinical significance)
from normal cognition (area under the curve = 0.90; O’Caoimh               and basic logic reasoning should represent the main criteria
et al., 2016) and is also more accurate in this respect than               to interpret any statistical results (Cabin and Mitchell, 2000;
other widely used short cognitive screening tests, including               Moran, 2003). Statistical analyses were computed with IBM
the Standardized Mini-Mental State Exam (SMMSE) and the                    SPSS Statistics software for Macintosh (version 26, IBM Corp.,
Montreal Cognitive Assessment (MoCA; Glynn et al., 2019).                  Armonk, NY, USA) with a significance level of α = 0.05.
For the MCI classification, the individual cognitive test scores           Considering that a negative result (i.e., p ≥ 0.05) is not proof
were corrected for differences in age and education concerning             of ‘‘no difference’’ since the p-value represents a continuous
normative data and reference studies (Tombaugh, 2004; Van der              variable, we placed more emphasis on effect sizes and highlighted
Elst et al., 2006; Papp et al., 2014; Romero et al., 2018).                also results with notable moderate to large effects that did not
                                                                           achieve statistical significance (Halsey et al., 2015; Amrhein et al.,
Data Processing                                                            2017; Griffiths and Needleman, 2019). Magnitude of effect size r
Calibration factors obtained from the calibration procedure                was considered as small for r = 0.10, moderate for r = 0.30 and
mentioned above were applied to the skin temperature data. No              large for r ≥ 0.50 (Cohen, 1988).
filtering or smoothing of skin temperature data was performed.
Long-term continuous temperature data from the ingestible                  RESULTS
telemetric pill (Tcpill ) was processed with a one-dimensional
fifth order median filter and a filter that excluded values that           Eighty-seven participants initially enrolled in the study, out of
changed by more than 0.2◦ C to the median of the previous 1 min.           which 82 persons were eligible for participation and completed
MATLAB (version R2019a, MathWorks Inc., Natick, MA, USA)                   the two experimental sessions in the laboratory (i.e., the
and Microsoft Excel 2016 software were used for data processing.           single-point body temperature and cognitive performance

Frontiers in Aging Neuroscience | www.frontiersin.org                  5                                   February 2021 | Volume 13 | Article 585904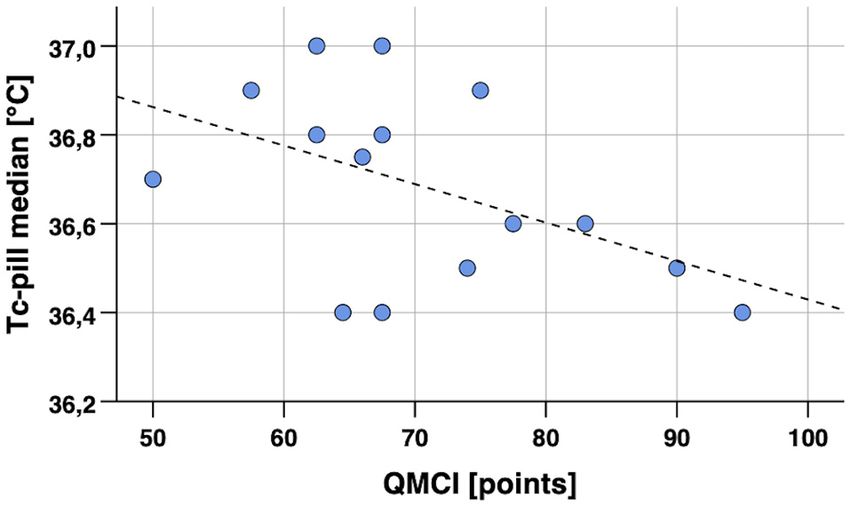
Eggenberger et al.                                                                                                               Body Temperature and Cognitive Performance

  FIGURE 2 | Participants’ flow and reasons for exclusion.

measurements). The data of 80 participants was usable and                                   scores revealed statistically significant associations (p < 0.05)
was included in the analyses. Nineteen of these participants                                for Tsrib during sitting and walking with TMT-A, while no
additionally took part in the 12-h continuous body temperature                              other significant correlations were found as summarized in
measurement during habitual daily activities and the data of                                detail in Table 3. No differences in correlations with cognitive
15 participants was used for the analyses. Participants’ flow and                           performance were obvious for the two body-temperature
reasons for dropouts are depicted in Figure 2. The following                                measurement conditions sitting or walking. Correlation analyses
values were missing due to measurement error in the data                                    were conducted whilst controlling for age. An exemplary
set from the 12-h continuous measurements of the analyzed                                   scatterplot with a significant correlation is presented in Figure 3.
15 participants: all skin temperature values from one participant                           Upon visual inspection of the scatterplots and calculation
and the p–p amplitude values in Tsrib and Tsscapula from one                                of z-scores to screen for extreme outliers (defined as z-
other participant (both participants were included in the analyses                          scores >3.29; Field, 2018), one value was excluded in order to
as their Tcpill data was valid). Demographic characteristics and                            remove undue bias (TMT-A = 168 s; z-score TMT-A = 7.25).
mean values of single-point body temperature and cognitive                                  Related to the above-mentioned significant difference between
performance are reported in Tables 1, 2, respectively. The male                             sexes in the FNAME-12 and letter fluency cognitive tests,
participants were taller and heavier than the female participants,                          we performed a supplementary Spearman’s partial correlation
while the women performed better in the FNAME-12 and                                        analyses (controlling for age) separately for the female and
letter fluency cognitive tests. No other statistically significant                          male participants. Thereby, we correlated the single-point body
differences were found within this context.                                                 temperature parameters (median of Tsrib , Tsscapula ) with these
                                                                                            two cognitive tests. Within the male participants, significant
Correlation of Body Temperature Measures                                                    correlations were evident for Tsrib walking and Tsscapula sitting
With Cognitive Performance                                                                  with FNAME-12 (rs = –0.33, p = 0.041 and rs = –0.32,
Spearman’s partial correlation analyses for the single-point                                p = 0.046) and for Tsrib sitting with letter fluency (rs = –0.32,
body temperature parameters (median of Tsrib , Tsscapula )                                  p = 0.048), whereas no significant associations were found for the
measured in the laboratory and the cognitive performance                                    female participants.

TABLE 1 | Demographic characteristics.

Variable                                        All participants      Subgroup (12-h measurement)              p, two-tailed        Female           Male          p, two-tailed

N                                                       80                             15                                              50              30
Sex, female                                        50,62.5%                        8, 53.3%                        0.509
Age, years                                          74.6 (6.0)                     75.2 (5.5)                      0.702           74.0 (6.2)       75.5 (5.6)        0.297
Height, cm                                           166 (8)                        167 (7)                        0.772            162 (5)          174 (6)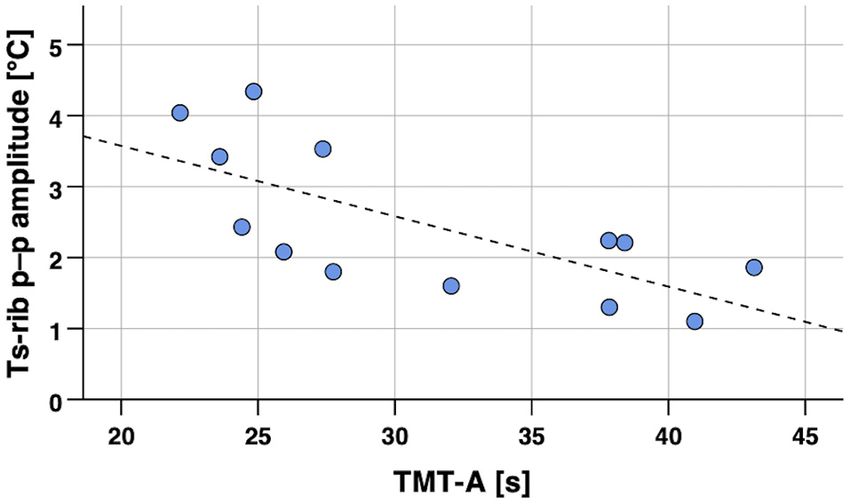
Eggenberger et al.                                                                                                           Body Temperature and Cognitive Performance

TABLE 2 | Single-point body temperature and cognitive performance values.

Variable                                                All participants                       Female                            Male                         p, two-tailed

N                                                         80                                 50                              30
Tsrib sitting median,◦ C                                  34.5 (1.1)                         34.4 (1.1)                      34.6 (1.0)                           0.619
Tsrib walking median,◦ C                                  34.4 (1.0)                         34.4 (1.0)                      34.4 (1.0)                           0.911
Tsscapula sitting median,◦ C                              33.4 (1.0)                         33.3 (1.1)                      33.4 (1.0)                           0.583
Tsscapula walking median,◦ C                              33.4 (1.1)                         33.4 (1.2)                      33.5 (1.0)                           0.640
QMCI, points                                              72.4 (11.6)                        73.9 (12.3)                     70.0 (10.1)                          0.148
FNAME-12, points                                          52.7 (19.9)                        58.0 (20.6)                     43.8 (15.0)                          0.001∗
TMT-A, s                                                  34.3 (10.5)                        34.7 (11.2)                     33.6 (9.3)                           0.667
TMT-B, s                                                  89.2 (53.3)                        88.6 (42.6)                     90.3 (68.3)                          0.886
Stroop, s                                                 44.6 (17.4)                        42.2 (12.5)                     48.7 (23.0)                          0.107
Category fluency, number of words                         21.8 (6.9)                         22.6 (6.9)                      20.4 (6.8)                           0.157
Letter fluency, number of words                           16.4 (5.0)                         17.6 (5.0)                      14.5 (4.3)                           0.005∗

Notes: data are means (standard deviation in brackets). P-values are for comparison of female and male participants. Bold values indicate statistical significance. FNAME-12,
Face-Name Associative Memory Exam; QMCI, Quick Mild Cognitive Impairment screen; TMT-A, Trail Making Test part A; TMT-B, Trail Making Test part B; Tsrib , skin temperature
at rib cage; Tsscapula , skin temperature at scapula; ∗ p < 0.05, statistically significant.

    Spearman’s partial correlation analyses for body temperature                          individuals from those with MCI. The following accuracy values,
parameters measured during 12 h of habitual daily activities                              i.e., area under the curve (AUC), resulted for the different
(median and p–p amplitude of Tsrib , Tsscapula , Tcpill ) and                             body temperature measures. Single-point measurements in the
cognitive performance scores resulted in statistically significant                        laboratory: Tsrib median during sitting and walking, AUC = 0.618
correlations (p < 0.05) for Tsrib with TMT-A and Stroop,                                  (p = 0.089) and 0.626 (p = 0.069), respectively; Tsscapula median
for Tsscapula with TMT-A, and Tcpill with QMCI, FNAME-12,                                 during sitting and walking: AUC = 0.558 (p = 0.402) and 0.551
category, and letter fluency. Additionally, notable non-significant                       (p = 0.466), respectively; long-term continuous measurements
results with moderate to large effect size were found for Tsrib                           during 12-h habitual daily activities: Tsrib , Tsscapula , and Tcpill
with QMCI and FNAME-12, for Tsscapula with Stroop, and                                    median, AUC = 0.698 (p = 0.220), 0.625 (p = 0.439), and 0.583
Tcpill with QMCI and Stroop. Correlation analyses were again                              (p = 0.606), respectively; and Tsrib , Tsscapula , and Tcpill p–p
controlled for age. The corresponding correlation coefficients                            amplitude, AUC = 0.786 (p = 0.086), 0.762 (p = 0.116), and 0.738
are reported in Table 4 and two exemplary scatterplots with                               (p = 0.153), respectively. Exemplary ROC curves for median and
significant correlations are depicted in Figures 4, 5. No extreme                         p–p amplitude temperature measures are depicted in Figures 7,
outliers (defined as z-scores >3.29; Field, 2018) were identified                         8, respectively.
in this data set.
                                                                                          DISCUSSION
Differences in Body Temperature
Measures Between Cognitively Healthy                                                      This study aimed to investigate the association of body
                                                                                          temperature with cognitive performance in older adults with
and MCI Participants
                                                                                          and without MCI. The two main findings were: (1) that
Based on the cognitive performance assessments, 54 participants
                                                                                          better cognitive performance correlates with lower median
were classified as cognitively healthy and 26 participants met
                                                                                          skin temperature measured in the laboratory (i.e., single-point
the criteria for MCI. Mann–Whitney tests showed statistically
                                                                                          measurement), as well as with lower median skin and core
significant differences (p < 0.05) between cognitively healthy
                                                                                          body temperature measured during 12 h of habitual daily
and MCI participants in the single-point body temperature
                                                                                          activities (i.e., long-term continuous measurement) and with
parameters Tsrib median during sitting and walking in the
                                                                                          higher long-term body temperature p–p amplitudes; and (2) that
laboratory as presented in Table 5.
                                                                                          cognitively healthy older adults exhibit lower median skin and
    In the subgroup performing the additional long-term
                                                                                          core body temperature values, as well as higher body temperature
continuous body temperature measurement, nine participants
                                                                                          p–p amplitudes compared to their peers with MCI. Interestingly,
were classified as cognitively healthy and six participants met the
                                                                                          stronger correlations with cognitive performance were found
criteria for MCI. Mann–Whitney tests revealed no statistically
                                                                                          for the long-term compared to the single-point temperature
significant difference (p ≥ 0.05) between cognitively healthy
                                                                                          measurements which potentially highlights an advantage of
and MCI participants in the 12-h continuous body temperature
                                                                                          long-term continuous monitoring approaches compared to
parameters. Notable non-significant differences with moderate
                                                                                          single-point measurements.
to large effect size were found for Tsrib median and p–p
amplitude, Tsscap p–p amplitude, and Tcpill p–p amplitude as
shown in Table 6. Boxplots for the p–p amplitude of Tsrib in
                                                                                          Associations of Single-Point and 12-h
healthy and MCI participants are illustrated in Figure 6.                                 Median Body Temperature With Cognitive
    To follow-up on these findings, we computed supplementary                             Performance
receiver operating characteristic (ROC) curves to assess the                              To our knowledge, this is the first study demonstrating
accuracy of body temperature measures to differentiate healthy                            that lower median body temperature, assessed either as a

Frontiers in Aging Neuroscience | www.frontiersin.org                                 7                                       February 2021 | Volume 13 | Article 585904
Eggenberger et al. Body Temperature and Cognitive Performance
Notes: for the temperature parameters, the median value during 10 min sitting and 8 min walking in the laboratory, respectively, was used for the analyses. P-values are one-tailed. Bold values indicate statistical significance. Due to the
use of preplanned hypotheses and the exploratory nature of this study, p-values were not adjusted for possible multiple comparison effects (Perneger, 1998; Streiner and Norman, 2011; Armstrong, 2014; Ranstam, 2016). FNAME-12,
Face-Name Associative Memory Exam; QMCI, Quick Mild Cognitive Impairment screen; TMT-A, Trail Making Test part A; TMT-B, Trail Making Test part B; Tsrib , skin temperature at rib cage; Tsscapula , skin temperature at scapula;
0.135
0.319
0.227
0.433
(number of words)
Letter fluency
p
−0.13
−0.05
−0.09
−0.02
rs
(number of words)
Category fluency
0.166
0.163
0.072
0.078
p
0.11
0.11
0.17
0.16
FIGURE 3 | Scatterplot of skin temperature (Tsrib median) during 8 min
rs
walking in the laboratory vs. cognitive performance (TMT-A, processing
speed). Notes: Spearman’s partial correlation coefficient rs = 0.33, p < 0.002
0.158
0.220
0.401
0.425
(one-tailed, controlled for age). Regression line y = 33.25 + 0.03 × x
TABLE 3 | Spearman’s partial correlation analyses between single-point body temperature measurements and cognitive performance (controlled for age).
p
Stroop (s)
(calculated from Pearson’s correlation analysis). TMT-A, Trail Making Test part
Cognitive performance parameters
A; Tsrib , skin temperature at the rib cage.
0.11
0.09
−0.03
−0.02
rs
single-point measurement in the laboratory or as long-term
continuous measurement during habitual daily activities, is
0.298
0.218
0.465
0.475
associated with better cognitive performance in older adults with
p
TMT-B (s)
and without MCI. These results support our first hypothesis.
In the correlation analyses performed with the single-point
0.06
0.09
−0.01
−0.01
rs
laboratory body temperature measures, we found statistically
significant correlations (p < 0.05) of median skin temperatures
with processing speed (TMT-A). Among the 12-h continuous
∗
0.002∗
0.145
0.086
0.006
p
TMT-A (s)
body temperature measurements, significant correlations of
median skin and median core body temperature were evident
with general cognitive performance (QMCI), the executive
0.28
0.33
0.12
0.16
rs
function inhibition (Stroop), and semantic verbal fluency
(category fluency). The finding that the single-point and the
FNAME-12 (points)
long-term body temperature measurements did not correlate
0.089
0.098
0.319
0.376
p
with the same cognitive parameters may be related to the
differences in the measurement conditions and methods, and
participant groups (i.e., whole sample vs. subgroup). The
−0.15
−0.15
−0.05
−0.04
supplementary correlation analyses, performed separately for
rs
the two sexes, revealed additional significant associations for
median skin temperatures with episodic memory (FNAME-
0.084
0.114
0.338
0.409
QMCI (points)
12) and phonemic verbal fluency (letter fluency) uniquely in
p
the male subgroup. This could indicate sex differences for the
relation of body temperature with cognition, but further research
−0.16
−0.14
0.05
0.03
with larger samples of older adults is warranted to substantiate
rs
this finding.
We further analyzed if median skin and median core
Condition
body temperatures are lower in cognitively healthy older
Walking
Walking
Sitting
Sitting
adults compared to older adults with MCI. Here the results
showed significant differences among the two groups of
∗ p < 0.05, statistically significant.
older participants for Tsrib measured in the laboratory and
Temperature parameters
additional non-significant differences, which are noteworthy
due to moderate to large effect sizes, for Tsrib during the
12-h body temperature measurements. The latter result may
imply that the study has lacked statistical power to reach
Tsscapula (◦ C)
statistical significance (i.e., too few participants in the 12-h
Tsrib ( C)
◦
measurement subgroup). Supplementary ROC curve analyses
revealed that single-point measures of median body temperature
Frontiers in Aging Neuroscience | www.frontiersin.org 8 February 2021 | Volume 13 | Article 585904Eggenberger et al. Body Temperature and Cognitive Performance
Notes: temperature parameters were assessed during 12 h of habitual daily activities. p-values are one-tailed. Bold values indicate significant or notable non-significant results with moderate to large effect size. Due to the use of
preplanned hypotheses and the exploratory nature of this study, p-values were not adjusted for possible multiple comparison effects (Perneger, 1998; Streiner and Norman, 2011; Armstrong, 2014; Ranstam, 2016). FNAME-12,
Face-Name Associative Memory Exam; p–p, peak-to-peak; QMCI, Quick Mild Cognitive Impairment screen; Tcpill , core body temperature from ingestible telemetric temperature pill; TMT-A, Trail Making Test part A; TMT-B, Trail Making
0.041∗
0.286
0.457
0.308
0.425
0.361
(number of words)
p
Letter fluency
0.17
0.03
−0.15
0.06
−0.12
0.48
rs
0.026∗
(number of words)
0.358
0.277
0.475
0.222
0.442
Category fluency
p
−0.11
−0.18
−0.53
−0.02
−0.25
0.04
rs
FIGURE 4 | Scatterplot of core body temperature (Tcpill median) in 12-h
continuous measurement during habitual daily activities vs. cognitive
TABLE 4 | Spearman’s partial correlation analyses between 12-h continuous body temperature measurements and cognitive performance (controlled for age).
0.023∗
0.055
0.272
0.259
0.421
0.088
performance (QMCI, general cognitive performance). Notes: Spearman’s
p
partial correlation coefficient rs = –0.47, p = 0.045 (one-tailed, controlled for
Stroop (s)
age). Regression line y = 37.30–0.0009 × x (calculated from Pearson’s
Cognitive performance parameters
correlation analysis). Tcpill , core body temperature from ingestible telemetric
0.56
0.46
−0.18
0.21
−0.07
0.38
temperature pill.
rs
0.375
0.216
0.472
0.417
0.365
0.279
p
TMT-B (s)
0.10
0.24
−0.02
−0.07
−0.11
0.17
rs
0.021∗
0.028∗
0.453
0.455
0.221
0.315
Test part B; Tsrib , skin temperature at rib cage; Tsscapula , skin temperature at scapula; ∗ p < 0.05, statistically significant.
p
TMT-A (s)
0.04
0.22
0.14
−0.04
−0.59
−0.57
rs
FNAME-12 (points)
0.032∗
0.332
0.265
0.234
0.054
0.241
p
FIGURE 5 | Scatterplot of skin temperature p–p amplitude (Tsrib ) in 12-h
continuous measurement during habitual daily activities vs. cognitive
performance (TMT-A, processing speed). Notes: Spearman’s partial
−0.21
correlation coefficient rs = –0.59, p = 0.021 (one-tailed, controlled for age).
0.13
0.19
0.49
0.23
0.51
rs
Regression line y = 5.56–0.1 × x (calculated from Pearson’s correlation
analysis). p–p, peak-to-peak; Tsrib , skin temperature at the rib cage.
0.045∗
0.450
0.311
0.112
0.323
0.083
QMCI (points)
p
may not predict MCI with adequate accuracy. Nevertheless, body
temperature measures could be combined with other predictors
of cognitive performance and integrated into multi-parameter
−0.04
−0.47
rs
models for the prediction of cognitive decline in older adults.
0.15
0.38
0.15
0.39
Similar results were evident for the sitting and walking
test conditions in the laboratory, as well as among the two
p–p Amplitude
skin temperature measurement sites in both the single-point
and long-term measurements. In the long-term measurement,
Median
Value
the skin temperatures and core body temperature correlated
with different cognitive tests (i.e., Stroop vs. QMCI and letter
fluency, respectively). This may be due to methodological and
Temperature
physiological differences in the skin temperature compared to the
parameters
Tsscapula (◦ C)
Tsscapula (◦ C)
core body temperature measurements (Taylor et al., 2014).
Tcpill (◦ C)
Tcpill (◦ C)
Tsrib (◦ C)
Tsrib (◦ C)
The observed correlation of cognitive performance with
body temperature is coherent with other research findings.
Frontiers in Aging Neuroscience | www.frontiersin.org 9 February 2021 | Volume 13 | Article 585904Eggenberger et al. Body Temperature and Cognitive Performance
TABLE 5 | Comparison of single-point body temperature measurements between cognitively healthy and MCI participants.
Mean (SD) Mann–Whitney test
Temperature parameters Condition Healthy n = 54 MCI n = 26 U z p, one-tailed r
Tsrib (◦ C) Sitting 34.3 (1.0) 34.8 (1.2) 867.5 1.70 0.045∗ 0.19
Walking 34.3 (0.9) 34.7 (1.1) 879.0 1.82 0.035∗ 0.20
Tsscapula (◦ C) Sitting 33.3 (1.0) 33.5 (1.1) 783.5 0.84 0.201 0.09
Walking 33.4 (1.0) 33.5 (1.3) 773.0 0.73 0.233 0.08
Notes: for the temperature parameters, the median value during 10 min sitting and 8 min walking in the laboratory, respectively, was used for the analyses. Bold values indicate statistical
significance or notable non-significant results with moderate to large effect size. p–p, peak-to-peak; MCI, mild cognitive impairment; SD, standard deviation; Tsrib , skin temperature at
rib cage; Tsscapula , skin temperature at scapula; ∗ p < 0.05, statistically significant.
TABLE 6 | Comparison of 12-h body temperature measurements between cognitively healthy and MCI participants.
Mean (SD) Mann–Whitney test
Temperature parameters Value Healthy n = 9 MCI n = 6 U z p, one-tailed r
◦
Tsrib ( C) Median 35.6 (0.5) 36.0 (0.4) 33.5 1.23 0.114 0.33
Tsscapula (◦ C) 35.1 (0.6) 35.3 (0.5) 30.0 0.78 0.246 0.21
Tcpill (◦ C) 36.7 (0.2) 36.7 (0.2) 31.0 0.48 0.345 0.12
Tsrib (◦ C) p–p Amplitude 3.0 (1.2) 1.9 (0.4) 9.0 −1.71 0.051 −0.48
Tsscapula (◦ C) 3.3 (1.1) 2.4 (0.6) 10.0 −1.57 0.069 −0.44
Tcpill (◦ C) 1.5 (0.6) 1.1 (0.2) 15.0 −1.43 0.091 −0.37
Notes: temperature parameters were assessed during 12 h of habitual daily activities. Bold values indicate statistical significance (Eggenberger et al. Body Temperature and Cognitive Performance
(TMT-A), and phonemic verbal fluency (letter fluency)
which represent specific cognitive domains. Additionally,
notable non-significant associations with moderate effect
sizes for skin and core body temperature p–p amplitude with
general cognitive performance (QMCI) and executive function
(Stroop) were present. Furthermore, body temperature p–p
amplitude was higher in the healthy compared to the MCI
participants, resulting in notable non-significant differences
with moderate to large effect sizes for Tsrib (healthy 3.0 ± 1.2◦ C
vs. MCI 1.9 ± 0.4◦ C), Tsscapula (healthy 3.3 ± 1.1◦ C vs.
MCI 2.4 ± 0.6◦ C), and Tcpill (healthy 1.5 ± 0.6◦ C vs.
MCI 1.1 ± 0.2◦ C). These novel findings also comply with
previous studies reporting reduced proximal skin and
core body temperature amplitudes in dementia patients
compared to healthy older adults, as assessed during long-term
measurements of the circadian body temperature rhythm
(Harper et al., 2005; Most et al., 2012; Leng et al., 2019;
Raupach et al., 2019). Supplementary ROC curve analyses
suggest that measures of body temperature p–p amplitude may
predict MCI with better accuracy compared to median body
temperatures. Hence, these measures could also be valuable
FIGURE 7 | ROC curves of median skin temperatures (Tsrib ) measured in the to be integrated with future developments of multi-parameter
laboratory to predict MCI. Notes: Tsrib median during sitting and walking, models for the prediction of cognitive performance in the
AUC = 0.618 (p = 0.089) and 0.626 (p = 0.069), respectively. AUC, area
under curve; MCI, mild cognitive impairment; Tsrib , skin temperature at rib
older population.
cage; ROC, receiver operating characteristic. Interestingly, the analyses of p–p amplitudes showed
more results that achieved statistical significance or
moderate to large effect sizes for Tsrib compared to
Tsscapula (i.e., 4 vs. 2, respectively), which potentially
renders the rib cage measurement site more favorable
for future applications in wearable monitoring devices.
Finally, the correlation analyses with core body temperature
p–p amplitudes (Tcpill ) revealed particular additional
significant correlations (or moderate to large effects)
with Stroop and letter fluency. This observation might
again be related to methodological and physiological
differences in the skin temperature compared to the core
body temperature measurements (Taylor et al., 2014),
although circadian rhythms of skin temperature and core
body temperature are following a comparable pattern
(Most et al., 2012).
As per our results, alterations of circadian rhythms seem
to be more pronounced in neurodegenerative diseases (Leng
et al., 2019). However, changes in circadian rhythms are
also part of the normal aging process where typically the
amplitude of many circadian rhythms is attenuated and in
some instances, a phase advance of the circadian rhythm
is additionally evident (Hood and Amir, 2017). Age-related
changes in 24-h circadian rhythms include not only core body
FIGURE 8 | ROC curves of body temperature p–p amplitudes (Tsrib and temperature rhythms, but also rhythms of waking activity,
Tcpill ) measured during 12-h habitual daily activities to predict MCI. Notes:
hormone release (e.g., melatonin and cortisol), fasting plasma
Tsrib and Tcpill p–p amplitude, AUC = 0.786 (p = 0.086) and 0.738 (p = 0.153),
respectively. AUC, area under curve; MCI, mild cognitive impairment; Tcpill , glucose levels, and suprachiasmatic nucleus (SCN) firing (Hood
core body temperature from ingestible telemetric temperature pill; Tsrib , skin and Amir, 2017). The SCN is the master circadian clock
temperature at rib cage; ROC, receiver operating characteristic. and synchronizes rhythmic activities in the body with the
cycle of light and dark (Mohawk et al., 2012). Consequently,
in that we identified statistically significant correlations a diminished downstream output signal from the SCN may
(p < 0.05) for skin and core body temperature p–p amplitudes additionally affect the strength of rhythms in central and
with episodic memory (FNAME-12), processing speed peripheral tissues in aging (Hood and Amir, 2017). The
Frontiers in Aging Neuroscience | www.frontiersin.org 11 February 2021 | Volume 13 | Article 585904Eggenberger et al. Body Temperature and Cognitive Performance
precise mechanism linking circadian rhythm disturbances with Therefore, the above-discussed findings and potential advantages
neurodegeneration remains unclear, although changes in protein of long-term continuous body temperature monitoring warrant
homeostasis, immune and inflammatory processes might be future investigations with further developed wearable skin
involved (Leng et al., 2019). Nevertheless, behavioral and temperature measurement systems.
biological parameters of circadian rhythm disruptions offer
interesting targets to monitor neurocognitive long-term health Strengths and Limitations
in older adults, since alterations in these biomarkers manifest Methodological strengths include the comparably large number
in preclinical disease states and thus precede the development of older adults (in relation to previous studies investigating body
of AD, AD-related dementias, and other neurodegenerative temperature differences between healthy individuals and patients
diseases (Ju et al., 2017; Leng et al., 2018; Musiek et al., 2018). with MCI or AD), who participated in this initial study to
explore direct associations of body temperature and cognition.
Nonetheless, future studies would preferably include larger
Comparison of Single-Point (Laboratory) numbers of participants to account for potential fluctuations
and Long-term (12-h) Body Temperature of body temperature measurements due to intraindividual
Measurements factors (e.g., physical activity) and ambient conditions. A post
Our analyses including the long-term continuous body hoc estimation of statistical power, based on the resulting
temperature measurements during habitual daily activities small to large effect sizes and the number of participants in
produced markedly higher correlation coefficients and effect this study (Faul et al., 2007), revealed that the correlation
sizes than the single-point laboratory measurements. An analyses achieved approximately 37–86% power, whereas the
explanation for this outcome could be that the single-point Mann-Whitney tests achieved about 10–22% power. Further
laboratory measurements took place either in the morning or strengths comprise the assessment of a variety of cognitive
in the afternoon, depending on the participants’ availability. domains and controlling for age in the correlation analyses.
Skin and core body temperatures vary throughout the day, with The latter seems important since age-related reductions of
the nadir normally occurring in the early morning and the body temperature (Waalen and Buxbaum, 2011) together with
peak being reached in the early evening (Czeisler et al., 1999; age-related cognitive decline (Salthouse, 2019) might otherwise
Most et al., 2012). Hence, the non-standardized time-points of have confounded the association of body temperature with
the laboratory measurements presumably generated circadian cognitive performance.
rhythm-related body temperature variations, which may have Some limitations have to be considered as well. First,
superimposed variations related to cognitive performance. the results from correlation analyses do not automatically
This could have led to the observed lower effect sizes in the imply a causal relationship between the included parameters.
single-point laboratory measurements. It was not feasible Nonetheless, based on the reviewed and presented literature,
and meaningful to control for the different time-points of we conclude that a causal relation of body temperature and
measurement in the statistical analyses, since the measurement cognitive performance parameters is very likely. Second, to
time-points were widely distributed throughout the day ensure the availability of core body temperature data from
(i.e., from 08.30 to 12.00 AM and from 1.00 to 5.00 PM) the ingestible telemetric temperature pill, we have limited
and, additionally, interindividual variations in the timing of the measurement period to 16 h, as transit times through
circadian rhythms are to be expected for example related to the gastrointestinal tract are highly variable (Bongers et al.,
activity and light exposure (Czeisler et al., 1999). On the other 2015). Longer measurement periods (i.e., several days) would
hand, this outcome may also highlight an increased benefit of offer the opportunity to model and fit circadian rhythms with
long-term (i.e., several hours) over single-point measurements cosine functions (Harper et al., 2005), which might provide
for health monitoring. Within practical settings of remote and better estimates of average circadian body temperature values,
continuous health monitoring over several months or years, including minimum, maximum, and mesor. Such measurements
repeated single-point measurements (preferably measured at over several days would require the participants to sequentially
consistent time-points during the day) or multi-hour long-term ingest several telemetric pills, due to their limited gastrointestinal
measurements would allow establishing individualized reference transit time (i.e., mean 27.4 h, range 4.6–82.8 h; Bongers
ranges. Thereby, the sensitivity to detect disease processes et al., 2015), and to come by the laboratory several times
may be raised (Chester and Rudolph, 2011). The continuous to read out the data from the pill before its excretion.
long-term body temperature measurements in our study were Therefore, more convenient alternative approaches for long-term
only performed in a subgroup of the participants, mainly due measurements, such as the use of non-invasive parameters for
to limited sensor availability. Moreover, the corresponding the prediction of core body temperature, should be considered
procedure of ingesting the telemetric temperature pill for to optimize practicality and reduce participant burden. Finally,
reference data entailed an additional burden for the participants since a ‘‘gold standard’’ operational definition for diagnosing
and affected the willingness to participate in the long-term MCI is lacking and definitions of MCI are highly variable
measurements in some cases. Nevertheless, the acquired data throughout the literature (Jak et al., 2016; Wong et al.,
provided the required information to evaluate the feasibility of 2018), our presented findings related to body temperature
long-term measurements with our prototype system of an ECG differences among healthy and MCI participants is only valid
chest belt with integrated skin temperature sensors (Figure 1). for the applied MCI criteria. Future studies could include
Frontiers in Aging Neuroscience | www.frontiersin.org 12 February 2021 | Volume 13 | Article 585904You can also read