Passive Acoustic Monitoring Reveals Spatio-Temporal Distributions of Antarctic and Pygmy Blue Whales Around Central New Zealand
←
→
Page content transcription
If your browser does not render page correctly, please read the page content below
ORIGINAL RESEARCH
                                                                                                                                          published: 06 January 2021
                                                                                                                                    doi: 10.3389/fmars.2020.575257

                                            Passive Acoustic Monitoring Reveals
                                            Spatio-Temporal Distributions of
                                            Antarctic and Pygmy Blue Whales
                                            Around Central New Zealand
                                            Victoria E. Warren 1,2* , Ana Širović 3 , Craig McPherson 4 , Kimberly T. Goetz 2,5 ,
                                            Craig A. Radford 1 and Rochelle Constantine 1,6
                                            1
                                              Leigh Marine Laboratory, Institute of Marine Science, University of Auckland, Leigh, New Zealand, 2 National Institute
                                            of Water and Atmospheric Research, Wellington, New Zealand, 3 Department of Marine Biology, Texas A&M University
                                            at Galveston, Galveston, TX, United States, 4 JASCO Applied Sciences (Australia) Pty Ltd., Capalaba, QLD, Australia,
                                            5
                                              National Marine Mammal Laboratory, National Oceanic and Atmospheric Administration, National Marine Fisheries Service,
                          Edited by:        Alaska Fisheries Science Center, Seattle, WA, United States, 6 School of Biological Sciences, The University of Auckland,
                          Eric Delory,      Auckland, New Zealand
      Oceanic Platform of the Canary
                      Islands, Spain
                                            Effective management of wild animal populations relies on an understanding of
                        Reviewed by:
                       Ester Quintana,
                                            their spatio-temporal distributions. Passive acoustic monitoring (PAM) is a non-
           University of South Florida,     invasive method to investigate the distribution of free-ranging species that reliably
                         United States      produce sound. Critically endangered Antarctic blue whales (Balaenoptera musculus
                    Robert McCauley,
            Curtin University, Australia    intermedia) (ABWs) co-occur with pygmy blue whales (B. m. brevicauda) (PBWs) around
                          Capri Jolliffe,   New Zealand. Nationally, both are listed as “data deficient” due to difficulties in access
            Curtin University, Australia
                                            and visual sub-species identification. PAM was used to investigate the distributions
                *Correspondence:
                  Victoria E. Warren
                                            of blue whales via sub-species specific song detections in central New Zealand.
         vwar775@aucklanduni.ac.nz          Propagation models, incorporating ambient noise data, enabled the comparison of
                                            detections among recording locations in different marine environments. ABW detections
                   Specialty section:
         This article was submitted to
                                            peaked during austral winter and spring, indicating that New Zealand, and the South
                   Ocean Observation,       Taranaki Bight (STB) in particular, is a migratory corridor for ABWs. Some ABW
               a section of the journal
                                            calls were also detected during the breeding season (September and October). PBW
          Frontiers in Marine Science
                                            calls were highly concentrated in the STB, particularly between March and May,
          Received: 23 June 2020
      Accepted: 07 December 2020            suggesting that an aggregation of PBWs may occur here. Therefore, the STB is of
       Published: 06 January 2021           great importance for both sub-species of blue whale. PBW detections were absent
                             Citation:      from the STB during parts of austral spring, but PBWs were detected at east coast
                Warren VE, Širović A,
McPherson C, Goetz KT, Radford CA
                                            locations during this time. Detection area models were valuable when interpreting and
   and Constantine R (2021) Passive         comparing detections among recording locations. The results provide sub-species
         Acoustic Monitoring Reveals
                                            specific information required for management of critically endangered ABWs and
       Spatio-Temporal Distributions
of Antarctic and Pygmy Blue Whales          highlight the relative importance of central New Zealand for both sub-species of
       Around Central New Zealand.          blue whale.
           Front. Mar. Sci. 7:575257.
   doi: 10.3389/fmars.2020.575257           Keywords: blue whales, passive acoustic monitoring, distribution, sympatry, New Zealand

Frontiers in Marine Science | www.frontiersin.org                                 1                                          January 2021 | Volume 7 | Article 575257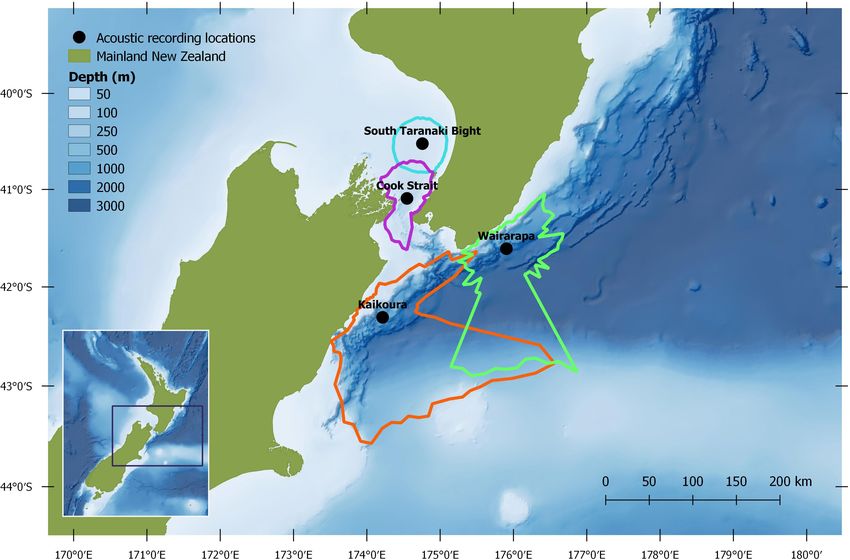
Warren et al.                                                                                                      Blue Whale Distributions via PAM

INTRODUCTION                                                                  Worldwide, blue whales produce low frequency, stereotyped
                                                                          calls, known as song when repeated regularly (Oleson et al., 2007;
The effective management of wild animal populations relies                Lewis and Širović, 2018), which differ between sub-species, and
on a foundation of knowledge regarding their distribution and             between populations within sub-species (McDonald et al., 2006;
movements. A thorough understanding of the areas used by                  Širovic et al., 2017). Therefore, the sub-species of a blue whale
a population is necessary to consider the relative importance             is easier to determine acoustically than visually, making PAM
of each area for prioritising conservation or management                  an ideal approach to study blue whales with confidence in sub-
approaches. Distribution studies are particularly important               species identity (McDonald et al., 2006). It is straightforward
for species that are threatened with extinction, and those                to distinguish between the two blue whale sub-species found
that live in areas subject to increasing anthropogenic activity           around New Zealand via song. PBW song was first recorded
or global phenomena, such as climate-induced range shifts                 in New Zealand off Great Barrier Island – Aotea, northern
(McLellan and Shackleton, 1989; Chen et al., 2011). Passive               New Zealand, in 1964 (Kibblewhite et al., 1967) and consists
acoustic monitoring (PAM) is a non-invasive technique that                of four distinct units (A, B, C, and D) that form a phrase.
can be used to study the presence and distribution of animals             Energy occurs between 17 and 24 Hz and overall phrase duration
that produce sound. Songbirds, primates, amphibians, and                  is 55 s, with 132 s on average between phrases (Miller et al.,
marine mammals are ideal candidates to study via PAM, as                  2014). Conversely, ABWs produce individual song units, known
many naturally produce loud, stereotyped vocalisations (Edds-             as “Z” calls due to their distinctive shape when visualised as a
Walton, 1997; Zimmer, 2011; Sanders and Mennill, 2014;                    spectrogram. ABW units commence at 26 Hz, decreasing rapidly
Alvarez-Berríos et al., 2016; Kalan et al., 2016). Acoustic               to 18 Hz, with a duration of approximately 20 s (Širović et al.,
detections act as an indicator of animal presence, from which             2004; Gavrilov et al., 2012). “Z” calls are repeated every 62–
movements and distributions can be inferred, particularly                 65 s during song (Širović et al., 2004; McDonald et al., 2006).
when acoustic recording devices are deployed over a large                 Female blue whales are not thought to produce song (Oleson
area (Hannay et al., 2013; Ross et al., 2018). Autonomous                 et al., 2007), but song is produced by male blue whales year-round
PAM can be particularly useful when collecting long-term                  (Širović et al., 2004; Leroy et al., 2016; Thomisch et al., 2016).
data in environments that cannot be surveyed regularly using              Both male and female blue whales from both sub-species also
visual methods, such as dense forest or offshore marine                   produce a non-song down-sweeping call, known as the “D” call
areas, where access is constrained by logistical challenges and           (McDonald et al., 2001).
costs. An acoustic approach can also be useful for vocal                      Blue whale song units are low frequency, have high source
species that are difficult to study visually. Such instances              levels, and propagate efficiently underwater, up to hundreds, or
occur when features used for identification are cryptic, and              even thousands, of kilometres (Stafford et al., 1998; Širović et al.,
can be magnified if the study species is difficult to observe.            2007). It is presumed that blue whale song is used for long-
For example, due to their low surface profile and short                   range communication, and the acoustic properties of song units
surfacing periods, deep-diving beaked whales of the family                may be a result of evolutionary selection (Edds-Walton, 1997).
Ziphiidae demonstrate visual crypsis, but species-specific signal         Long propagation distances can make it difficult to interpret
properties of their vocalisations enable acoustic identification          detections made within a PAM framework, as the location of a
(Baumann-Pickering et al., 2013).                                         calling animal may be a considerable distance from the receiver.
   In the waters of New Zealand, two sub-species of blue                  Underwater, propagation conditions vary over space and time
whale occur (Branch et al., 2007): the Antarctic blue whale               due to parameters that include bathymetry, seabed sediment,
(Balaenoptera musculus intermedia) (ABW); and the pygmy                   and sound speed profile (Urick, 1983). Inferences made from
blue whale (B. m. brevicauda) (PBW). Anatomical differences               call detections increase in validity when the detection area of
exist between the two sub-species (Ichihara, 1966; Olson et al.,          the receiver is taken into account (Stafford et al., 2007; Širović
2015), but can be difficult to recognise in the field. As such,           et al., 2007; Samaran et al., 2010; Miksis-Olds et al., 2015; Širovic
information about blue whales in New Zealand waters has                   et al., 2015; Darras et al., 2016; Biggs et al., 2019). Moreover, it
often been conflated by the inclusion of both sub-species (see            is essential to quantify effective detection areas when estimating
Stephenson et al., 2020). Identification challenges, in addition          animal abundance from acoustic detections (Marques et al., 2013;
to access constraints imposed by their offshore location, have            Harris et al., 2018; Nuuttila et al., 2018). The detection area of
led to both sub-species being classified as “data deficient” at a         each recorder in a network should be taken into consideration to
national level, although PBWs are also listed as “resident native”        provide context to acoustic detections and to enable comparisons
(Baker et al., 2019) due to focused studies on this sub-species           among recording locations (Darras et al., 2016; Biggs et al., 2019).
(Torres, 2013; Olson et al., 2015). Globally, blue whales are                 As implied by their “data deficient” statuses, previous
classified as “endangered” (Cooke, 2018a). At the sub-species             investigations of blue whale distribution in New Zealand waters
level, ABWs are listed as “critically endangered” (Cooke, 2018b)          have been constrained by difficulties in sub-species identification,
as a result of industrial whaling in the 1900s that greatly reduced       and limited access to these offshore marine mammals due to
population worldwide (Branch et al., 2007), while PBWs are listed         constraints arising from logistical challenges and weather and
as “unspecified” (Pollock, 2019). Accordingly, information on             sea conditions. In this study, PAM was used to investigate
blue whale distributions that is not sub-species specific is not          the spatial and temporal distributions of PBWs and critically
appropriate for management decisions.                                     endangered ABWs around central New Zealand. The South

Frontiers in Marine Science | www.frontiersin.org                     2                                     January 2021 | Volume 7 | Article 575257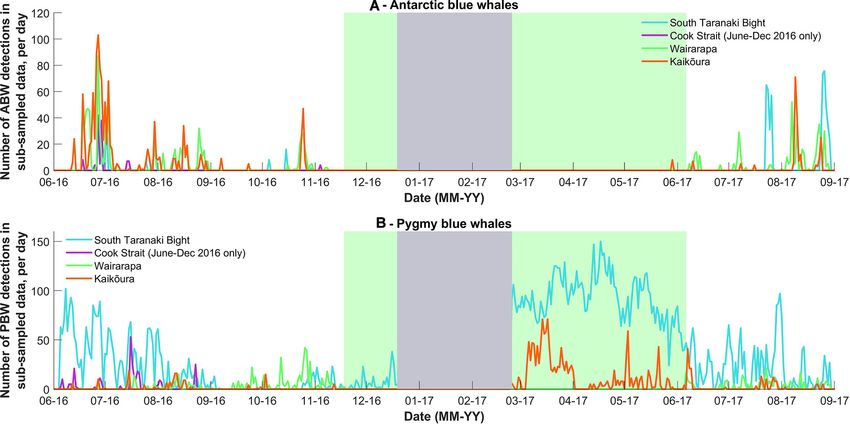
Warren et al. Blue Whale Distributions via PAM
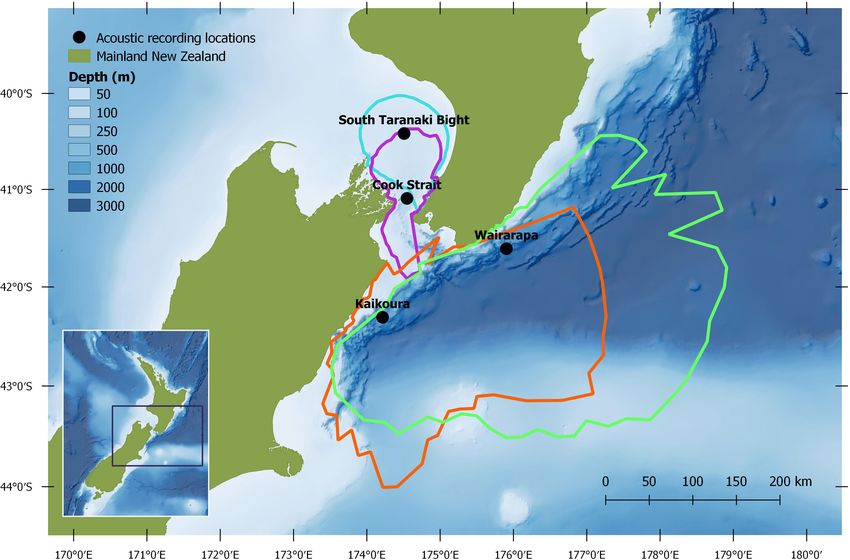
FIGURE 1 | Study region, with median modelled Antarctic blue whale detection areas for June 2016: turquoise = South Taranaki Bight, purple = Cook Strait,
green = Wairarapa, orange = Kaikōura. See Methodology for modelling configuration and assumptions.
Taranaki Bight (STB) in central New Zealand has been a focus for Wairarapa; and a STB location 25.2 km south-east from the 2016
blue whale research (Barlow et al., 2018), and is predicted to be STB station (Figure 2; a recorder was not redeployed in Cook
a region with high probability of occurrence of blue whales (see Strait in 2017 but is shown for reference). In the STB and Cook
Stephenson et al., 2020). As acoustic recorders were deployed in a Strait, AMARs were bottom mounted in water depths of 111 and
range of physical marine environments, propagation modelling 252 m, respectively. At Wairarapa and Kaikōura, AMARs were
was conducted to consider detections in range context and to moored 10 m above the sea-bed in water depths of 1480 and
enable comparisons among recording locations. Results from this 1252 m, respectively. The nominal pressure sensitivity level of
study add sub-species specific clarity to blue whale distributions the hydrophones was −165 dB re 1 V/µPa (±1 dB) from 10 Hz
and movements in central New Zealand waters, and improve to 100 kHz. Acoustic data were sampled over a 900 s duty cycle:
understanding on the importance of this region to the two blue 630 s at a sampling rate of 16 kHz, 125 s at a sampling rate of
whale sub-species. 250 kHz, and 145 s of sleep. Only the 16 kHz files were analysed
within the scope of this study.
METHODOLOGY Detection of Blue Whale Calls
Data from each recording location were sub-sampled via
Acoustic Recordings stratified random sampling: within every 2-hour period, 630 s
Autonomous multi-channel acoustic recorders (AMAR G3, (10.5 min) were sampled (one randomly selected 16 kHz duty
JASCO Applied Science) were deployed from 4 June to 21 cycle, equivalent to 12.5% of all 16 kHz recordings, and 8.75%
December 2016 at four locations (between 13 and 60 km of each 2 h interval). Data were visualised using PAMlab-Lite
from shore) around central New Zealand: the South Taranaki (JASCO Applied Sciences, 2017) as spectrograms displayed over
Bight (STB); Cook Strait; and off the coasts of Kaikōura and 10–100 Hz; the spectrogram frequency resolution was 0.244 Hz
Wairarapa (henceforth referred to as Kaikōura and Wairarapa) computed using 2 s of Hamming-windowed data (plus 2 s of
(Figure 1). AMARs were redeployed for a second period between zero-padding) and 75% overlap. All blue whale song units and
21 February and 8 September 2017 at three locations: Kaikōura; phrases within subsamples were manually identified and marked,
Frontiers in Marine Science | www.frontiersin.org 3 January 2021 | Volume 7 | Article 575257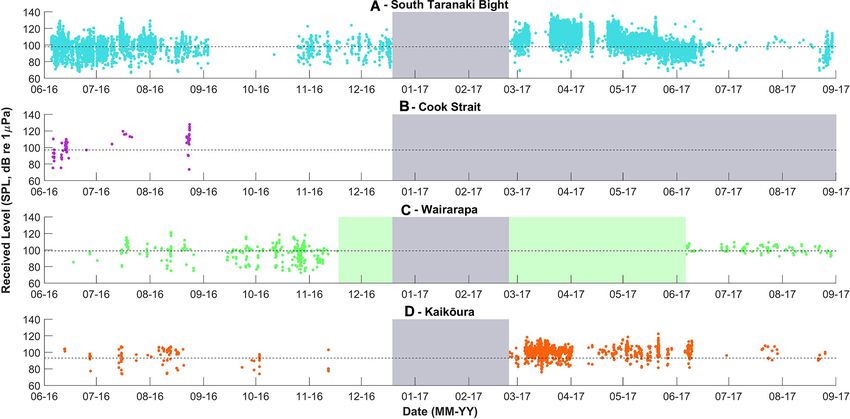
Warren et al.                                                                                                                     Blue Whale Distributions via PAM

  FIGURE 2 | Study region, with median modelled pygmy blue whale detection areas for March 2017: turquoise = South Taranaki Bight, purple = Cook Strait,
  green = Wairarapa, orange = Kaikōura. See Methodology for modelling configuration and assumptions.

regardless of whether they occurred in song (with consistent                        December 2016. Although sound levels in the blue whale call
inter-call intervals) or were stand-alone. The minimum and                          bandwidth were raised at Kaikōura during these periods, blue
maximum fundamental frequencies, and start and end time                             whale calls remained identifiable throughout and were marked.
extents of each phrase (PBW) or unit (ABW), were marked                             Blue whale calls that occurred simultaneously (in time and
manually to “box” each call. PAMlab-Lite automatically reported                     frequency) with tonal ship noise were annotated if their duration
time, frequency and sound level parameters for each boxed call                      and/or inter-call interval were evident within the shipping noise.
within the stratified random subsample. Sound level information                     When ship noise dominated the blue whale call bandwidth, such
included values for the received sound pressure level (SPL) of the                  that individual calls were masked, possible calls were not marked
marked sound. For ABWs, each song unit was marked separately,                       to minimise false positive detections.
while for PBWs, measurements were made across all four units
(A, B, C, and D) as a single phrase. In cases where entire                          Detection Areas
units or phrases were not evident in the recordings, only the                       As central New Zealand features a variety of marine
evident aspects were measured. For simplicity, both ABW units                       environments, sound propagation in the study area was
and PBW phrases will henceforth be referred to as “calls.” Call                     modelled to enable comparisons to be made among recording
annotations were imported into MATLAB (The MathWorks Inc,                           locations, and to estimate the possible positions of calling blue
2016) for analysis.                                                                 whales. Transmission loss modelling was conducted for each
   A seismic survey, the Schlumberger Pegasus Basin 3D seismic                      of the four recording locations. JASCO’s Marine Operations
survey, was coincidentally conducted near Wairarapa between                         Noise Model (MONM) (Matthews and MacGillivray, 2013)
mid-November 2016 and June 2017 (Schlumberger New Zealand                           was used to estimate propagation loss within the 25 Hz-centred
Limited, 2016). Data from Wairarapa were not analysed during                        decidecade band [22 to 28 Hz, International Organization for
the seismic survey period, due to raised sound levels in the blue                   Standardization (2017)]. MONM computes sound propagation
whale call bandwidths that impeded the detection of calls. Seismic                  via a wide-angle parabolic equation solution to the acoustic
survey pulses were evident to a lesser extent in the data from                      wave equation (Collins, 1993) based on a version of the
Kaikōura and occurred concurrently with low frequency sound                        U.S. Naval Research Laboratory Range-dependent Acoustic
(
Warren et al.                                                                                                    Blue Whale Distributions via PAM

solid seabed (Zhang and Tindle, 1995). The parabolic equation            probability distribution of source levels and modelled values
method (Collins et al., 1996) has been extensively benchmarked           of transmission loss. This analysis considered only the median
(e.g., Racca et al., 2015; Quijano et al., 2019). The 25 Hz-             ambient noise percentile to provide a general guide for the
centred decidecade band was chosen as it contains the upper              potential detection ranges under median noise conditions,
limit of tonal energy for both blue whale sub-species calls              although significant differences could exist across all possible
(approximately 26 Hz for ABW “Z” call units and 23 Hz for PBW            noise conditions. The detection ranges associated with an
“B” call units).                                                         unconditional probability of 0.5 and median noise conditions are
   Marine Operations Noise Model was used to calculate                   hereafter referred to as “median detection areas.” A detection
propagation losses within a 250 km radius around each recorder           threshold of 5 dB re 1 µPa above the median noise level was
location. Acoustic fields in three dimensions were computed              applied to present a conservative estimate of detectability. The
by modelling transmission loss within two-dimensional (2-D)              source level of ABW calls was assumed to be 189 dB re 1 µPa
vertical planes aligned along radials covering a 360◦ swath. Here,       m ± 3 dB (Širović et al., 2007), and 183 dB re 1 µPa m ± 3 dB
the vertical radial planes were separated by an angular step size        for PBW calls (McCauley et al., 2001). The transmission loss
of 5◦ , yielding 72 planes. Within each vertical radial plane the        model assumed that both sub-species produced the “Z” call and
sound field was sampled with a horizontal step size of 50 m              “B” unit at depths between 20 and 30 m (Thode et al., 2000;
and across the entire water column, from 2 m to a maximum of             Oleson et al., 2007; Širović et al., 2007; Leroy et al., 2016; Owen
4000 m, with step sizes that increased with depth. Recorders were        et al., 2016; Dziak et al., 2017; Lewis et al., 2018). A curvefit
considered as either seabed receivers or 10 m above the seabed,          approach was used to calculate the maximum possible ranges to
per the AMAR deployments.                                                a calling animal along each of the 72 radial planes per location
   Information regarding the physical environment of the four            considering the aforementioned modelling configuration. Overall
recording locations was included in the models: bathymetry,              detection areas were calculated by generating a polygon for each
geology, and water column sound speed profiles (SSPs).                   recording location considering the median detection range for
Bathymetry was derived from “Charting Around New Zealand”                each modelled radial (QGIS Development Team, 2017). Blue
(CANZ, 2008). As described in McPherson et al. (2019), the               whale detections were normalised by the respective detection
seabed sediment consisted of mud in deeper waters (continental           areas of the recording locations in order to compare detections
slope sediment), and dominant fine sand with sparse coarse               among sites. The normalised call counts are henceforth referred
sand in shallow waters (continental shelf sediment). SSPs were           to as “call density.”
derived from temperature and salinity profiles from the U.S.                To consider the appropriateness of extrapolating detection
Naval Oceanographic Office’s Generalized Digital Environmental           areas beyond the specific months they were generated for, the
Model V 3.0 (GDEM; Teague et al., 1990; Carnes, 2009). The               detection ranges were also calculated for opposite scenarios i.e.,
GDEM temperature-salinity profiles were converted to sound               detection areas of ABWs were estimated using the March-specific
speed profiles according to Coppens (1981). Mean monthly                 model, and PBW detection areas were estimated using the June-
sound speed profiles were derived from the GDEM profiles for             specific model. For both sub-species, March and June detection
a 100 km radius encompassing each site.                                  area estimates were very similar and it was therefore deemed
   Detection ranges were estimated for the months in which blue          appropriate to apply the estimated sub-species specific detection
whale call detections were most prevalent: June 2016 for ABWs;           areas across both acoustic deployment periods.
and March 2017 for PBWs. Transmission loss for each recording
location was modelled with location-specific and month-specific
ambient noise data and SSPs. Median (50th percentile) ambient            Analysis of Received Levels of Blue
noise was quantified for the 25 Hz-centred decidecade band from          Whale Calls
the acoustic recordings. During March 2017, the seismic survey           In order to consider the possible positions and movements of
conducted near Wairarapa influenced ambient noise levels in              calling blue whales within the detection areas, the received levels
the 25 Hz-centred decidecade band such that detection areas              of manually detected calls were examined with respect to time. To
would not have been relevant to periods without seismic survey           ensure relevance and comparability to the detection thresholds
presence. As such, instead of March 2017, ambient noise was              estimated via the propagation models, only the received levels
averaged over the whole duration of the first acoustic deployment        of the upper tone of ABW calls (approximately 26 Hz) and the
at Wairarapa (June to December 2016) and incorporated into the           “B” unit of PBW phrases (23 Hz) were examined. When ABW
model for PBW detection range at Wairarapa. Similarly, average           calls were received only as the 26 Hz tone, with lower frequency
ambient noise from the first deployment (June to December                aspects absent due to transmission loss, the SPL was calculated
2016) was used to model the detection area for PBWs at Cook              automatically by PAMlab-Lite. For ABW calls where the whole of
Strait as no acoustic data were recorded at this location in 2017.       the “Z” call was received and marked, and for PBW phrases, the
These two models included March-specific SSP data.                       marked frequency and temporal limits of each call were revised
   The detection range modelling approach assessed the                   to only include the upper part of the “Z” call, or the “B” unit,
unconditional probability of detection, accounting for the               respectively. SPL was recalculated for the revised temporal and
empirical probability distribution of the ambient noise and              frequency limits. It was not possible to revise the received levels
modelled distribution of received levels. The distribution               of all calls, due to occasional interference from other sounds in
of modelled received levels was computed using a normal                  the same bandwidth.

Frontiers in Marine Science | www.frontiersin.org                    5                                    January 2021 | Volume 7 | Article 575257
Warren et al. Blue Whale Distributions via PAM
RESULTS A smaller, secondary peak in ABW calls occurred during austral
spring (October 2016), with detections occurring first at STB,
Across all recording locations, a sub-sample of 106.5 days of then at Wairarapa, followed by Kaikōura, and lastly Cook Strait
data (14,608 files, each 630 s in length) were manually analysed. (Figure 3A). ABW detections were most numerous at Kaikōura
ABW calls were detected in 4.1% and PBW calls were detected and Wairarapa, particularly during 2016 (Figure 3A and Table 1),
in 21.2% of the subsamples. Both ABWs and PBWs were but were detected with highest density (as detections per
detected in 0.9% of subsamples. In total, 20,751 blue whale 1000 km2 ) at Cook Strait and STB (Figure 4A and Table 1).
calls were detected; 16.0% of detected calls were from ABWs The received levels of ABW calls were highest at Wairarapa and
and 84.0% were from PBWs (Tables 1, 2). The median low Kaikoura (Figure 5), with maximum received levels exceeding
and high frequencies of the ABW calls were 24.1 Hz (standard 120 dB re 1 µ Pa.
deviation = 3.6 Hz) and 26.8 Hz (standard deviation = 0.5 Hz), Pygmy blue whale calls were also detected at all four recording
respectively. Oftentimes, only the upper frequency of the “Z” calls locations in central New Zealand, although 84.1% of all PBW
was detectable. The median duration of ABW calls was 14.9 s detections were made at STB (Figure 3B and Table 2). There,
(standard deviation = 4.2 s). PBW calls featured median low PBW calls were detected with the highest density; an average of
frequency of 15.9 Hz (standard deviation = 3.3 Hz) and median 12.43 detections were made per 1,000 km2 per day, compared
high frequency of 25.1 Hz (standard deviation = 1.0 Hz). Median to average densities of less than 1 detection per 1,000 km2 per
duration of PBW calls was 37.9 s (standard deviation = 12.4 s). day at the other recording locations (Table 2). Both the highest
Received levels were available for 2,848 ABW calls (85.9%) and (150 dB re 1 µPa) and lowest (67 dB re 1 µPa) received intensities
11,291 PBW calls (64.8%). of PBW calls were recorded at STB (Figure 6). The presented
Antarctic blue whales calls were detected at all four recording detection area extents correspond to median detection areas,
locations (Table 1 and Figure 3A). In 2016, the number of daily however, the received levels reported for measured calls include
ABW detections peaked at the end of June into the beginning all annotated calls, and as such include received levels below the
of July (austral winter), while in 2017, peak occurrence was modelled detection threshold. At STB, PBW calls were detected
during July and August (Figure 3A). The first winter detections throughout both recording periods, except during the majority of
of ABWs in 2016 occurred at Kaikōura (the most southerly September and October 2016 (austral spring) (Figures 3B, 4B).
recorder), followed by concurrent detections at Wairarapa and While PBW calls were largely absent from STB and Cook Strait
Cook Strait 4 days later, and lastly at STB (the most northerly during September and October 2016, detections were made at
recorder) an additional 3 days later (Figure 3A). There was no Kaikōura and Wairarapa during this time, and even increased
spatio-temporal pattern in detections during 2017 (Figure 3A). in number compared to prior months (Figures 3B, 4B). Call
TABLE 1 | Antarctic blue whale call detections per recording location, and detection area information.
Recording Total Median Number of Detections Percentage overlap in detection area (%) Unique
location detections detection sub-sampled per 1,000 km2 detection
area (km2 ) days per day area (km2 )
STB Cook Strait Wairarapa Kaikōura
STB 651 8,556 386 0.20 n/a 50.4 0 0 4,245
Cook Strait 115 7,525 198 0.08 57.3 n/a 0 4.3 2,890
Wairarapa 1,302 97,069 252 0.05 0 0 n/a 53.6 45,020
Kaikōura 1,246 60,884 388 0.05 0 0.5 85.5 n/a 8,511
Detection areas were calculated for June with month specific SSP and 50th ambient noise percentile from acoustic data recorded in June 2016. STB = South Taranaki
Bight. n/a = not applicable.
TABLE 2 | Pygmy blue whale call detections per recording location, and detection area information.
Recording Total Median Number of Detections Percentage overlap in detection area (%) Unique
location detections detection sub-sampled per 1,000 km2 detection
area (km2 ) days per day area (km2 )
STB Cook Strait Wairarapa Kaikōura
STB 14,667 3,056 386 12.43 n/a 9.4 0 0 2,769
Cook Strait 266 3,418 198 0.39 8.4 n/a 0 0 3,131
Wairarapa 1,672 15,581 252 0.43 0 0 n/a 24.0 11,847
Kaikōura 832 25,358 388 0.08 0 0 14.7 n/a 21,624
Detection areas were calculated for March with month specific SSP and 50th ambient noise percentile from acoustic data recorded in March 2017 (STB and Kaikōura) or
average value for June-December 2016 (Cook Strait and Wairarapa). STB = South Taranaki Bight. n/a = not applicable.
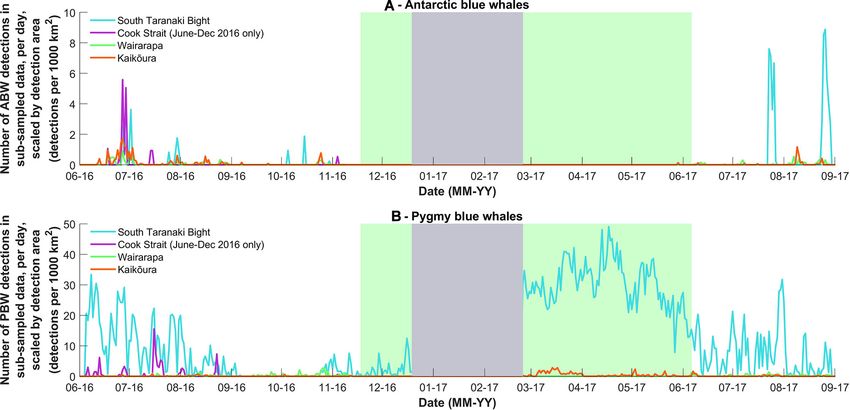
Frontiers in Marine Science | www.frontiersin.org 6 January 2021 | Volume 7 | Article 575257Warren et al. Blue Whale Distributions via PAM FIGURE 3 | (A) The number of Antarctic blue whale and (B) pygmy blue whale calls detected per day in the stratified random subsample of data from 2016 and 2017. The grey block indicates when the acoustic recorders were not deployed. The green block corresponds to the period in which the Wairarapa data were not analysed due the presence of seismic survey sound in the blue whale call bandwidth. Note Y -axis scale differs between sub-species. FIGURE 4 | (A) The number of Antarctic blue whale and (B) pygmy blue whale calls detected per day in the stratified random subsample of data from 2016 and 2017, normalised by the detection area of each recording location (calculated for June 2016 or March 2017, respectively) to give daily detections per 1000 km2 . The grey and green blocks are as described in Figure 3. Note Y -axis scale differs between sub-species. detections peaked in number and density at STB between March detection areas of Wairarapa and Kaikōura (Tables 1, 2). Indeed, and May (austral autumn), and a March peak in PBW calls was ABW detection areas at Wairarapa and Kaikōura extended also evident at Kaikōura (Figures 3B, 4B). There was no acoustic to the limits of the 250 km modelling radius along some sampling at Cook Strait or Wairarapa during this period. radials in a north-easterly direction (Figure 1). Detection areas Normalisation by detection area was important as the areas for PBW calls were smaller than ABW detection areas at of Cook Strait and STB were up to 13 times smaller than the all recording locations, as a result of the lower source level Frontiers in Marine Science | www.frontiersin.org 7 January 2021 | Volume 7 | Article 575257
Warren et al.                                                                                                                          Blue Whale Distributions via PAM

  FIGURE 5 | Received levels of Antarctic blue whale calls detected per recording location, over time. Received levels were calculated only for the upper tone
  (approximately 26 Hz) of each call. The dashed lines indicate the detection threshold associated with an unconditional probability of detection of 50%, the model
  configuration is described in the Methodology. The grey and green blocks are as described in Figure 3.

  FIGURE 6 | Received levels of pygmy blue whale calls detected per recording location, over time. Received levels were calculated only for unit “B” of each phrase.
  The dashed lines indicate the detection threshold associated with an unconditional probability of detection of 50%, the model configuration is described in the
  Methodology. The grey and green blocks are as described in Figure 3.

for this sub-species (Tables 1, 2). Blue whale calls produced                          Kaikōura and Wairarapa (Tables 1, 2 and Figures 1, 2),
within areas where detection ranges overlapped could have                              and there was a small amount of overlap between the
been detected twice, at two recording locations. Detection                             Cook Strait and Kaikōura ABW detection areas (Table 1
areas overlapped between STB and Cook Strait, and between                              and Figure 1).

Frontiers in Marine Science | www.frontiersin.org                                  8                                           January 2021 | Volume 7 | Article 575257
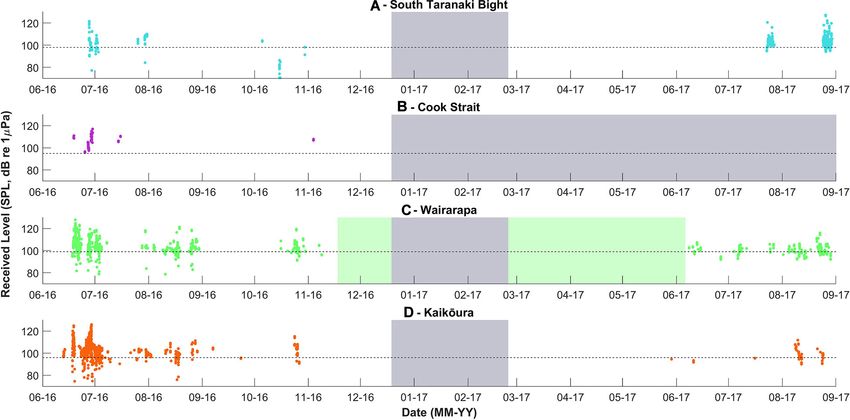
Warren et al.                                                                                                        Blue Whale Distributions via PAM

DISCUSSION                                                                   was no evidence of their year-round acoustic presence at this
                                                                             mid-latitude study site.
In the waters of New Zealand in the western South Pacific,                       Antarctic blue whale detections implied that the northbound
critically endangered Antarctic blue whales (ABWs) co-occur                  migratory corridor along the east coast of the South Island
with pygmy blue whales (PBWs). However, due to their                         of New Zealand (past Kaikōura) splits in the vicinity of Cook
offshore domain and the challenge of sub-species identification,             Strait, with some ABWs continuing along the east coast of the
information about their movements and distributions has been                 North Island and some ABWs travelling through Cook Strait
limited and often conflated. Passive acoustic monitoring (PAM)               into the STB. During migration, blue whales exhibit apparent
proved to be a highly effective method to examine the spatial                preferences for continental shelf edges and deep water (Širović
and temporal distributions of ABWs and PBWs by analysing                     et al., 2004; Branch et al., 2007; Bailey et al., 2009; Gavrilov
their sub-species specific calls. The calls of both blue whale sub-          and McCauley, 2013; Double et al., 2014), perhaps due to
species were highly stereotyped and comparable to those reported             the long-distance communication that is possible within such
in previous studies (Širović et al., 2004; McDonald et al., 2006;           environments. These habitat features exist along the east coast
Gavrilov et al., 2012; Miller et al., 2014). Modelled estimates of           of New Zealand and support the idea that some ABWs travel
detection areas provided context to the detected blue whale calls,           along the shelf edge during migration. That said, the large ABW-
and highlighted the relative importance of the varying marine                specific detection area of the Wairarapa recorder included the
environments that exist in central New Zealand. The findings                 eastern entrance to Cook Strait, meaning that ABWs detected at
also elucidated the sympatry of ABWs and PBWs in central                     Wairarapa could have migrated through Cook Strait. However,
New Zealand. Future management and conservation of blue                      the received levels of some ABW calls detected at Wairarapa
whales within central New Zealand waters can now be informed                 during northbound migration were the loudest ABW calls
by sub-species-specific distribution information.                            recorded at this location, and much louder than the threshold of
   Antarctic blue whales were detected moving northward                      the detection area. Therefore, some calling animals were likely
through central New Zealand waters in austral winter, and have               close to the recorder, and hence travelling along the east coast
previously been detected off northern New Zealand during this                of the North Island. Nonetheless, ABW detections were recorded
season (McDonald, 2006). A second peak in ABW calls was                      with greatest density in the STB. Given that call density was
detected in spring, indicative of southbound movement. These                 similar between Cook Strait and Wairarapa, but substantially
data provide evidence that New Zealand waters are a migratory                higher in the STB, it is plausible that only a portion of the
corridor for critically endangered ABWs, which feed in Antarctic             ABWs detected in the STB had travelled through Cook Strait,
waters during austral summer, and breed in warmer waters                     with additional whales entering the STB from the western coast
during austral winter (Širović et al., 2004; Branch et al., 2007).          of New Zealand. The waters of the STB feature high productivity
Similar bimodal blue whale detections have been reported in                  (Chiswell et al., 2017) and are a known hotspot for blue whale
migratory corridors in the sub-Antarctic (Leroy et al., 2016), and           feeding (Torres, 2013; Torres et al., 2020). Opportunistic ABW
off the coast of Madagascar (Cerchio et al., 2019). There is a               feeding occurs during migration in other locations (Gill, 2002;
general paucity of information regarding ABWs in the western                 Tripovich et al., 2015; Balcazar et al., 2017; Gill et al., 2011),
South Pacific (Branch et al., 2007), but possible breeding areas             and migration through the STB may therefore allow ABWs
of ABWs include Tonga and Samoa (Brodie and Dunn, 2015;                      to forage before or after the breeding season. If ABWs feed
Balcazar et al., 2017). Some ABW calls were detected in acoustic             opportunistically during migration, resource competition could
data from the east coast of central New Zealand (Wairarapa                   occur between the two blue whale sub-species in New Zealand
and Kaikōura) between the two modal peaks (September and                    waters. A larger number of ABW calls were detected in the STB
October). These detections suggest that some ABWs remain                     in winter 2017 than in winter 2016, although it is not known
within the detection range of the east coast recorders during the            whether this was a reflection of greater productivity in the area.
breeding season. Alternatively, the calls detected during this time              In addition to the seasonal presence of ABWs, the STB proved
could have been produced by late northbound whales or early                  to be an important location for PBWs, as evidenced by the high
southbound whales. Prior to 2019, ABWs were listed as “migrant”              number and density of sub-species specific calls, particularly
in New Zealand, implying that they occurred predictably and                  during austral autumn (March to May). Barlow et al. (2018)
cyclically, but did not breed in national waters (Baker et al., 2016).       also reported 100% daily acoustic presence of PBWs in the STB
The findings of the present study leave uncertainty regarding the            during the 2016 austral autumn. In south-west Australia, calls
possibility of ABWs using New Zealand waters as a breeding                   of east Indian Ocean PBWs also peak during austral autumn
ground and thus support their revised national “data deficient”              (between February and May) (Stafford et al., 2011; Gavrilov and
status (Baker et al., 2019). Further research is required to                 McCauley, 2013; McCauley et al., 2018). Unlike ABWs, PBWs do
determine whether ABWs breed in New Zealand waters. The                      not migrate to Antarctica to feed (Branch et al., 2007) (see Attard
year-round acoustic presence of ABWs has been reported at both               et al., 2012 for exceptions), and therefore rely on local productive
high and low latitudes (Širović et al., 2004, 2007; Samaran et al.,         feeding areas, such as the STB (Barlow et al., 2020). An autumn
2010; Leroy et al., 2016; Thomisch et al., 2016), implying that              peak in calling in the STB may be related to feeding activity,
their migration is complex and not obligate behaviour (Thomisch              which has been observed in Australian waters during autumn
et al., 2016). However, ABW detections in central New Zealand                (Gill, 2002). Male blue whales produce song year-round (Leroy
waters were strongly indicative of migratory behaviour, and there            et al., 2016; Thomisch et al., 2016), but song production may

Frontiers in Marine Science | www.frontiersin.org                        9                                    January 2021 | Volume 7 | Article 575257
Warren et al. Blue Whale Distributions via PAM
be mutually exclusive with feeding due to differences in energy Barlow et al. (2018) also reported a decline in PBW calls in
requirements and depth between feeding and singing (Stafford the STB during September and October 2016, although PBW
et al., 2005; Wiggins et al., 2005; Oleson et al., 2007; Hazen et al., calls were detected consistently year-round in deeper water to
2015). In order to explain the large number of call detections the west of the STB. Movements of individual PBW are largely
made during a presumed feeding period, the whales must have unknown; two satellite tag deployments and ten inter-annual
been exhibiting different behavioural states, with some singing photographic resightings have been made, revealing movement
and some feeding. Male PBWs could alternate between the two between the east and west coasts of New Zealand (Olson et al.,
behaviours throughout the day, with song produced during times 2015; Barlow et al., 2018; Goetz et al., in review). PAM provides
when feeding is not conducted (Oleson et al., 2007; Lewis and a population-level insight into spatial and temporal distributions,
Širović, 2018). As female blue whales are not thought to produce but alternative methods, such as photographic mark-recapture,
song, they may spend more time feeding (Ladd et al., 2019). The genetic sampling, or satellite tag deployment would be required to
apparent increase in call density during austral autumn may also ascertain individual-specific movements (Goetz et al., in review).
have been a reflection of increased call production rates if the The calls produced by PBWs in New Zealand have also been
behavioural context in the area promoted calling. recorded in Tonga, as well as the south and east coasts of
Assuming that the number of call detections is proportional Australia (Balcazar et al., 2015; McCauley et al., 2018), and
to the number of PBWs present, an aggregation of PBWs south of Tasmania (Miller et al., 2019), suggesting that the
could occur in the STB, particularly during austral autumn. The population has a larger distribution than just New Zealand
variation observed in the received levels of PBW calls at STB national waters. Fewer call detections in the STB and Cook
indicated that PBWs occurred throughout the STB detection area, Strait during spring could have also resulted from vocal animals
and likely beyond. The STB detection area overlapped somewhat entering a behavioural state where they produced song at a
with the detection area of the Cook Strait recorder, which could reduced rate, or not at all. The proportion of mature males
have resulted in double counting of some calls, but this would that produce song at a given time is largely unknown, although
have scarcely altered the STB results. Aggregations of blue whales McCauley et al. (2001) suggested that less than 28% of PBWs call
are rare in the southern hemisphere, with most animals occurring at a given time.
alone or in pairs (Branch et al., 2007; Garcia-Rojas et al., 2018; Consistent acoustic monitoring over time can provide insight
McCauley et al., 2018). The STB is an important industrial area in into movements and inter-annual variation in distribution. In
New Zealand waters. The presence of a PBW aggregation in the this relatively short-term study, the timing of the northbound
STB should promote the undertaking of further study in the area ABW migration differed between 2016 and 2017, shifting from
to determine fine-scale habitat use, their seasonal persistence of the end of June in 2016 to the end of July and into August
use, and whether static or dynamic protective measures should in 2017. Specific drivers underpinning the timing of ABW
be implemented. Protective measures could include scheduling migration could include ice cover or food abundance at high
anthropogenic activities outside of key periods of PBW presence, latitudes (Hauser et al., 2017; Szesciorka et al., 2020). Such large
although the seasonal movements of critically endangered ABW inter-annual variation in ABW migration timing could lead to
through this region should also be taken into consideration. challenges when scheduling anthropogenic activities to occur
Pygmy blue whale detections were greatest during autumn outside of important blue whale periods. Individual-specific
at Kaikōura, and these calls were received at relatively high information would aid in determining appropriate protective
intensities. A satellite-tagged PBW spent several days off the measures, if these were to be considered. Marine top predators,
Kaikōura coast in autumn 2018 (Goetz et al., in review), and also such as blue whales, can be considered ecosystem sentinels
spent time in a known feeding area off the coast of Oamaru, (Hazen et al., 2019) and their movements and distributions can
further south on the east coast of the South Island (Olson be directly related to prey availability, often driven by physical
et al., 2015; Goetz et al., in review). In the present study, PBW oceanography, both on local and global scales (Ladd et al., 2019;
calls were also received at Kaikōura, and increased in number Barlow et al., 2020). As such, movement data from individual
and density at Wairarapa, during austral spring (September animals may provide insight into whether dynamic protective
and October), when detections declined at the STB and Cook measures that are responsive to external drivers would be more
Strait recording locations. Future research should investigate the effective than static areas of protection (Hartel et al., 2015;
spatial distribution and habitat use of blue whales along the east Dwyer et al., 2020).
coast of the South Island, as this area may provide important Individual-specific methods, such as genetic sampling, would
resources for PBWs. Such research can now be conducted with also be essential to elucidate the demographic information
greater confidence in the likely sub-species identity of observed necessary to interpret call detections into population-level
blue whales, given the insights into ABW temporal presence inferences. The results presented here are only relevant for
provided here. singing blue whales, which are presumed to be mature males.
The decline in PBW detections in spring at Cook Strait Secondary information regarding the sex ratio of animals in the
and STB may have been a result of PBWs, particularly vocal study area is available only for PBW (not significantly different
mature males, undertaking movements away from Cook Strait from 1:1) (Barlow et al., 2018); non-singing female blue whales
and the STB. The received levels of the PBW calls at STB were could behave differently to song-producing males, and may even
lower during spring than at other times of year, suggesting have different spatial or temporal distributions. Further insight
PBWs had indeed moved further from the recording location. could be gained from the current dataset via an analysis of “D”
Frontiers in Marine Science | www.frontiersin.org 10 January 2021 | Volume 7 | Article 575257Warren et al. Blue Whale Distributions via PAM
calls, which are produced by males and females of all sub-species context, density estimates could be extremely valuable, providing
of blue whale, and have been associated with multiple behavioural confidence to estimates of PBW population size (Barlow et al.,
contexts (Oleson et al., 2007; Lewis et al., 2018; Schall et al., 2019). 2018), and an ability to investigate the recovery of the ABW
As they are not sub-species specific, “D” calls were not considered population subsequent to the cessation of whaling (Branch et al.,
within the scope of this study, but their temporal and spatial 2004, 2007; McCauley et al., 2018).
distribution in central New Zealand could reveal nuances in blue Passive acoustic monitoring is an ideal method to improve
whale activity across sexes that are not demonstrated here. the understanding of blue whale sub-species distributions. An
Many assumptions are required in terms of estimating acoustic approach enabled consistent coverage of offshore waters
detection ranges through acoustic modelling; variation in source that would be logistically impossible to survey via boat or
levels, calling depths, and ambient noise can have a dynamic air with the same resolution. In addition, PAM allowed for
impact on detection areas over time (Stafford et al., 2007; the sub-species identification of blue whales that is often not
Samaran et al., 2010; Miksis-Olds et al., 2015). Here, estimated possible during visual observations in the field. The findings
blue whale detection areas from one month per sub-species (June revealed that New Zealand is a migratory corridor for ABWs,
2016 or March 2017) were extrapolated across both deployment and during migration, this sub-species is sympatric with PBWs
periods. Specific acoustic events, such as the seismic survey in central New Zealand. PBWs were detected throughout both
recorded at Wairarapa during 2016 and 2017, were generally not recording periods, and throughout the study area, supporting
incorporated in the ambient noise levels included in the models their “resident native” status in New Zealand (Baker et al.,
to avoid biased detection area estimates. Ambient noise levels that 2019). The study accentuated the need to interpret acoustic
were higher than average would have resulted in smaller detection detections in the light of acoustic detection areas, especially when
areas. Moreover, these events could have influenced call detection comparing detections across recording locations. In doing so,
likelihood, and even blue whale presence or calling behaviour, the relative importance of the STB was revealed; the migration
as noted in other locations (Di Iorio and Clark, 2010; Melcón route of critically endangered ABWs passes through the STB
et al., 2012). The use of median detection thresholds was selected during winter and spring, and an apparent aggregation of PBWs
as an approach to balance the various sources of uncertainty. occurs in the STB year-round, particularly during austral autumn.
The largest contributor to variability is ambient noise, which can This study revealed that the east coast of the South Island
vary significantly. As noted during the analysis of data, periods may also provide important habitat or resources for PBWs, and
of low ambient noise allowed very quiet calls to be annotated ABWs may breed in this area; these hypotheses deserve further
with confidence. The calls annotated during the quieter periods investigation. Blue whale information that is not sub-species
were likely to be those with received levels below the detection specific is not useful to inform management due to the different
thresholds associated with the predicted median detection areas. threat classifications of ABWs and PBWs, and future conflation
Additional contributors to uncertainty in detectability, albeit with should be avoided as ABW and PBW distributions are markedly
a lesser contribution than ambient noise levels, were the source different over time and space. An acoustic approach to study the
levels of blue whale calls and the depths at which calls may have distribution of blue whales is highly appropriate, and findings can
been produced. Regardless, the use of estimated detection areas be used to inform management of blue whales, with confidence in
to scale call detections provided a useful comparison across sites. sub-species identity.
In the deep waters to the east of central New Zealand, blue
whale calls and other sounds in the 25 Hz-centred decidecade
band could have propagated from areas outside of the 250 km DATA AVAILABILITY STATEMENT
maximum modelling range. The formation of sound channels
in deep water enables long distance propagation, particularly of The original contributions presented in the study are included
low frequency sounds, such as blue whale calls (Stafford et al., in the article/Supplementary Material, further inquiries can be
1998; Wille, 2005; Miller et al., 2015). The high number of ABW directed to the corresponding author.
detections at the east coast recorders was likely in part due
to the large potential detection areas. Detection areas for the
Cook Strait and STB recording locations were markedly smaller;
ETHICS STATEMENT
sound propagation was somewhat constrained by land masses, Ethical review and approval was not required for the animal study
but sandy seabed sediments and relatively shallow water depths because free-ranging animals were studied passively using seabed
also limited sound transmission (Wille, 2005; McPherson et al., acoustic recorders; animals were not interacted with directly.
2019). The modelled detection areas indicated that all blue whale
calls detected at the STB recorder were produced inside the STB,
enabling the importance of this region for blue whales to be truly AUTHOR CONTRIBUTIONS
highlighted. Estimating the effective detection area of an acoustic
recorder is a necessary step to be able to estimate animal density All authors conceived and designed the project, interpreted the
from call detections (Marques et al., 2013; Nuuttila et al., 2018). data and critically revised, and approved the final manuscript.
Density estimation requires knowledge of additional multipliers, VW conducted all blue whale call analyses and wrote the
such as call production rates (Marques et al., 2013), which have manuscript. CM modelled detection areas and recalculated
yet to be estimated for blue whales, but in a New Zealand received levels of blue whale calls over revised limits.
Frontiers in Marine Science | www.frontiersin.org 11 January 2021 | Volume 7 | Article 575257Warren et al. Blue Whale Distributions via PAM
FUNDING necessarily represent the views of the National Marine Fisheries
Service, NOAA. Mention of trade names and commercial
VW was funded by a University of Auckland Doctoral firms does not imply endorsement by the National Marine
Scholarship and the Woodside Marine Mammal Research Grant Fisheries Service, NOAA.
awarded by Woodside Energy. Acoustic data collection was
conducted by the National Institute of Water and Atmospheric
Research (NIWA), Wellington, supported by funding from OMV
New Zealand Ltd., Chevron New Zealand Holdings LLC, and SUPPLEMENTARY MATERIAL
Marlborough District Council.
The Supplementary Material for this article can be found
online at: https://www.frontiersin.org/articles/10.3389/fmars.
ACKNOWLEDGMENTS 2020.575257/full#supplementary-material
We thank the acoustic deployment and retrieval teams from Supplementary Data Sheet 1 | Antarctic blue whale (ABW) call dataset analysed
the National Institute of Water and Atmospheric Research, in this study: recording location, time/date, sub-species identity, and received level
of each detected call. Location key: STB = South Taranaki Bight, CS = Cook
Wellington: Sarah Searson, Mike Brewer, Olivia Price, Fiona Strait, WR = Wairarapa, KK = Kaikoura. Received levels of 0 are equivalent to
Elliott, and the crews of the RVs Tangaroa, Kaharoa and ‘NaN’.
Ikatere. We are extremely grateful to Briand Gaudet and
Supplementary Data Sheet 2 | Pygmy blue whale (PBW) call dataset analysed in
Ildar Urazghildiiev at JASCO Applied Sciences for their input this study: recording location, time/date, sub-species identity, and received level of
into the propagation modelling. The findings and conclusion each detected call. Location key: STB = South Taranaki Bight, CS = Cook Strait,
in this manuscript are those of the authors and do not WR = Wairarapa, KK = Kaikoura. Received levels of 0 are equivalent to ‘NaN’.
REFERENCES on multiple lines of evidence. Endanger. Species Res. 36, 27–40. doi: 10.3354/
esr00891
Alvarez-Berríos, N., Campos-Cerqueira, M., Hernández-Serna, A., Amanda Baumann-Pickering, S., McDonald, M. A., Simonis, A. E., Solsona Berga, A.,
Delgado, C. J., Román-Dañobeytia, F., and Aide, T. M. (2016). Merkens, K. P. B., Oleson, E. M., et al. (2013). Species-specific beaked whale
Impacts of small-scale gold mining on birds and anurans near the echolocation signals. J. Acoust. Soc. Am. 134, 2293–2301. doi: 10.1121/1.
tambopata natural reserve, peru, assessed using passive acoustic 4817832
monitoring. Trop. Conserv. Sci. 9, 832–851. doi: 10.1177/194008291600 Biggs, C., Wilson, P. S., and Erisman, B. (2019). Propagation loss of spawning calls
900216 produced by spotted seatrout Cynoscion nebulosus and the effective detection
Attard, C. R. M., Beheregaray, L. B., Jenner, K. C. S., Gill, P. C., Jenner, area of passive acoustic sampling. J. Acoust. Soc. Am. 145, 1807–1807. doi:
M. N., Morrice, M. G., et al. (2012). Hybridization of Southern hemisphere 10.1121/1.5101618
blue whale subspecies and a sympatric area off Antarctica: impacts of Branch, T. A., Matsuoka, K., and Miyashita, T. (2004). Evidence for increases
whaling or climate change? Mol. Ecol. 21, 5715–5727. doi: 10.1111/mec. in Antarctic blue whales based on Bayesian modelling. Mar. Mamm. Sci. 20,
12025 726–754. doi: 10.1111/j.1748-7692.2004.tb01190.x
Bailey, H., Mate, B., Palacios, D., Irvine, L., Bograd, S., and Costa, D. (2009). Branch, T. A., Stafford, K. M., Palacios, D. M., Allison, C., Bannister, J. L.,
Behavioural estimation of blue whale movements in the Northeast Pacific from Burton, C. L. K., et al. (2007). Past and present distribution, densities and
state-space model analysis of satellite tracks. Endanger. Species Res. 10, 93–106. movements of blue whales Balaenoptera musculus in the Southern Hemisphere
doi: 10.3354/esr00239 and northern Indian Ocean. Mamm. Rev. 37, 116–175. doi: 10.1111/j.1365-
Baker, C. S., Boren, L. J., Childerhouse, S., Constantine, R., van Helden, A., 2907.2007.00106.x
Lundquist, D., et al. (2019). Conservation Status of New Zealand Marine Brodie, D. C., and Dunn, R. A. (2015). Low frequency baleen whale calls detected
Mammals, 2019. New Zealand Threat Classification Series 29. Wellington: on ocean-bottom seismometers in the Lau basin, southwest Pacific Ocean.
Department of Conservation. J. Acoust. Soc. Am. 137, 53–62. doi: 10.1121/1.4904556
Baker, C. S., Chilvers, B. L., Childerhouse, S., Constantine, R., Currey, R., Mattlin, CANZ (2008). New Zealand Region Bathymetry, 1:4 000 000. Miscellaneous Series
R., et al. (2016). Conservation Status of New Zealand Marine Mammals, No. 85, 2nd Edn. Auckland: NIWA Chart.
2013. New Zealand Threat Classification Series 14. Wellington: Department of Carnes, M. R. (2009). Description and Evaluation of GDEM-V 3.0. Available online
Conservation. at: https://apps.dtic.mil/dtic/tr/fulltext/u2/a494306.pdf (accessed December 14,
Balcazar, N. E., Klinck, H., Nieukirk, S. L., Mellinger, D. K., Klinck, K., 2020).
Dziak, R. P., et al. (2017). Using calls as an indicator for Antarctic Cerchio, S., Rasoloarijao, T., and Cholewiak, D. (2019). Progress Report:
blue whale occurrence and distribution across the southwest Pacific and Acoustic Monitoring of Blue Whales (Balaenoptera musculus) and other Baleen
southeast Indian Oceans. Mar. Mamm. Sci. 33, 172–186. doi: 10.1111/mms. Whales in the Mozambique Channel off the Northwest Coast of Madagascar.
12373 (SC/67B/SH/14 Rev1). Cambridge: International Whaling Commission, 14.
Balcazar, N. E., Tripovich, J. S., Klinck, H., Nieukirk, S. L., Mellinger, D. K., Dziak, Chen, I. C., Hill, J., Ohlemueller, R., Roy, D., and Thomas, C. (2011). Rapid range
R. R., et al. (2015). Calls reveal population structure of blue whales across the shifts of species associated with high levels of climate warming. Science 333,
southeast Indian Ocean and the southwest Pacific Ocean. J. Mammal. 96:1184. 1024–1026. doi: 10.1126/science.1206432
doi: 10.1093/jmammal/gyv126 Chiswell, S. M., Zeldis, J. R., Hadfield, M. G., and Pinkerton, M. H. (2017). Wind-
Barlow, D. R., Bernard, K. S., Escobar-Flores, P., Palacios, D. M., and Torres, driven upwelling and surface chlorophyll blooms in Greater Cook Strait. N. Z. J.
L. G. (2020). Links in the trophic chain: modeling functional relationships Mar. Freshwater Res. 51, 465–489. doi: 10.1080/00288330.2016.1260606
between in situ oceanography, krill, and blue whale distribution under different Collins, M. D. (1993). A split-step Padeì solution for the parabolic equation
oceanographic regimes. Mar. Ecol. Prog. Ser. 642, 207–225. doi: 10.3354/ method. J. Acoust. Soc. Am. 93, 1736–1742. doi: 10.1121/1.406739
meps13339 Collins, M. D., Cederberg, R. J., King, D. B., and Chin-Bing, S. (1996). Comparison
Barlow, D. R., Torres, L. G., Hodge, K. B., Steel, D., Baker, C. S., Chandler, T. E., of algorithms for solving parabolic wave equations. J. Acoust. Soc. Am. 100,
et al. (2018). Documentation of a New Zealand blue whale population based 178–182. doi: 10.1121/1.415921
Frontiers in Marine Science | www.frontiersin.org 12 January 2021 | Volume 7 | Article 575257You can also read