In molecular motor gliding motility assays
←
→
Page content transcription
If your browser does not render page correctly, please read the page content below
arXiv:2102.07345v2 [cond-mat.mes-hall] 23 Feb 2021

                                                     Prospects for single-molecule electrostatic detection
                                                     in molecular motor gliding motility assays
                                                                  M. Sanchez Miranda1 , R. Lyttleton1,2 , P.H. Siu1 , S. Diez3 ,
                                                                  H. Linke2 , A.P. Micolich1
                                                                  1
                                                                    School of Physics, University of New South Wales, Sydney NSW 2052, Australia
                                                                  2
                                                                    NanoLund and Solid State Physics, Lund University, S-22100 Lund, Sweden
                                                                  3
                                                                    B CUBE - Center for Molecular Bioengineering, Technische Universität Dresden,
                                                                  D-01307 Dresden, Germany
                                                                  E-mail: adam.micolich@nanoelectronics.physics.unsw.edu.au

                                                     Submitted to: New J. Phys.

                                                                  Abstract. Molecular motor gliding motility assays based on myosin/actin or
                                                                  kinesin/microtubules are of interest for nanotechnology applications ranging from
                                                                  cargo-trafficking in lab-on-a-chip devices to novel biocomputation strategies. Prototype
                                                                  systems are typically monitored by expensive and bulky fluorescence microscopy
                                                                  systems and the development of integrated, direct electric detection of single filaments
                                                                  would strongly benefit applications and scale-up. We present estimates for the viability
                                                                  of such a detector by calculating the electrostatic potential change generated at a
                                                                  carbon nanotube transistor by a motile actin filament or microtubule under realistic
                                                                  gliding assay conditions. We combine this with detection limits based on previous state-
                                                                  of-the-art experiments using carbon nanotube transistors to detect catalysis by a bound
                                                                  lysozyme molecule and melting of a bound short-strand DNA molecule. Our results
                                                                  show that detection should be possible for both actin and microtubules using existing
                                                                  low ionic strength buffers given good device design, e.g., by raising the transistor
                                                                  slightly above the guiding channel floor. We perform studies as a function of buffer ionic
                                                                  strength, height of the transistor above the guiding channel floor, presence/absence of
                                                                  the casein surface passivation layer for microtubule assays and the linear charge density
                                                                  of the actin filaments/microtubules. We show that detection of microtubules is a more
                                                                  likely prospect given their smaller height of travel above the surface, higher negative
                                                                  charge density and the casein passivation, and may possibly be achieved with the
                                                                  nanoscale transistor sitting directly on the guiding channel floor.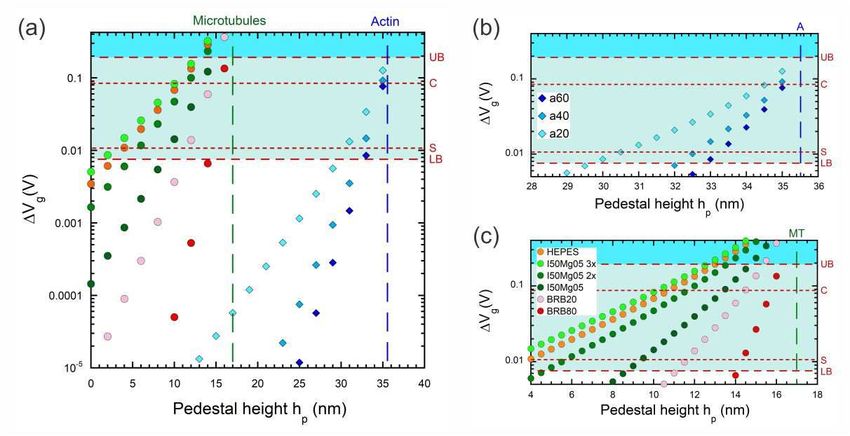
Prospects for single-molecule electrostatic detection in molecular motor gliding motility assays2

1. Introduction

A key frontier in nanotechnology in recent decades has been the development of
functional nanodevices featuring biomolecular motors, with a strong focus on motile
‘gliding’ assays using the actin-myosin and kinesin-microtubule molecular motor
systems [1, 2, 3, 4]. Gliding assays were initially developed to better understand
the underpinning biophysics of the actin-myosin [5, 6] and kinesin-microtubule [7]
motor systems. Directed motion of actin filaments [8, 9] and microtubules [10]
via lithographically-patterned guiding structures opened the path towards motile
biosensors [11] and associated diagnostics [12], nanoscale cargo-trafficking systems [13, 2,
14], bio-inspired optical devices [15], and most recently, structures for efficiently solving
combinatorial problems by having molecular motors explore a complex network [16].
      Network-based biocomputation [16] is a strong motivator to extend beyond
microscope-based detection of filaments because scale-up inevitably leads to the need
to detect filament passage at a very large number of points spread across an area
much larger than the field-of-view for an appropriate magnification objective. This
need for new detection strategies led us to consider an electrical approach where a
nanoscale transistor made with, e.g., carbon nanotubes, graphene or semiconductor
nanowires, spans the bottom of a lithographically-patterned guiding structure. Both
actin filaments [19] and microtubules [20] carry negative charge that can in principle
electrostatically gate a nanoscale transistor providing it passes within a distance smaller
than the buffer’s Debye length. Such an electrostatic sensor for gliding molecular
motor assays could have more widespread applications, for example, as a trigger for
optical [17] or thermal [18] actuation of motility, direction of traffic at junctions [21],
addition/removal of cargo [2, 4], or addition/removal/read-out of chemical ‘tags’ added
to filaments to improve information carrying capacity [22].
      Our goal here is to establish the feasibility and develop some design guidelines for
such a nanoscale transistor detector. We do this via basic ‘first principles’ calculations
accounting for key aspects of the sensor geometry and design, combined with detection
estimates based on published experimental data for detection of other biological targets
using nanoscale transistor devices. Our calculations show that electrostatic detection
of passing filaments is certainly possible in principle. We define and address key
experimental parameters, e.g., buffer ionic strength, protein charge, etc., and discuss
how they influence the limits of detection for this type of sensor. Notably, we find that
electrostatic detection is likely to be a significantly easier prospect for microtubules than
it is for actin.

2. Background and Approach

The development of nanoscale transistors featuring carbon nanotube, graphene or
semiconductor nanowire conducting channels for biosensing applications has a long
history [23]. We have chosen to focus on a transistor featuring one single-walled carbon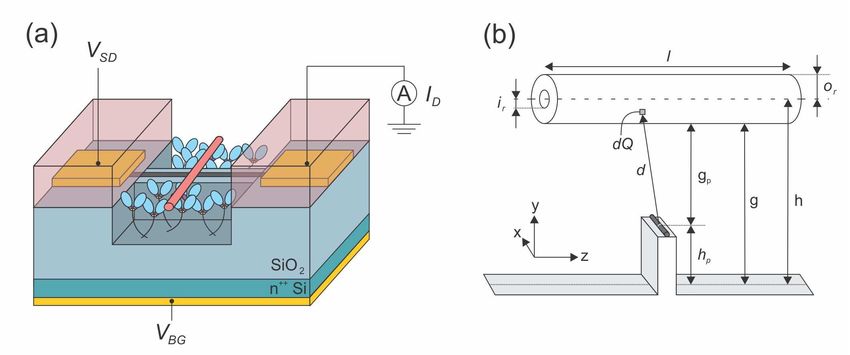
Prospects for single-molecule electrostatic detection in molecular motor gliding motility assays3

nanotube as the transistor channel for two main reasons. First, the low diameter
(1 − 2 nm) provides a strongly confined but highly exposed conduction channel that
enables strong gate response [23]. Semiconductor nanowires are much larger (10−100 nm
diameter) with less strongly confined carriers that are set slightly back from the surface
due to band-bending and surface oxidation effects [24]. Graphene falls between the
two but involves an additional free parameter, channel width, which adds complexity
to the calculations. Second, there are numerous experimental works characterizing the
response of single-walled carbon nanotube transistors to single biomolecules [25, 26, 27]
and aspects related to Debye screening effects in these devices [28, 29]. These help make
our task considerably easier than it might otherwise be.

2.1. Detector Concept
Figure 1 shows a schematic of our detector concept. A carbon nanotube transistor
spans a microfabricated channel for guiding actin filaments or microtubules, which we
hereafter simply call ‘filaments’ unless there is a need to be specific to one or the other.
The key challenge for an electrostatic sensor is getting the transistor close enough to the
filament to overcome Debye screening. Filaments travel some finite distance above the
guiding channel surface, lifted by the surface-bound motors that provide their motive
force. The filaments have finite thickness meaning that there are two relevant heights –
the height of their centre-of-mass axis above the surface h and the separation between
their bottom edge and the surface g, which we refer to as the elevation. Ultimately
g = h − or where or is the outer radius of the filament, i.e., half the thickness. For this
work we use h = 38 nm (g = 35.5 nm) for actin [32] and h = 29.5 nm (g = 17 nm)
for microtubules [33]. The travel height is not easily tuned and is notably larger than
the typical Debye length λD ∼ 0.5 − 5 nm. This urges us to consider a mechanism
for raising the carbon nanotube transistor by some height hp < 50 nm relative to the
guiding channel floor, as shown in Fig. 1, to give an effective sensor elevation gp that is
significantly less than g.
     A more detailed concept for the detector is outlined in Fig. 1(a) and is built
on a degenerately-doped Si substrate covered with a 0.1 − 0.5 µm layer of thermal
oxide, as is typical for nanotube transistors [25, 26, 27]. This SiO2 -on-Si structure
gives a ‘back-gate’ to which a voltage VBG can be applied for tuning the transistor
operating point, i.e., the current ID that flows in response to an applied source-drain
bias VSD [27], to maximise the sensitivity to changes in electrostatic potential local to
the carbon nanotube. The n+ -Si can also be used as a mirror-surface for implementing
fluorescence interference contrast (FLIC) [30] to enhance local optical detection [33, 31].
The nanotube transistor’s source and drain contacts and associated interconnects are
buried under the material that defines the guiding channel structure to encapsulate
them from the liquid environment inside the assay flow-cell. A realistic approach to
fabricating such a structure is described in the Supplementary Information. With a
basic device concept sketched out, we focus entirely for the remainder of this work on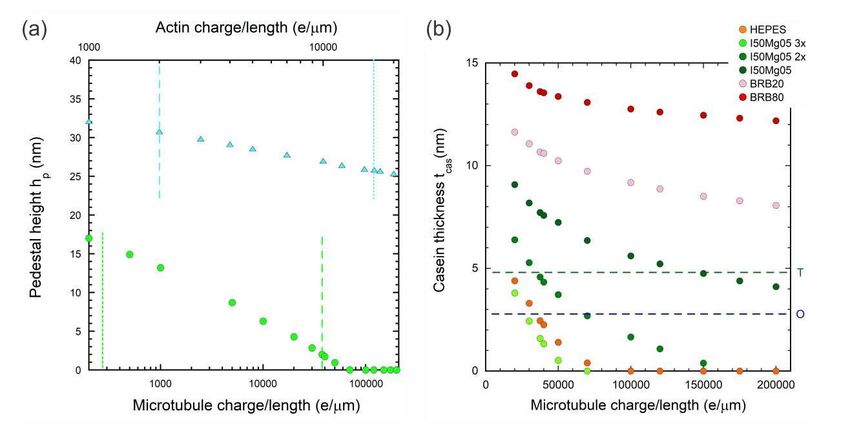
Prospects for single-molecule electrostatic detection in molecular motor gliding motility assays4

              Figure 1. (a) Schematic of the detector concept, which consists of a carbon nanotube
              transistor integrated into the guiding channel structure typically used in gliding
              motility assays (not to scale). The n+ -Si substrate (green) is used as a back-gate
              for the carbon nanotube transistor, which is connected to source and drain contacts
              (gold) buried under a material (pink) used to define the guiding channel. A voltage
              VSD applied to the source contact drives a current ID through the nanotube, which is
              measured flowing out of the drain contact. The transistor is tuned to its most sensitive
              condition, i.e., highest dID /dVBG , via the back-gate potential VBG applied to a metal
              contact to the n+ -Si substrate. The carbon nanotube and its source and drain contacts
              are insulated from the back-gate by a SiO2 layer (light blue), which can also be used to
              raise the nanotube above the floor of the guiding channel to overcome Debye screening
              (see text). (b) Schematic of the electrostatic model, which features a filament with
              inner radius ir , outer radius or , length l and charge per length λ, travelling along the
              z-direction with its centre of mass at a height h above the guiding channel floor. The
              free-space between the bottom of the filament and the nanotube g = h − or is referred
              to as the elevation following Ref. [33]. A carbon nanotube at z = 0 runs along the x-
              direction on an oxide pedestal with height hp to reduce the effective filament elevation
              at the detection point to gp . The carbon nanotube is treated as a one-dimensional
              conductor. We integrate over infinitesimal charge elements dQ located a distance d
              away from the most strongly gated segment of the nanotube at (0, 0, 0) to obtain the
              electrostatic potential difference ∆V generated by a passing filament.

theoretical considerations, leaving aspects of experimental realisation, e.g., prototypes,
for separate work.
     The theoretical aspects of the approach can be roughly divided into two parts.
First, we use a fairly simple electrostatic model, implemented in Python, to estimate
the change in electrostatic potential produced at a nanotube transistor by a passing actin
filament or microtubule. Second, we work from published experiments, in particular,
Choi et al. [27] and Sorgenfrei et al. [26] to establish the limits of detection for a
change in electric potential at a nanotube transistor due to a biological target, e.g.,
Prospects for single-molecule electrostatic detection in molecular motor gliding motility assays5
lysozyme catalysis and DNA melting, respectively. These two parts are then combined to
determine whether the change in electrostatic potential generated by a passing filament
would be detectable.
2.2. Electrostatic Model
The electrostatic model is implemented in three dimensions [34] at the plane passing
vertically through the filament perpendicular to the guiding channel floor, as illustrated
in Fig. 1(b). We assume the carbon nanotube is a one-dimensional conductor (diameter
→ 0) extending along the x-axis at y = 0, z = 0. The x-direction is included in the
model simply to properly treat the screening for the cylindrical filaments. There is
an implied geometrical assumption in this, which is that the guiding channel and the
filament both run parallel to z and are centred at x = 0. Ultimately, the only section
of the nanotube we are interested in is the infinitesimal segment at (0, 0, 0) where the
strongest gating will occur by symmetry. In our work, we focus on knowing the effective
gating potential at the nanotube due to the negatively-charged filament to enable direct
empirical connection to prior experimental observations of biomolecular charge sensing
in nanotube transistors [26, 27]. We have deliberately done this instead of modelling
the conduction/response of the nanotube itself to ensure tighter connection to likely
experimental reality. For simplicity, we also assume that the filament is fully rigid,
i.e., has infinite persistence length, such that the travel height h is the same at every
point along its length. We thus ignore any bending of the filament caused either by the
platform structure or myosin/kinesin binding. This could be an interesting extension for
future work as height fluctuations due to filament flexibility could enhance the transient
signal beyond our estimates.
We establish the potential V at the nanotube segment at (0, 0, 0) by considering
the filament as a cylinder (solid for actin, hollow for microtubules) composed of equal
point charges dQ. We integrate over the cylinder to account for the differing distances
d between the element dQ and the nanotube segment at (0, 0, 0). We designed the
software for positional versatility along z, but if the centre of the filament is directly
above (0, 0, 0), we can speed up the calculation by integrating over only a quarter of the
filament due to symmetries about z = 0 (left/right in Fig. 1(b)) and x = 0 (front/back
in Fig. 1(b)). We obtain the gating potential difference ∆V as the difference between the
potential V with the filament directly overhead the nanotube (centred at z = 0) and with
the filament at z >> λD , where we assume V = 0. This means that ∆V = 0 − V = −V .
For simplicity, we account for Debye screening using the Debye-Hückel model, [35] noting
that while we are not in a regime where counterion condensation [36, 37] can be ignored,
we can reasonably account for it in our consideration of the effective filament charge
density [38] (see §2.2.2). By this approach we obtain a voltage contribution dV for dQ
as:
dQ 1 −d/λD
dV = e (1)
4πǫ0 ǫr dProspects for single-molecule electrostatic detection in molecular motor gliding motility assays6
where ǫr ≃ 80 for H2 O. Additionally, the Debye screening length λD is [39]:
1
λD = √ (2)
8πλB INA
where NA is Avogadro’s number and ionic strength I is in units of mM. The parameter
λB is the Bjerrum length, the separation where the electrostatic interaction between
two charges is equal to kT :
e2
λB = (3)
4πǫ0 ǫr kT
Typically λB = 6.95Å at 27◦ C. The buffer ionic strength I = 12 Σρi zi2 where ρi is the
density of ion species i and zi is its valence. We will return to consider all the buffers we
used in our calculations below, as this is a crucial part of this problem and the viability
of any electrostatic detection experiment.
A key component of the electrostatics is that the path from an element dQ to the
nanotube segment at (0, 0, 0) in Fig. 1(b)is rarely entirely through buffer alone. Indeed,
for an element in the upper half of a microtubule, the direct path can pass from protein
to buffer, back to protein (lower half of microtubule), and then through buffer the rest
of the way to the nanotube (see, e.g., Fig. S4). A reader’s initial perception might be
that this should not be a major problem. After all, a common first year undergraduate
electrostatics problem is a capacitor with a multi-layer dielectric. The capacitor problem
is tractable because there are a pair of finite equipotentials with finite separation that
provide suitable boundary conditions. However, for the integration of point charges
that we do here, a change in material means that the boundary conditions, namely
V = ∞ at r = 0 and V = 0 at r = ∞, are no longer finite. This makes the change
of material analytically intractable. [40] That said, what we seek here is an estimate
rather than an exact result and there are two aspects that play to our favour – both are
reliant on the protein largely displacing the buffer in its vicinity. The first is that the
dielectric constant for protein ǫp is less than the dielectric constant for water ǫw . By
assuming ǫw over the entire path irrespective of material, our resulting potential V at
the nanotube will always be an under-estimate because the dielectric constant appears
in the denominator in Eqn. 1. In other words, the inability to deal with the dielectric
change means that any signal we measure should be somewhat larger than what we
calculate and so, in terms of determining detection threshold, gives us a significant
margin of safety. The second aspect is that Debye screening, as an exponential term, is
usually dominant. Thus the dielectric change is a secondary factor to the estimate as
long as the path length through the buffer is known so that the screening contribution is
accurate. This means a key component of our software is the geometric mapping of the
transition points between protein and buffer along the path between each dQ and the
nanotube – for actin there is only ever one but for microtubules there are often three.
This need for accuracy in path length components is another factor that motivated our
approach for this problem. We elaborate on the geometry and algorithm used for this
part of the analysis in the Supplementary Information (see Figs. S2-S4). The assumptionProspects for single-molecule electrostatic detection in molecular motor gliding motility assays7
that displacement of the buffer by the protein limits screening is justified further in our
discussion on the studies made by Choi et al. [27, 29] and the detection limit estimates.
A nice aspect of our situation above is that we now do not need to account for
the dielectric constant of the protein ǫp in the software at least; we do use it for the
detection limit estimates. This is fortunate because the magnitude of ǫp is a matter of
significant debate with suggested values that vary depending on the specific protein, its
structure and even the depth within it being considered. Ultimately, this means that
ǫp may not even be constant over the path segment inside the filament in our problem.
We have assumed ǫp = 5 as a compromise position from several references [41, 42, 43].
A final point regarding the modelling. More sophisticated 3D models of the overall
system and device might seem appealing, for example, electrostatics by finite element
analysis [44, 45] combined with transistor modelling by non-equilibrium Green’s function
approaches [46]. However, uncertainties in various aspects ranging from ǫp and buffers
to device layout and geometry might outweigh any gains arising from the increased
sophistication these models would provide, at least initially.
2.2.1. Buffer Solutions We consider a set of nine buffer solutions here, three for
actomyosin assays and six for kinesin-microtubule assays. The respective buffers, their
ionic strength and corresponding Debye length are presented in Table 1 (see also Fig. S5).
The incentive from a detection perspective is to maximise the Debye length to improve
the chances of detection. This has a natural limit because the motility assays fail if
the ionic strength becomes too low. We calculate buffer strength using the Henderson-
Hasselbalch equation for the dominant buffer components; the values may differ slightly
from some experimentally measured values [47] but the uncertainties here should not
substantially change our conclusions. The buffers a60 and BRB-80 are commonly used
buffers for actomyosin and kinesin, respectively, in the literature. They are the highest
ionic strength buffers considered. The two additional actomyosin buffers (a40 and a20)
give functional assays, whilst ionic strength much lower than a20 can result in rapidly
declining motile velocity [48, 49] and/or depolymerisation [50]. For kinesin, we consider
a lower ionic strength BRB buffer (BRB-20) as well as three imidazole-buffers (I50Mg05,
I50Mg05-2× and I50Mg05-3×) and one HEPES buffer, all of which still give reasonably
good motility in assays. More complete details of buffer ionic strength calculations
and experimentally determined buffer ionic strengths are given in the Supplementary
Information for completeness.
2.2.2. Filament parameters The remaining parameters in the model all relate to the
filaments themselves. Table 2 highlights the key parameters and the values used with
literature sources. The inner radius ir and outer radius or are straightforward. The
filament length l is taken as 1 µm for all calculations, noting that the filament length is
physically insignificant providing l >> λD . We included l in the code simply to test for
physically realistic outcomes in key limits, and to enable future consideration of short
filaments in very low ionic strength buffers.Prospects for single-molecule electrostatic detection in molecular motor gliding motility assays8
Buffer I (mM) λD (nm)
a60 51.06 1.36
BRB-80 106.76 0.94
a40 31.06 1.75
a20 11.06 2.93
BRB-20 29.69 1.79
I50Mg05 16.14 2.43
I50Mg05-2× 8.07 3.43
I50Mg05-3× 5.38 4.20
HEPES 6.23 3.90
Table 1. Ionic strength I and Debye length λD for the eight buffers considered in this
paper. The actomyosin assay buffers a60, a40 and a20 are 10 mM MOPS at pH 7.4
with 1 mM MgCl2 and 5, 25 or 45 mM KCl [16, 51]. The kinesin assay buffers BRB-80
and BRB-20 are 80 mM PIPES and 20 mM PIPES at pH 6.8 with 1 mM KCl and
1 mM EGTA [16]. The I50Mg05, I50Mg05-2× and I50Mg05-3× buffers are 50 mM
Imidazole buffers at pH 6.8 with 0.5 mM MgCl2 used direct, diluted 1 : 1 and diluted
1 : 2 in water, respectively [52]. The HEPES buffer is 5 mM HEPES at pH 7.2 with
0.25 mM EGTA, and 0.25 mM MgCl2 [52].
The challenging parameter is the charge per length λ for two reasons: a) we need
to account for counterion condensation as mentioned earlier, and b) literature values
can vary significantly. Actin filaments and microtubules, like DNA, are linear polyions.
Counterion condensation occurs when the charge per unit length λ becomes sufficient
that the charge spacing lcharge ∼ 1/λ exceeds the Bjerrum length λB , leading to a phase
transition where a fraction 1 − 1/Γ (with γ = λB /lcharge ) of the counterions ‘condense’
to form a layer of thickness RM (the Manning radius) surrounding the polyion [36, 37].
This reduces the polyion’s effective charge outside RM to less than the critical value,
i.e., lcharge < λB [36, 37]. The exact fraction condensed and hence the effective charge
of a polyion relative to its bare charge depends on details of the buffer solution, but
an effective rough approximation is to assume the effective charge is half of the bare
charge [53]. The crucial point here is that even when counterion condensation occurs, the
Debye-Hückel model [35] remains reasonably valid outside the counterion condensation
layer as long as the effective charge accounting for counterion screening is used [38].
This enables our model to remain valid as long as the filament-sensor separation gp
exceeds a few Bjerrum lengths (a few nm). In the instance where gp does become small,
the sensor sees more of the bare charge, so our model likely becomes an under-estimate
rather than an over-estimate of signal. The critical charge for counterion condensation
onto filaments is of order 1400 e/µm based on a Bjerrum length of 6.95Å, meaning
counterion condensation cannot be ignored for either actin or microtubules based on
the charge density values that follow.
Turning back to linear charge density values for our model, we will deal with
microtubules first as the literature is more substantive. The bare charge for tubulinProspects for single-molecule electrostatic detection in molecular motor gliding motility assays9
Parameter Actin Microtubules
ir 0 nm [61] 8.4 nm [62, 20]
or 2.5 nm [61] 12.5 nm [62, 20]
h 38 nm [32] 29.5 nm [33]
g 35.5 nm [32] 17 nm [33]
λ 37, 400 e/µm [20] 2, 000 e/µm
Table 2. Default filament parameters used in the calculations unless otherwise
specified. The parameters are inner radius ir , outer radius or , free height h, elevation
g and charge per length λ.
is 48 e/dimer [54] corresponding to a linear charge density of 84, 375 e/µm assuming
1750 dimers per 1 µm of microtubule [55]. The effective charge density is commonly
measured experimentally by electrophoresis with reported values ranging from ∼
0.5 e/µm [55] to ∼ 270 e/µm [56, 57] to > 30, 000 e/µm [58, 20]. van den Heuvel
et al. [20] explain the lower values as arising from assuming only hydrodynamic friction
and ignoring the retarding effect of the counterions. Notably, their measured value
of 37, 400 e/µm corresponds to 23 e/dimer, which is very close to 50% of the bare
charge [20]. We thus take this as our default linear charge density for microtubules for
this work.
Regarding the bare charge for actin, Tang & Janmey [59] have each actin monomer
as carrying 14 negative charges in vacuum, reducing to 11 per subunit on protonation of
His residues in H2 O, which gives 4070 e/µm assuming 370 monomers per µm. This value
is consistent with the 4000 e/µm given as a theoretical value in vacuum by Tuszynski et
al. [19]. Electrophoresis studies on actin are limited and none of them give a value for
the charge per length. However, Tang & Janmey [59] demonstrate counterion screening
at 40 − 80% level, depending on buffer conditions via actin bundle formation studies,
suggesting that an effective charge density of 2000 e/µm should be a reasonable default
value for this work. For completeness, we note a value of 16, 500 e/µm given by Cantiello
et al. [60], which appears at odds with the values above. We include this value in our
range when we study the influence of changing linear charge density in Fig. 4 and in the
Supplementary Information.
2.3. Detection Limit Estimate
Our detection limit estimates are based on studies of a single lysozyme molecule bound to
a single-wall carbon nanotube transistor by Choi et al. [27, 29]. We also made estimates
based on ssDNA melting studies using point-defect functionalized single-wall carbon
nanotube transistors by Sorgenfrei et al. [26, 28] for completeness; these are presented
in the Supplementary Information. Choi et al. study a T4 lysozyme molecule bound to
the nanotube via a pyrene-maleimide linker molecule attached to the C90 residue [27, 29].
Their buffer solution is 10 mM sodium phosphate buffer at pH 7.5 with 10 − 300 mMProspects for single-molecule electrostatic detection in molecular motor gliding motility assays10
Figure 2. Plots of voltage step ∆Vg vs pedestal height hp for actin (diamonds) and
microtubules (circles) for the nine buffers in Table 1. We focus on the full hp range
in (a) with a finer focus on the detection range for actin in (b) and microtubules in
(c). The dashed vertical lines indicate the natural elevation for microtubules (green -
g = 17 nm; denoted MT in (b)) and actin (blue - g = 35.5 nm; denoted A in (c)). The
horizontal dashed lines indicate detection limits and are labelled UB = upper bound
(192 mV), LB = lower bound (7.6 mV), C = Choi [29] experimental result (85 mV)
and S = Sorgenfrei [26] experimental result (10.7 mV). Instances in the green shaded
region between LB and UB are likely to be detectable, instances in the blue shaded
region above UB are highly likely to be detectable. Note that we ignore the surface
casein layer [66] used in microtubule assays in this calculation; this is dealt with in
Fig. 3.
NaCl. The corresponding Debye length ranges from 1.64 nm at 10 mM NaCl to 0.54 nm
at 300 mM NaCl with λD = 1.12 nm at the 50 mM NaCl concentration used in most
of the work (full details in the Supplementary Information). The key to our estimate
is the ability to establish the charged residue producing the signal. Choi et al. [29]
identify these as the K83 and R119 residues based on sequence/structure considerations
and studies using targeted mutation. Both residues are ∼ 1.5 nm away from the C90
residue where the few Å-long molecule binding the protein to the nanotube is attached.
We assume that the strongest gating occurs at the carbon nanotube attachment site.
This is partly due to proximity and partly because the π − π stacking at this site should
withdraw some carriers from conduction, increasing the local resistance and taking the
attachment site vicinity closer to full depletion [63, 27]. For purposes of this paper, we
assume the attachment point in Choi et al. [27, 29] corresponds to (0, 0, 0) in our model.
Lysozyme is a processive enzyme that catalyses cleavage of peptidoglycan substrate.Prospects for single-molecule electrostatic detection in molecular motor gliding motility assays11
The active site for catalysis is 3.1 nm from C90 and thus should be outside direct
detection range according to Choi et al. [29]. We do not disagree, but simply note
there is currently no definitive experimental evidence that solidly confirms or denies
this position. Instead, Choi et al. [29] suggest catalysis causes 0.15 nm movements
for the K83 and R119 residues relative to the attachment site [64, 29], which is the
asserted mechanism for their electrostatic detection. Note that these motions can be
detected individually for each residue via targeted mutation, and are still detected at
[NaCl] = 300 mM where λD = 0.54 nm [29]. We expect this ability to see charge
displacement at a range well beyond λD occurs because the protein displaces the buffer
solution between the K83 and R119 residues and the C90 attachment point. This
reduces both the screening and the intervening dielectric constant. It also motivates our
comment about not being able to definitively rule out seeing some small effect from the
catalytic site itself.
Considering this from a device context, the carbon nanotube transistor used by
Choi et al. [27, 29] experiences a shift in the location of nearby charged residues as an
effective gate voltage Vg , which causes a shift in the average measured drain current
ID as a function of time. The measured transconductance dID /dVBG local to the
operating point, obtained from a separate measurement of ID vs back-gate voltage
VBG (e.g., Fig. 1C in Ref. [27]), can be used to convert a change in average current
∆ID into an effective gate voltage change ∆Vg = ∆ID (dID /dVBG )−1 . The typical
transconductance can vary considerably between devices ranging from ∼ 25 nA/V in
Ref. [27] to ∼ 100 nA/V in Ref. [29]. Choi et al. [29] obtain the effective gate voltage
change ∆Vg that results by changing the net charge of the K83 and R119 residues by
targeted mutation using the average current and transconductance. In doing so they
obtain ∆Vg = 84 ± 2 mV/e. Considering this from the perspective of a simple point-
charge model is interesting. The targeted mutation is equivalent electrostatically to
adding/removing a charge e situated 1.5 nm from the C90 attachment point, which can
be estimated as:
e 1 −d/λD
∆VG = e (4)
4πǫ0 ǫr d
If we do this assuming ǫr = 80 (buffer) and λD = 0.54 nm, we obtain ∆Vg = 745 µV.
In contrast, if we assume ǫr = 5 (protein) and λD → ∞, we obtain ∆Vg = 192 mV. If we
further assume that a small amount of screening occurs over the length of the maleimide
moiety in the pyrene-maleimide linker, a distance of order 4.5 Å with λD = 0.54 nm,
then we obtain ∆Vg = 83 mV. This is very close to the experimental value obtained
by Choi et al. [29]. It is a notable outcome because it leads to two conclusions. First,
it confirms that screening only really occurs in the tiny gap between C90 and pyrene
attachment to the nanotube. This supports our earlier assertion that the direct line of
sight from K83 and R119 to C90 runs through the body of the protein, where water and
ions are largely excluded [65]. Second, it suggests that a simple electrostatic treatment
can give realistic order-of-magnitude estimates for real experimental signal.Prospects for single-molecule electrostatic detection in molecular motor gliding motility assays12
We now apply this analysis to the scenario in Ref. [27] to obtain a ‘detection
limit’ under the premise that this is one of the most sensitive carbon nanotube sensors
experimentally realised under conditions similar to those we would face in a motility
assay. To achieve this we calculate the change in potential that results for a singly
charged residue (either K83 or R119 but not both) moving by 0.15 nm at a distance of
1.5 nm from the C90 attachment point. If we assume ǫr = 5 over the entire distance,
since it is mostly filled with protein, this gives us an upper bound on detection limit of
∆Vg = 192 mV. We can also include a small screening contribution with λD = 0.54 nm
for the 4.5 Å maleimide moiety (see above), which gives a lower bound on detection
limit of ∆Vg = 7.6 mV. Note that these span the experimental estimate of 85 ± 2 mV
given by Choi et al. [29] We refer to upper and lower bounds here because the most
accurate answer would involve including the screening but having ǫr = 80 and not 5 over
the 4.5 Å linker molecule gap. However, dealing with this ǫr transition at the protein
edge is analytically intractable (see earlier). Physically, we know the increased ǫr would
act to slightly lessen the screening, giving a result somewhere between the bounds of
192 mV and 7.6 mV that we calculated above. Since our focus here is on mathematical
simplicity, we will continue just with the upper and lower bound estimates and the
experimental value from Choi et al. [29] in our results.
Finally, to corroborate these values, we also performed an estimate based on
the work by Sorgenfrei et al. [26, 28]. Full details are given in the Supplementary
information, but we estimate a detection limit of 10.7 mV for their device, which agrees
well with their own estimates of 5 − 11 mV [28].
3. Results
From this point onwards we focus entirely on the output of our electrostatic modelling
for actin filaments and microtubules. Figure 2 shows plots of effective transient gate
voltage step ∆Vg that we expect a passing filament to produce versus the height hp of the
pedestal that raises the carbon nanotube above the guiding channel floor. Figure 2(a)
covers the full range of hp for both filament types for a broader comparative picture.
Figures 2(b/c) present the same calculations with finer hp resolution and tighter focus
on the possible detection regime for actin (Fig. 2(b)) and microtubules (Fig. 2(c)). Data
for actin is presented as diamonds and microtubules as circles with colour assigned to
corresponding buffer composition. The horizontal dashed lines indicate detection limits
with labelling as designated in the figure caption. The background shading indicates
our expectation of the likelihood of electrostatic detection being viable, and ranges from
unlikely (white) to likely (green) and highly likely (blue). The vertical dashed lines
indicate the natural elevations for microtubules (green, marked MT) and actin (blue,
marked A). We limit our analysis to hp < g as a natural outcome of our assumption of
infinite persistence length (all parts of the filament are always at elevation g).
Looking at Fig. 2(a), there are two obvious behaviours in the data. The first is that
the signal ∆Vg strengthens as the carbon nanotube is raised closer to the filament. ThisProspects for single-molecule electrostatic detection in molecular motor gliding motility assays13
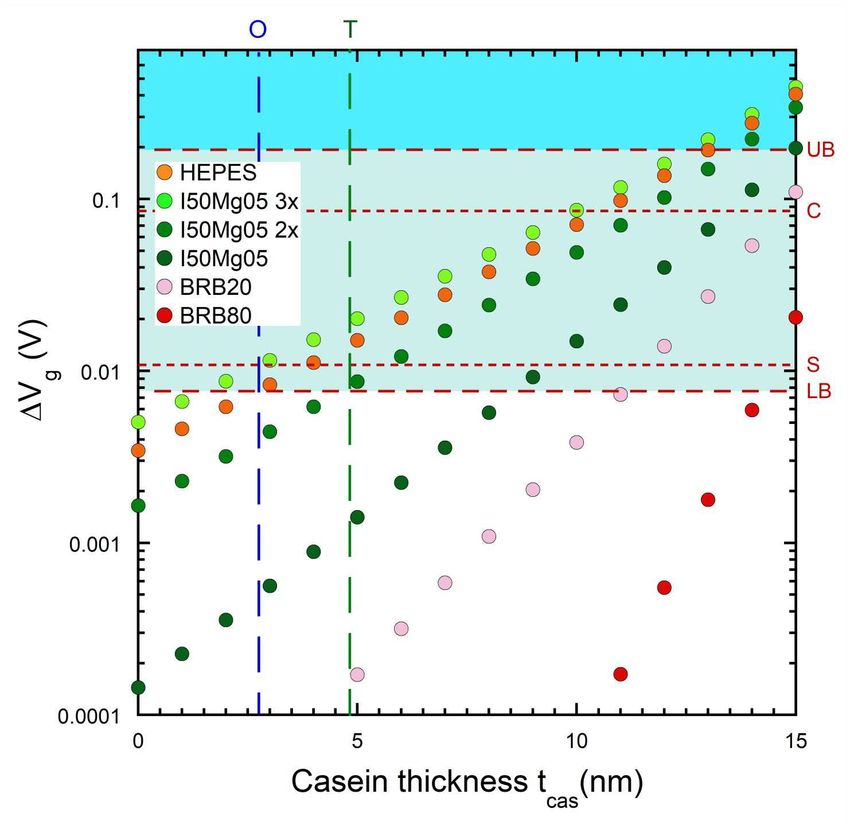
Figure 3. Voltage step ∆Vg vs casein layer thickness tcas for pedestal height hp = 0
for microtubules with the six relevant buffers in Table 1; there is no corresponding
layer in an actin motility assay. The dashed vertical lines indicate the effective fully-
screening casein thickness corresponding to the measured details of β-casein-on-SiO2
layers obtained by Tiberg et al. [72] using neutron reflectometry (green and denoted
T; tcas = 4.8 nm) and Ozeki et al. [73] (blue and denoted O; tcas = 2.75 nm) using
quartz crystal microbalance studies. We extend the tcas axis to 15 nm to cover the
maximal thickness given by Verma et al. [67], which is a very optimistic upper-bound
as discussed in the text. The horizontal dashed lines indicate detection limits and are
labelled UB = upper bound, LB = lower bound, C = Choi [29] experimental result and
S = Sorgenfrei [26] experimental result. Instances in the green shaded region between
LB and UB are likely to be detectable, instances in the blue shaded region above UB
are highly likely to be detectable.
is a natural consequence of reduced distance d between the charge elements dQ and the
point of action (0, 0, 0) via Eqn. 1. The second is that ∆Vg at a given hp increases as
the buffer ionic strength is reduced, arising from the λD contribution to Eqn. 1. The
slope ∆Vg /hp also decreases with reduced ionic strength, however, slope is a deceptive
concept here due to the logarithmic axis for ∆Vg . Note that even with the logarithmic
axis, the ∆Vg versus hp is not truly linear in these plots because there is a 1/d2 Coulomb
term in addition to the exponential Debye screening contribution, i.e., the data curves
gently even with the log axis for ∆Vg . Care needs to be taken with linear extrapolation
for data presented as we have it in Fig. 2.
Regarding detection prospects, we start by considering actin filaments and return
to microtubules afterwards. The data in Fig. 2 makes it clear that detection of actin is
impossible without the nanotube on a pedestal of at least hp = 30 nm. Improvement
in detection prospects can be achieved by reducing buffer ionic strength – the stronger
improvement in moving from a40 to a20 compared to moving from a60 to a40 in Fig. 2(b)Prospects for single-molecule electrostatic detection in molecular motor gliding motility assays14
√
arises from λD ∼ 1/ I, as is visually evident in Fig. S5. However, there is a limit to
reducing ionic strength due to the biochemical reasons outlined earlier. Thus there is no
escaping the need for a pedestal, and the associated fabrication challenges in achieving
it, for detecting passing actin filaments at the charge density expected based on the
literature [59, 19]. We explore the effects of increasing the filament charge density later
in the paper.
Turning to microtubules, there are three notable aspects compared to actin that are
vital to the discussion. First, microtubules travel closer to the guiding channel floor, i.e.,
have lower g, which means our scope for possible detection without a pedestal structure,
i.e., with hp = 0, is substantially improved. Second, the charge density for microtubules
is an order of magnitude higher. Thirdly, an important aspect of microtubule assays
that we have so far ignored is the use of a casein coating on the substrate [66]. The casein
layer serves to anchor the kinesin tail and position the kinesin head to better interact
with microtubules [67, 68]. Actin assays have no corresponding layer; the myosin tails
bind directly to the silanized SiO2 surface [51]. The data in Fig. 2 ignores the casein
layer, enabling us to make a more direct comparison with actin purely on the basis of
elevation, charge density and buffer ionic strength. We will add the casein layer for
microtubules to our model momentarily (Fig. 3).
The data in Fig. 2 with a bare SiO2 surface for both filament types also points to
the need to raise the nanotube on a pedestal for microtubules, albeit to a much lesser
extent. For the commonly used PIPES buffers BRB-80 and BRB-20, a pedestal with
hp = 13−16 nm would be required. In contrast, the imidazole and HEPES buffer results,
particularly for I50Mg05-3× and HEPES are such that one could potentially imagine
detection occurring without a pedestal at all, e.g., due to fluctuations arising from finite
persistence length. Thus before we even consider the casein layer, microtubules have
an obvious advantage from a device fabrication perspective owing to charge density and
buffer ionic strength range alone.
Adding the casein layer to our model is relatively straightforward and we use an
approach similar to how we deal with exclusion of the buffer by the body of the filament
itself. We consider the casein layer to have thickness tcas , and use geometric arguments
(see Fig. S3/4) to work out what this corresponds to as a path length dcas on the direct
line from dQ to the point of action (0, 0, 0). We then switch the screening term off
for that segment of the path, as we do with the segment passing through the body
of the filament. Note that this results in a slight underestimate of signal because we
cannot account for the change in dielectric strength for reasons described earlier. The
greater challenge is working out a meaningful value to assign for tcas . Whole casein
is a mixture of four casein sub-groups – αs1 , αs2 , β and κ – in proportions that vary
based on species of origin and processing [69]. The composition of the surface-adsorbed
casein layer for a microtubule assay can vary and has a significant effect on microtubule
binding [67] and motility [70], yet is rarely precisely specified/known for many assays in
the literature (e.g., often non-specific descriptors like ‘casein-containing buffer’ appear
in literature protocols). Of the four caseins, only β-casein is well characterized in termsProspects for single-molecule electrostatic detection in molecular motor gliding motility assays15
Figure 4. (a) Pedestal height hp required to achieve a voltage step ∆Vg exceeding the
lower bound for detection (LB in Fig. 2(a)) as a function of filament charge density λ
for actin (a20 buffer, blue diamonds, top axis) and microtubules (I50Mg05-3× buffer
and no casein layer, green circles, bottom axis). The vertical dashed lines indicate
the default charge density for actin (blue - 2000 e/µm) and microtubules (green -
37, 400 e/µm). The vertical dotted lines indicate other notable charge density values
with the actin value obtained by Cantiello et al. [60] (blue - 16, 500 e/µm) and the
microtubule value obtained by Stracke et al. [56] and Kim et al. [57] (green - 270 e/µm).
(b) Casein thickness tcas required to achieve a voltage step ∆Vg exceeding the lower
bound for detection (LB in Fig. 3) with no pedestal hp = 0 for microtubules for the six
associated buffers in Table 1. The dashed horizontal lines indicate the effective fully-
screening casein thickness corresponding to the measured details of β-casein-on-SiO2
layers obtained by Tiberg et al. [72] using neutron reflectometry (green and denoted
T; tcas = 4.8 nm) and Ozeki et al. [73] (blue and denoted O; tcas = 2.75 nm) using
quartz crystal microbalance studies.
of formation of a layer on solid surfaces. Our view of the literature is that there
is general agreement that β-casein forms a bilayer on a hydrophilic surface such as
SiO2 . β-casein is amphiphilic [69] and the bilayer forms as a two-step process: a) first
the hydrophilic domain adsorbs to the SiO2 surface giving a tightly-packed monolayer
presenting a hydrophobic outer surface, then b) a second loosely-packed monolayer
forms as hydrophobic domains adsorb to the monolayer presenting a hydrophilic outer
surface for the final bilayer [67, 71, 72, 73]. The disagreement in the literature is more
related to the thickness and packing density for the β-casein bilayer. Verma et al. [67]
point to Nylander et al. [71] as evidence for tcas = 15 nm. However, that measurement
is obtained by compressive force measurements between a pair of β-casein bilayers on
opposing hydrophilic surfaces [71]. As such, it detects the maximal steric extent ofProspects for single-molecule electrostatic detection in molecular motor gliding motility assays16
the bilayer, and given the looser packing of the outer monolayer and its hydrophilicity,
assuming full suppression of screening over 15 nm is probably an over-estimate. We thus
consider this an absolute upper-bound on our calculations, setting the plotted range in
Fig. 3. Most papers on β-casein layers suggest tcas for our estimate should be smaller.
Tiberg et al. [72] report neutron reflectometry data for β-casein on SiO2 and suggest the
bilayer is best modelled as a trilayer with a) 3 nm thickness at 63% volume fraction, b)
3.5 nm thickness at 51% volume fraction and c) 4.0 nm thickness at 28% volume fraction.
We treat this as an effective fully non-screening layer of thickness 4.8 nm for simplicity.
Ozeki et al. [73] report quartz crystal microbalance (QCM) measurements for β-casein
on a SiO2 -functionalized QCM crystal and suggest an inner layer of 2.1 nm thickness
with a density of 279 ng/cm2 and an outer layer that is either 1/3 of the thickness at
the same density or 1/3 of the density at the same thickness. As an effective single
non-screening layer the corresponding thickness would be 2.75 nm.
In Figure 3, we plot ∆Vg versus the casein thickness tcas (fully non-screening)
assuming a pedestal height hp = 0. In other words, we focus on the question of how
thick the casein layer needs to be to achieve detection without needing a pedestal at all.
We run the model out to tcas = 15 nm to allow Verma et al. [67] as a very optimistic
upper-bound. We indicate the more realistic scenarios in Ozeki et al. [73] (effective
tcas = 2.75 nm) and Tiberg et al. [72] (effective tcas = 4.8 nm) with blue and green
dashed vertical lines respectively. The ∆Vg for the I50Mg05-3× buffer is very close to
the lower-bound detection limit at the tcas ∼ 2.5 − 5 nm range corresponding to the
realistic effective tcas thickness [72, 73] that one might expect using purely β-casein.
The HEPES and I50Mg05-2× buffer results are also reasonably close to the detection
limit in this range.
However, β-casein is only a small part of a larger picture. We focus on it in Fig. 3
because it is the only casein sub-group that is well characterised as an adsorbed film on
SiO2 in terms of thickness and volume fraction. Maloney et al. [70] performed studies of
microtubule motility in assays using pure β-casein surface passivation and found a) few
motile filaments, b) that the filaments that were motile tended to be quite long, and c)
weaker attachment at the ends of the microtubule, which led to poor tracking and a short
time before microtubules detached and floated away. They instead found that whole
casein (49% α, 37% β, 14% κ) was a much better option, supporting stable motility for
a wide range of filament lengths with good filament velocity and reproducibility, with
pure α-casein performing nearly as well [70]. The thickness and volume fraction for α-
casein and whole casein passivation layers on SiO2 is not presently available, but if they
increase the effective thickness of the casein layer from a buffer displacement perspective
without increasing the filament elevation, i.e., move us further to the right of the two
scenarios in Fig. 3, then the prospects of electrostatic detection of microtubules with
hp = 0 only improve. Given this, we suggest a characterisation of whole casein and
α-casein on SiO2 using neutron reflectometry or QCM studies would be a worthwhile
endeavour.
Before moving on, we make three final observations regarding casein passivation.Prospects for single-molecule electrostatic detection in molecular motor gliding motility assays17
First, β-casein has a net negative charge of −7.5 e/molecule at pH 6 − 7 [74]; the other
caseins are likely also charged. This charge would cause an offset in the transistor’s
maximum sensitivity point (i.e., peak transconductance), which would need to be
corrected by applying a back-gate voltage VBG . It is presently unclear whether the
required VBG would: a) be within the available range for nanotube transistors, as too
high a VBG leads to dielectric breakdown of the SiO2 layer, destroying the device, or b) is
compatible with retaining casein adsorption, kinesin binding and microtubule motility.
The former could be established simply by comparing nanotube transistors before/after
casein passivation, without the need for other structures, e.g., guiding channels, or a
full motility assay. The latter is readily testable without the carbon nanotube device
structure. Both would be worthwhile experiments in their own right. We note that
relatively strong transverse electric fields (10 − 100 kV/m) were not a significant issue
for microtubule gliding assays [21], so there may well not be major problems with the
vertical electric fields associated with gate-tuning of the nanotube transistor either.
Second, carbon nanotubes are generally [75] hydrophobic [76] and casein will bind with
its hydrophilic domains down against the SiO2 substrate. This means there is some
chance the casein layer is affected/interrupted local to the nanotube, e.g., incomplete,
thinner than usual, etc. We would not immediately expect this to affect motility, but it
might mean that the screening is slightly stronger than expected based on Fig. 3. Some
focussed studies might also be required to establish this in an experimental context.
Third, one could ask why a similar strategy could not be used to improve the prospects
for actomyosin assays. A critical feature of why casein works in the microtubule assay is
that the kinesin tails bind to the lower half of the casein bilayer with the kinesin heads
positioned just above the casein bilayer surface [67, 68]. The crucial aspect for this work
is that the addition of this layer does not increase filament elevation g; simply putting
in an underlayer that coats the nanotube but at the same time increases g will not
have the same effect in terms of reduced screening. We know of no such layer presently
available for actomyosin assays.
As a last consideration in this paper, we turn to the possibility of varying the
charge of the filaments used in motility assays. This could be due to uncertainty in
the filament charge or it could be part of a deliberate charge-enhancement strategy,
e.g., by binding short-strand DNA to the outside of a microtubule [77, 78]. Figure 4(a)
shows a plot of the pedestal height required to reach the detection limit, i.e., ∆Vg at
the lower-bound (LB), versus the linear charge density λ on the filament in e/µm. The
data presented is for the lowest ionic strength buffers, a20 for actin and I50Mg05-3× for
microtubules, in the latter case without the casein layer. The default charge densities
are indicated by vertical dashed lines (blue for actin/green for microtubules) with two
notable values from earlier discussion, namely 16, 500 e/µm for actin [60] and 270 e/µm
for microtubules [56, 57], indicated by vertical dotted lines as points of note (see also
Fig. S6/S7 for underlying data). For actin, increasing the charge only really reduces
hp . Rather extreme amounts of added charge would be needed to eliminate the pedestal
entirely. In contrast, for microtubules, only a 33% increase in λ is required to achieveProspects for single-molecule electrostatic detection in molecular motor gliding motility assays18
detection with hp = 0 before we even consider the casein layer. We add the casein
layer to our consideration in Fig. 4(b)and focus on the tcas required to achieve the
detection limit with hp = 0 for all six buffers used for microtubule assays. Decreasing
the ionic strength too much can lead to poor motility, so knowledge of the highest ionic
strength buffer viable for detection is useful. Our data in Fig. 3(b) already showed that
microtubules should be observable for the I50Mg05-3× buffer at hp = 0 and the data
in Fig. 4(b) confirms that the charge density would need to be less than 1/3 of that
measured by van den Heuvel et al. [20] to not be detectable. A similar situation holds
for the HEPES and I50Mg05-2× buffers, however increasing the charge density would
certainly help. For the undiluted I50Mg05 buffer, λ would need to increase by a factor of
5 − 10 but might be within reasonable possibility. In contrast the PIPES buffers, BRB-
80 and BRB-20 are still a long way from detectability even with large increases in λ
unless a commensurate improvement in the density/thickness of the casein layer can be
obtained somehow. Ultimately, the data in Figs. 3 and 4 convinces us that the prospects
for electrostatic detection using microtubules are strong with the carbon nanotube on
the guiding channel floor (hp = 0) providing lower ionic strength buffers than those
commonly used for microtubule assays, i.e., BRB-80 and BRB-20, are deployed. The
prospects can be further improved if the effective thickness/density of the casein layer
can be improved and the microtubule charge can be increased slightly using an approach
similar to that demonstrated by Isozaki et al. [77, 78] and further work in those two
directions is also encouraged.
Finally, we note two aspects that we have not accounted for in our calculations
that might improve the detection prospects slightly for both assay types. The first is the
finite persistence length of the filaments and thermal fluctuations. These lead to vertical
movement of the filament segments between attachments to surface-bound motors. This
effect can be enhanced by reducing the bound motor density on the substrate [79]. The
second is that we have neglected the nanotube diameter, which at 1 − 2 nm is already
25 − 50% of the small pedestal height (hp = 4 nm) required for microtubules when the
casein layer was not taken into account. It would slightly improve detection prospects
beyond our estimates for hp = 0 when the casein layer is accounted for. This second
contribution will be much less substantial for actin.
4. Conclusions
We have addressed the prospects for electrostatic detection of passing actin filaments
and microtubules in a molecular motor motility assay by combining a basic electrostatic
model for determining the effective gate potential at a carbon nanotube transistor
due to a filament overhead with realistic detection scenarios from recent state-of-the-
art nanotube transistor sensors [26, 27]. On a bare consideration of magnitudes, we
suggest that both actin and microtubules are likely detectable electrostatically in a
device context with sufficient effort. Actin requires the carbon nanotube to be raised
on a pedestal of height 28 − 33 nm above the guiding channel floor depending onProspects for single-molecule electrostatic detection in molecular motor gliding motility assays19
buffer ionic strength; a possible fabrication route for achieving this is given in the
Supplementary Information. Microtubules carry three distinct advantages that make
them a much better prospect for electrostatic detection: a) higher charge density, b)
lower natural travel elevation, and c) the presence of a casein passivation layer [66], which
incorporates/supports the kinesin and partially displaces buffer without changing the
microtubule elevation. In contrast, for an actomyosin assay, the myosin molecules are
bound directly to a silanized-SiO2 surface with no equivalent to the casein passivation
layer [51]. We suggest microtubules are likely detectable without the nanotube on
a pedestal for the lowest ionic strength buffers when the casein passivation layer is
accounted for. Another aspect that might improve detection prospects is increasing the
charge density of the filament. Surface charge density modification for microtubules
using short-strand DNA has already been demonstrated [77, 78] and might be fruitful
towards electrostatic detection.
Our results suggest that attempts at electrostatic detection would have a greater
likelihood of success if focussed on kinesin/microtubules. Low ionic strength buffers, e.g.,
imidazole or HEPES, should be used rather than higher ionic strength PIPES buffers,
e.g., BRB-80, and the casein layer should be prepared to optimise its thickness and
volume fraction as much as possible to reduce screening contributions. Some obvious
experiments that our work here also points to are a more detailed characterisation
of the structural aspects, e.g., thickness and volume fraction, of α-casein and whole
casein passivation layers on SiO2 to facilitate comparison with β-casein-on-SiO2 , which
is better characterised [72, 73] but less suited for motility assay performance [70].
Studies of how casein passivation shifts the gate threshold voltage in carbon nanotube
transistors and how motility depends on the back-gate voltage for an assay structure
with an incorporated back-gate, e.g., SiO2 -on-n+ -Si, would also be useful towards further
development of devices for electrostatic detection of filaments in gliding motility assays.
5. Acknowledgements
This work was funded by the Australian Research Council (ARC) under DP170104024
and DP210102085, the Volkswagen Foundation and the European Union’s Horizon
2020 Programme under grant agreement No. 732482 (Bio4Comp). A.P.M. was a
Japan Society for the Promotion of Science (JSPS) Long-term Invitational Fellow
during the drafting of this manuscript. The process development work reported in
the Supplementary Information was performed using the NSW node of the Australian
National Fabrication Facility (ANFF). We gratefully acknowledge helpful discussions
with Paul Curmi, Mercy Lard, Lawrence Lee, Frida Lindberg and Cordula Reuther in
the course of this work.
6. References
[1] M.G.L. van den Heuvel & C. Dekker, ‘Motor proteins at work for nanotechnology’, Science 317,
333-336 (2007).You can also read