Climate controls on C3 vs. C4 productivity in North American grasslands from carbon isotope composition of soil organic matter
←
→
Page content transcription
If your browser does not render page correctly, please read the page content below
Global Change Biology (2008) 14, 1–15, doi: 10.1111/j.1365-2486.2008.01552.x

Climate controls on C3 vs. C4 productivity in North
American grasslands from carbon isotope composition
of soil organic matter
J O S E P H C . V O N F I S C H E R *, L A R R Y L . T I E S Z E N w and D AV I D S . S C H I M E L z
*Department of Biology, Colorado State University, Ft. Collins, CO 80523, USA, wUS Geological Survey, Center for Earth Resources
Observation and Science (EROS), Mundt Federal Facility, Sioux Falls, SD 57198, USA, zNational Center for Atmospheric Research,
Climate and Global Dynamics Division, PO Box 3000, Boulder, CO 80305, USA

             Abstract
             We analyzed the d13C of soil organic matter (SOM) and fine roots from 55 native
             grassland sites widely distributed across the US and Canadian Great Plains to examine
             the relative production of C3 vs. C4 plants (hereafter %C4) at the continental scale. Our
             climate vs. %C4 results agreed well with North American field studies on %C4, but
             showed bias with respect to %C4 from a US vegetation database (STATSGO) and weak
             agreement with a physiologically based prediction that depends on crossover tempera-
             ture. Although monthly average temperatures have been used in many studies to predict
             %C4, our analysis shows that high temperatures are better predictors of %C4. In
             particular, we found that July climate (average of daily high temperature and month’s
             total rainfall) predicted %C4 better than other months, seasons or annual averages,
             suggesting that the outcome of competition between C3 and C4 plants in North American
             grasslands was particularly sensitive to climate during this narrow window of time. Root
             d13C increased about 1% between the A and B horizon, suggesting that C4 roots become
             relatively more common than C3 roots with depth. These differences in depth distribu-
             tion likely contribute to the isotopic enrichment with depth in SOM where both C3 and
             C4 grasses are present.
             Keywords: carbon, climate, competition, C3, C4, isotope, photosynthesis, precipitation, soil, temperature

             Received 22 August 2006; revised version received 6 July 2007 and accepted 26 July 2007

Introduction                                                        including fire and grazing (Ojima et al., 1994), soil
                                                                    nutrient status (Barnes et al., 1983; Wedin & Tilman,
The grass communities on the Great Plains are domi-
                                                                    1990), topography (Barnes et al., 1983), water (Knapp &
nated by C3 grasses in the north, grading to C4 dom-
                                                                    Medina, 1999) and soil texture (Archer, 1984; Epstein
inance in the south (Sage et al., 1999). In their influential
                                                                    et al., 1997). However, the importance of these factors is
study of North American grassland ecology, Teeri &
                                                                    consistently secondary to temperature and often local
Stowe (1976) found that most of the variability in the
                                                                    and site specific (Sage et al., 1999).
fraction of local species that are either C3 or C4 (i.e.
                                                                       The strength of temperature for controlling the out-
floristic abundance) was correlated with growing sea-
                                                                    come of C3 vs. C4 competition has been interpreted
son temperatures. Similarly, Paruelo & Lauenroth (1996)
                                                                    primarily in light of photorespiration (Sage & Monson,
found that temperature was the primary control of the
                                                                    1999), a pathway of carbon loss that is sensitive to
relative aboveground productivity of C3 vs. C4 plants,
                                                                    temperature and important only in C3 plants. In photo-
while the magnitude of precipitation and the propor-
                                                                    respiration, the enzyme rubisco catalyzes the reaction of
tion of precipitation that fell in summertime explained
                                                                    ribulose bisphosphate with O2 instead of CO2, and the
small but significant components of the variance. A
                                                                    oxidation/carboxylation ratio for this enzyme increases
number of additional factors have been found to mod-
                                                                    with temperature (Brooks & Farquhar, 1985). Because
ulate the effects of temperature on C3 vs. C4 activity,
                                                                    the physiological mechanisms that limit photorespira-
Correspondence: Joe C. von Fischer, tel. 11 970 491 2679,           tion in C4 grasses also impose a cost for rates of net
fax 11 970 491 0649, e-mail: jcvf@mail.colostate.edu                assimilation, C3 grasses have greater net assimilation
r 2008 The Authors
Journal compilation r 2008 Blackwell Publishing Ltd                                                                           1
2 J. C. VON F I S C H E R et al.
(and thus a competitive advantage) only at cooler in the North American Great Plains will primarily
temperatures where photorespiration losses are low, reflect the relative productivity of C3 vs. C4 plants, with
while C4 grasses have greater net assimilation at higher particular sensitivity to belowground production. De-
temperatures (Sage & Monson, 1999). spite the promise of this approach, a number of factors
Physiological models of leaves at modern CO2 levels could obscure the direct interpretation of carbon iso-
have been used to quantify the relationship between topes for %C4: the isotopic compositions of the C3 and
temperature and net carbon assimilation rates. These C4 end members may vary (e.g. Johnson et al., 1990;
models predict that the C3 vs. C4 crossover temperature Weiguo et al., 2005), C3 and C4 grasses may system-
(i.e. the temperature above which C4 plants have higher atically differ in their belowground allocation of carbon
net assimilation rates than C3 plants) is approximately (Fargione & Tilman, 2005), decomposition of biomass or
22 1C (Ehleringer et al., 1997; Collatz et al., 1998). Appli- biochemical components may be unequal between the
cation of these models has allowed regional and global types, leading to selective preservation of material in
predictions of the spatial and interannual patterns in C3 the SOM pool (Gleixner et al., 1999; Fernandez et al.,
vs. C4 productivity (Collatz et al., 1998). It is important 2003; Hobbie & Werner, 2004), and/or isotopic fractio-
to understand the controls on C3 vs. C4 productivity in nation may alter the d13C as plant material becomes
North American grasslands because this balance forms SOM (Wedin et al., 1995).
the basis of diverse ecological studies ranging from the To evaluate the fidelity of the SOM isotopic composi-
global carbon cycle (Still et al., 2003a; Suits et al., 2005; tion as a record of %C4, we compare the %C4 that we
Zhou et al., 2005) to isotopic studies of bird migrations interpret from SOM and root isotopes to the %C4
(Hobson, 2005). predicted by Paruelo & Lauenroth (1996), and to
Despite the sound principles and success of physio- vegetation productivity information in a soil database
logical models for predicting C3 vs. C4 productivity, our (STATSGO) and predictions from a crossover-temperature
understanding of this climate–biology relationship re- approach applied by Collatz et al. (1998). We also
mains incomplete. For example, it is not clear how to identify isotopic patterns within the study sites and
apply the crossover temperature principle given that examine mechanisms that may drive these patterns.
daily growing season temperatures in C3-dominated In addition to generating improved understanding of
areas may regularly cycle above and below 22 1C. climate controls on grassland ecology, we anticipate that
Similarly, the ecological significance of monthly, sea- this, the first systematic soil isotope investigation of the
sonally or annually averaged temperatures is obscured North American Great Plains, will be useful for studies
by the differing phenologies of C3 and C4 plants (Wil- of regional and global carbon cycles, and for paleocli-
liams, 1974; Dickinson & Dodd, 1976; Ode et al., 1980). mate studies on the variation in atmospheric or organic
In addition, C4 grasses appear to be detrimentally reservoirs of 13C. Although latitudinal distributions of
affected by cool temperatures during development the d13C of A-horizon SOM have been presented in
(Haldimann, 1999; Pittermann & Sage, 2000), likely prior publications (Tieszen et al., 1997; Nordt et al.,
due to limiting rubisco content (Kubien & Sage, 2004). 2007), there has been no systematic examination of the
We anticipate that a more detailed examination of the patterns in the data or their underlying controls.
relationship between climate and C3 vs. C4 production
may yield insights into the physiological and ecological
Methods
processes that influence the relative performance of C3
and C4 plants, and perhaps help constrain the effects of We selected study sites that contained native prairie
future climate on the C3/C4 composition of grasslands. systems with intact floristic composition and no records
In order to help clarify the regional-scale climate of intensive agricultural management other than hay-
controls on the percentage of production by C3 vs. C4 ing, burning or grazing. We assumed that these prac-
plants (hereafter %C4) in the North American grass- tices did not substantially alter the plant community
lands, we have characterized the carbon isotope com- composition. The sites were located from south Texas in
position of fine roots and soil organic matter (SOM) the United States to Saskatoon, Canada and from the
from native prairie relicts across the US and Canadian eastern edge of the tallgrass prairie in Iowa and Min-
Great Plains. Use of stable isotopes to determine the nesota to the western edge of the shortgrass prairie in
relative productivity is possible because C3 and C4 Colorado and New Mexico. Most sites were protected
grasses differ in their d13C (Cerling et al., 1997). Sage by the nature conservancy, state or national parks, or
et al. (1999) concluded that the d13C of SOM is preferred long-term ecological research sites. The nature of the
over aboveground metrics of %C4 because SOM inte- prairie relict dictated sampling strategy; however, in all
grates carbon inputs over many years (Tieszen & cases we defined relatively flat, upland sampling areas
Archer, 1990). Thus, we expect that the d13C of SOM that were free of exotics and representative of the
r 2008 The Authors
Journal compilation r 2008 Blackwell Publishing Ltd, Global Change Biology, doi: 10.1111/j.1365-2486.2008.01552.xC L I M AT E C O N T R O L O F C 3 V S . C 4 P R O D U C T I V I T Y 3
specific relict. All soils were collected in summer, be- every 10 samples and the reference gas was calibrated
tween 1989 and 1994. frequently with materials from the National Bureau of
Four to six quadrats (1 m2) were selected as replicates Standards and other interlaboratory standards. Preci-
to characterize each site. Two to four cores were taken sion for carbon, including independent combustion of
from each quadrat with a 5 cm diameter hydraulically samples, is better than 0.2%. Isotope ratios are ex-
driven corer where possible, or a 2.5 cm hand driven pressed as a d13C value with respect to the PDB stan-
hammer to a depth between 60 and 100 cm. Each core dard (std) where
was divided along horizon boundaries (3–5 depths per
core, depending on how local soil horizons had devel- 13
C=12 C sample 13
C=12 C std
13
oped) immediately or within 48 h, and samples were d C¼ 1000:
ð13 C=12 CÞstd
pooled within each quadrat by horizon. Roots were
manually picked from the pooled samples as they air
dried within 48 h after collection. Because each soil We report the mean soil d13C value (and standard
sample contained a large number of fine roots, the fine deviation) for each depth increment as the average of
roots (o2 mm) had potential to record the integrated that depth from all plots in a site. In cases where the A
average carbon isotope composition of the current and B soil horizons were subdivided, we report the
vegetation. We, therefore, excluded the occasional large average d13C of A subhorizons and B subhorizons.
roots (42 mm) that we encountered, because they These averages were not weighted by bulk density or
would disproportionately contribute and potentially carbon content.
skew the isotopic composition of the root pool for a From isotope values of SOM, we calculate the %C4 as
given sample. We did not discriminate live from dead the percentage of carbon derived from C4 sources. This
roots; we assume that live and dead roots do not have calculation is made from a two end-member mixing
significantly different isotope composition and so the model, assuming that the d13C of C3 plant material is
collective root pool indicates current belowground pro- 26.7% and C4 material is 12.5% (Cerling et al., 1997).
duction of C3 vs. C4 plants. In the A-horizon SOM, fractionation appears to have
Soil texture was determined on small sample sizes by caused 1% enrichment of the SOM relative to vegetation.
a modification of the standard hydrometric methods To calculate %C4 for this material, we assume that both
(Elliot et al., 1999). The small sample method used low- the C3 and C4 end members are enriched equally to
volume settling tubes and small hydrometers designed 25.7% and 11.5%, respectively. The %C4 determined
for densiometric measurements and allowed analyses from the d13C of A-horizon SOM and A-horizon roots are
on representative subsamples of 5–10 g, in contrast to referred to as %C4 A-SOM and %C4 A-roots, respectively. We
the standard 40 g requirement. did not calculate %C4 from B-horizon SOM or roots.
Soil subsamples for SOM isotope analyses and all During data analysis, we identified some sites with
roots were examined for carbonates by watching for evidence of recent vegetation change as indicated by
effervescence in soil samples in 0.5 N HCl under va- highly unusual isotope profiles, so we excluded these
cuum. Carbonates were removed by mixing in HCl sites from further analyses. We also excluded sites
until effervescence ceased, soils were centrifuged at where sample handling or data processing errors left
12 000 g, resuspended in distilled water and recentri- only a small number of cores (no3 pairs of cores). These
fuged, dried at 105 1C and pulverized. This treatment exclusions reduced the number of sites as compared
has been found to impart no measurable effect on SOM with those analyzed in Tieszen et al. (1997) to 55; we do
isotopic composition (Torn et al., 2002). Samples suffi- not present data from the excluded sites anywhere in
cient to provide 40.02 mL CO2 were dried, loaded into this paper. Owing to sample handling errors, the root
tin combustion cups, combusted in a Carlo Erba CHN materials for some sites were lost, thus reducing the
analyzer (Thermo Fisher Scientific, Waltham, MA, USA) number of root results. Finally, statistical analysis sup-
that included gas chromatographic measurement of ported exclusion of the Stavely, Alberta site as an out-
CO2 and N2 to quantify SOM C and N content. Internal lier; analyses presented in this paper do not include
standards were run with each batch of samples and results from that site.
blind replicates were included to monitor consistency.
Combustion products from the Carlo Erba were
Climate data
transferred in a helium carrier, dried with magnesium
perchlorate, automatically trapped cryogenically on a To our knowledge, there is not a consistently interpo-
triple-trap of a SIRA 10 isotope ratio mass spectrometer lated climate database for the US and Canadian parts of
(VG Instruments, Manchester, UK), and analyzed for the Great Plains that will allow climate characterization
isotope ratios. Laboratory standards were run with of our study sites, many of which lie far from climate
r 2008 The Authors
Journal compilation r 2008 Blackwell Publishing Ltd, Global Change Biology, doi: 10.1111/j.1365-2486.2008.01552.x4 J. C. VON F I S C H E R et al.
stations and some of which lie near the US–Canadian Table 1 The climate variables used in this study and their
border. To construct the needed climate database, we abbreviations
obtained climate data for the United States by directly
Climate variable Time period
contacting data managers at Regional Climate Centers.
Canadian climate data were obtained from the Meteor- Daily high temperature (1C) Year
ological Service of Canada (2004). Table 1 lists and April
describes the climate and other factors considered in May
our analyses. June
The data from 163 climate stations represented daily July
values for the period 1961–1990. The daily values were August
averaged into monthly mean values. Data from some April–July (AMJJ)
May–July (MJJ)
US climate centers and from Canada (13 and five sites,
April–August (AMJJA)
respectively) were only available in monthly values and
Daily low temperature (1C) Year
represent mean values for periods of at least 30 years April
ending no later than 1990. All monthly values were then May
entered into a database along with the latitude and June
longitude of each weather reporting station and each July
soil-sampling site. Surfaces III, a statistical gridding and August
mapping program, was used to krig and then map the April–July (AMJJ)
contour lines of each climatic variable. We overlaid the May–July (MJJ)
positions of the soil sampling sites on the kriged map to April–August (AMJJA)
determine the value of the climatic variable for each Daily average temperature (1C) Year
April
site. Comparison between observed and krig-predicted
May
values showed good agreement. For example, July
June
precipitation had 95% of the predicted values within July
0.6 cm of the actual value. Similar comparisons for April August
low temperature and AMJJA high temperature showed April–July (AMJJ)
95% of the predicted values falling within 1.2 and 1.4 1C, May–July (MJJ)
respectively. April–August (AMJJA)
Our climate database was also cross-checked with the Cumulative precipitation (cm) Year
VEMAP data (Kittel et al., 2004), which represent a con- April
sistent, 100-year climatology of the region based on May
thousands of station records and so should in principle June
July
better represent the time scales over which the soil
August
acquired its d13C. However, the VEMAP data do not cover
Mean April–July (AMJJ)
the Canadian Great Plains. In the comparison between Mean May–July (MJJ)
the two data sets for the critical predictor variables, no Mean April–August (AMJJA)
significant biases were found and close agreement Growing degree days (165 F) Year
(0.75oR2o0.85) was found for both temperature vari- Frost free days Year
ables and precipitation. The latter is especially impor-
tant because while temperature varies fairly smoothly Soil variable
across the region, precipitation, and especially seasonal %sand
or monthly precipitation averages, exhibit some sharp %silt
spatial gradients (Kittel et al., 2004). The comparison of %clay
the two data sets gives us confidence that our proce- %carbon
%nitrogen
dures produced an accurate depiction of the long-term
C/N ratio
seasonal climate, while including a consistently devel-
oped estimate for Southern Canada. Temperatures are for daily values, averaged over the time
period. Precipitation is cumulative for the time period.
Comparison with other studies
scribed in Tieszen et al. (1997), these data were collected
We obtained an independent estimate of %C4 contribu- during vegetation surveys where the proportion of
tion to production from the State Soil Geographic aboveground plant production was determined for
(STATSGO) database (Soil Survey Staff, 1993). As de- major plant species. For each of our US sites, we
r 2008 The Authors
Journal compilation r 2008 Blackwell Publishing Ltd, Global Change Biology, doi: 10.1111/j.1365-2486.2008.01552.xC L I M AT E C O N T R O L O F C 3 V S . C 4 P R O D U C T I V I T Y 5
identified the corresponding STATSGO map unit and determined the r2 values from linear regression of the
determined the percentage of plant production that %C4 A-SOM, %C4 A-roots and %C4 STATSGO with each tem-
was attributable to C4 grasses. We refer to this as the perature index. We further examined the temperature
%C4 STATSGO. Similar data are not available for Canada, that best-predicted variation in isotope and STATSGO
to our knowledge. data, and calculated the magnitude of AIC improve-
We also calculated the predicted %C4 for each of our ment by adding rainfall as an additional predictor in a
sites using our climate data and the published algo- multiple regression analysis. We also compared the
rithm of Paruelo & Lauenroth (1996). We refer to this as predictive power of the absolute magnitude of precipi-
the %C4 P&L. The algorithm, given in the legend of their tation over a time interval vs. the percent of annual
Fig. 3, is precipitation that fell during that time interval.
To evaluate a broader suite of climate and soil pre-
%C4 P&L ¼ 0:9837 þ 0:000594PA þ 1:3528PS þ 0:2710
lnðTA Þ; dictors and to identify more complex combinations of
predictors, we used step-wise multiple regression ana-
where PA is the mean annual precipitation (mm), PS is lysis, drawing from all of the climate and soil data that
the proportion of annual precipitation that falls in we had available (Table 1) to explain variability across
summer (June, July and August) and TA is the mean both indices of C3 vs. C4 productivity (i.e. %C4 A-SOM,
annual temperature ( 1C). %C4 STATSGO). The stepwise model was built using a
Finally, we determined categories of %C4 productiv- mixed approach such that parameters were added if
ity (i.e. 100% C3, mixed C3/C4 or 100% C4) from leaf Po0.25 and removed if P40.1. In all models, the %C4
physiology models following the approach of Collatz values were not transformed because they were nor-
et al. (1998). Their model predicts that C4 leaves have mally distributed and the model never predicted values
greater net C assimilation than C3 leaves at tempera- outside the data range. All statistical analyses were
tures higher than 22 1C. Thus, assuming sufficient performed in JMPIN v5.1 (SAS Institute Inc.) and other
precipitation for growth (425 mm month1), their mod- calculations performed in EXCEL 2003 (Microsoft).
el predicts that C4 grasses should competitively exclude
C3 (i.e. 100% C4) where growing season temperatures
Results
are persistently 422 1C, while C3 and C4 mixtures will
persist where growing season temperatures fall above
Patterns in soil data
and below 22 1C. Regions where all average monthly
growing season temperatures are below 22 1C are pre- Patterns in the d13C of SOM and roots were dominated
dicted to be 100% C3 vegetation. by regional-scale clines, with the most negative values
in the north and most positive in the south (Fig. 1, Table
2). Four sites in southern Canada showed isotope values
Statistical analyses of A-horizon soils more negative than 24% while
To evaluate climate and other controls on variation in several sites across Texas, Oklahoma and Kansas pos-
the %C4, we used linear and multiple regression tech- sessed A-horizon SOM with d13C more positive than
niques. In some cases, we compared the predictions 15%. In the mid-latitudes, we also observed a ten-
generated by these models by examining the magnitude dency toward longitudinal variation in d13C. For exam-
of the r2 values. We also compared models using ple, four sites along the 451N parallel ranged from
Akaike’s Information Criterion (AIC) (Burnham & 17% in the east to 25% in the west.
Anderson, 2002). The AIC value for each model is We found that the isotopic compositions between
calculated as SOM and roots were strongly correlated: regressions
of the d13C of A-horizon SOM vs. B-horizon SOM, vs.
AIC ¼ n lnðMSEÞ þ 2K;
A-horizon roots and vs. B-horizon roots yield signifi-
where MSE is the mean squared error from the ANCOVA cant correlations (Po0.0001) with r2 values of 0.86, 0.72
or linear regression, n is the number of observations, and 0.66, respectively. However, we found that the four
and K is the number of parameters in the model reservoirs show persistent within-site differences in
including 1 for the intercept and 1 for the error term. their d13C (Fig. 2). Within a site, the SOM usually
Models with lower AIC values are more strongly sup- became isotopically enriched with depth such that, on
ported. average, B-horizon SOM was 0.54% enriched with
Our climate data included monthly, seasonal and respect to the A-horizon above it. The magnitude of
annual averages of daily high, daily average and daily enrichment with depth was even greater in roots, which
low temperatures. To compare the power of these were, on average, 0.96% more positive in the B than in
temperature indices to predict variation in %C4, we the A-horizon. A comparison of soil and root isotopic
r 2008 The Authors
Journal compilation r 2008 Blackwell Publishing Ltd, Global Change Biology, doi: 10.1111/j.1365-2486.2008.01552.x6 J. C. VON F I S C H E R et al.
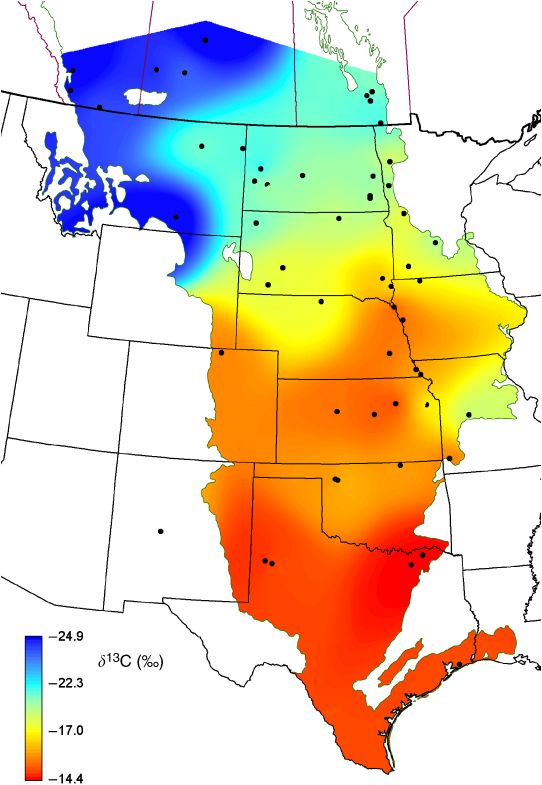
Fig. 1 Map of d13C of A-horizon SOM interpolated over the Great Plains ecoregion. Points mark sampling sites; kriging is by inverse
weighting with exponential decay. SOM, soil organic matter.
properties revealed that A-horizon soils were, on aver- difference between A-horizon SOM and roots. Isotopic
age, 1.0% enriched with respect to roots. B-horizon enrichment with depth in SOM (i.e. the d13C of
SOM was also enriched relative to B-horizon roots, with B-horizon SOMthe d13C of A-horizon SOM) was ex-
a mean enrichment of 0.75%. We used the observed plained by a two predictor model that included a weak
enrichment in d13C between roots and SOM to adjust negative correlation with %clay in the A-horizon and
the two end-member mixing model for calculating %C4 a positive correlation with July low temperature
from SOM (Table 3a). (R2 5 0.16, P 5 0.027). For the enrichment of root
Stepwise linear regression produced weak but sig- d13C between A and B-horizons, the model contained
nificant multiple regression models for the isotopic only July precipitation (positive correlation, r2 5 0.13,
enrichment with depth in SOM, roots and for the P 5 0.015). A similarly small portion of the variance
r 2008 The Authors
Journal compilation r 2008 Blackwell Publishing Ltd, Global Change Biology, doi: 10.1111/j.1365-2486.2008.01552.xC L I M AT E C O N T R O L O F C 3 V S . C 4 P R O D U C T I V I T Y 7
Table 2 Study sites and isotopic properties of organic materials in each site
d13C SD
Latitude Longitude
Site (N) (W) SOM-A SOM-B Roots-A Roots-B SOM-A SOM-B Roots-A Roots-B
Anahuac Wildlife Refuge, TX 29.67 94.40 15.0 14.4 15.3 14.0 1.53 0.72 3.74 2.33
Clymer’s Prairie, TX 33.32 96.20 14.4 13.5 16.0 14.7 0.33 0.70 3.82 3.16
Lubbock, TX 33.41 102.10 15.5 13.6 15.2 14.7 1.15 0.35 2.69 3.94
Muleshoe, TX 33.50 102.40 14.2 13.5 15.4 15.0 1.15 0.64 1.78 2.81
Tridens Prairie, TX 33.64 95.70 14.4 12.9 14.0 13.6 0.28 0.33 1.66 1.00
Sevielleta, NM 34.35 106.90 16.7 16.4 15.1 15.7 1.62 1.37 0.64 2.86
Woodward, OK 36.42 99.30 18.6 16.6 14.0 15.0 0.34 0.45 0.55 1.60
Freedom, OK 36.45 99.40 14.1 12.6 14.3 0.72 0.53 0.95 0.00
Tallgrass Prairie, OK 36.88 96.50 16.3 15.1 0.90
Diamond Grove, MO 37.03 94.30 15.6 15.3 14.1 0.88 0.90 2.67
Drover’s Prairie, MO 38.53 93.30 19.3 16.3 18.2 1.21 0.56 5.07
Land Institute, KS 38.73 97.60 15.3 13.5 13.7 12.5 1.35 0.82 0.95 0.73
Fort Hays, KS 38.86 99.30 15.6 14.1 18.6 23.0 0.63 0.83 5.62 1.97
Fall Leaf Prairie, KS 39.00 95.20 18.3 1.20
Konza Prairie, KS 39.09 96.60 14.4 13.9 17.1 14.5 0.76 0.68 1.37 1.48
Squaw Creek Wildlife Refuge, MO 40.08 95.40 16.8 18.2 1.43 2.04
Indian Cave State Park, NE 40.26 95.60 16.0 16.8 1.18 1.18
CO State/LTER, CO 40.84 104.70 15.9 15.4 0.44 0.98
Nine Mile Prairie, NE 40.87 96.80 15.5 13.6 20.7 14.2 0.92 0.76 1.18
Loess Hills Wildlife Refuge, IA 42.05 96.10 15.7 18.2 1.08 1.05
Stone State Park, IA 42.52 96.50 14.0 16.3 1.38 1.99
Niobrara Nature Preserve, NE 42.77 100.00 17.8 16.7 25.2 20.0 1.42 0.42 0.83 3.60
Second Niohbrara site 42.77 100.00 18.4 16.2 22.3 18.1 2.10 0.81 3.67 5.72
Newton Hills State Park, SD 43.26 96.60 18.3 18.2 20.1 19.7 3.10 1.48 4.63 5.36
Lange-Furgeson Site, SD 43.33 102.60 18.3 17.8 17.3 21.5 1.41 1.09 5.13 3.33
Cayler Prairie, IA 43.40 95.20 17.7 16.9 19.0 13.9 0.89 0.80 2.34 3.63
Makoce Washte, SD 43.55 97.00 16.3 18.1 18.5 15.3 1.06 1.73 4.16 3.83
Lundblad, MN 43.94 95.70 18.7 17.1 17.9 15.5 0.28 0.31 4.63 4.52
Cottonwood, SD 43.96 101.90 18.1 19.0 19.6 19.8 0.76 1.42 2.09 4.34
Schaefer Prairie, MN 44.72 94.30 19.8 17.9 19.6 17.1 0.18 1.06 2.01 3.85
Antelope Prairie, SD 45.51 103.30 20.4 20.1 21.2 24.1 0.66 1.28 2.36 2.13
Custer Battlefield, MT 45.54 107.40 25.0 23.6 25.7 26.3 0.86 1.60 1.64 1.13
Ordway Prairie, SD 45.72 99.10 19.0 19.2 21.4 21.9 0.87 1.33 2.43 3.18
Staffanson, MN 45.82 95.80 17.6 16.3 17.2 16.3 1.29 1.14 3.06 1.94
Eastern ND Tallgrass Prairie, ND 46.42 97.50 18.2 16.5 0.43 0.35
Bluestem Prairie, MN 46.84 96.50 19.5 18.2 22.1 22.0 0.47 0.49 3.16 1.79
Dickinson, ND 46.89 102.80 18.9 19.6 19.8 22.6 0.87 2.28 3.48 4.17
Sheyenne Grassland, ND 46.50 97.50 21.1 21.1 21.4 19.7 1.68 1.13 3.41 3.13
Western ND Mixed Prairie, ND 47.00 103.50 20.1 19.3 0.67 0.70
Oakville, ND 47.20 97.30 20.5 19.2 21.1 17.2 0.80 0.83 2.40 3.13
Cross Ranch, ND 47.25 101.00 19.7 19.4 22.8 22.3 0.82 0.90 1.78 2.28
Teddy Roosevelt N.P., ND 47.45 103.20 21.9 22.2 23.9 23.6 0.33 0.62 1.57 1.52
Pembina Prairie, MN 47.69 96.40 17.9 16.7 17.0 15.4 1.27 0.87 3.50 2.07
Glasgow, MT 48.12 106.40 20.3 21.6 22.7 23.8 0.55 0.61 2.39 1.76
Bainville, MT 48.14 104.20 20.5 21.7 22.0 21.4 1.72 2.15 3.53 4.00
Milk River, Alberta 49.08 112.10 23.4 23.4 25.0 23.3 0.76 0.52 0.70 3.08
Tolstoi Prairie, Manitoba 49.08 96.80 21.0 19.2 22.8 20.8 2.57 1.88 2.84 4.02
Living Prairie, Manitoba 49.88 97.30 21.4 19.9 22.3 17.7 0.54 0.53 2.12 5.53
Head Smashed In, Alberta 49.50 113.80 24.1 22.8 24.9 23.7 0.80 1.13 1.54 2.60
Grosse Isle, Manitoba 50.07 97.50 20.6 20.6 17.8 18.9 0.52 1.47 2.29 3.91
Oak Hammock, Manitoba 50.20 97.20 19.1 21.5 20.8 19.5 2.19 0.49 3.74 5.46
Continued
r 2008 The Authors
Journal compilation r 2008 Blackwell Publishing Ltd, Global Change Biology, doi: 10.1111/j.1365-2486.2008.01552.x8 J. C. VON F I S C H E R et al.
Table 2. (Contd.)
d13C SD
Latitude Longitude
Site (N) (W) SOM-A SOM-B Roots-A Roots-B SOM-A SOM-B Roots-A Roots-B
Stavely, Alberta 50.22 113.90 25.2 24.5 25.6 25.7 0.20 0.10 0.34 0.21
Matador, Saskatchewan 50.67 109.30 24.1 23.4 26.3 25.9 0.28 1.14 0.28 0.45
Biddulph, Saskatchewan 50.68 107.70 22.9 22.8 25.2 23.3 1.52 1.08 1.32 4.26
Kernan Prairie, Saskatchewan 51.90 106.70 25.1 24.3 26.3 25.8 0.25 0.36 0.36 0.65
Letters A and B identify the soil horizon. SD is 1 standard deviation of the d13C value.
2.5 Table 3a Isotopic values used in two end-member mixing
models to determine %C4
Difference in 13C (‰)
2
d13C (%)
1.5 Compartment Enrichment from Fig. 2 C3 C4
1 A-horizon roots 26.7 12.5
A-horizon SOM 1.0 25.7 11.5
0.5
Uses values from Cerling et al. (1997) for roots, and modifies
those values for the enrichment of SOM with respect to roots
0
identified in Fig. 2c.
A-roots A-SOM B-roots B-SOM
SOM, soil organic matter.
Compartment
Fig. 2 Average within-site differences in d13C between the Table 3b Best fit d13C of end members to other %C4
A-horizon roots and other soil compartments. Error bars are
1 SE. %C4 P&L %C4 STATSGO
Compartment C3 C4 C3 C4
in enrichment of A-horizon SOM with respect to
A-horizon roots was explained by a model depending A-horizon roots 26.7 12.5 23.9 16.7
on April and May average temperatures (R2 5 0.18, A-horizon SOM 23.4 13.0 21.9 14.9
P 5 0.016). Parameter values for these statistical rela-
Gives end members that would be needed to make the
tionships are presented in the Appendix A.
regression lines for %C4 vs. d13C match the 1 : 1 lines in Fig.
3a–d.
SOM, soil organic matter.
Comparison of predicted %C4
Data in Fig. 3 illustrate that %C4 from our isotope tively small changes to the end member d13C (Table 3b).
determinations were better predicted by the algorithm However, unrealistically large end-member adjust-
of Paruelo & Lauenroth (1996) than by the STATSGO ments were needed to bring the STATSGO predictions in
database or by the algorithm from Collatz et al. (1998). line with our isotopic measure of %C4.
The %C4 P&L prediction had a small but significant
(Po0.05) departure from the 1 : 1 line for %C4 A-SOM
(Fig. 3a), but not for %C4 A-roots. In contrast, the STATSGO
Statistical relationships with climate controls
data consistently underestimated the productivity of
the rarer plant type (Fig. 3c and d). Despite the differ- The average of daily high temperature better predicted
ences in fit to the 1 : 1 lines, regressions of isotope-based %C4 A-SOM and %C4 STATSGO than low or average tem-
%C4 with both %C4 P&L and %C4 STATSGO had similar r2 perature (Fig. 4a and b), and the same was true for the
values. The physiologically based model of Collatz et al. %C4 A-roots (data not shown). The isotope and STATSGO
(1998) showed only weak agreement (Fig. 3e and f), and data showed remarkably similar responses, with both
it never identified any sites as being C4 dominated, even indices positively correlated with temperature. The
though seven of our 55 sites had d13C values consistent average and high temperatures were only equivalent
with 475% C4 contribution. It was possible to bring predictors in July, August and at the annual scale. Low
%C4 P&L predictions onto the 1 : 1 line by making rela- temperatures were typically much poorer predictors of
r 2008 The Authors
Journal compilation r 2008 Blackwell Publishing Ltd, Global Change Biology, doi: 10.1111/j.1365-2486.2008.01552.xC L I M AT E C O N T R O L O F C 3 V S . C 4 P R O D U C T I V I T Y 9
(a) 100 (c) 100 (e)
%C from C of A-horizon SOM
%C from C of A-horizon SOM
100
%C from C of A-horizon SOM
R = 0.642
90 R = 0.653 90 90
80 80 80
70 70 70
60 60 60
50 50 50
40 40 40
30 30 30
20 20 20
10 10 10
0 0 0
−10 −10 −10
−10 0 10 20 30 40 50 60 70 80 90 100 −10 0 10 20 30 40 50 60 70 80 90 100 100% C Mixed 100% C
% C predicted from Paruelo & Lauenroth %C predicted from %C predicted from Collatz et al.
%C from C of A-horizon roots
%C from C of A-horizon roots
%C from C of A-horizon roots
100 (b) R = 0.559 100 (d)
R = 0.507
100 (f)
90 90 90
80 80 80
70 70 70
60 60 60
50 50 50
40 40 40
30 30 30
20 20 20
10 10 10
0 0 0
−10 −10 −10
−10 0 10 20 30 40 50 60 70 80 90 100 −10 0 10 20 30 40 50 60 70 80 90 100 100% C Mixed 100% C
% C predicted from Paruelo & Lauenroth %C predicted from %C predicted from Collatz et al.
Fig. 3 Comparison of %C4 determined from soil and root d13C with %C4 predicted by Paruelo & Lauenroth (1996) the STATSGO
vegetation database, and Collatz et al. (1998). Solid lines are regression lines (a–d) or means of observed data (e–f) and dashed lines
are 1 : 1 lines (a–d) or expected values (e–f).
%C4 than average temperatures. Parameter values for better predicted by models that included temperature,
the statistical relationships between %C4 and tempera- but there was comparably little change in the AIC
ture are presented in the Appendix A. values among the different time periods (data not
In an analogous comparison, we found that the shown).
absolute magnitude of precipitation falling during a Although our post hoc use of stepwise regression
time interval had significantly more explanatory power generated models for %C4 A-SOM and %C4 STATSGO with
than the percent of mean annual precipitation that fell better AIC values than did the a priori models identified
during that same interval. The r2 values for regression in Fig. 4b, all post hoc models still depended on July
of %C4 vs. absolute precipitation were two to five times precipitation and one or more of the high temperatures.
larger than the r2 values of %C4 vs. percent of annual The best model for %C4 A-SOM used four predictors:
precipitation. April high temperature, May low temperature, July
Among the time intervals under consideration, we precipitation and the AMJJA high temperature (predic-
found that July climate (average daily high temperature tive equation in Appendix A). The R2 of this model,
and monthly rainfall) best explained variation in 0.78, explained 15% more variance in soil isotopes than
%C4 A-SOM and %C4 STATSGO (Fig. 4b). From an AIC did July high temperature and rainfall. The stepwise
perspective, the July models were significantly better model for %C4 STATSGO was simpler, using only July
than the next best predictors (Fig. 4c), which had AIC precipitation and August high temperature to generate
values 4–5 units larger. Inclusion of rainfall improved an R2 of 0.82. However, this combination was only a 6%
the AIC value of the models in 16 of the 18 comparisons, improvement over the July high temperature and July
but some time intervals remained weaker predictors. precipitation model. A stepwise model for %C4 A-roots
For example, April and May climate indices yielded attained an R2 of 0.71 by considering annual low
uniformly weaker models than did those of June and temperature, July precipitation and AMJJA high tem-
August. Interestingly, the addition of precipitation as a perature (predictive equation in Appendix A). In the
predictor improved the July climate data from among stepwise regressions for %C4 A-SOM and %C4 STATSGO,
the worst to among the best predictors (predictive soil information (i.e. soil texture, %carbon, %nitrogen
equation in Appendix A). The %C4 A-roots was similarly and C/N ratio) was available, but it was never included
r 2008 The Authors
Journal compilation r 2008 Blackwell Publishing Ltd, Global Change Biology, doi: 10.1111/j.1365-2486.2008.01552.x10 J . C . VON F I S C H E R et al.
in the models. In the model for %C4 A-roots, the addition 35
of soil information led to the replacement of annual low 30
Crossover temperature (°C)
temperature with soil %carbon, but the R2 value in-
creased by o2% (predictive equation in Appendix A). 25
In the field, plants experience a range of temperatures
20
over daily and seasonal scales, thus obscuring which
metric of field temperature is most physiologically and 15
ecologically relevant. Our empirically determined
10
crossover temperature coincided with the physiologi- high temp.
cally predicted crossover temperature of 22 1C for five 5 mean temp.
temperature indices (Fig. 5). May high temperature, low temp.
0
ril
ay
ne
ly
st
JJ
JJ
A
ar
JJ
Ju
Ap
gu
Ye
AM
M
M
Ju
AM
Au
0.75 (a) Time period of temperature data
0.70
r with C of A-horizon SOM
0.65 Fig. 5 Crossover temperatures calculated from regressions of
0.60 %C4 from the d13C of A-horizon SOM vs. the various tempera-
ture metrics. The dashed line marks 22 1C, the crossover tem-
0.55
perature predicted by physiological models of Collatz et al.
0.50
(1998). By definition, %C4 is >50% at temperatures above the
0.45 crossover temperature. SOM, soil organic matter.
0.40
0.35
0.30
July and August average temperature, and the high
temperatures of AMJJ and AMJJA all predicted a cross-
ril
ay
ne
ly
st
JJ
JJ
A
ar
JJ
Ju
Ap
gu
Ye
AM
M
M
Ju
over temperature within 2 of 22 1C.
AM
Au
Time period of temperature data
0.75 (b)
0.70
0.65 Discussion
%C
0.60
0.55 Controls of %C4
0.50 Both isotopic and STATSGO measures identified strong
r with
0.45 control of %C4 by mid-summer climate in the hottest
0.40 part of the day, when photon flux rates are greatest and
0.35 thus potential for growth is also highest. These findings
0.30
closely parallel the observations of Hattersley (1983) in
Australia who found summer (January) temperatures to
ril
ay
e
ly
t
JJ
JJ
A
ar
us
n
JJ
Ju
Ap
Ye
AM
M
M
Ju
have highest correlations with %C4. Convergence of
g
AM
Au
Time period of temperature data isotope and STATSGO results with those of Hattersley
(1983) illustrates the general response of %C4 to
90 (c) 350
mid-summer climate, and it refutes an alternative
85 345
80 340
AIC value
75 335
SOM AIC value
70 330
Fig. 4 Comparison of climate indices for predicting %C4 from
65 325
d13C of A-horizon SOM and %C4 from STATSGO. (a) and (b) are
60 320 correlations with daily high, average and low temperatures aver-
55 315 aged over months, parts of the growing season, or annually. (c) A
50 310 comparison of the predictive power of high temperature alone or
45 305 high temperature and precipitation (ppt.) together. Values on the
40 300 y-axis in (c) are Aikake Information Criteria (AIC), an index that
reflects the explanatory power of a model, penalized by the
ril
ay
ne
ly
st
JJ
JJ
A
ar
JJ
Ju
Ap
gu
Ye
AM
M
M
Ju
AM
Au
number of predictors. Lower AIC values indicate models that
Time period of climate data are more strongly supported. SOM, soil organic matter.
r 2008 The Authors
Journal compilation r 2008 Blackwell Publishing Ltd, Global Change Biology, doi: 10.1111/j.1365-2486.2008.01552.xC L I M AT E C O N T R O L O F C 3 V S . C 4 P R O D U C T I V I T Y 11
interpretation of our data that climate is somehow a patterns. When the range of temperatures is narrowed
proxy for geography or another nonclimatic control. to those observed in central North America, subtler
Our results reinforce the ecological importance of differences become more important for making accurate
photorespiration, by indicating that low temperatures determinations of %C4. In any case, the poor fit of the
in spring have little direct impact on %C4, despite the Collatz et al. (1998) prediction to North American grass-
detrimental effects of low spring temperature on C4 lands illustrates a weakness of this approach for dis-
grasses through reduced pigment production (Haldi- criminating variation in %C4 in regions of mixed C3 and
mann, 1999) and reduced rubisco capacity (Pittermann C4 grasses.
& Sage, 2000; Kubien & Sage, 2004). Although April low Our results reveal that not all climate indices are
temperature was the best predictor of all low-tempera- equally strong predictors of %C4. In particular, the
ture intervals, high temperatures during the early grow- results presented in Figs 4 and 5 indicate that %C4 in
ing season (April, May and June) were generally better the North American Great Plains grasslands are espe-
predictors of %C4 than were average or low tempera- cially sensitive to the climate in July, suggesting that the
tures (Fig. 4). outcome of competition between C3 and C4 plants in
Although we find a strong correspondence between was particularly sensitive to climate during this narrow
our isotopic determination of %C4 and those predicted window of time. Mixed C3 and C4 systems persist in
by the algorithm of Paruelo & Lauenroth (1996), our Great Plains grasslands where July average temperature
estimates of the %C4 showed bias with respect to the is 21.5 3 1C; systems are C3 dominated (o33% C4)
STATSGO database and substantial departure from the below this range and C4 dominated (466% C4) above it.
%C4 predicted by the Collatz et al. (1998) algorithm. It is Despite the importance of temperature for determin-
unlikely that the difference in %C4 is due to error in the ing variation in %C4, rainfall persisted as a significant,
end-members because the ‘best fit’ end members in although weak, predictor. It was somewhat surprising
Table 3b were far outside the typical range of C3 and that the absolute magnitude of precipitation was a
C4 plants (Cerling et al., 1997). Instead, the bias between much better predictor of %C4 than the relative amount.
isotopic metrics of %C4 and the %C4 STATSGO more likely Although rainfall amount is the primary control of total
reflects differences in the study sites sampled. While productivity across the North American grasslands
our sampling and the work of Paruelo & Lauenroth (Sala et al., 1988), several studies suggest that the
(1996) were confined to pristine, native prairie sites, the percent of total precipitation in June, July and August
sampling that gave rise to the STATSGO vegetation data- should be important for determining %C4 (Paruelo &
base was targeted for livestock production and was not Lauenroth, 1996; Winslow et al., 2003). Our results are
limited to native prairies. Thus, the bias between consistent with experiments of Skinner et al. (2002), who
%C4 STATSGO and %C4 A-SOM likely resulted from man- found that summer irrigation treatments to a Wyoming
agement of the STATSGO sites, which often had C3 forages grassland increased %C4. Other experimental work in
planted in the north and C4 in the south to improve the tallgrass Konza prairie altered the timing of pre-
grazing. cipitation and revealed that greater intervals between
In contrast to the empirically based %C4 from summer rainfall events can reduce aboveground net
STATSGO, Collatz et al. (1998) predict the %C4 produc- primary production by C4 grasses (Knapp et al., 2002;
tivity from principles of leaf physiology. Our results Fay et al., 2003). Collectively, our results and these
(Fig. 3e and f) and direct comparison of the predictions experimental findings indicate that either the %C4 is
of %C4 P&L with %C4 Collatz revealed weak agreement driven by the magnitude of precipitation itself or by a
with the Collatz et al. (1998) algorithm despite their reduced interval between rainfall events that arises
successful, global-scale delineation of where C4 is domi- where summer precipitation is greater.
nant, mixed with C3 or absent. Perhaps because finer-
scale prediction is not the goal of their work, we observe
Isotopic properties of soils
distinct differences when applying this metric at regio-
nal scales. Indeed, the North American Great Plains Ultimately our use of d13C to determine %C4 depends
grasslands are a special case at the global scale because on the fidelity of the isotopic composition of soil and
they are dominated by C3/C4 mixtures. Most other root material. Isotopic fractionation and selective pre-
grasslands worldwide are pure C3 or C4, and these servation of plant parts during decomposition have the
grasslands ‘anchor’ the regression between temperature potential to scramble the relationship between the iso-
and %C4. On the global scale, temperatures and rainfall topic composition of plants and SOM across the North
patterns vary much more widely than at the scale of American Great Plains grasslands, limiting the power of
North American grasslands and so the coarser ap- SOM d13C to determine local %C4. However, our data
proach of Collatz et al. (1998) yields reasonable global support the conclusion of Sage et al. (1999) that the d13C
r 2008 The Authors
Journal compilation r 2008 Blackwell Publishing Ltd, Global Change Biology, doi: 10.1111/j.1365-2486.2008.01552.x12 J . C . VON F I S C H E R et al.
of SOM and roots reflect %C4. Comparison of our Few studies have documented enrichment in 13C of
results with the predictions of Paruelo & Lauenroth fine roots (o2 mm) with depth (but see also Still et al.,
(1996) independently confirm that the d13C of the C3 2003b), which may be driven by three mechanisms.
and C4 end members are not significantly scrambled by First, the biochemical and transport processes asso-
diagenetic or pedogenic processes. We found that the ciated with root growth may cause isotopic enrichment
d13C of these end members, when modified for the in deeper roots. Second, C4 roots may be more resistant
systematic fractionations observed across all sites, are to decomposition and remain in the soil longer after
within the range described by Cerling et al. (1997). Any death. And third, C4 grasses may, on average, have
systematic bias would have caused the isotopic deter- greater rooting depth than C3 grasses. Although the
minations of %C4 to fall away from the 1 : 1 line in Fig. tissue-specific studies of Badeck et al. (2005) and
3a and b, but we find no evidence that such effects were Klumpp et al. (2005) suggest that root isotopes could
important. Although the long residence times of SOM acquire systematic differences with depth, we find no
have the potential to integrate plant inputs over time support for the first hypothesis; our data show no
scales that exceed the range of our climate data, we find significant change in root d13C with depth in any
that the long-term average %C4 is very similar to the C3-dominated stands, where d13C of A-horizon SOM
modern %C4, as shown by the strong correlation be- is o21%. The second hypothesis, which is neither
tween %C4 A-SOM and %C4 A-roots and the strikingly supported nor refuted by our data, is consistent with
similar responses of %C4 A-SOM and %C4 STATSGO to the idea that C3 grass tissues are more labile (Caswell
climate (Fig. 4a vs. b). et al., 1973) and it is supported by field measures that
Within-site variance in d13C was relatively small and show greater longevity of C4 roots as compared to C3
generally systematic (Table 1), dominated by persistent (Gill et al., 1999). The third hypothesis is supported by
differences in the isotopic composition among soil Fargione & Tilman (2005) who found that niche parti-
carbon pools (Fig. 2). Although the trends in the iso- tioning between a single C4 grass species and multiple
topic enrichment of SOM with depth have been found C3 competitors was facilitated by differences in rooting
by many others, we here document variation in this depth. In addition, our statistical analysis of the isotopic
pattern across more sites than any other single study. enrichment in roots with depth shows that the enrich-
Ehleringer et al. (2000) concluded that SOM isotopic ment with depth is positively correlated with July
enrichment with depth is most likely driven by the precipitation, which favors C4 grasses. Further evalua-
anthropogenic changes in d13C of atmospheric CO2 tion of the latter two hypotheses will depend on more
and the mixing of new organic material with SOM that detailed examination of the C3 vs. C4 affinity of indivi-
is old and isotopically fractionated (e.g. Wedin et al., dual roots with depth and discrimination of live from
1995). The subsequent findings of Torn et al. (2002), dead roots.
however, weaken support for the CO2 mechanism by We anticipate that our characterization of the climate-
showing identical patterns of enrichment with depth in isotope relationship could provide novel insights into
100-year-old archived soils and modern samples from paleoclimate. For example, we have already used the
the same location. Work by Bird et al. (2003) suggests July temperature approach and this dataset to interpret
that soil texture may drive some variability in the paleotemperatures from the d13C of SOM in paleosols
degree of enrichment with depth, and we find some recovered from the North American Great Plains
evidence that clay content is associated with differences (Nordt et al., 2007). Given the importance of summer
between A- and B-horizon SOM d13C. However, in temperatures for structuring %C4, we expect that past
contrast to the positive relationship observed by Bird changes in SOM d13C will reflect summertime climate,
et al. (2003), we find a negative correlation between clay primarily temperature, with only a weak effect of pre-
content and enrichment with depth. The mechanism cipitation on variability in d13C of SOM.
underlying this clay effect remains unknown. We expect the future C3/C4 composition of North
Our results show that enrichment in root 13C with American grasslands to respond to climate change, but
depth may contribute to the SOM enrichment with in a manner that is not yet predictable. Although
depth. On average, B-horizon roots are enriched com- regional-scale climate predictions are somewhat tenu-
pared with A-horizon roots about as much as B-horizon ous, summer temperatures in central North America are
SOM is enriched compared with A-horizon SOM. Be- expected to increase 1–2.5 1C by 2050 (Liang et al., 2006),
cause decomposing roots are a key source for SOM and 4 1C by 2100 (Christensen et al., 2007). Given that
formation in grasslands (Gill et al., 1999), it is possible climate explains 70% of existing variability in %C4,
that some of the isotopic enrichment in deeper SOM is this warming alone could drastically alter the C3/C4
driven by decomposition of deeper roots that are iso- balance, much as a similar amount of warming did over
topically enriched. the past 10 000 years (Nordt et al., 2007). However,
r 2008 The Authors
Journal compilation r 2008 Blackwell Publishing Ltd, Global Change Biology, doi: 10.1111/j.1365-2486.2008.01552.xC L I M AT E C O N T R O L O F C 3 V S . C 4 P R O D U C T I V I T Y 13
atmospheric CO2 will increase to at least 600 ppm over Dickinson CE, Dodd JL (1976) Phenological pattern in shortgrass
this time. This latter change will both strongly favor C3 prairie. American Midland Naturalist, 96, 367–378.
plants and thrust C4 plants into an environment that has Ehleringer JR, Buchmann N, Flanagan LB (2000) Carbon isotope
not existed in the 410 million years that they have been ratios in belowground carbon cycle processes. Ecological Ap-
plications, 10, 412–422.
on the earth (Cerling et al., 1997). Under such swift and
Ehleringer JR, Cerling TE, Helliker BR (1997) C4 photosynthesis,
drastic environmental changes, ecological and evolu-
atmospheric CO2 and climate. Oecologia, 112, 285–299.
tionary surprises are almost sure to happen.
Elliot ET, Heil JW, Kelly EF, Monger HC (1999) Soil structural and
other physical properties. In: Standard Soil Methods for Long-Term
Ecological Research (eds Robertson GP, Coleman DC, Bledsoe
Acknowledgements CS, Sollins P), pp. 74–88. Oxford University Press, Oxford.
Epstein HE, Lauenroth WK, Burke IC, Coffin DP (1997) Produc-
We thank Norman Bliss for help with the STATSGO database, tivity patterns of C3 and C4 functional types in the US Great
Donovan Dejong for his assistance with climate data, and
Plains. Ecology, 78, 722–731.
Michael Chapman for his efforts in the field and laboratory.
Fargione J, Tilman D (2005) Niche differences in phenology and
Alan Knapp, Bill Lauenroth and Lee Nordt provided thoughtful
discussions and comments on this manuscript. We also thank the rooting depth promote coexistence with a dominant C4 bunch-
many land managers who facilitated our sampling efforts and grass. Oecologia, 143, 598–606.
Randy Boone for generating the color figure. This work was Fay PA, Carlisle JD, Knapp AK, Blair JM, Collins SL (2003)
funded by NSF DEB 9510065 and the Geographic Analysis and Productivity responses to altered rainfall patterns in a C4-
Monitoring and Earth Surfaces Dynamics programs of the USGS. dominated grassland. Oecologia, 137, 245–251.
Fernandez I, Mahieu N, Cadisch G (2003) Carbon isotopic
fractionation during decomposition of plant materials of dif-
ferent quality. Global Biogeochemical Cycles, 17, 1075, doi:
References 10.1029/2001GB001834.
Archer S (1984) The distribution of photosynthetic pathway Gill R, Burke IC, Milchunas DG, Lauenroth WK (1999) Relation-
types on a mixed-grass prairie hillside. American Midland ship between root biomass and soil organic matter pools in the
Naturalist, 111, 138–142. shortgrass steppe of eastern Colorado. Ecosystems, 2, 226–236.
Badeck FW, Tcherkez G, Nogues S, Piel C, Ghashghaie J (2005) Gleixner G, Bol R, Balesdent J (1999) Molecular insight into soil
Post-photosynthetic fractionation of stable carbon isotopes carbon turnover. Rapid Communications in Mass Spectrometry,
between plant organs – a widespread phenomenon. Rapid 13, 1278–1283.
Communications in Mass Spectrometry, 19, 1381–1391. Haldimann P (1999) How do changes in temperature during
Barnes PW, Tieszen LL, Ode DJ (1983) Distribution, production, growth affect leaf pigment composition and photosynthesis in
and diversity of C3-dominated and C4-dominated commu- Zea mays genotypes differing in sensitivity to low tempera-
nities in a mixed prairie. Canadian Journal of Botany-Revue ture? Journal of Experimental Botany, 50, 543–550.
Canadienne De Botanique, 61, 741–751. Hattersley PW (1983) The distribution of C3 and C4 grasses in
Bird M, Kracht O, Derrien D, Zhou Y (2003) The effect of soil Australia in relation to climate. Oecologia, 57, 113–128.
texture and roots on the stable carbon isotope composition of Hobbie EA, Werner RA (2004) Intramolecular, compound-speci-
soil organic carbon. Australian Journal of Soil Research, 41, 77–94. fic, and bulk carbon isotope patterns in C3 and C4 plants: a
Brooks A, Farquhar GD (1985) Effect of temperature on the CO2/ review and synthesis. New Phytologist, 161, 371–385.
O2 specificity of ribulose-1,5-bisphosphate carboxylase/oxyge- Hobson KA (2005) Stable isotopes and the determination of
nase and the rate of respiration in the light. Planta, 165, 397–406. avian migratory connectivity and seasonal interactions. Auk,
Burnham KR, Anderson DR (2002) Model Selection and Multimodel 122, 1037–1048.
Inference. Springer, New York. Johnson DA, Asay KH, Tieszen LL, Ehleringer JR, Jefferson PG
Caswell H, Reed F, Stephens SN, Werner PA (1973) Photosyn- (1990) Carbon isotope discrimination: potential in screening
thetic pathways and selective herbivory – hypothesis. Amer- cool season grasses for water-limited environments. Crop
ican Naturalist, 107, 465–480. Science, 30, 803–816.
Cerling TE, Harris JM, MacFadden BJ, Leakey MG, Quade J, Kittel TGF, Rosenbloom NA, VEMAP2 Participants et al.
Eisenmann V, Ehleringer JR (1997) Global vegetation change (2004) VEMAP Phase 2 bioclimatic database. I. Gridded
through the Miocene/Pliocene boundary. Nature, 389, 153–158. historical (20th century) climate for modeling ecosystem dy-
Christensen JH, Hewitson B, Busuioc A et al. (2007) Regional namics across the conterminous USA. Climate Research, 27,
climate projections. In: Climate Change 2007: The Physical 151–170.
Science Basis. Contribution of Working Group I to the Fourth Klumpp K, Schaufele R, Lotscher M, Lattanzi FA, Feneis W,
Assessment Report of the Intergovernmental Panel on Climate Schnyder H (2005) C-isotope composition of CO2 respired by
Change (eds Solomon S, Qin D, Manning M et al.), pp. 847– shoots and roots: fractionation during dark respiration? Plant,
925. Cambridge University Press, Cambridge, UK. Cell and Environment, 28, 241–250.
Collatz GJ, Berry JA, Clark JS (1998) Effects of climate and Knapp AK, Fay PA, Blair JM et al. (2002) Rainfall variability,
atmospheric CO2 partial pressure on the global distribution carbon cycling, and plant species diversity in a mesic grass-
of C4 grasses: present, past, and future. Oecologia, 114, 441–454. land. Science, 298, 2202–2205.
r 2008 The Authors
Journal compilation r 2008 Blackwell Publishing Ltd, Global Change Biology, doi: 10.1111/j.1365-2486.2008.01552.xYou can also read