Rewetted industrial cutaway peatlands in western Ireland: a prime location for climate change mitigation?
←
→
Page content transcription
If your browser does not render page correctly, please read the page content below
Rewetted industrial cutaway peatlands in western Ireland:
                  a prime location for climate change mitigation?
                D. Wilson1, C. Farrell2, C. Mueller3,4, S. Hepp3 and F. Renou-Wilson3
        1
         Earthy Matters Environmental Consultants, 2Bord na Móna and 3University College Dublin, Ireland
                                  4
                                   Justus Liebig University Giessen, Germany

_______________________________________________________________________________________

SUMMARY

Rewetting of drained industrial peatlands may reduce greenhouse gas (GHG) emissions and promote
recolonisation by peat forming plant species. We investigated carbon dioxide (CO2), methane (CH4) and
nitrous oxide (N2O) dynamics over a three-year period in a rewetted industrial peatland in Ireland. Sample
plots were established in bare peat, Juncus effusus-Sphagnum cuspidatum, Sphagnum cuspidatum and
Eriophorum angustifolium dominated microsites. The relationships between fluxes and environmental
variables were examined and regression models were used to provide an estimate of the annual GHG balance
for each microsite. All the vegetated microsites were carbon sinks for the duration of the study. Highest
uptake occurred in the Eriophorum microsite (146–583 g C m-2 yr-1), followed by Juncus-Sphagnum (35–204
g C m-2 yr-1) and Sphagnum (5–140 g C m-2 yr-1). The bare peat microsite was a source of 37–82 g C m-2 yr-1.
No N2O fluxes were detected. Strong inter-annual variation was observed in all microsites, driven by
variation in precipitation and subsequent changes in the position of the water table. In terms of Global
Warming Potential (GWP), the microsites had either a cooling effect (Eriophorum), a close to neutral effect
(Juncus-Sphagnum, Sphagnum) or a warming effect (bare peat) on the climate.

KEY WORDS: carbon dioxide; global warming potential; greenhouse gas; methane; peatland restoration

_______________________________________________________________________________________

INTRODUCTION                                               extraction (Renou-Wilson et al. 2011). Currently,
                                                           the Irish semi-state company Bord na Móna
Rewetting of degraded peatland ecosystems has              industrially supplies over three million tonnes of
been suggested as one of the most cost effective           peat per annum to three peat-fired power stations in
ways of reducing greenhouse gas (GHG) emissions            Ireland (http://www.bordnamona.ie) with peat also
and mitigating the effects of climate change (Parish       extracted for horticultural use (professional and non-
et al. 2008, Motherway & Walker 2009). In recent           professional markets) and domestic fuel sale.
years, a wide body of research has quantified the              Industrial peat extraction has a number of
impacts of degradation on the carbon (C) store             fundamental impacts on peatland ecosystem
contained within the global peatland resource (e.g.        functioning. In order to facilitate the use of heavy
Sundh et al. 2000, Waddington & Price 2000, Page           machinery on the peatland during the peat extraction
et al. 2002, Joosten 2010, Evans & Lindsay 2010,           process, drainage ditches are installed at 15 m
Worrall et al. 2011). In the Republic of Ireland,          intervals. The resulting lowering of the water table
peatlands cover around 20 % of the land area               leads to increased oxidation of the peat substrate and
(Connolly & Holden 2009) and contain an estimated          a rise in soil CO2 emissions (Holmgren et al. 2006).
1064 –1503 Gt of C (Tomlinson 2005, Eaton et al.           Removal of the vegetation removes the CO2 fixing
2008). However, only a small percentage of the             capacity (i.e. photosynthesis) of the peatland
peatland area is in a natural or intact condition          (Waddington & Price 2000) and the ecosystem is
(Douglas et al. 2008). In over 80 % of the peatland        transformed from a net CO2 sink to a net CO2
area, the main ecosystem functions characteristic of       source. While CH4 emissions may decrease (Sundh
natural     peatlands     (hydrology,     vegetation       et al. 2000, Wilson et al. 2009), fluxes from
composition, C cycling etc.) have been seriously           drainage ditches may still be significant (Nykänen et
impaired as a consequence of land use changes, for         al. 1996, Sundh et al. 2000). N2O emissions,
example agricultural reclamation, forestry and peat        considered negligible in natural peatlands, may

      Mires and Peat, Volume 11 (2013), Article 01, 1–22, http://www.mires-and-peat.net/, ISSN 1819-754X
                 © 2013 International Mire Conservation Group and International Peat Society                  1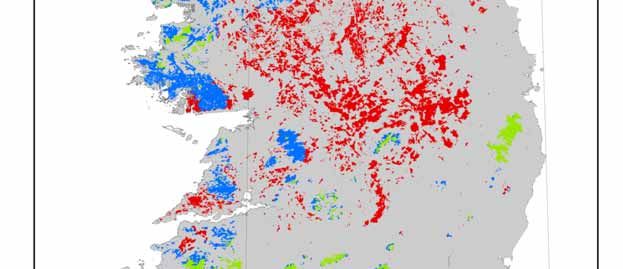
D. Wilson et al. REWETTED IRISH PEATLANDS FOR CLIMATE CHANGE MITIGATION

increase      significantly    following     drainage      have reported C gas dynamics similar to those of
(Martikainen et al. 1995, Augustin et al. 1998),           natural peatlands (i.e. CO2 sink and CH4 source)
particularly in nutrient-rich peatlands (Kasimir-          within a short time frame (Komulainen et al. 1998,
Klemedtsson et al. 1997, Schils et al. 2008).              Komulainen et al. 1999, Tuittila et al. 1999,
    Following the cessation of industrial peat             Soini et al. 2010). In the period following rewetting,
extraction, the cutaway peatland is available for          peat oxidation rates are low as a consequence of the
other uses. In Ireland, these uses have included           anoxic soil conditions and most of the C sequestered
agriculture and commercial forestry (now limited),         is contained within the peatland biomass pool
and natural re-generation of wetlands (open water,         (leaves, stems, roots, microbial communities). Over
fen, reedbed and acidic wetlands) and woodland             longer time frames a decrease in the amount of CO2
(birch and willow scrub) habitats. To date, around         that is sequestered annually by a peatland has been
11,000 ha of acid and alkaline wetlands on cutaway         reported (cf. Tuittila et al. 1999, Yli-Petäys et al.
peatlands have been created by Bord na Móna,               2007). Resumption of CH4 emissions after rewetting
which equates to around 14 % of their total land           has been widely reported (Tuittila et al. 2000,
holdings. As the post-industrial use of the cutaway        Bortoluzzi et al. 2006, Waddington & Day 2007,
is largely determined by the residual peat type,           Couwenberg 2009, Wilson et al. 2009, Couwenberg
underlying soil type and drainage conditions (Renou        & Fritz 2012). Following rewetting, CH4 emissions
et al. 2006), a further 40,000 ha of cutaway peatland      may be very low initially due to the absence of
could be suitable for wetland creation over the next       labile organic matter (Waddington & Day 2007,
decades (Wilson et al. 2012a).                             Urbanová et al. 2011) and low methanogenic
    The challenge of re-establishing suitable peat         activity (Francez et al. 2000, Andersen et al. 2006).
forming communities on industrial cutaway                  However, once vegetation has re-established,
peatlands has been widely documented (e.g.                 emissions increase considerably as a result of the
Schouwenaars 1993, Wind-Mulder et al. 1996, Price          input of fresh plant litter and exudates, and high
et al. 1998, Price & Schlotzhauer 1999, Van Seters         water levels (Basiliko et al. 2007, Waddington &
& Price 2001, Campbell et al. 2002, Farrell & Doyle        Day 2007). In general, N2O emissions tend to
2003). In general, restoration starts by raising the       decrease when a peatland is rewetted, as nitrate
water table through blocking of the drainage ditches       (NO3-) is fully reduced to nitrogen (N2) or taken up
and the creation of bunds or ridges (Smolders et al.       by plants out-competing the denitrifying microbes
2003). In the absence of vegetation characteristic of      for the available nitrogen (Silvan et al. 2005, Glatzel
natural peatlands, in particular peat-forming plants       et al. 2008, Roobroeck et al. 2010.
such as Sphagnum, these can be re-introduced                   The objectives of this study were to determine
(Cooper & MacDonald 2000, Rochefort et al. 2002,           whether rewetting of an industrial cutaway peatland
Tuittila et al. 2003). Re-establishment of the desired     in north-west Ireland has resulted in restoration of
vegetation can be enhanced with help of companion          the C sink function characteristic of natural
species, such as Polytrichum commune (Groeneveld           peatlands. Over a three-year period, we quantified
et al. 2007), Eriophorum angustifolium (Ferland &          GHG fluxes in a range of microsites within the
Rochefort 1997) and Juncus effusus (Farrell &              peatland; modelled the relationship between GHG
Doyle 2003), by peat surface topography                    fluxes and environmental variables (e.g. water table,
manipulations that create a series of ridges and           vegetation etc.); and estimated annual CO2-C,
shallow basins that enhance conditions for                 CH4-C, GHG balances and the Global Warming
Sphagnum establishment (Ferland & Rochefort                Potential (GWP) for each microsite.
1997, Farrell & Doyle 2003, Campeau et al. 2004)
and by phosphorus fertilisation (Sottocornola et al.
2007).
    The speed at which the C sink function may be          METHODS
restored following rewetting of the peatland is likely
to vary considerably from one peatland to the next,        Study site
determined by a combination of site-specific factors       The study site was located at Bellacorick, Co. Mayo
(Basiliko et al. 2007) and the climate of the region.      (54° 7' N, 9° 35' W, Figures 1–3). The climate of the
For example, some studies have reported a reduction        area is characterised by prevailing south-westerly
in the magnitude of CO2 emissions (i.e. avoided            winds and a mean annual rainfall of 1143 mm. The
losses) when a peatland was rewetted and vegetation        mean monthly temperature ranges from 5.6 °C in
re-established (Waddington & Price 2000, Wadd-             January to 14.1 °C in August with a mean annual
ington & Warner 2001, Drösler 2005, Worrall et al.         temperature of 9.3 °C (Met Éireann – Belmullet
2011, Strack & Zuback 2012) while other studies            Station, 1961–1990).

      Mires and Peat, Volume 11 (2013), Article 01, 1–22, http://www.mires-and-peat.net/, ISSN 1819-754X
                 © 2013 International Mire Conservation Group and International Peat Society                   2
D. Wilson et al. REWETTED IRISH PEATLANDS FOR CLIMATE CHANGE MITIGATION

     Figure 1. Map of Ireland showing the location of the study site, from Connolly & Holden (2009).

    The site was formerly an Atlantic blanket bog          site is 50 cm and the peat is composed mainly of
and forms part of the much larger Oweninny bog             highly humified cyperaceous peat overlying glacial
complex (6,500 ha). From 1960 to 2003, milled peat         till (Farrell & Doyle 2003). The peat is nutrient-poor
was extracted and used in the nearby Bellacorick           with a C:N ratio of 58 (n = 6) and average pH of
power station for electricity generation. The average      3.8 (± 0.3), which is typical of an Atlantic blanket
thickness of the residual peat layer within the study      bog bottom peat layer (Hammond 1981).

      Mires and Peat, Volume 11 (2013), Article 01, 1–22, http://www.mires-and-peat.net/, ISSN 1819-754X
                 © 2013 International Mire Conservation Group and International Peat Society                  3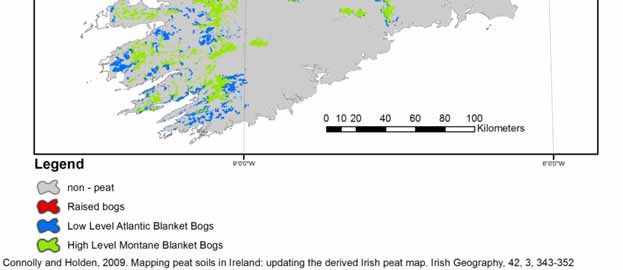
D. Wilson et al. REWETTED IRISH PEATLANDS FOR CLIMATE CHANGE MITIGATION
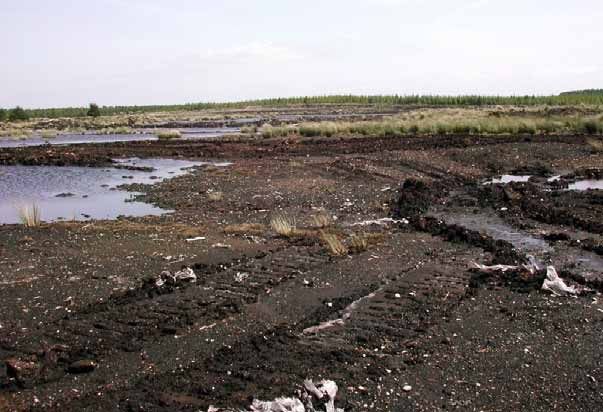
Figure 2. Photograph of Bellacorick prior to rewetting (C. Farrell).
Figure 3. Photograph of Bellacorick in 2010, taken in the same general area as Figure 2 (D. Wilson).
Mires and Peat, Volume 11 (2013), Article 01, 1–22, http://www.mires-and-peat.net/, ISSN 1819-754X
© 2013 International Mire Conservation Group and International Peat Society 4D. Wilson et al. REWETTED IRISH PEATLANDS FOR CLIMATE CHANGE MITIGATION
Small-scale rehabilitation test areas were enable examination of the effect of rewetting on
established at the site between 1996 and 2002 and, GHG exchange, each plot was delineated with a
following the cessation of peat extraction in 2002, a 60 cm square stainless steel collar inserted into the
larger-scale rehabilitation plan was implemented in peat to a depth of 30 cm. A wooden boardwalk was
a sequential fashion across the peatland. The plan built to minimise damage to the vegetation and to
involved the use of bulldozers and excavators to avoid compression of the peat during observations.
block drains and create peat ridges resulting in a In order to incorporate the seasonal dynamics of the
number of significant changes: (1) a rise in the water vegetation into C gas exchange models, a green area
table level over large areas of the peatland, index (GAI) was estimated for each of the sample
(2) the creation of areas of open water and plots. This involved measuring the green
(3) recolonisation of the bare peat substrate by a photosynthetic area of all vascular plants within the
range of vascular-plant and moss communities. sample plot at monthly intervals. Moss cover was
Initial re-colonisation was dominated by Juncus estimated twice during each year. Species-specific
effusus (soft rush), which in turn has facilitated the model curves were applied to describe the
establishment of moss species such as Polytrichum phenological dynamics of the vegetation of each
commune and Sphagnum cuspidatum (Farrell & plot, and the models (vascular plants and moss)
Doyle 2003, Fallon et al. 2012). In the wetter parts were summed to produce a plot-specific GAI. For a
of the site, Eriophorum angustifolium (bog cotton) detailed description of the method see Wilson et al.
is widespread either as a pure stand or growing with (2007).
Sphagnum cuspidatum. The areas of open water and
bare peat are decreasing annually as a result of rapid Environmental variables
re-colonisation. On the drier edges of the site and A perforated PVC pipe (dipwell) (60 cm long, 2 cm
along the peat ridges, Pinus contorta (lodgepole diameter) was inserted vertically into the peat
pine), Calluna vulgaris (heather) and Rhododendron adjacent to each sample plot to measure water table
ponticum (common rhododendron) are present. level (WT). Data loggers (Micrologger Model 4R,
Zeta-tec, Durham, UK) were established within bare
Vegetation peat and Sphagnum microsites and recorded hourly
Following a visual survey of the site to identify the soil temperatures at 5, 10 and 20 cm depths. A
main microsite types (Table 1), 12 permanent weather station (WatchDog Model 2400, Spectrum
sample plots were established within the following Technologies Inc., Illinois, U.S.A) was established
vegetation types: (1) Juncus effusus-Sphagnum within a Juncus-Sphagnum microsite and
cuspidatum dominated communities (n=3); programmed to record photosynthetic photon flux
(2) Sphagnum cuspidatum dominated communities density (PPFD, µmol m-2 s-1) every ten minutes
(n=3); (3) Eriophorum angustifolium dominated using Spec 8 Pro software (Spectrum Technologies
communities (n=3); and (4) bare peat (n=3). To Inc., Illinois, USA).
Table 1. Species composition of the vegetation characterising the four main microsite types identified on
rewetted and bare industrial cutaway at Bellacorick.
Microsite name Dominant plant species Other plant species
Polytrichum commune
Hydrocotyle vulgaris
Juncus effusus
(1) Juncus – Sphagnum Eriophorum angustifolium
Sphagnum cuspidatum
Juncus bulbosus
Sphagnum capillifolium
(2) Sphagnum Sphagnum cuspidatum Eriophorum angustifolium
(3) Eriophorum Eriophorum angustifolium Polytrichum commune
(4) Bare peat - -
Mires and Peat, Volume 11 (2013), Article 01, 1–22, http://www.mires-and-peat.net/, ISSN 1819-754X
© 2013 International Mire Conservation Group and International Peat Society 5D. Wilson et al. REWETTED IRISH PEATLANDS FOR CLIMATE CHANGE MITIGATION
CO2 flux measurements CH4 and N2O flux measurements
CO2 fluxes were measured from November 2008 to CH4 and N2O fluxes were measured at monthly
December 2011 at fortnightly (summer months) to intervals using the static chamber method, which
monthly (winter months) intervals using the static consisted of an opaque, polycarbonate chamber
chamber method (Alm et al. 2007), generally (60 × 60 × 25 cm) equipped with a battery-operated
between 8 a.m. and 6 p.m. Instantaneous net eco- fan which mixed the air within the chamber
system exchange (NEE) was measured over a range headspace. Four 50 ml samples were withdrawn into
of PPFD (µmol m-2 s-1) values using a transparent 60 ml polypropylene syringes from the chamber
polycarbonate chamber (60 × 60 × 33 cm). For each headspace at 5-minute intervals over a 20-minute
measurement, the chamber was placed in a water- period. The measurement period was increased to
filled channel at the top of the collar and CO2 40 minutes during wintertime when low fluxes were
concentration (ppmv) in the chamber headspace was expected (Laine et al. 2007b). During each
measured at 15-second intervals over a period of measurement, air temperature inside the chamber,
60–180 seconds using a portable CO2 analyser soil temperature (at 5, 10 and 20 cm depths) and WT
Photo: David Wilson
(EGM-4) (PP Systems, UK). PPFD was measured were recorded at each collar. The CH4 and N2O
by a quantum sensor (PAR-1, PP Systems) located concentrations of the gas samples were measured in
at the top of the chamber. At the same time, air a gas chromatograph with attached auto-sampler
temperature (°C) within the chamber was recorded. unit (Shimadzu GC-2014, LAL, Gottingen,
Concurrently with the chamber measurements, soil Germany) within 24 hours of collection, using a
temperature (at 5, 10 and 20 cm depths) was flame ionisation detector (FID) and an Electron
recorded at each collar with a soil temperature probe Capture Detector (ECD). Detector temperatures
(ELE International, UK) and water table level (WT) were 200 °C (FID) and 310 °C (ECD) and the oven
in the dipwell, relative to the soil surface, was temperature was 70 °C (Loftfield et al. 1997).
measured manually with a water level probe Nitrogen was used as the carrier gas (22 ml min-1).
(Eijkelkamp Agrisearch Equipment, The The CH4 (1.8, 3.99 and 10 ppm) and N2O (0.30,
Netherlands). Following each NEE measurement, 0.80 and 9.96 ppm) standards were supplied by
the chamber was vented for a short time by BOC Gases Ireland Ltd. Gas peaks were integrated
removing it from the collar in order to ensure using Peak Simple software (SRI Inc. Silicon
equilibration of the gas concentration. The chamber Valley, California, USA). Fluxes (mg m-2 h-1) were
was then replaced in the collar and covered with a calculated from the linear change in gas
white lightproof cover, and the CO2 measurements concentration as a function of time, chamber
were repeated in order to provide an estimate of volume, collar area and air temperature. A flux was
ecosystem respiration (Reco). Flux rates (mg CO2 accepted if the coefficient of determination (r2) was
m-2 h-1) were calculated from the linear change in at least 0.90. Positive values indicated losses of CH4
CO2 concentration in the chamber headspace over and N2O to the atmosphere, and negative flux values
time with respect to the chamber volume, collar area indicated CH4 and N2O uptake.
and air temperature. A positive flux indicated a net
loss of CO2 from the peatland and a negative value GHG flux modelling
indicated a net uptake of CO2. An estimate of gross PG, Reco and CH4 were parameterised separately for
photosynthesis (PG) was calculated as the sum of each microsite. Model parameters were estimated
NEE and Reco values (Alm et al. 2007). using the Levenberg-Marquardt multiple non-linear
A flux was accepted if the coefficient of regression technique (SPSS, Version 15.0 for
determination (r2) was at least 0.90. Exceptions Windows, SPSS Inc. Chicago. USA). One-third of
were made in cases where the flux was close to zero the data was randomly removed from all datasets
(mainly in winter when soil/plant processes are and used to independently test the models.
typically slower and the r2 is always low; Alm et al.
2007). In these cases (~5 % of all measurements), Gross photosynthesis (PG)
the flux data were examined graphically and fluxes In the PG models, we used PPFD, GAI and water
with obvious non-linearity (due to chamber leakage, table level (WT) as explanatory variables. Only
fan malfunction etc.) were discarded. The remainder those variables that increased the explanatory power
were accepted provided that some of the of the model were included. The residuals of each
environmental variables measured at the same time model were evenly distributed along the range of
(e.g. soil temperature, PPFD, GAI) were sufficiently explaining variables. Model evaluation was based
low to account for the low flux values. on the following criteria: (a) statistically significant
Mires and Peat, Volume 11 (2013), Article 01, 1–22, http://www.mires-and-peat.net/, ISSN 1819-754X
© 2013 International Mire Conservation Group and International Peat Society 6D. Wilson et al. REWETTED IRISH PEATLANDS FOR CLIMATE CHANGE MITIGATION model parameters (p
D. Wilson et al. REWETTED IRISH PEATLANDS FOR CLIMATE CHANGE MITIGATION

Global Warming Potential (GWP)                             and soil temperatures. Peak values occurred in mid-
In order to calculate the Global Warming Potential         summer before decreasing during the autumn with
(GWP) (t CO2-eq ha-1 yr-1), the annual CO2-C, CH4-         the onset of senescence. Throughout the winter
C and N2O-N balances calculated for each microsite         months, GAI values remained well above zero,
(Table 2) were firstly converted to CO2, CH4 and           indicative of the presence of evergreen plant species
N2O by multiplying them by 3.667, 1.334 and 1.571          in all microsites. The highest variation in GAI
respectively. The GWP was then calculated for each         occurred within the Eriophorum microsite with very
of the microsites by multiplying the converted             little variation observed in the Sphagnum microsite.
annual balances by 1, 25 and 298 for CO2, CH4 and
N2O respectively (100-year horizon, IPCC 2007).            GHG exchange models
Negative GWP values indicate a net cooling effect          The strength of the relationship between the GHG
on the climate and positive GWP values indicate a          fluxes and the environmental variables varied
net warming effect.                                        between the microsites. The strong relationships
                                                           between gross photosynthesis (PG), PPFD and GAI
                                                           for all the vegetated microsites explained 55–74 %
RESULTS                                                    of the variance in Juncus-Sphagnum and Sphagnum
                                                           and 74 –82 % for Eriophorum. With incorporation
Environmental variables                                    of WT (Equation 1), the improved performance of
Photosynthetic photon flux density (PPFD) values           the PG model explained 65–79 % of the variance for
exhibited strong diurnal and seasonal variation            the Juncus–Sphagnum microsite. No statistically
(Figure 4a). Daily PPFD values were generally              significant relationship between PG and WT was
highest in the period from midday to 2 p.m. and            observed for the other microsites. A strong
lowest at night (zero). Seasonally, PPFD increased         relationship between ecosystem respiration (Reco),
steadily from January, peaked in mid-June (~2000           T5cm and WT was observed at all microsites and
µmol m-2 sec-1) and declined towards December.             explained 55–77 % of the variance. CH4 fluxes were
Annual PPFD was similar in 2009 and 2011 and               strongly correlated (r2 = 0.61–0.77) with the soil
6 % higher in 2010. During the period of the study,        temperature at 10 cm depth (T10cm) and WT
the mean annual air temperature was 10.5 °C, which         (Equation 6) or GAI (Equation 7). For bare peat,
is a deviation from the long-term average value by         monthly mean CH4 fluxes were calculated and
+9 %. Annual rainfall was 1326 mm in 2009,                 integrated over each 12-month study period because
1125 mm in 2010 and 1376 mm in 2011 (Met                   no statistically significant correlation with any
Éireann, Belmullet Station) representing deviations        environmental variable was identified. N2O fluxes
from the long-term average value by +16 %, -1.6 %          were negligible and below the detection level of the
and +20 % respectively (Figure 4b). Soil temp-             equipment throughout the study period (data not
eratures reached maxima of around 18 °C in mid-            shown).
summer 2009 and 2010 and 15 °C in 2011, and a                  The correspondence between observed and
minimum of -1 °C in December 2010 (Figure 4c).             modelled PG and Reco was good for Juncus-
    WT was relatively constant in all the microsites       Sphagnum and Sphagnum but there was more
throughout the three years of the study (Figure 5).        variation within the Eriophorum dataset, particularly
For the vegetated microsites, the water table was          at higher PG values (Figure 7). In contrast, modelled
above the peat surface throughout the study with the       CH4 fluxes showed very good agreement with
exception of a period in mid-summer 2010 when              observed fluxes in Eriophorum microsites and
WT decreased sharply. The largest decrease was             displayed more variation at higher fluxes in the
observed in the bare peat microsite where WT               other two vegetated microsites.
dropped to -40 cm in mid-summer 2010. Highest
mean annual WT was observed in the Sphagnum                GHG exchange
microsite in each year (12.5, 9.5 and 13.2 cm),            A strong seasonality in modelled PG, Reco and NEE
followed by the Juncus-Sphagnum (5.6, 3.5 and              was evident for the vegetated microsites throughout
7.1 cm), Eriophorum (6.3, 6.0 and 7.4 cm) and bare         the study (Figure 8). Maximum monthly values
peat (-0.4, -3.9 and -0.4 cm) microsites (Table 2).        were reached in the summer months (May to
                                                           August) and the lowest monthly values were
Vegetation dynamics                                        observed in the winter period (November to
A strong seasonal variation in GAI was apparent in         February). PG values remained above zero during
all microsites throughout the duration of the study        the winter months in all years and PG values were
(Figure 6). Plant growth increased during the              relatively similar across all years. In contrast, Reco
springtime in response to increased PPFD values            displayed considerable inter-annual variation in all

      Mires and Peat, Volume 11 (2013), Article 01, 1–22, http://www.mires-and-peat.net/, ISSN 1819-754X
                 © 2013 International Mire Conservation Group and International Peat Society                  8
D. Wilson et al. REWETTED IRISH PEATLANDS FOR CLIMATE CHANGE MITIGATION
2500
(a)
2000
PPFD (umol m sec )
-1
1500
-2
1000
500
0
250
(b)
30 year average
200
Rainfall (mm)
150
100
50
0
20
(c)
15
Soil temperature ( C)
o
10
5
0
J F MAM J J A S O N D J F MAM J J A S O N D J F MAM J J A S O N D
2009 2010 2011
Figure 4. Climate data for Bellacorick, Co. Mayo in 2009, 2010 and 2011. (a) Photosynthetic Photon Flux
Density (PPFD, µmol m-2 s-1); (b) monthly rainfall (mm) (Met Éireann Belmullet Station); and (c) soil
temperature (°C) at 5 cm depth.
microsites. Higher Reco values were observed in were net monthly CO2-C sinks (i.e. negative NEE)
summer 2010 in all microsites, driven by a with the exception of the mid-summer period in
combination of low water tables and sustained 2010 (all microsites) and the October–December
higher soil temperatures. All vegetated microsites 2011 period (Eriophorum microsite).
Mires and Peat, Volume 11 (2013), Article 01, 1–22, http://www.mires-and-peat.net/, ISSN 1819-754X
© 2013 International Mire Conservation Group and International Peat Society 9D. Wilson et al. REWETTED IRISH PEATLANDS FOR CLIMATE CHANGE MITIGATION
20
Water table (cm)
0
Juncus-Sphagnum
-20
Sphagnum
Eriophorum
-40 Bare peat
-60
J F M A M J J A S O N D J F M A M J J A S O N D J F M A M J J A S O N D
2009 2010 2011
Figure 5. Water table level (WT, cm) in Juncus-Sphagnum, Sphagnum, Eriophorum and bare peat microsites.
Positive values indicate water table above the peat surface (dotted line). For clarity, values for one sample
plot per microsite are shown. The replicates showed similar dynamics (not significantly different).
Table 2. Mean annual water table level (WT, cm), minimum and maximum values shown in parentheses;
annual NEE (g CO2-C m-2 yr-1); annual CH4 (g CH4-C m-2 yr-1); N2O; and GHG balance (g C m-2 yr-1) for the
microsites of rewetted and bare cutaway at Bellacorick for 2009, 2010 and 2011. Standard deviation of the
mean (n=3) in parentheses. Positive WT values indicate that the water table is above the peat surface.
Negative NEE values indicate net CO2-C uptake by the peatland and positive CH4 values indicate CH4-C
emissions to the atmosphere.
Microsites
Year Bare peat Juncus-Sphagnum Sphagnum Eriophorum
WT -0.4 (-19–5) 5.6 (- 4 –10.5) 12.5 (8–16) 6.3 (-9–14)
NEE 38.6 (5.4) -142.8 (8.8) -106.8 (3.6) -587.9 (161)
2009 CH4 0.11 9.85 (0.16) 12.27 (0.30) 5.4 (1.4)
N2O 0 0 0 0
GHG 38.7 (6.2) -132.9 (8.7) -94.5 (3.7) -582.6 (159.3)
WT -3.9 (-40–5) 3.5 (-29–8.5) 9.5 (-11–20) 6 (-18–20)
NEE 81.6 (20.7) -43.1 (38.8) -13.9 (49.2) -150.9 (86.9)
2010 CH4 0.11 7.8 (0.10) 9.1 (0.1) 5.3 (1.4)
N2O 0 0 0 0
GHG 81.7 (20.7) -35.3 (38.7) -4.9 (49.3) -145.6 (85.5)
WT -0.4 (-5–2) 7.1 (4.5–9.5) 13.2 (9–21) 7.4 (2–14)
NEE 37.3 (3.6) -211.2 (46.3) -147.9 (69.1) -305 (89.1)
2011 CH4 0.11 6.8 (0.20) 8.2 (0.6) 5.12 (1.36)
N2O 0 0 0 0
GHG 37.4 (3.59) -204.4 (46.3) -139.8 (68.8) -299.9 (87.7)
Mires and Peat, Volume 11 (2013), Article 01, 1–22, http://www.mires-and-peat.net/, ISSN 1819-754X
© 2013 International Mire Conservation Group and International Peat Society 10D. Wilson et al. REWETTED IRISH PEATLANDS FOR CLIMATE CHANGE MITIGATION
(a) Juncus-Sphagnum
2
GAI (m2 m-2)
1
0
(b) Sphagnum
2
GAI (m m )
-2
2
1
0
(c) Eriophorum
2
GAI (m m )
-2
2
1
0
J F MAM J J A S O N D J F MAM J J A S O N D J F MAM J J A S O N D
2009 2010 2011
Figure 6. Modelled Green Area Index (GAI, m2 m-2) for (a) Juncus-Sphagnum, (b) Sphagnum and
(c) Eriophorum microsites. The black line represents the mean (n=3) GAI for each microsite, and the grey
shaded area represents the standard deviation of the mean.
Considerable spatial and temporal variation was apparent in Sphagnum and Juncus-Sphagnum over
observed in modelled CH4-C fluxes (Figure 9). The the three-year study period. Maximum summer
highest flux values occurred in Sphagnum, followed values were highest in 2009 and lowest in 2011. The
by Juncus-Sphagnum and Eriophorum microsites. strong relationship between CH4 fluxes and WT was
The modelled CH4 fluxes were stongly seasonal particularly clear in the Juncus-Sphagnum microsite,
with the highest values occurring each year in mid- with a sharp reduction in the magnitude of CH4
summer and decreasing over the winter periods. A emissions observed in mid-2010 when the water
strong decrease in modelled CH4 emissions was table level dropped to -30 cm (Figure 5).
Mires and Peat, Volume 11 (2013), Article 01, 1–22, http://www.mires-and-peat.net/, ISSN 1819-754X
© 2013 International Mire Conservation Group and International Peat Society 11D. Wilson et al. REWETTED IRISH PEATLANDS FOR CLIMATE CHANGE MITIGATION
3000 Annual CO2-C, CH4-C and GHG balance
PG The bare peat microsite was a CO2-C and CH4-C
Modelled PG (mg CO2 m-2 hr-1)
source in all years of the study (Table 2). Annual
CO2-C emissions ranged from 37.3 to 81.6 g m-2 yr-1
2000 and annual CH4-C emissions were estimated at
0.11 g m-2 yr-1. All vegetated microsites were CO2-C
sinks over the duration of the study although strong
inter-annual variation was observed in all microsites
1000 (Table 2). Highest annual CO2-C uptake took place
in the Eriophorum-dominated microsite and ranged
from -150.9 g CO2-C m-2 yr-1 in 2010 to -587.9 g
CO2-C m-2 yr-1 in 2009 (Table 2). Lower annual
CO2-C uptake was estimated for Juncus-Sphagnum
0
and Sphagnum microsites, where values ranged
0 1000 2000 3000 from -43.1 to -211.2 and from -13.9 to -147.9 g
Observed PG (mg CO2 m-2 hr-1) CO2-C m-2 yr-1, respectively. All the vegetated
microsites were annual CH4-C sources throughout
1000 the study. The highest emissions occurred in the
Modelled Reco (mg CO2 m hr )
Reco
-1
Sphagnum microsite (8.2–12.3 g CH4-C m-2 yr-1)
followed by Juncus-Sphagnum (6.8–9.95 g CH4-C
-2
m-2 yr-1) and Eriophorum (5.1–5.4 g CH4-C m-2 yr-1).
CH4 emissions at all vegetated microsites were
highest in 2009 and then steadily decreased in
500 subsequent years. N2O fluxes were negligible and
below the detection level of the equipment
throughout the study period (data not shown), and
are assigned values of zero here.
With the exception of bare peat, all microsites
were annual net carbon sinks throughout the study
0 (Table 2), although in 2010 values were close to
0 500 1000 zero in the Sphagnum microsite. The carbon balance
-2 -1 was dominated by NEE in all microsites across the
Observed Reco (mg CO2 m hr )
three years of the study. However, in 2010, NEE
6 uptake was lower in all vegetated microsites and the
Modelled CH4 (mg CH4 m hr )
CH4 relative importance of the CH4-C component
-1
5 increased despite a reduction in CH4-C emissions in
-2
that year.
4
Global warming potential
In 2009, the bare peat (1.45 t CO2-eq ha-1 yr-1) and
3
Sphagnum (0.17 t CO2-eq ha-1 yr-1) microsites had a
net warming effect and the Juncus-Sphagnum
2 (-1.95 t CO2-eq ha-1 yr-1) and Eriophorum (-19.76
t CO2-eq ha-1 yr-1) microsites had a net cooling
1 effect on climate over a 100-year horizon
(Figure 10). In particular, Eriophorum had a strong
0 cooling effect, driven by large NEE and moderate
0 1 2 3 4 5 6 CH4 emissions. In 2010, all microsites except
Eriophorum (-3.77 t CO2-eq ha-1 yr-1), had a net
Observed CH4 (mg CH4 m-2 hr-1) warming effect on the climate (1.02 to 3.03 t CO2-eq
Figure 7. Relationship between observed and ha-1 yr-1) as a consequence of a much reduced NEE
modelled PG, Reco and CH4 fluxes in bare peat (black component in that year. In 2011, all vegetated
circle), Juncus-Sphagnum (white circle), Sphagnum microsites had a net cooling effect (-2.69 to -9.48 t
(grey triangle) and Eriophorum (dark grey circle) CO2-eq ha-1 yr-1) driven by a high NEE component
microsites. and a reduction in CH4 emissions.
Mires and Peat, Volume 11 (2013), Article 01, 1–22, http://www.mires-and-peat.net/, ISSN 1819-754X
© 2013 International Mire Conservation Group and International Peat Society 12D. Wilson et al. REWETTED IRISH PEATLANDS FOR CLIMATE CHANGE MITIGATION
200
(a) Juncus / Sphagnum
-1
g CO2-C m month
100
-2
0
-100 PG
Reco
-200 NEE
200
(b) Sphagnum
-1
g CO2-C m month
100
-2
0
-100
-200
200
(c) Eriophorum
-1
g CO2-C m month
100
0
-2
-100
-200
-300
100
(d) Bare peat
-1
80
g CO2-C m month
60
-2
40
20
0
J F MAM J J A S O N D J F MAM J J A S O N D J F MAM J J A S O N D
2009 2010 2011
Figure 8. Average monthly modelled (± standard deviation) gross photosynthesis (PG), ecosystem respiration
(Reco) and net ecosystem exchange (NEE) (g CO2-C m-2 month-1) for (a) Juncus-Sphagnum, (b) Sphagnum,
(c) Eriophorum and (d) bare peat microsites. Positive values indicate a loss of CO2 to the atmosphere and
negative values indicate CO2 uptake by the peatland. Note differences in scale on y-axis.
Mires and Peat, Volume 11 (2013), Article 01, 1–22, http://www.mires-and-peat.net/, ISSN 1819-754X
© 2013 International Mire Conservation Group and International Peat Society 13D. Wilson et al. REWETTED IRISH PEATLANDS FOR CLIMATE CHANGE MITIGATION
2
-1
g CH4-C m month
-2
1
0
J F MAM J J A S O N D J F MAM J J A S O N D J F MAM J J A S O N D
2009 2010 2011
Figure 9. Average monthly modelled CH4 (g CH4-C m-2 month-1) (± standard deviation) for Juncus-
Sphagnum (black circle), Sphagnum (grey triangle) and Eriophorum (dark grey circle). Positive values
indicate a loss of CH4-C to the atmosphere.
20
2009 2010 2011
yr )
10
-1-1
GWP (tonnes CO2-eq. ha
0
-10
Bare peat
-20 Juncus-Sphagnum
Sphagnum
Eriophorum
-30
Figure 10. Mean Global Warming Potential (GWP, tonnes CO2-eq ha-1 yr-1, 100 year horizon) (± standard
deviation) for the microsites at Bellacorick, Co. Mayo. Positive values indicate that the microsite had a net
warming effect on climate for the period of the study. Negative values indicate that the microsite had a net
cooling effect on climate over the duration of the study.
DISCUSSION The water table in all microsites remained
relatively stable throughout the study. The
Long term monitoring of GHG dynamics in combination of compartmentalisation of the
rewetted industrial cutaway peatlands is essential to peatland surface (Smolders et al. 2003) prior to
assess more accurately (1) the capacity of the rewetting and the high, seasonally persistent rainfall
peatland to sequester C and (2) the inter-annual experienced in this region provide optimal
trends in GHG dynamics. The results presented conditions for water retention in the peatland. The
show that, 7–9 years after rewetting of a highly water table remained above the surface in all
degraded peatland in north-west Ireland, suitable vegetated microsites throughout the study except for
conditions for C sequestration have been created. a sharp drop early in the summer of 2010 (Figure 4),
Mires and Peat, Volume 11 (2013), Article 01, 1–22, http://www.mires-and-peat.net/, ISSN 1819-754X
© 2013 International Mire Conservation Group and International Peat Society 14D. Wilson et al. REWETTED IRISH PEATLANDS FOR CLIMATE CHANGE MITIGATION
which followed a six-month period with lower-than- between the nutrient status and the rate of
average rainfall. At that time, the water table decomposition of the peat (Couwenberg et al.
descended farthest in the bare peat microsites, less 2008, Bayley et al. 2009). The high C:N ratio
in the microsites with vascular plants and least of all measured at the site indicates that the residual
in the Sphagnum microsites, indicating that water peat is nutrient-poor and may result in lower
table fluctuations are better regulated in vegetated microbial decomposition rates and, therefore,
areas. This may in turn reflect some degree of ‘self- lower CO2 production (Francez et al. 2000).
regulation’ attributable to acrotelm formation. Full Even though the rewetted bare peat microsites are
development of the function of the vegetation layer still net C sources, their annual CO2-C (NEE) values
(acrotelm) in limiting the amplitude of water table (Table 2) are considerably lower than those reported
fluctuations is vital to successful restoration of the for drained industrial peatlands (reviewed by Wilson
peatland and especially, in the present context, of its et al. 2012a) but still reflect significant avoided CO2
C sequestration and storage functions. The water emissions. To provide improved estimates of
table must be relatively high and stable to retard the avoided losses at this peatland, CO2 fluxes from
decomposition of dead plant matter (by adjacent drained portions of Bellacorick will be
waterlogging) so that some of it accumulates as new quantified in the next phase of this project.
peat in the underlying catotelm layer (Smolders et In this study, the highest CH4 emissions in each
al. 2002, Lucchese et al. 2012). year occurred within the Sphagnum dominated
The CO2-C sink values presented here are at the microsite, where Eriophorum angustifolium (an
upper range of values reported for rewetted aerenchymatous species) was a minor component,
industrial peatlands in general (Tuittila et al. 1999, rather than in microsites dominated by
Bortoluzzi et al. 2006, Yli-Petäys et al. 2007, aerenchymatous species (Juncus-Sphagnum and
Kivimäki et al. 2008, Waddington et al. 2010) for a Eriophorum). A considerable body of research has
number of reasons. shown that aerenchymatous plant species are
1. In the early successional stages following associated with higher CH4 emissions (e.g. Bubier
rewetting there is a strong increase in the 1995, Frenzel & Karofeld 2000, Leppälä et al. 2011,
microbial (Andersen et al. 2006) and plant Green & Baird 2012) and that Sphagnum species
biomass pools (Lucchese et al. 2010) and, support methanotrophic bacteria communities (e.g.
therefore, a considerable proportion of the CO2- Raghoebarsing et al. 2005, Larmola et al. 2009) and
C that is sequestered annually is likely to be produce lower CH4 emissions (Parmentier et al.
incorporated into these pools. Over longer time 2011). However, a smaller number of studies have
frames, the rate of CO2 sequestration into the reported findings similar to those presented in this
rewetted peatland may slow down (cf. Tuittila et paper and have linked lowered CH4 emissions with
al. 1999, Yli-Petäys et al. 2007) and may slow an increased oxygenated rhizosphere in aerenchym-
towards an equilibrium point in the future at atous plants (e.g. Roura-Carol & Freeman 1999,
which C uptake by the vegetation just balances Dinsmore et al. 2009a, Dinsmore et al. 2009b). Fritz
C losses (decomposition, CH4, DOC) such that et al. (2011) further suggest that a high root biomass
the store of accumulated peat is maintained but in anoxic soils may lead to a greater level of
does not increase any more. oxygenation in the soil beyond the rhizosphere. The
2. The growing season is considerably longer in general decrease in CH4 emissions in the Juncus-
the mild temperate maritime climate of western Sphagnum and Sphagnum microsites over the
Ireland than in boreal climates, so that C uptake duration of this study would suggest evidence of a
by plants can extend through a greater portion of transitory period. The concept of a spike in CH4
each year (Wilson et al. 2007). Moreover, the emissions following rewetting has been advocated
presence of evergreen species such as (Couwenberg et al. 2011) driven by large inputs of
Sphagnum cuspidatum at Bellacorick means that labile organic matter. In light of the fact that CH4
photosynthesis (and hence C uptake) takes place fluxes were not measured in the years immediately
even during the winter months (Figure 8). after rewetting, it is not clear whether the values
3. The relatively low Reco values observed during reported for 2009 represent such a spike in CH4
the study further increase the margin between emissions. While reduced CH4 emissions could be
net C losses and net C gains (Strack & Zuback expected in 2010 when mean water table levels were
2012). Rewetting creates conditions that lead to lower, the continued decrease in annual CH4
a reduction in the aerobic zone within the peat, emissions in 2011 would suggest that the peatland is
lower oxidation rates and, consequently, developing towards values that would be expected
reduced CO2 emissions (Waddington et al. for natural Atlantic blanket bogs (Laine et al.
2010). Also, research has shown a correlation 2007b).
Mires and Peat, Volume 11 (2013), Article 01, 1–22, http://www.mires-and-peat.net/, ISSN 1819-754X
© 2013 International Mire Conservation Group and International Peat Society 15D. Wilson et al. REWETTED IRISH PEATLANDS FOR CLIMATE CHANGE MITIGATION
N2O fluxes were not detected in this study as the returning the peatland to the state that existed
likely consequence of (1) a high C:N ratio in the immediately prior to peat extraction. The vegetation
peatland (Klemedtsson et al. 2005) and (2) removal communities are still not typical of those found in
of nitrogen by vigorously growing vegetation Atlantic blanket bogs of the surrounding region,
communities (Glatzel et al. 2008). However, it is which are characterised by plant species such as
possible that given the size of the chambers used Molinia caerulea and Schoenus nigricans, a low
(60 × 60 × 25 cm) and the sampling period cover of Calluna vulgaris and a lesser cover of
employed (20–40 mins) we might not have detected Sphagnum species relative to Irish raised bogs and
very low N2O fluxes. With a GWP value of 298 mountain blanket bogs (Farrell & Doyle 2003,
(IPCC 2007), even very low emissions of N2O Sottocornola et al. 2008). The current plant
would have some relevance in regard to the climate. communities may represent the early successional
Waterborne C fluxes were not quantified in this stages of the former Atlantic blanket bog - poor fen,
study. Work by Waddington et al. (2008) at a which may in time succeed to more typical bog
restored cutover peatland in Canada estimated the (peat forming) communities (Farrell 2001, Fallon et
annual export of dissolved organic carbon (DOC) at al. 2012). Similarly, while Atlantic blanket bogs
3.4–4.8 g C m-2, with higher exports occurring in have been shown to be modest sinks for CO2-C
wetter years. Furthermore, they estimated DOC (Sottocornola & Kiely 2010, Koehler et al. 2011)
losses from the restored site to be significantly and a low source of CH4-C (Laine et al. 2007b,
lower than losses from an adjacent cutover peatland. Koehler et al. 2011), C gas fluxes at Bellacorick 7–9
However, much higher DOC export values (14–33 g years after rewetting are characterised by large CO2
C m-2 yr-1) have been reported for blanket bogs in sinks and moderately high CH4 sources. Rewetting
Ireland (Koehler et al. 2011) and the UK (Billet et has started a new process, along a new
al. 2010). Given the large GHG fluxes reported developmental trajectory (Vasander et al. 2003). A
here, the DOC component is likely to be of minor number of developmental trajectories with
significance over the short-to-medium term but may implications for C sequestration may develop over
increase in importance over the longer term as the time following the cessation of peat extraction
magnitude of both CO2 and CH4 fluxes could be (Charman 2002). At Bellacorick, the direction of the
expected to decrease. new trajectory will be governed to a large extent by
While studies elsewhere have shown that GWP management and climatic factors. In the absence of
may not be the most appropriate measurement for active restoration measures, the cutaway peatland
assessing the contribution of peatlands to the global that existed prior to rewetting would have continued
climate (Frolking et al. 2006, Frolking & Roulet to be a net CO2 source in the short and medium term
2007), GWP does provide a means to gauge the (Waddington et al. 2001, Wilson et al. 2009) and
climatic impact of restoration actions (Beetz et al. would have a warming effect on the climate (Wilson
2013). In spite of increased CH4 fluxes, rewetting of et al. 2009). This would have decreased slightly
industrial cutaway peatlands can lead to a reduction over time as the more easily decomposable fractions
in GWP compared to the previous drained state of the peat were oxidised. With minimal human
(Wilson et al. 2009) and, in this study, intervention, natural succession would have taken
recolonisation by the vegetation led to a further place and the cutaway at Bellacorick would
reduction in GWP (Figure 10), although the areal probably have been re-colonised by a range of wet
distribution of the various vegetated microsites at grassland and heathland plant species, rather than
the landscape level in regard to overall GWP is wetland/bog species, with extensive pine spread
highly relevant (Strack & Waddington 2007). In this from adjoining plantations (Farrell 2001, Fallon et
study, spatial variation in GWP was evident and the al. 2012). However, GHG flux dynamics under such
vegetated microsites ranged from having a strong a mosaic landscape are not known. For industrial
cooling impact on the climate (Eriophorum) to a cutaways in the Irish midlands (lower annual
slightly warming/neutral/cooling impact (Juncus- precipitation, nutrient-rich peatlands), natural
Sphagnum, Sphagnum). The key driver of GWP is colonisation with no active rewetting has generally
the relative strengths of CO2 and CH4 fluxes during resulted in the establishment of birch/willow scrub
the particular developmental stage of the peatland (Renou et al. 2006) and studies have shown that
(Frolking et al. 2006, Frolking & Roulet 2007) and these ecosystems are likely to be large net C gas
while the CO2 component changed somewhat sources, primarily as a consequence of high soil CO2
unpredictably from year to year in all microsites, the emissions and low primary productivity (von Arnold
relative impact of the CH4 component became et al. 2005, Byrne et al. 2007).
progressively lower. If annual precipitation were to increase over the
Rewetting at Bellacorick has not succeeded in next decades then it is possible that this peatland
Mires and Peat, Volume 11 (2013), Article 01, 1–22, http://www.mires-and-peat.net/, ISSN 1819-754X
© 2013 International Mire Conservation Group and International Peat Society 16D. Wilson et al. REWETTED IRISH PEATLANDS FOR CLIMATE CHANGE MITIGATION
would continue along a developmental trajectory meeting in Cancún, Mexico (December 2010),
culminating in the type of Atlantic blanket bog unanimity was reached among Land Use, Land Use
ecosystem that was present before the Change and Forestry (LULUCF) negotiators on the
commencement of milled peat production. Climate definition and content of a new activity under the
modelling exercises have predicted that precipitation Kyoto Protocol, called “rewetting and drainage”.
distribution and frequency will change in Ireland Furthermore, the utilisation of rewetted peatlands in
over the coming decades and that the Bellacorick voluntary C offset projects has been made possible
area will experience higher levels of precipitation in by the Verified Carbon Standard Program (VCS) in
the decades ahead (Sweeney et al. 2008). During the Peatland Rewetting and Conservation
this study, the region experienced the seventh and (PRC)/Wetland Restoration and Conservation
eighth wettest years since 1957 and this (WRC) modules of its AFOLU Guidelines (Verified
undoubtedly contributed to the sustained high water Carbon Standard 2012). The voluntary and
tables observed at the study site and the subsequent mandatory C trading schemes that are currently in
high rates of C sequestration. However, if rainfall operation imply that C, both stored and annually
frequency and distribution are below the long-term sequestered, could have an economic and tradable
average, and the first six months of 2010 provide a value if they can be accurately reported and verified
good example of this scenario, it is likely that the (Galatowitsch 2009, Joosten & Couwenberg 2009,
strength of the C sink function will be reduced Worrall et al. 2009). Given the considerable C
through increased rates of Reco (Figure 8). savings achieved in the years since rewetting at
Furthermore, prolonged periods of drought would Bellacorick, the potential of rewetted industrial
result in a shift from wet, peat-forming conditions, peatlands as C offset projects is good provided
with the vegetation dominated by Eriophorum and (1) the rewetting process is as successful on
Sphagnum communities, to dry heathland and/or damaged peatlands elsewhere and (2) the price of C
acid grassland with pines expanding their range on traded on the markets is attractive.
the drier peat areas. Extensive tree colonisation
would in turn lead to a further drying of the peatland
through increased evapotranspiration rates and result CONCLUSION
in increased soil CO2 emissions.
Jones et al. (2006) have predicted that around Rewetting of industrial cutaway peatlands offers a
40 % of Irish peatlands could disappear over the number of important benefits in terms of GHG
coming decades as a consequence of climate exchange. Firstly, the re-establishment and, more
change. More recent climate envelope modelling importantly, maintenance of hydrological conditions
exercises have predicted that there will be a severe characteristic of natural peatlands leads to a
decline in the area of blanket peatlands in the British reduction in CO2 emissions from the peat and to a
Isles by 2080 as a result of increased global potential C saving or avoided loss. Furthermore, the
temperatures (Gallego-Sala et al. 2010, Gallego- re-establishment of the C sequestration capacity of
Sala & Prentice 2013) and under increased GHG the peatland through re-colonisation by appropriate
emissions scenarios (Clark et al. 2010). Given that vegetation communities may further enhance C
degraded peatlands are likely to be more vulnerable storage. This three-year study has highlighted the
to external changes than natural peatlands, well- importance of long-term GHG monitoring in order
informed management decisions will be critical in to assess more accurately the capacity of peatland to
maintaining optimal conditions for C sequestration. sequester C. The advantages offered by climate on
These may involve removing colonising trees to the west coast of Ireland (persistent rainfall, cool
prevent increased evapotranspiration rates and temperatures), coupled with an inherently nutrient-
subsequent drying-out of the peatland, preventing poor peat substrate mean that rewetted industrial
unauthorised public access to the site, and the cutaway peatlands in this region could be a prime
maintenance of dams and bunds (Schumann & location for climate change mitigation.
Joosten 2008).
Rewetting of drained peatlands as a climate
mitigation action has been addressed in the United ACKNOWLEDGEMENTS
Nations Framework Convention on Climate Change
(UNFCCC) and Inter-Governmental Panel for The project was funded by the Environmental
Climate Change (IPCC) and good practice guidance Protection Agency, Ireland, under the Climate
methodologies for assessing GHG fluxes on Change Research Programme (Project code: 2007-
rewetted organic soils are currently under CCRP-1.6) and by Bord na Móna, Ireland. This
development (IPCC 2012). At the UNFCCC article arises from a presentation at the 14th
Mires and Peat, Volume 11 (2013), Article 01, 1–22, http://www.mires-and-peat.net/, ISSN 1819-754X
© 2013 International Mire Conservation Group and International Peat Society 17D. Wilson et al. REWETTED IRISH PEATLANDS FOR CLIMATE CHANGE MITIGATION
International Peat Congress held in Stockholm, methane emission and hydrochemical gradients
Sweden in June 2012 (Wilson et al. 2012b). Thanks in northern peatlands. Journal of Ecology, 83,
to Rick Bourbonnière and an anonymous referee for 403–420.
insightful comments on a previous version of the Byrne, K.A., Cabral, R., Pöllänen, M. & Farrell,
manuscript. E.P. (2007) Natural regeneration. In: Wilson, D.
& Farrell, E.P. (eds.) CARBAL. Carbon Gas
Balances in Industrial Cutaway Peatlands in
REFERENCES Ireland. University College Dublin, 15–17.
Campbell, D.R., Lavoie, C. & Rochefort, L. (2002)
Alm, J., Shurpali, N.J., Tuittila, E.-S., Laurila, T., Wind erosion and surface stability in abandoned
Maljanen, M., Saarnio, S. & Minkkinen, K. milled peatlands. Canadian Journal of Soil
(2007) Methods for determining emission factors Science, 82, 85–95.
for the use of peat and peatlands—flux Campeau, S., Rochefort, L.& Price, J.S. (2004) On
measurements and modelling. Boreal the use of shallow basins to restore cutover
Environment Research, 12, 85–100. peatlands: plant establishment. Restoration
Alm, J., Talanov, A., Saarnio, S., Silvola, J., Ikkonen, Ecology, 12(4), 471–482.
E., Aaltonen, H., Nykänen, H. & Martikainen, Charman, D. (2002) Peatlands and Environmental
P.J. (1997) Reconstruction of the carbon balance Change. John Wiley & Sons, Chichester. 301 pp.
for microsites in a boreal oligotrophic pine fen, Clark, J.M., Gallego-Sala, A.V., Allott, T.E.H.,
Finland. Oecologia, 110, 423–431. Chapman, S.J., Farewell, T., Freeman, C.,
Andersen, R., Francez, A.-J. & Rochefort, L. (2006) House, J.I., Orr, H.G., Prentice, I.C. & Smith, P.
The physicochemical and microbial status of a (2010) Assessing the vulnerability of blanket
restored bog in Québec: Identification of relevant peat to climate change using an ensemble of
criteria to monitor success. Soil Biology and statistical bioclimatic envelope models. Climate
Biochemistry, 38, 1375–1387. Research, 45, 131–150.
Augustin, J., Merbach, W. & Rogasik, J. (1998) Connolly, J. & Holden, N.M. (2009) Mapping peat
Factors influencing nitrous oxide and methane soils in Ireland: updating the derived Irish peat
emissions from minerotrophic fens in northeast map. Irish Geography, 42(3), 343–352.
Germany. Biology and Fertility of Soils, 28(1), Cooper, D.J. & MacDonald, L.H. (2000) Restoring
1–4. the vegetation of mined peatlands in the
Basiliko, N., Blodau, C., Roehm, C., Bengtson, P. & Southern Rocky Mountains of Colorado, U.S.A.
Moore, T. (2007) Regulation of decomposition Restoration Ecology, 8(2), 103–111.
and methane dynamics across natural, Couwenberg, J. (2009) Methane Emissions from
commercially mined, and restored northern Peat Soils (Organic Soils, Histosols). Facts,
peatlands. Ecosystems, 10(7), 1148–1165. MRV-ability, Emission Factors. Wetlands
Bayley, S.E., Thormann, M.N. & Szumigalski, A.R. International, Ede, 14 pp.
(2009) Nitrogen mineralization and Couwenberg, J., Augustin, J., Michaelis, D. &
decomposition in western boreal bog and fen Joosten, H. (2008) Emission Reductions from
peat. Ecoscience, 12(4), 455–465. Rewetting of Peatlands. Towards a Field Guide
Beetz, S., Liebersbach, H., Glatzel, S., Jurasinski, for the Assessment of Greenhouse Gas Emissions
G., Buczko, U. & Höper, H. (2013) Effects of from Central European Peatlands. Duene
land use intensity on the full greenhouse gas Greifswald/RSPB, Sandy, 28 pp.
balance in an Atlantic peat bog. Biogeosciences, Couwenberg, J. & Fritz, C. (2012) Towards
10, 1067–1082. developing IPCC methane 'emision factors' for
Billet, M.F., Charman, D.J., Clark, J.M., Evans, peatlands (organic soils). Mires and Peat,
C.D., Evans, M.G., Ostle, N.J., Worrall, F., 10(03), 1–17.
Burden, A., Dinsmore, K.J., Jones, T., Couwenberg, J., Thiele, A., Tanneberger, F.,
McNamara, N.P., Parry, L., Rowson, J.G. & Augustin, J., Bärisch, S., Dubovik, D.,
Rose, R. (2010) Carbon balance of UK Liashchynskaya, N., Michaelis, D., Minke, M.,
peatlands: current state of knowledge and future Skuratovich, A. & Joosten, H. (2011) Assessing
research challenges. Climate Research, 45, 13–29. greenhouse gas emissions from peatlands using
Bortoluzzi, E., Epron, D., Siegenthaler, A., Gilbert, vegetation as a proxy. Hydrobiologia, 674(1),
D. & Buttler, A. (2006) Carbon balance of a 67–89.
European mountain bog at contrasting stages of Dinsmore, K.J., Skiba, U.M., Billett, M.F. & Rees,
regeneration. New Phytologist, 172(4), 708–718. R.M. (2009a) Effect of water table on
Bubier, J.L. (1995) The relationship of vegetation to greenhouse gas emissions from peatland
Mires and Peat, Volume 11 (2013), Article 01, 1–22, http://www.mires-and-peat.net/, ISSN 1819-754X
© 2013 International Mire Conservation Group and International Peat Society 18You can also read