Citizen science and niche modeling to track and forecast the expansion of the brown marmorated stinkbug Halyomorpha halys (Stål, 1855) - Nature
←
→
Page content transcription
If your browser does not render page correctly, please read the page content below
www.nature.com/scientificreports
OPEN Citizen science and niche modeling
to track and forecast the expansion
of the brown marmorated stinkbug
Halyomorpha halys (Stål, 1855)
Jean‑Claude Streito1, Marguerite Chartois1, Éric Pierre1, François Dusoulier2,
Jean‑Marc Armand3, Jonathan Gaudin3 & Jean‑Pierre Rossi1*
Halyomorpha halys (Stål, 1855), the Brown Marmorated StinkBug (BMSB) is a highly successful
invasive species native to eastern Asia that managed to spread into North America and Europe in
recent decades. We set up a citizen science survey to monitor BMSB expansion in France in 2012 and
analyzed the data it yielded between 2012 and 2019 to examine the local expansion of the insect.
These data were gathered with occurrences form various sources (GBIF, literature) to calibrate a
species niche model and assess potential current BMSB range. We evaluated the potential changes
to the BMSB range due to climate change by projecting the model according to 6 global circulation
models (GCM) and the shared socio-economic pathways SSP245 in two time periods 2021–2040 and
2041–2060. Citizen science allowed to track BMSB expansion in France and provided information
about its phenology and its habitat preferences. The model highlighted the potential for further range
expansion in Europe and illustrated the impact of climate change. These results could help managing
the current BMSB invasion and the framework of this survey could contribute to a better preparedness
of phytosanitary authorities either for the BMSB or other invasive pests.
The number and the geographical distribution of non-indigenous species are increasing worldwide, with no
sign of s aturation1 and although cost estimation is difficult, these alien species are considered to be responsi-
ble for considerable environmental and economic losses w orldwide2. The environmental impact of alien spe-
cies is also expected to increase in the future as a consequence of climate change, human demography and
international trade3. While environmental and socioeconomic impacts of biological invasions have surfaced as
one of the hottest topics, biosecurity has emerged as a general concern4. One important tool of biosecurity is
emergency preparedness and management. It encompasses efficient international coordination of early-warning
systems, introduction prevention, effective response system to control and eradicate, sharing and access to reli-
able information among organizations for efficient surveillance and personnel t raining4–8. One key aspect of the
preventive management of invasions is surveillance and early detection7,9. Crowd-sourced science has proven
to be an effective approach to increased sampling coverage and early detection in a wide variety of life science
disciplines10–13. Volunteers can prospect private spaces and often contribute through collecting data at a scale
that is not allowed by conventional research organisms. Noticeably, crowdsourcing also acts as an educational
tool contributing to improved public awareness, an important aspect to be considered with regards to future
global systems of surveillance7.
An important aspect of preparedness is the knowledge of areas at risk likely to be invaded and how this risk
might change in the future as an effect of the ongoing climate change. Climate suitability (CS) is a straightforward
assessment of the potential distribution of a given species. It is not an assessment of the risk associated with a
non-native species per se, but provides sensible information about the areas offering suitable conditions14,15.
Species Distribution Models (SDM) have long been used to model species climatic niches and identify suitable
areas outside the native range, thus providing interesting hints at where to increase surveillance and public
information16–18. As such, SDM are central tools to official pest risk assessment14 and benefit from citizen sci-
ence that provide large-scale comprehensive datasets needed to calibrate niche m odels19,20. Forecasting climate
change relies on General Circulation Models (GCM) that use a system of mathematical equations capable of
1
UMR CBGP, INRAE, CIRAD, IRD, Montpellier SupAgro, Montpellier, France. 2MNHN, Direction Générale
Des Collections, Paris, France. 3UMR SAVE INRAE Bordeaux Science Agro, ISVV, Bordeaux, France. *email:
Jean-Pierre.Rossi@inrae.fr
Scientific Reports | (2021) 11:11421 | https://doi.org/10.1038/s41598-021-90378-1 1
Vol.:(0123456789)
www.nature.com/scientificreports/
representing the movement of mass and energy across the atmosphere, the ocean and the lands and simulating
the response of global climate to the increasing greenhouse gas e mission15,21. Different GCM are available and
choosing which ones to use has been shown to constitute a very important factor of SDM projection v ariability22,
although it is often overlooked23. As a consequence, it is sensible practice to use more than one GCM to explore
the uncertainty in possible future climates to improve the credibility of impact a nalysis21.
Halyomorpha halys (Stål, 1855), the brown marmorated stinkbug (BMSB) is a typical example of a success-
ful invasive species. It is native to eastern Asia and is common in the temperate regions of China, Japan and the
Republic of K orea24. In recent decades, the BMSB has spread outside its natural range: the first natural breeding
populations of North America were reported in 2001, although it is considered to have been present since at
least 1996. It has since colonized numerous states of the United States of America and Canada. A few years later,
it was detected in Europe (2004) and has since expanded in more than 20 countries from Sweden to Greece and
Spain to Turkey, the South European Territory of Russia (Krasnodar region) and Abkhazia25,26. The BMSB was
recently detected in South America in Chile in 201727. As with other successful invaders, the BMSB is highly
polyphagous and has a vast range of more than 120 wild or cultivated host plant s pecies28. The BMSB is respon-
sible for important damage in agriculture in North America, while its harmfulness in European agriculture has
only been reported r ecently29,30. As a highly polyphagous emerging pest worldwide, the potential geographical
distribution of the BMSB has emerged as an issue of concern and several SDM have been e stablished31–33. They
all indicate that the range of the species is expected to expand in the near future, since not all suitable areas have
yet been colonized.
In the present paper, we focused on the BMSB as a model species and we analyzed the data collected during
two programs of citizen science initiated when the species started to spread in Europe and in France. We explored
the validity of the data, the diversity of the volunteer profiles and the temporal dynamics of their contributions.
The occurrence data were also used, together with additional data available from the Global Biodiversity Infor-
mation Facility (GBIF) and the literature, to calibrate an SDM. This model is thus based on an up-to-date BMSB
dataset and makes use of the newest current and future climate projections. The model predictions were used to
identify suitable areas worldwide. Because preparedness calls for an assessment of the possible evolution of such
categories according to climate change, we used the model to estimate the worldwide potential distribution of
the BMSB according to 6 GCMs and the shared socio-economic pathways SSP245 in the period 2021–2040 and
2041–2060. In so doing, we obtained an assessment of the uncertainty that could be ascribed to GCM differences
regarding the climate descriptors that drive the potential distribution of the species.
Materials and methods
All the data analyses and graphical outputs were done using the R l anguage34.
Occurrence datasets. We collected occurrences from different sources: the international database GBIF
(Global Biodiversity Information Facility: https://www.gbif.org/fr/), French citizen science campaigns sup-
ported by a smartphone application (Agiir by Inrae http://ephytia.inrae.fr/fr/P/128/Agiir and INPN-Espèces
by MNHN: https://inpn.mnhn.fr/espece/jeudonnees/21092), citizen sightings and reports from entomological
associations and naturalists, and data from the literature. These heterogeneous data were carefully examined in
order to check the validity of the occurrences. For all sources, the diagnosis consisted of evaluating (1) the level
of confidence in the taxonomic identification of H. halys and (2) the accuracy of the geographic localization. The
validity of the record date was also checked in the case of citizen contribution. Additional information can be
found in supplementary material and in Figure S1.
Species distribution modelling. Model algorithm. Since we study an organism whose geographical dis-
tribution is rapidly changing because of its expansion, we are in a typical non-equilibrium situation. As a result,
it is particularly difficult to obtain true absences; that is, to identify localities where BMSB is absent because
of non-suitable environmental conditions rather than because of (transient) dispersal limitations35,36. For that
reason, we used a presence-only algorithm and we retained Maxent37–39 because it has been shown to perform
well, including in situations where the aim is to estimate habitat suitability in novel environments (i.e. future
climate conditions)40. Maxent is a general-purpose machine learning method that uses presence points and a set
of background locations that are not interpreted as absences, but rather provide information representing the
range of environmental conditions across the study area37,38.
Environmental datasets. This study is based on climate data available from the worldclim database v2.1
(https://www.worldclim.org/)41. Worldclim provides both average climate values for the period ranging from
1970 to 2000 and yearly data from 2001 to 2018. The latter were averaged to obtain a dataset representative of
the current conditions i.e. 2001–2018. Future climate projections described 2 periods spanning from 2020 to
2060 (2021–2040, 2041–2060). For each period, we considered 6 GCMs: BCC-CSM2-MR42, CNRM-CM6-143,
CNRM-ESM2-144, CanESM545, MIROC-ES2L46, MIROC647 and the shared socio-economic pathways SSP245.
Shared Socioeconomic Pathways (SSPs) are scenarios of projected socioeconomic global changes used to
infer greenhouse gas emissions according to various climate policies. We used SSP245 which is considered as a
scenario of moderate future greenhouse gas emissions. It stabilizes radiative forcing at 4.5 W m−2 in the year 2100
corresponding to an increase of 1.1 °C to 2.6 °C of global mean surface temperature by the end of the twenty-first
century48. The data used in the study corresponded to a resolution of 2.5 min (≈21 k m2 at the equator).
Determining which climate descriptors are most informative and must be used to calibrate a niche model
is both difficult and c hallenging49. We identified a set of climate variables that were a priori good candidates as
they convey thermal constraints in different ways: maximum temperature of warmest month (bio5), minimum
Scientific Reports | (2021) 11:11421 | https://doi.org/10.1038/s41598-021-90378-1 2
Vol:.(1234567890)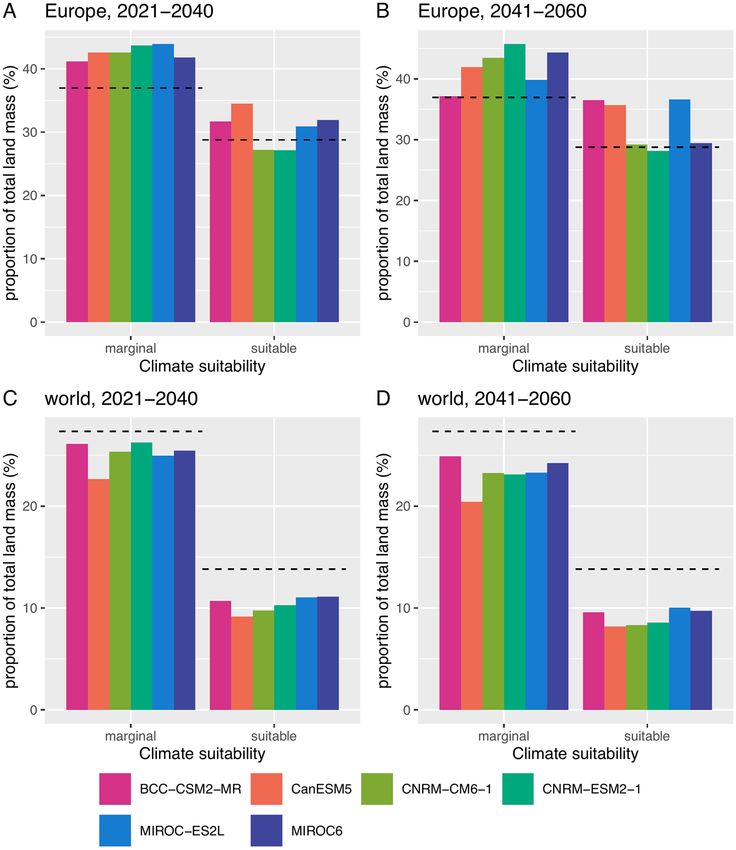
www.nature.com/scientificreports/
temperature of coldest month (bio6), mean temperature of wettest quarter (bio8), mean temperature of driest
quarter (bio9), mean temperature of warmest quarter (bio10) and mean temperature of coldest quarter (bio11).
Variables describing precipitations were not included in our analyses because the observed BMSB distribution
may be partly affected by agricultural irrigation which cannot be accounted for in the available climate datasets.
Some explanatory variables may be collinear with possible effects upon species distribution models. This point
is discussed below.
Occurrence data thinning and background points. Occurrences. The model was calibrated using a subset of
available occurrence data corresponding to the core distribution of the BMSB. We defined three core areas, i.e.
Asia, North America and Europe (Supplementary Figure S2A). The rationale is that occurrences located at the
margin of these areas, although valid, could correspond to unsettled populations or interceptions.
We did not distinguish between occurrences originating from native or invaded ranges because adaptive
shifts occurring in the course of the process of the invasion may change the realized niche allowing invasive
species to spread in areas where climate conditions change from the ones prevailing in the native range17,50. Data
stemming from citizen science and more generally occurrences available for distribution modeling might be
geographically biased if observers do not follow a coordinated spatial sampling plan. We addressed the problem
by pre-processing the data by means of an environmental filtering step (details below). Such procedure is known
to reduce the effects of sampling bias and improve model performances51,52.
Background data. Both the number of background locations and the area within which they are distributed are
known to alter the outputs of the Maxent a lgorithm53. The most common way to distribute background points is
random sampling. Amongst other available strategies49, we retained this procedure because it relies on the least
assumptions about the species distribution and its relationships with e nvironment54. We generated 10,000 ran-
domly distributed background locations within the areas defined as core distribution areas (see Supplementary
Figure S2B) excluding seas, lakes as well as locations where H. halys was present.
Environmental filtering. Our occurrence input dataset originates from heterogeneous sources and is subject
to possible sampling bias which may alter model performances51. We addressed this issue by adopting an envi-
ronmental filtering approach known to perform better than geographic fi ltering52. We performed a Principal
55
Component Analysis (PCA) on the bioclimatic variables recorded at each occurrence point. We divided the
range of the occurrence scores upon the first PCA axis in 50 bins. We used bins of similar amplitude to divide the
range of the scores upon the second axis. The resulting grid was used to thin the occurrences on the basis of the
following rule: when a grid cell contained more than one point, one point was randomly selected and retained
for further analyses56.
Maxent calibration. The Maxent model was calibrated using the R package M IAmaxent57. It implements a
flexible approach to Maxent calibration that allows to select a subset of transformed explanatory variables using
a forward stepwise selection. This results in lower model complexity hence better model g eneralizability58, an
interesting feature in the present study where we project model predictions outside of the spatial or temporal
context of the data59. Five types of transformation were used for bioclimatic variables: linear, monotonous, devia-
tion, forward hinge, reverse hinge and threshold54,60. For spline-type transformations (namely forward hinge,
reverse hinge and threshold) an infinity of transformations is possible and the package MIAmaxent uses 20
for each and retain the ones that best explain the variation in the presence/background data (details in pack-
age documentation). The forward stepwise selection was carried out as a two-steps hierarchical procedure as
detailed in61: first, a selection is performed amongst transformed variables derived from each explanatory vari-
able. Second, explanatory variables represented by the transformed variables from first step explaining a signifi-
cant amount of variation in the response variable under the significance threshold α = 0.001 are selected. At each
step of the selection process, the fraction of deviance explained by the model is computed. It is analogous to
the R2 of least squares regression51. Models are compared using a significance test accounting for sample size61.
Collinearity between explanatory variables is accounted for during the variable selection procedure as indi-
cated in Vollering et al. 2 01957.
Model evaluation. Model performance was assessed using the Continuous Boyce Index62,63 developed with the
aim of evaluating presence-only models. In such situations, using conventional metrics such as the Area Under
the Curve (AUC) of the receiver operating characteristic plot is problematic since they rely on true and false
absences64. The CBI was presented by Hirzel et al.63 and Guisan et al.49. The range of the CS within the study
area is partitioned into N classes. P corresponds to the frequency of occurrences falling into each class while E
corresponds to the expected frequency of points randomly falling into each class. The P/E curve is the plot of
P/E against the CS classes. Hirzel et al.63 indicate that good models lead to monotonically increasing P/E with
increasing CS classes. The CBI is defined as the Spearman-rank correlation between P/E and CS classes, and it
varies from + 1 (perfect prediction) to 0 (randomness) and -1 (counter-prediction).
In addition, the shape of the P/E curve indicates the suitability thresholds that can be used to reclassify CS
maps into a set of several meaningful categories ( see63 for details). Below the CS threshold at which P/E < 1, the
model predicts fewer presences than expected by chance and CS values lower than this threshold correspond
to unsuitable environments. On the contrary, CS values above the threshold at which P/E > 1 denote suitable
conditions63. We also computed the AUC but this evaluation metrics should be interpreted with caution since it
relies on absence locations and uses background points instead.
Scientific Reports | (2021) 11:11421 | https://doi.org/10.1038/s41598-021-90378-1 3
Vol.:(0123456789)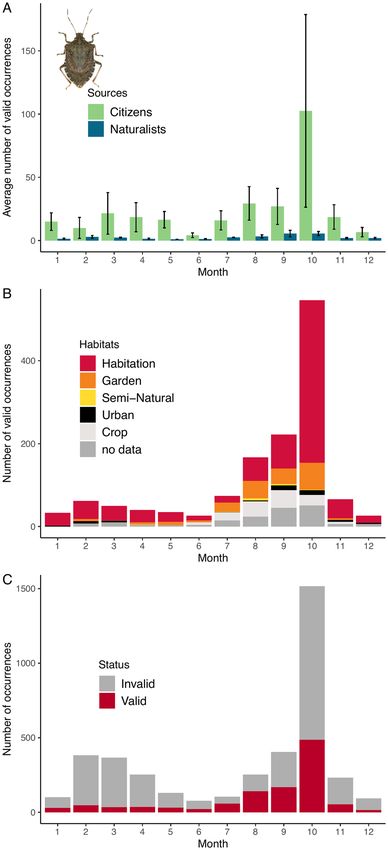
www.nature.com/scientificreports/
Ideally, the model should be evaluated using truly independent observations. In this study, we used the
observations that were discarded during the data thinning process. These occurrences are valid and do not con-
tribute to model calibration. A set of 34 datasets was constituted by randomly selecting 100 occurrence points
(sampling without replacement) within the 3420 points discarded during the thinning process. We computed
the 50% (median), 2.5% and 97.5% quantiles of the resulting P/E curves for each dataset. The CBI was computed
as the Spearman-rank correlation between the values of the median and the values of the CS classes. The 2.5%
and 97.5% quantiles were used to estimate CS thresholds following63.
Future geographical distribution. The model was projected using the data representing possible future climates
for the period 2021–2040 and 2041–2060 and the SSP245. For each period, we computed the median of the
predictions associated the different GCMs (BCC-CSM2-MR, CNRM-CM6-1, CNRM-ESM2-1, CanESM5,
MIROC-ES2L, MIROC6) to derive a consensus model49. The resulting climate suitability maps were reclassified
using the thresholds identified above for current climate conditions.
Results
Occurrence records and citizen science. A total of 9,467 occurrences were obtained from the GBIF
database, of which 6,620 were considered to be valid (69.9%). Because citizen sightings were analyzed year by
year, 2020 data were incomplete at the time of data analysis (mid-2020) and were thus discarded. It should be
noted that citizen reports could be valid according to one criterion e.g. species identification whilst invalid for
another e.g. missing date. As a consequence, the number of occurrences available could be different according
to the question at hand.
A total of 3560 online forms were gathered by the Agiir application including 887 valid BMSB identifications
(24.9%)85. The naturalist application INPN-Espèces gathered 147 valid occurrence data. Additionally, FD and JCS
respectively gathered 74 and 87 reports from naturalist networks. Correct identification of H. halys accounted
for 73% of the naturalist records gathered by JCS. Furthermore, JCS directly collected 377 reports from citizens
off which 186 corresponded to valid identification of the BMSB. An additional 383 occurrences in Asia were
gathered from Zhu31 and 17 supplementary occurrences were mined in the l iterature26,27,65–68.
Figure 1A shows the geographical distribution of both Agiir and INPN-Espèces citizen networks. Overall,
sightings are somewhat homogeneously distributed, although valid records are clearly spatially aggregated and
indicate the clusters of colonized areas. Naturalist sightings are less numerous, but the proportion of valid records
is very high compared to citizen contributions (Fig. 1B). Figure 1C shows the dynamics of the BMSB expansion
across French departments as depicted by citizen science data and GBIF records.
Figure 2A shows the evolution of the total number of valid sightings either from citizens or naturalists. The
number of records from both networks decreased in 2019 but remained much larger than in 2012–2017, and 11
French departments were newly colonized that year (Fig. 1C). Both the number of valid and invalid sightings
increased in 2018 and 2019 while the ratio of valid records decreased (Fig. 2B).
Figure 3A shows the monthly number of valid records (averaged through the years) from Agiir, INPN and the
naturalist network. A marked increase occurs in October which corresponds to the period where BMSB starts to
enter houses in search for an overwintering site. Overall, in France and since 2012, the BMSB has largely been
reported in urban environments (streets, parks, greenings) and in houses and remained rare in semi-natural
areas (Fig. 3B). So far, the species has caused limited crop damage in France. If the number of sightings increases
at the beginning of autumn (Fig. 3C), it concerns both valid and invalid records, possibly due to various species
entering houses including other pentatomids such as the mottled shieldbug Rhaphigaster nebulosa that is com-
monly mistaken for the BMSB in France69. Other pentatomids reported are: Nezara viridula (L., 1758), Dolycoris
baccarum (L., 1758), Palomena prasina (L., 1760) and Pentatoma rufipes (L., 1758). Leptoglossus occidentalis
Heidemann, 1910 (Coreidae) is also frequently signaled.
Occurrence records for niche modeling. A total of 8,387 points corresponding to valid BMSB identi-
fication was available for modelling. Points falling inside the same pixel of the climate raster, points falling into
oceans, points with missing date and points located outside the core areas shown in Figure S2A and S2B were
discarded, leading to a total of 4144 occurrences. Environmental thinning resulted in removing 3420 occur-
rences leading to a final dataset of 724 points (17.47%).
Models calibration and evaluation. The 6 original climate variables (bio5, bio6, bio8, bio9, bio10, bio11)
used as explanatory variables were transformed into 52 derived variables among which 5 were finally selected by
the forward procedure. These transformed variables included 3 deviation-type transformations with parameters
of 2, 0.5 and 2 for bio5, bio8 and bio10 respectively, the variable bio6 after a reverse hinge transformation with a
knot value of 7 and the variable bio8 after a threshold transformation for a knot value of 9. Details can be found
in Vollering et al. 201957 and Phillips and Dudík 200854.
The model was evaluated using the 3,420 occurrences data that were excluded from the calibration dataset
during the thinning process. The P/E curve showed an increasing shape that indicated a well performing model
(Figure S3). The CBI was 0.97 which denoted the good performance of the model. The AUC was 0.838. The
median and its lower and upper bounds (quantiles) are shown in supplementary Figure S3. Two thresholds could
be identified (th1 = 0.244, th2 = 0.49) respectively corresponding to the CS values for which the upper and the
lower bounds reached a P/E > 1. These thresholds were subsequently used to reclassify the CS map as follows:
CS < th1 corresponded to unsuitable climate conditions; th1 ≤ CS < th2 corresponded to marginal climate con-
ditions and CS ≥ th2 indicated suitable climate conditions. We here considered the marginal class to represent
climate suitability slightly higher than 1 in a large proportion of randomizations. This could be interpreted as
Scientific Reports | (2021) 11:11421 | https://doi.org/10.1038/s41598-021-90378-1 4
Vol:.(1234567890)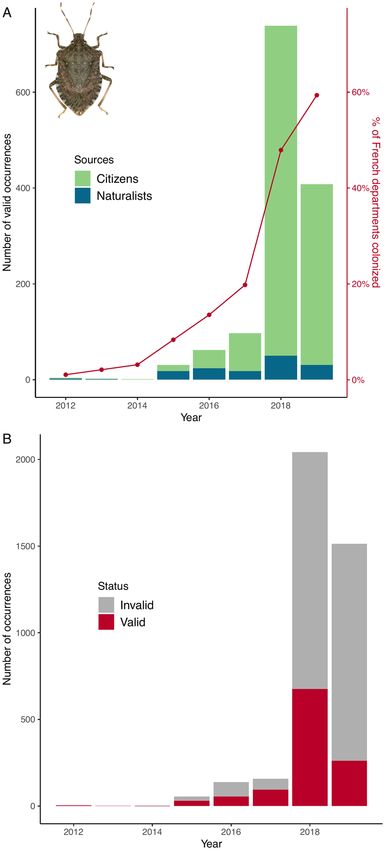
www.nature.com/scientificreports/
Figure 1. Occurrence data for Halyomorpha halys in France according to citizen sources. (A) Distribution
of citizen contribution according to the French networks Agiir (Inrae) and INPN-Espèces (MNHN). (B)
Distribution of sightings from naturalist sources. (C) Geographical expansion of the BMSB in France from 2012
to 2019 according to available data including GBIF sources. Photograph by J.C. Streito/Inrae. The maps were
generated using R 4.0.3 (https://cran.r-project.org/).
Scientific Reports | (2021) 11:11421 | https://doi.org/10.1038/s41598-021-90378-1 5
Vol.:(0123456789)www.nature.com/scientificreports/
Figure 2. Temporal dynamics of the brown marmorated stinkbug H. halys in France as revealed by citizen
contribution. (A) Changes in the number of valid sightings over 8 years of the study. BMSB expansion in France
is illustrated by the proportion of departments colonized. (B) Evolution of the total number of sightings (Agiir
and INPN-Espèces plus additional records from naturalists). Photograph by J.C. Streito/Inrae.
areas where climate conditions are near limiting values such as what could be expected at the margin of the
core geographical distributions. In some cases, spill-over from neighboring suitable sites could maintain local
populations despite barely favorable conditions.
Climate suitability map. Figure 4A shows the Maxent logistic estimation of the climate suitability in
Europe according to current climate conditions. The reclassified suitability map for current conditions is shown
in Fig. 4B. Figure 4C,D illustrate the reclassified predictions for future climate conditions in the period 2021–
2040 and 2041–2060 respectively. Each future projection corresponded to a consensus model computed from
the predictions associated to the 6 GCMs used in the study. Maps showing the worldwide estimations are given
in supplementary material (Figures S4 to S9).
Scientific Reports | (2021) 11:11421 | https://doi.org/10.1038/s41598-021-90378-1 6
Vol:.(1234567890)www.nature.com/scientificreports/
Figure 3. Phenology of the brown marmorated stinkbug H. halys sightings in France. (A) Changes in the
monthly average number of valid occurrences (2012–2019). Error bars depict the standard error i.e. standard
deviation of the mean. (B) Changes in the monthly average number of valid occurrences according to the
habitat where observation was made (see text for details). (C) Changes in the monthly average number of
occurrences (2012–2019). Photograph by J.C. Streito/Inrae.
Scientific Reports | (2021) 11:11421 | https://doi.org/10.1038/s41598-021-90378-1 7
Vol.:(0123456789)www.nature.com/scientificreports/
Figure 4. Potential geographical distribution of the brown marmorated stinkbug H. halys. (A) Climate
suitability estimated by a maxent model according to current climate conditions. (B) Reclassified climate
suitability according to current climate conditions. (C) Reclassified climate suitability for the period 2021–
2040. The underlying climate suitability is a consensus derived for the projections of the model with 6 global
circulation models. (D) Reclassified climate suitability for the period 2041–2060. The underlying climate
suitability is a consensus derived for the projections of the model with 6 global circulation models and the
shared socio-economic pathways SSP245. The maps were generated using R 4.0.3 (https://cran.r-project.org/).
Figure 5 shows the proportion of land surfaces that fall into marginal or suitable categories in the periods
2021–2040 and 2041–2060 according to the SSP245 in Europe and in the world. At the scale of the world, both the
proportion of marginal and suitable areas are expected to decrease in the 2021–2060 and 2041–2060 periods. This
pattern is true whatever the GCM considered. However, in Europe, this trend was not observed and an increase
in marginal and suitable conditions at the expense of unsuitable conditions is expected according to most of the
GCMs. These results indicated that climate change will lead to harsher worldwide climate conditions for BMSB
while a different situation would occur in Europe where better conditions are to be expected.
Scientific Reports | (2021) 11:11421 | https://doi.org/10.1038/s41598-021-90378-1 8
Vol:.(1234567890)www.nature.com/scientificreports/
Figure 5. Proportion of total land mass expressed in percentage that are predicted as marginal or suitable
according to 6 global circulation models and the shared socio-economic pathways SSP245. (A) Estimates for
Europe in 2021–2040. (B) Estimates for Europe in 2041–2060. (C) Worldwide estimation in 2021–2040. (D)
Worldwide estimation in 2041–2060. Dashed lines indicate the proportion of total land mass for current climate
conditions. Europe is delimited by longitudes -15 and 46 and latitudes 34 and 72 decimal degrees.
Discussion
Our results show that citizen science provides valuable data allowing us to characterize the spread of H. halys as
well as understand some important aspects of its biology and track its spread in France. In a recent study, Mais-
trello et al.12,70 came to a similar conclusion in different regions of Italy. Stoeckli et al.71 used records collected in
a citizen science initiative to assess the potential for BMSB spread in Switzerland 15 years after its introduction
and showed that nearly all suitable areas have been colonized. In France, the spread has accelerated in recent
years, with more than 50% of departments colonized between 2018 and 2019. Interestingly, the volunteers differed
in their accuracy of species identification; naturalists were better at identifying the BMSB, while citizens were
prone to confusing it with other insect species such as native stink bugs. However, the large number of records
stemming from non-naturalists compensated for their limited identification skills and led to a large number
of valid sightings in various regions of the country. It must be noted that these data come at the expense of the
important work of sorting and checking the records stored in our databases, highlighting the fact that citizen
science should not be considered as a ‘magic bullet’.
Scientific Reports | (2021) 11:11421 | https://doi.org/10.1038/s41598-021-90378-1 9
Vol.:(0123456789)www.nature.com/scientificreports/
Another interesting outcome of the survey is the possibility of gathering information on the phenology of the
species. This has already been illustrated in the seminal paper by Maistrello et al.70 where the authors reported a
peak in sightings in October in the Emilia Romagna region (Italy). We reported a similar peak in our study. This
pattern is likely to reflect the well-known behavior of the BMSB in which it tends to enter houses and human
installations in the fall to find shelter and then overwinter24. Furthermore, several records indicate that BMSB is
attracted to domestic light, which probably reinforces their taste for b uildings72. The October peak also coincided
with a marked increase in sightings recorded in various habitats that were gathered under the name “houses”
(home, flat, buildings). Overall, the number of sightings increased in the period spanning from August to Octo-
ber. Observations in agricultural areas and urban environments (gardens, parks, streets) occurring during that
period may indicate increased activity at the end of summer and in early fall as pre-overwintering activity. It is
worth noting that although there were more reports in October, it did not yield an increase in valid sightings.
The increase in reports included numerous misidentifications with pentatomids, such as Rhaphigaster nebulosa,
Nezara viridula, Dolycoris baccarum or with the invasive Coreidae Leptoglossus occidentalis, which have similar
behavior and enter human-made structures at the same time of the year. In fact, non-naturalist citizens tend to
report true bugs they observe in their homes or gardens without really considering whether it is BMSB or not.
In addition, a number of citizens report the insects they observe knowing that they are not the proper species.
These forms increase the validation effort, but also provide opportunities to monitor non-target invasive species
that could be detected earlier. An interesting aspect of citizen contribution is that it potentially offers informa-
tion on phenology and behavior within anthropic habitats (e.g. semi-rural habitats, urban areas) where typical
agricultural pests are seldom surveyed. Beyond the specific context of agricultural threats, such data could be
useful to manage the BMSB as a domestic pest, namely in an urban context where it is considered a nuisance72–75.
Because of its behavior and its rather large size, the BMSB is a good example of how citizen science can con-
tribute to studying agricultural pest invasions. Once refined and checked, the datasets may be used to calibrate
expansion models and possibly to monitor population dynamics in various part of the country. Nevertheless,
our results show that it takes several years (2012–2015) for the number of valid sightings to reach more than 10
per year. This reflects the fact that (1) at the beginning of the invasion, the insect density was low and (2) that
volunteers were not well aware of the BMSB. This is mostly true for non-naturalist contributors, while natural-
ists, although much less numerous, contributed to the valid sightings in the early stages of the invasion. In the
specific context of the BMSB expansion in France, we informed citizens as early as possible through various
channels including national publications (in French)69 and continue to do s o76. The initiation of a system that
led to a regular flow of occurrence data took several years. As such, citizen science did not allow for a significant
early warning system per se. However, it did help in monitoring the BMSB expansion after approximately four
years following the launch of the campaign. We postulate that this appears to be the amount of time needed to
either educate and make people aware of the BMSB problem, and/or for the insect population to reach density
levels where its inconvenience generates public attention and willingness to contribute to citizen science projects.
We can consider three main phases in the BMSB invasion during which different actors can be mobilized
for monitoring (1) at the very beginning of the invasion, when the populations of the invasive species are low,
naturalists and official monitoring services who are excellent observers always on the look-out for novelties and
are highly effective in detecting insects that are still rare and difficult to observe (2) when abundance increases,
non-naturalist citizens relay and by their much higher number provide information on the dynamics of the
invasion and indirectly on the level of populations (3) when populations become large enough, agricultural
professionals take over and can accurately assess the levels of population and damage. The growing number
of reports in the fall in homes starting in 2017 is a warning of an increase in BMSB populations. This alert is
important from an agronomical point of view because this species is much more difficult to detect and observe
in crops and natural environments. In 2017, although the number of bugs exploded in homes, they were still
virtually undetected by agricultural professionals, yet extremely mobilized. Although most citizens’ sightings
are recorded in residential districts, they are scattered across the whole country including rural areas where the
presence of the BMSB represents a risk for agriculture.
The worldwide expansion of H. halys has sparkled a great scientific interest for its potential range expansion.
Initiated by Zhu et al.31, various niche models have been developed to assess the areas where climate is suitable for
the species32,see also77,78. Interestingly, both correlative S DM31,77,78 and the Climex mechanistic niche m odel32,33
are globally in agreement and indicate potential further expansion in Europe and north America. While cor-
relative models such as Maxent seek for a link between species distribution records and environmental data,
mechanistic bioclimatic models such as Climex focus on species ecophysiological responses to environmental
variables79.
Our model showed than eastern European countries such as Poland, Czech Republic, Slovakia, Hungary,
Romania, Bulgaria, Moldova, Belarus or Ukraine are at high risk of invasion. Some of these countries have
already reported sightings and the further expansion is very likely. Non-colonized areas exhibiting suitable
climatic conditions are at high risk of being invaded because dispersal limitations are low for the BMSB. Indeed,
hitchhiker pests such as H. halys are mainly driven by human-mediated dispersal as the bug is hidden in vari-
ous transported materials such as luggage, shipping containers, cars, trains or aircraft. One factor limiting phy-
tophagous invasive species establishment is the availability of suitable host plants. In the case of the BMSB, this
constraint is strongly relaxed since the insect is able to feed on a vast array of plants, comprising at least 120 wild
or cultivated species24. Beyond the question of the establishment of the species is whether it would be responsible
for important economic damage or not. In the US, the damage is very important80, while in Europe the first fruit
injury and crop losses have been reported on pear and peach orchards in I taly29,30. Elsewhere in Europe, the
BMSB is mainly a domestic inconvenience so far. In a recent study, Stoeckli et al.71 showed that both the number
of generations per year and the activity periods in spring and late autumn could possibly increase in Switzerland
as a result of climate change. Such changes in population dynamics or phenology could trigger more crop losses
Scientific Reports | (2021) 11:11421 | https://doi.org/10.1038/s41598-021-90378-1 10
Vol:.(1234567890)www.nature.com/scientificreports/
not only in Switzerland but in many European regions. This raises the issue of the climate change impact upon
the future range of the BMSB.
According to our model, the range of the BMSB is expected to change in the coming decades as a conse-
quence of ongoing climate change due to anthropogenic activities. Our projections show that the proportion
of unsuitable land is expected to increase worldwide at the expense of suitable or marginal areas irrespective of
the global circulation models considered. Interestingly, this pattern is not observed equally in all regions of the
world. In Europe, the surface of suitable or marginal conditions is expected to increase in regions such as the
United Kingdom, parts of Scandinavia, Finland, Lithuania, Latvia, Estonia and Russia. These trends are in line
with the estimations of Kistner et al.33 who used Climex and two GCMs. On the other hand, Southern parts of
the continent such as south Spain (part of Andalucia, Castiulle La Mancha, Extremadura, Región de Murcia) are
expected to become unsuitable due to temperature increase. Suitability would also decrease in eastern Greece
albeit to a lesser extent.
Although consistent, the predictions associated with each GCM varied, thus illustrating a well-known source
of uncertainty22,81. GCM differ in the way they associate ocean, land and atmospheric fluxes of energy. In that
way, they are all different, but it is not straightforward to assess the way these differences alter the outputs of the
SDM combining more or less complex relationships between several bioclimatic variables.
There is a great deal of scientific evidence supporting the impact of global changes upon species geographi-
cal distribution. Matching climate velocity requires sufficient dispersal capacities, and not all species are likely
to track the rate of environmental c hange82. Unlike some plants, insects with high dispersal potential such as
the BMSB are very likely to be able to cope with climate velocity83,84. Adaptation is another process by which
species can cope with environmental change, but ecological niche models are based on the assumption of niche
conservatism85 and their outputs should thus be taken with caution in the context of climate change. In particular,
areas considered to become unsuitable in the future may not always lead to range contraction if the BMSB could
adapt to these changes. We do not have any clue as to how the BMSB could adapt to future climate conditions and
thus future range predictions should be taken with caution, keeping in mind that they could be underestimated.
Our model, and more generally all SDM are associated to a certain level of uncertainty chiefly because they
assume that species are at equilibrium with the environment59. However, model predictions constitute valuable
basis for discussion on areas at risk. One possible future action could be to set-up large scale and long-term citizen
science initiatives along with improved information of authorities in areas at risk so as to improve preparedness
through better surveillance and early detection.
Conclusions/highlights
Early detection and tracking could efficiently include a citizen science component. Its deployment requires a
medium- or long-term investment and an important volume of expertise from expert naturalists to process
and check sightings. The behavior of the BMSB makes its sighting by non-expert people easy in autumn but, in
turn, may lead to an urban bias. Citizen science provided consistent data on BMSB expansion, hosts, habitats
and phenology. Species distribution models strengthen risk evaluation, surveillance, the overall preparedness
of authorities and in fine policy. Either estimating current or future conditions, such tools are precious to help
build efficient surveillance and set up early detection programs. Climatically suitable areas for the BMSB are not
yet occupied and will expand in Europe in the future. Apart from Europe, suitable areas will contract in Asia,
North America and in other parts of the world. Using various GCM allowed us to compute a consensus model
that accounts for uncertainty associated with the different climate models.
Data availability
Citizen data are available upon request to the authors. Other occurrences data are available from GBIF.org.
Received: 16 December 2020; Accepted: 26 April 2021
References
1. Seebens, H. et al. No saturation in the accumulation of alien species worldwide. Nat. Commun. 8, 14435 (2017).
2. Diagne, C. et al. InvaCost, a public database of the economic costs of biological invasions worldwide. Sci. Data 7, 277 (2020).
3. Bradshaw, C. J. A. et al. Massive yet grossly underestimated global costs of invasive insects. Nat. Commun. 7, 12986 (2016).
4. Meyerson, L. A. & Reaser, J. K. Biosecurity: moving toward a comprehensive approach. Bioscience 52, 593 (2002).
5. Carvajal-Yepes, M. et al. A global surveillance system for crop diseases. Science 364, 1237–1239 (2019).
6. Torres, A., David, M. & Bowman, Q. Risk management of international trade: emergency preparedness. Rev. Sci. Tech. Off. Int.
Épizooties 21, 493–496 (2002).
7. Ricciardi, A. et al. Invasion science: a horizon scan of emerging challenges and opportunities. Trends Ecol. Evol. 32, 464–474 (2017).
8. Giovani, B. et al. Science diplomacy for plant health. Nat. Plants 6, 902–905 (2020).
9. Reaser, J. K. et al. The early detection of and rapid response (EDRR) to invasive species: a conceptual framework and federal
capacities assessment. Biol. Invasions 22, 1–19 (2020).
10. Delaney, D. G., Sperling, C. D., Adams, C. S. & Leung, B. Marine invasive species: validation of citizen science and implications
for national monitoring networks. Biol. Invasions 10, 117–128 (2008).
11. Crall, A. W. et al. Improving and integrating data on invasive species collected by citizen scientists. Biol. Invasions 12, 3419–3428
(2010).
12. Maistrello, L. et al. Tracking the spread of sneaking aliens by integrating crowdsourcing and spatial modeling: the Italian invasion
of halyomorpha halys. Bioscience https://doi.org/10.1093/biosci/biy112 (2018).
13. Lepczyk, C. A., Boyle, O. D., Vargo, T. L. V. & Noss, R. F. Handbook of Citizen Science in Ecology and Conservation (University of
California Press, Oakland, 2020).
14. Devorshak, C. Plant pest risk analysis: concepts and applications. (CAB International, Wallingford, 2012).
Scientific Reports | (2021) 11:11421 | https://doi.org/10.1038/s41598-021-90378-1 11
Vol.:(0123456789)www.nature.com/scientificreports/
15. IPCC. Climate Change 2014: Impacts, Adaptation, and Vulnerability. Part A: Global and Sectoral Aspects. Contribution of Working
Group II to the Fifth Assessment Report of the Intergovernmental Panel on Climate Change Cambridge University Press, Cambridge
and New York, 2014).
16. Hijmans, R. J. & Graham, C. H. The ability of climate envelope models to predict the effect of climate change on species distribu-
tions. Glob. Change Biol. 12, 2272–2281 (2006).
17. Broennimann, O. & Guisan, A. Predicting current and future biological invasions: both native and invaded ranges matter. Biol.
Lett. 4, 585–589 (2008).
18. Godefroid, M., Meurisse, N., Groenen, F., Kerdelhué, C. & Rossi, J.-P. Current and future distribution of the invasive oak proces-
sionary moth. Biol. Invasions 22, 523–534 (2020).
19. Crall, A. W. et al. Citizen science contributes to our knowledge of invasive plant species distributions. Biol. Invasions 17, 2415–2427
(2015).
20. Petrovan, S. O., Vale, C. G. & Sillero, N. Using citizen science in road surveys for large-scale amphibian monitoring: are biased
data representative for species distribution?. Biodivers. Conserv. 29, 1767–1781 (2020).
21. Hannah, L. J. Climate Change Biology (Academic Press, 2015).
22. Buisson, L., Thuiller, W., Casajus, N., Lek, S. & Grenouillet, G. Uncertainty in ensemble forecasting of species distribution. Glob.
Change Biol. 16, 1145–1157 (2010).
23. Porfirio, L. L. et al. Improving the use of species distribution models in conservation planning and management under climate
change. PLoS ONE 9, e113749 (2014).
24. Hamilton, G. C., Ahn, J. J., Bu, W., Leskey, T. C., Nielsen, A. L., Park, Y.-L., Rabitsch, W. & Hoelmer, K.A. Halyomorpha halys
(Stål). In Invasive stink bugs and related species (Pentatomoidea): biology, higher systematics, semiochemistry, and management (ed
McPherson, J. E.) 243–292 (CRC Press, Taylor & Francis, Boca Raton, 2018).
25. Bergmann, E. J., Venugopal, P. D., Martinson, H. M., Raupp, M. J. & Shrewsbury, P. M. Host plant use by the invasive Halyomorpha
halys (Stål) on woody ornamental trees and shrubs. PLoS ONE 11, e0149975 (2016).
26. Gapon, D. A. First records of the brown marmorated stink bug Halyomorpha halys (Stål, 1855) (Heteroptera, Pentatomidae) in
Russia, Abkhazia, and Georgia. Entomol. Rev. 96, 1086–1088 (2016).
27. Faúndez, E. I. & Rider, D. A. The brown marmorated stink bug Halyomorpha halys (Stål, 1855) (Heteroptera: Pentatomidae) in
Chile. Arq. Entomolóxicos 17, 305–307 (2017).
28. McPherson, J. E., ed. Invasive stink bugs and related species (Pentatomoidea): biology, higher systematics, semiochemistry, and man-
agement (CRC Press, Taylor & Francis, Boca Raton, 2018).
29. Maistrello, L. et al. Halyomorpha halys in Italy: first results of field monitoring in fruit orchards. Integr. Prot. Fruit Crops IOBC-
WPRS Bull. 112, 1–5 (2016).
30. Bariselli, M., Bugiani, R. & Maistrello, L. Distribution and damage caused by Halyomorpha halys in Italy. EPPO Bull. 46, 332–334
(2016).
31. Zhu, G., Bu, W., Gao, Y. & Liu, G. Potential geographic distribution of brown marmorated stink bug invasion (Halyomorpha halys).
PLoS ONE 7, e31246 (2012).
32. Kriticos, D. J. et al. The potential global distribution of the brown marmorated stink bug, Halyomorpha halys, a critical threat to
plant biosecurity. J. Pest Sci. 90, 1033–1043 (2017).
33. Kistner, E. J. Climate change impacts on the potential distribution and abundance of the brown marmorated stink bug (Hemiptera:
Pentatomidae) with special reference to North America and Europe. Environ. Entomol. 46, 1212–1224 (2017).
34. R Core Team. R: A Language and Environment for Statistical Computing. (R Foundation for Statistical Computing, Vienna, 2021).
35. Vaclavik, T., Kanaskie, A., Hansen, E. M., Ohmann, J. L. & Meentemeyer, R. K. Predicting potential and actual distribution of
sudden oak death in Oregon: prioritizing landscape contexts for early detection and eradication of disease outbreaks. For. Ecol.
Manag. 260, 1026–1035 (2010).
36. Lobo, J. M., Jiménez-Valverde, A. & Hortal, J. The uncertain nature of absences and their importance in species distribution
modelling. Ecography 33, 103–114 (2010).
37. Elith, J. et al. A statistical explanation of MaxEnt for ecologists: statistical explanation of MaxEnt. Divers. Distrib. 17, 43–57 (2011).
38. Merow, C., Smith, M. J. & Silander, J. A. A practical guide to MaxEnt for modeling species’ distributions: what it does, and why
inputs and settings matter. Ecography 36, 1058–1069 (2013).
39. Phillips, S. J., Anderson, R. P. & Schapire, R. E. Maximum entropy modeling of species geographic distributions. Ecol. Model. 190,
231–259 (2006).
40. Elith, J. et al. Novel methods improve prediction of species’ distributions from occurrence data. Ecography 29, 129–151 (2006).
41. Fick, S. E. & Hijmans, R. J. WorldClim 2: new 1-km spatial resolution climate surfaces for global land areas. Int. J. Climatol. 37,
4302–4315 (2017).
42. Wu, T. et al. The Beijing climate center climate system model (BCC-CSM): the main progress from CMIP5 to CMIP6. Geosci.
Model Dev. 12, 1573–1600 (2019).
43. Voldoire, A. et al. Evaluation of CMIP6 DECK experiments With CNRM-CM6-1. J. Adv. Model. Earth Syst. 11, 2177–2213 (2019).
44. Séférian, R. et al. Evaluation of CNRM earth system model, CNRM-ESM2-1: role of earth system processes in present-day and
future climate. J. Adv. Model. Earth Syst. 11, 4182–4227 (2019).
45. Swart, N. C. et al. The Canadian earth system model version 5 (CanESM5.0.3). Geosci. Model Dev. 12, 4823–4873 (2019).
46. Hajima, T. et al. Development of the MIROC-ES2L Earth system model and the evaluation of biogeochemical processes and
feedbacks. Geosci. Model Dev. 13, 2197–2244 (2020).
47. Tatebe, H. et al. Description and basic evaluation of simulated mean state, internal variability, and climate sensitivity in MIROC6.
Geosci. Model Dev. 12, 2727–2765 (2019).
48. Meinshausen, M. et al. The shared socio-economic pathway (SSP) greenhouse gas concentrations and their extensions to 2500.
Geosci. Model Dev. 13, 3571–3605 (2020).
49. Guisan, A., Thuiller, W. & Zimmermann, N. E. Habitat Suitability and Distribution Models with Applications in R (Cambridge
University Press, 2017).
50. Broennimann, O. et al. Evidence of climatic niche shift during biological invasion. Ecol. Lett. 10, 701–709 (2007).
51. Kramer-Schadt, S. et al. The importance of correcting for sampling bias in MaxEnt species distribution models. Divers. Distrib.
19, 1366–1379 (2013).
52. Varela, S., Anderson, R. P., García-Valdés, R. & Fernández-González, F. Environmental filters reduce the effects of sampling bias
and improve predictions of ecological niche models. Ecography https://doi.org/10.1111/j.1600-0587.2013.00441.x (2014).
53. VanDerWal, J., Shoo, L. P., Graham, C. & Williams, S. E. Selecting pseudo-absence data for presence-only distribution modeling:
How far should you stray from what you know?. Ecol. Model. 220, 589–594 (2009).
54. Phillips, S. J. & Dudík, M. Modeling of species distributions with Maxent: new extensions and a comprehensive evaluation. Ecog-
raphy 31, 161–175 (2008).
55. Legendre, P. & Legendre, L. Numerical Ecology (Elsevier, 2012).
56. Godefroid, M., Cruaud, A., Streito, J.-C., Rasplus, J.-Y. & Rossi, J.-P. Xylella fastidiosa: climate suitability of European continent.
Sci. Rep. 9, 8844 (2019).
57. Vollering, J., Halvorsen, R. & Mazzoni, S. The MIAmaxent R package: variable transformation and model selection for species
distribution models. Ecol. Evol. 9, 12051–12068 (2019).
Scientific Reports | (2021) 11:11421 | https://doi.org/10.1038/s41598-021-90378-1 12
Vol:.(1234567890)www.nature.com/scientificreports/
58. Mazzoni, S., Halvorsen, R. & Bakkestuen, V. MIAT: modular R-wrappers for flexible implementation of MaxEnt distribution
modelling. Ecol. Inform. 30, 215–221 (2015).
59. Elith, J., Kearney, M. & Phillips, S. The art of modelling range-shifting species: the art of modelling range-shifting species. Methods
Ecol. Evol. 1, 330–342 (2010).
60. Halvorsen, R., Mazzoni, S., Bryn, A. & Bakkestuen, V. Opportunities for improved distribution modelling practice via a strict
maximum likelihood interpretation of MaxEnt. Ecography 38, 172–183 (2015).
61. Halvorsen, R. A strict maximum likelihood explanation of MaxEnt, and some implications for distribution modelling. Sommerfeltia
36, 1–132 (2013).
62. Boyce, M. S., Vernier, P. R., Nielsen, S. E. & Schmiegelow, F. K. A. Evaluating resource selection functions. Ecol. Model. 157, 281–300
(2002).
63. Hirzel, A. H., Le Lay, G., Helfer, V., Randin, C. & Guisan, A. Evaluating the ability of habitat suitability models to predict species
presences. Ecol. Model. 199, 142–152 (2006).
64. Jiménez, L. & Soberón, J. Leaving the area under the receiving operating characteristic curve behind: an evaluation method for
species distribution modeling applications based on presence-only data. Methods Ecol. Evol. https://doi.org/10.1111/2041-210X.
13479 (2020).
65. Chartois, M., Streito, J.-C., Pierre, E., Armand, J.-M., Gaudin, J., Rossi, J.-P. A crowdsourcing approach to track the expansion of
the brown marmorated stinkbug Halyomorpha halys (Stål, 1855) in France. Biodivers. Data J. 9, e66335. https://doi.org/10.3897/
BDJ.9.e66335 (2021)
66. Maurel, J.-P., Blaye G., Valladares L., Roinel, E. & Cochard, P.-O. Halyomorpha halys (Stål, 1855), la punaise diabolique en France,
à Toulouse (Heteroptera ; Pentatomidae). Carnets Nat. 3, 21–25 (2016).
67. Cherpitel, T. & Casset, L. Halyomorpha halys (Stål, 1855), la Punaise diabolique, atteint la façade atlantique (Heteroptera Pentato-
midae). L’Entomologiste 75, 59–60 (2018).
68. Pagola-Carte, S. & Zabalegui, I. D. hemípteros asiáticos nuevos para Gipuzkoa, norte de la Península Ibérica (Hemiptera: Pentato-
midae, Cicadellidae). Heteropterus Rev. Entomol. 19, 355–360 (2019).
69. Streito, J. C., Rossi, J.-P., Haye, T., Hoelmer, K. & Tassus, X. La punaise diabolique à la conquête de la France. Phytoma 677, 26–30
(2014).
70. Maistrello, L., Dioli, P., Bariselli, M., Mazzoli, G. L. & Giacalone-Forini, I. Citizen science and early detection of invasive species:
phenology of first occurrences of Halyomorpha halys in Southern Europe. Biol. Invasions 18, 3109–3116 (2016).
71. Stoeckli, S., Felber, R. & Haye, T. Current distribution and voltinism of the brown marmorated stink bug, Halyomorpha halys,
in Switzerland and its response to climate change using a high-resolution CLIMEX model. Int. J. Biometeorol. https://doi.org/10.
1007/s00484-020-01992-z (2020).
72. Leskey, T. C., Lee, D.-H., Glenn, D. M. & Morrison, W. R. Behavioral responses of the invasive Halyomorpha halys (Stål) (Hemip-
tera: Pentatomidae) to light-based stimuli in the laboratory and field. J. Insect Behav. 28, 674–692 (2015).
73. Inkley, D. B. Characteristics of home invasion by the brown marmorated stink bug (Hemiptera: Pentatomidae). J. Entomol. Sci.
47, 125–130 (2012).
74. Cambridge, J., Payenski, A. & Hamilton, G. C. The distribution of overwintering brown marmorated stink bugs (Hemiptera:
Pentatomidae) in college dormitories. Fla. Entomol. 98, 1257–1259 (2015).
75. Hancock, T. J., Lee, D.-H., Bergh, J. C., Morrison, W. R. & Leskey, T. C. Presence of the invasive brown marmorated stink bug
Halyomorpha halys (Stål) (Hemiptera: Pentatomidae) on home exteriors during the autumn dispersal period: results generated
by citizen scientists: presence of H. halys during the autumn dispersal. Agric. For. Entomol. 21, 99–108 (2019).
76. Streito, J.-C., Chartois, M., Pierre, É. & Rossi, J.-P. Beware the brown marmorated stink bug!. IVES Tech Rev. Vine Wine https://
doi.org/10.20870/IVES-TR.2020.3304 (2020).
77. Haye, T. et al. Range expansion of the invasive brown marmorated stinkbug, Halyomorpha halys: an increasing threat to field, fruit
and vegetable crops worldwide. J. Pest Sci. 88, 665–673 (2015).
78. Zhu, G., Gariepy, T. D., Haye, T. & Bu, W. Patterns of niche filling and expansion across the invaded ranges of Halyomorpha halys
in North America and Europe. J. Pest Sci. 90, 1045–1057 (2017).
79. Shabani, F., Kumar, L. & Ahmadi, M. A comparison of absolute performance of different correlative and mechanistic species
distribution models in an independent area. Ecol. Evol. 6, 5973–5986 (2016).
80. Leskey, T. C. & Nielsen, A. L. Impact of the invasive brown marmorated stink bug in North America and Europe: history, biology,
ecology, and management. Annu. Rev. Entomol. 63, 599–618 (2018).
81. Thuiller, W., Guéguen, M., Renaud, J., Karger, D. N. & Zimmermann, N. E. Uncertainty in ensembles of global biodiversity sce-
narios. Nat. Commun. 10, 1446 (2019).
82. Pearman, P. B., Guisan, A., Broennimann, O. & Randin, C. F. Niche dynamics in space and time. Trends Ecol. Evol. 23, 149–158
(2008).
83. Jump, A. S. & Penuelas, J. Running to stand still: adaptation and the response of plants to rapid climate change. Ecol. Lett. 8,
1010–1020 (2005).
84. Urvois, T., Auger-Rozenberg, M. A., Roques, A., Rossi, J. P. & Kerdelhue, C. Climate change impact on the potential geographical
distribution of two invading Xylosandrus ambrosia beetles. Sci. Rep. 11, 1339 (2021).
85. Wiens, J. J. & Graham, C. H. Niche conservatism: integrating evolution, ecology, and conservation biology. Annu. Rev. Ecol. Evol.
Syst. 36, 519–539 (2005).
Acknowledgements
We are greatly indebted to all the volunteers who participated to this study. The team at UMS PatriNat (MNHN/
OFB/CNRS) kindly provided INPN-Espèces occurrence data. We are especially grateful to the people responsible
for the conception, development and maintenance of INPN-Espèces: Matthias Laville, Sarah Figuet, Laurent
Poncet and Julien Touroult.
Author contributions
J.C.S., J.P.R. and F.D. conceived and designed the experiments. All authors performed the experiments. J.C.S.,
M.C. and J.P.R. analyzed the data and prepared the figures. J.P.R., J.C.S. and M.C. drafted the work and all authors
revised it critically.
Competing interests
The authors declare no competing interests.
Scientific Reports | (2021) 11:11421 | https://doi.org/10.1038/s41598-021-90378-1 13
Vol.:(0123456789)You can also read