DATA-DRIVEN EQUATION FOR DRUG-MEMBRANE PERMEABILITY ACROSS DRUGS AND MEMBRANES - MPG.PURE
←
→
Page content transcription
If your browser does not render page correctly, please read the page content below

Data-driven equation for drug–membrane
permeability across drugs and membranes
Cite as: J. Chem. Phys. 154, 244114 (2021); https://doi.org/10.1063/5.0053931
Submitted: 13 April 2021 . Accepted: 14 June 2021 . Published Online: 29 June 2021

  Arghya Dutta,     Jilles Vreeken,     Luca M. Ghiringhelli, and      Tristan Bereau

ARTICLES YOU MAY BE INTERESTED IN

Machine learning meets chemical physics
The Journal of Chemical Physics 154, 160401 (2021); https://doi.org/10.1063/5.0051418

Perspective on integrating machine learning into computational chemistry and materials
science
The Journal of Chemical Physics 154, 230903 (2021); https://doi.org/10.1063/5.0047760

Multi-body effects in a coarse-grained protein force field
The Journal of Chemical Physics 154, 164113 (2021); https://doi.org/10.1063/5.0041022

J. Chem. Phys. 154, 244114 (2021); https://doi.org/10.1063/5.0053931                    154, 244114

© 2021 Author(s).
The Journal
                                                                                                  ARTICLE            scitation.org/journal/jcp
 of Chemical Physics

    Data-driven equation for drug–membrane
    permeability across drugs and membranes
    Cite as: J. Chem. Phys. 154, 244114 (2021); doi: 10.1063/5.0053931
    Submitted: 13 April 2021 • Accepted: 14 June 2021 •
    Published Online: 29 June 2021 • Publisher Corrected: 30 June 2021

    Arghya Dutta,1,a)             Jilles Vreeken,2          Luca M. Ghiringhelli,3     and Tristan Bereau1,4

    AFFILIATIONS
    1
      Max Planck Institute for Polymer Research, Mainz, Germany
    2
      CISPA Helmholtz Center for Information Security, Saarbrücken, Germany
    3
      The NOMAD Laboratory at the Fritz Haber Institute of the Max Planck Society and Humboldt University, Berlin, Germany
    4
      Van ’t Hoff Institute for Molecular Sciences and Informatics Institute, University of Amsterdam, Amsterdam, The Netherlands

    a)
         Author to whom correspondence should be addressed: dutta@mpip-mainz.mpg.de

    ABSTRACT
    Drug efficacy depends on its capacity to permeate across the cell membrane. We consider the prediction of passive drug–membrane per-
    meability coefficients. Beyond the widely recognized correlation with hydrophobicity, we additionally consider the functional relationship
    between passive permeation and acidity. To discover easily interpretable equations that explain the data well, we use the recently proposed
    sure-independence screening and sparsifying operator (SISSO), an artificial-intelligence technique that combines symbolic regression with
    compressed sensing. Our study is based on a large in silico dataset of 0.4 × 10⁶ small molecules extracted from coarse-grained simulations.
    We rationalize the equation suggested by SISSO via an analysis of the inhomogeneous solubility–diffusion model in several asymptotic acidity
    regimes. We further extend our analysis to the dependence on lipid-membrane composition. Lipid-tail unsaturation plays a key role but sur-
    prisingly contributes stepwise rather than proportionally. Our results are in line with previously observed changes in permeability, suggesting
    the distinction between liquid-disordered and liquid-ordered permeation. Together, compressed sensing with analytically derived asymp-
    totes establish and validate an accurate, broadly applicable, and interpretable equation for passive permeability across both drug and lipid-tail
    chemistry.
    © 2021 Author(s). All article content, except where otherwise noted, is licensed under a Creative Commons Attribution (CC BY) license
    (http://creativecommons.org/licenses/by/4.0/). https://doi.org/10.1063/5.0053931

    I. INTRODUCTION                                                                   complex relationships. Unfortunately, the body of experi-
         Passive lipid-membrane permeation is and remains of great                    mentally available data is minuscule compared to the size
    relevance for pharmaceutical applications and an improved physic-                 of chemical space. This can lead to surrogate models that
    ochemical understanding of small-sized molecules in complex bio-                  shift dangerously upon addition/removal of small numbers
    logical materials.1,2 The technological implications of the problem               of compounds in the training set. The problem is aggra-
    have sustained the need for experiment- and simulation-free pre-                  vated by databases that are often proprietary, preventing
    diction of passive permeation, which are rapid, inexpensive, and                  broad availability and reproducibility. Relying on different
    accurate.3,4 Various types of surrogate models have been proposed                 measurement batches tends to also accentuate systematic
    over the years, with the field having adopted machine learning early              errors.
    on.5 While modern deep-learning approaches take advantage of                 2.   Lack of interpretability: Surrogate models are oftentimes
    unchallenged model expressivity to offer unprecedented prediction                 black-box techniques that typically cloud why a certain pre-
    accuracy, they suffer from two important drawbacks:                               diction has been made. Deep neural networks exhibit an over-
                                                                                      whelming number of parameters and rely on highly non-
         1.   Overfitting: The size of chemical space of drug-like molecules          linear hierarchical functions, making them nearly impossible
              is overwhelmingly large (∼1060 compounds).6 Deep surro-                 to conceptually grasp.7 Quantitative structure–activity rela-
              gate models need large numbers of parameters to establish               tionship (QSAR) models can build multivariate models, but

J. Chem. Phys. 154, 244114 (2021); doi: 10.1063/5.0053931                                                                                  154, 244114-1
© Author(s) 2021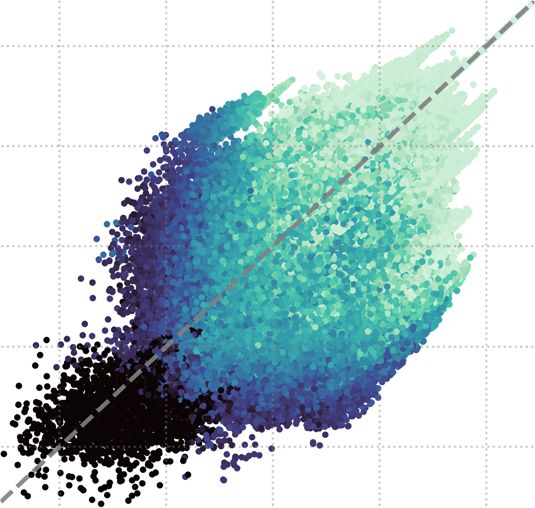
The Journal
                                                                                                    ARTICLE             scitation.org/journal/jcp
 of Chemical Physics

            the combination of too many descriptors will lead to similar        generalization aspects and also interpretability, i.e., rationalizing the
            difficulties. Beyond predicting individual datapoints, we seek      derived equation.
            to gain further insight. Insight is essential, for instance, as a         Passive drug permeation measures the propensity of a solute
            stepping stone to solving the inverse problem, thereby estab-       to spontaneously cross a lipid membrane. In this paper, we exclude
            lishing structure–property relationships and enabling com-          transporter-mediated uptake to focus solely on thermal diffusion.22
            pound design.                                                       Upon doing so, the solute interacts with a great variety of physico-
                                                                                chemical environments—from an aqueous phase to a hydrophobic
          In this work, we address these points using a combination
                                                                                membrane core. Permeation is quantified by means of its coefficient,
    of approaches. Critically, we address overfitting by relying on
                                                                                P, as the steady state flux of the solute across the soft interface. Early
    large datasets applied to simple models. Instead of experimental
                                                                                on, Meyer23 and Overton24 modeled passive permeation as diffu-
    approaches, we base our study on in silico measurements, taking
                                                                                sion across a homogeneous slab via P = KD/σ, where K and D are
    advantage of the rapid rise in high-throughput molecular dynam-
                                                                                the water/membrane partitioning coefficient and diffusivity of the
    ics simulations.8 All-atom simulations offer a gold standard in
                                                                                compound, respectively, and σ is the thickness of the bilayer core.
    terms of simulation-based permeability modeling that can reach
                                                                                K is typically approximated by a simpler proxy, namely, the parti-
    exquisite correlation against experimental reference, but their over-
                                                                                tioning coefficient between water and octanol. Water/octanol parti-
    whelming computational costs unfortunately limit studies to tens
                                                                                tion, or more generally hydrophobicity, has long been identified as
    of compounds.9–11 Here, instead, we use an approach based on
                                                                                strongly correlating with membrane permeability.25 Notable refine-
    particle-based coarse-grained (CG) simulations, making use of the
    transferable Martini model.12–15 The Martini model sacrifices some          ments to the homogeneous Meyer–Overton rule include the inho-
    chemical resolution but retains the essential driving force, mainly         mogeneous solubility–diffusion model (ISDM), estimating the per-
    the partitioning coefficient of a chemical group between different          meability coefficient via an integral over the membrane extension, z,
    phases. This allows the CG approach to recover excellent accuracy,          of its PMF, G(z), as
    1.4 kcal/mol along a potential of mean force (PMF), translating
    to 1 log10 unit in the permeability coefficient, validated across an
                                                                                               P−1 = ∫ dz R(z) = ∫ dz
                                                                                                                            exp[βG(z)]
    extensive set of structurally distinct compounds against both atom-                                                                ,              (1)
                                                                                                                               D(z)
    istic simulations and experimental measurements.16 Critically, the
    accuracy of the CG model is accompanied by a three-orders-of-
    magnitude speedup compared to atomistic simulations. The high-              where R(z) and β = 1/kB T correspond to the associated resistiv-
    throughput coarse-grained (HTCG) simulations offer unprecedent-             ity and the inverse temperature, respectively.26 The competition
    edly large databases of permeability coefficients: Menichetti et al.        between different protonation states naturally follows the sum of
    reported results for 511 427 compounds.16 The ability to screen over        inverse resistivities, analogous to the total resistance in a paral-
    so many compounds results mainly from the transferable nature               lel electrical circuit.10 PMFs are shifted according to the difference
    of the coarse-grained model—many molecules map to the same                  between the solution’s pH and the compound’s acid dissociation
    set of CG beads, which effectively reduces the size of chemical             constant, pK a . In the following, we take the perspective of a neu-
    space.17 The benefits for an efficient computational-screening proce-       tral compound, which can deprotonate (acidic, apK a ) or protonate
    dure outweigh the impinged degeneracy, as indicated by the above-           (basic, bpK a ). Knowledge of the PMF(s) and the diffusivity thereby
    mentioned accuracy. Overall, the database contains a nearly exhaus-         fully determines the permeability coefficient. Unfortunately, these (i)
    tive subset of small organic molecules in the range of 30–160 Da,           are so far only available by computational techniques and (ii) typi-
    thereby ensuring a dense coverage of the chemical space in this sub-        cally require extensive calculations (∼105 CPU-h per system at an
    set. A deeper analysis of this large database is the subject of this        atomistic resolution).9,11
    study.                                                                            Even at a CG resolution, Eq. (1) still requires free-energy calcu-
          As for the data-driven model, we explicitly avoid building and        lations to determine the PMF. The objective of this study is to gain
    using a black-box model and instead turn to learning an equation.           further insight into the key physical determinants of the permeabil-
    In particular, we will rely on recently proposed data-driven tech-          ity coefficient. Beyond the widely known effect of hydrophobicity,
    niques to discover equations.18,19 Equations relevant to physical           we focus on incorporating the role of acidity via the compound’s
    problems often display simplifying properties, such as symme-               protonation state.27 The role of acidity is crucial, partly because
    tries or separability, easing both their data-driven discovery              of the sheer number of ionizable drugs: they make ≈62% of the
    and generalization beyond the training set. Several studies have            World Health Organization’s list of essential drugs.28,29 It has long
    demonstrated the ability to (re)discover physics equations.20,21            been hypothesized that the neutral form of an ionizable drug is
    Generalization capabilities are critical, because typical training          the only contributor to its permeability, known as the pH–partition
    datasets are minuscule relative to the size of chemical compound            hypothesis.30,31 However, this hypothesis is limiting for two rea-
    space, such that overfitting can easily prevail. How do we discover         sons. First, permanently charged compounds are known to perme-
    simple equations from the data? To this end, we follow Occam’s              ate lipid membranes.32,33 Second, differences between a compound’s
    razor and limit the complexity of the equations we consider.                pK a and the surrounding pH can lead to a protonation-coupled
    The combination of descriptors through various mathematical                 permeation mechanism, which calls for the combined contribu-
    operators will lead to an overwhelming number of trial equations,           tions of the neutral and ionized forms.34,35 Clearly, the role of
    many of which may fit the data similarly well. Following ideas              acidity is expected to couple with hydrophobicity. Establishing a
    from compressed sensing, we select simple equations by applying             functional relationship connecting the two quantities is the objec-
    the ℓ0 regularization. Identifying simple equations benefits both           tive of this work. To this end, we rely on modern data-driven

J. Chem. Phys. 154, 244114 (2021); doi: 10.1063/5.0053931                                                                                     154, 244114-2
© Author(s) 2021
The Journal
                                                                                                   ARTICLE            scitation.org/journal/jcp
 of Chemical Physics

    techniques to discover an equation. Relating acidity to the perme-         B. Learning algorithm
    ability coefficient would not only help establishing rapid estimates              To learn about an interpretable model of passive permeability,
    for ionic compounds but also offer insight into the coupling of            we used SISSO, as implemented in Ref. 46. SISSO aims at establish-
    these physicochemical properties that are valid for a wide class of        ing a functional relationship, y = f (Φ), between n primary features,
    compounds.                                                                 Φ0 = {ϕ1 , ϕ2 , . . . , ϕn }, and a target property, y, based on N train-
          Limitations in the number of candidate descriptors and               ing compounds. SISSO assumes that y can be reliably expressed as
    correlations between features have recently been addressed by              a linear combination of non-linear, but closed-form, functions of
    sure-independence screening and sparsifying operator (SISSO),36,37         primary features. To construct these non-linear functions, SISSO
    which is an artificial-intelligence technique that combines symbolic       recursively applies a set of user-defined unary and binary
    regression with compressed sensing.38–40 SISSO provides a data-                                                                         √ √oper-
                                                                               ators [we used {+, −, ×, ÷, exp, log, ()−1 , ()2 , ()3 , 3 (), ()}]
    driven framework to discover equations—mathematical relations
                                                                               on the primary features and builds up sets of candidate features.
    between input variables that best correlate with the target property.
                                                                               Φq denotes the set of candidate features at each level of recursion
    We will discuss several equations of various complexities to illustrate
                                                                               q. The number of candidate features in Φq increases sharply with
    the balance between accuracy and interpretability. We root the sim-
                                                                               the increase in the recursion level q, the number of operators used,
    plest variant in the underlying physics by comparison against analyt-
                                                                               and the number of primary features n. For each q, SISSO iteratively
    ical acid–base asymptotic regimes. This simple model incorporating
                                                                               selects subsets of candidate features that have the largest linear cor-
    both hydrophobicity and acidity allows us to easily extend our anal-
                                                                               relations with the target y and then with the subsequent residuals,
    ysis to different lipid membranes starting from limited information.
                                                                               i.e., each portion of y that is captured by the previous iterations
    From the knowledge of neutral species alone, we predict the change
                                                                               (see Ref. 37). The number of iterations in this procedure, which
    in passive permeability in various lipid membranes. We finally dis-
                                                                               equals the number of terms in the linear expansion of f (Φ), and
    cuss the change in permeability in the context of membrane-phase
                                                                               hereby denoted as the dimension of the model, is controlled by a
    behavior.
                                                                               sparsifying ℓ0 regularization. For each q and number of dimensions,
                                                                               SISSO selects the model with the smallest root mean-squared error
    II. METHODS                                                                (RMSE). We also quantify model performance using the maximum
    A. Database of drug–membrane thermodynamics                                absolute error (MaxAE) and the square of the Pearson correlation
                                                                               coefficient, r2 .
          Our analysis is based on the passive-permeability database pro-
    vided by Menichetti et al.16 Reference information includes the
    water/octanol partitioning free energy (ΔGW→Ol ), acid dissociation        C. Feature construction and training
    constant for acids and bases (apK a and bpK a ), and simulation-                 We apply SISSO to three easily accessible and interpretable pri-
    based permeability coefficient (expressed by its order of magnitude,       mary features: the water/octanol partitioning free energy, ΔGW→Ol ,
    log10 P) for solutes through a single-component bilayer made of 1,2-       and the acid dissociation constants apK a and bpK a as provided
    dioleoyl-sn-glycero-3-phosphocholine (DOPC). The water/octanol             by Menichetti et al.16 We thereby seek a refinement or cor-
    partitioning free energies were predicted using the neural network         rection to the commonly used model based on hydrophobicity
    ALOGPS,41 and acid dissociation constants pK a were predicted from         alone.25 The mean absolute errors associated with the ΔGW→Ol
    ChemAxon Marvin.42 Filtering of the Generated DataBase (GDB)43             and pK a predictions (0.36 kcal/mol41 and 0.86 units,47 respectively)
    for compounds that mapped to a one- or two-bead coarse-grained             make them reliable primary descriptors. To avoid constructing fea-
    Martini representation, i.e., a monomer or a dimer, led to 511 427         tures with different units, we multiply the partitioning free energy
    small organic molecules (30–160 Da). Enhanced-sampling molec-              by the inverse temperature: βΔGW→Ol using T = 300 K follow-
    ular dynamics simulations yielded the PMFs for both neutral and            ing Menichetti et al.16 Starting with the set of primary features
    (de)protonated species, and Eq. (1) was used to compute the perme-         Φ0 = {βΔGW→Ol , apK a , bpK a }, we consider the construction of sec-
    ability coefficient, P. The diffusivity profile was not extracted from     ondary features for up to two iterations (i.e., q = 2), where Φ1 and Φ2
    coarse-grained simulations but instead from previous atomistic             consist of roughly 30 and 2000 features, respectively. We limit the
    studies taking advantage of its relatively small chemical dependence       SISSO screening size to 500 and consider up to three-dimensional
    and its logarithmic impact on the permeability.10 The pK a of a chem-      descriptors. We train on 10% of the available data (see the
    ical group can be either acidic (apK a ) or basic (bpK a ), and in that,   supplementary material for the input script) and use the remaining
    a neutral compound can either deprotonate or protonate (see the            90% for hold-out evaluation. We draw these train/test sets uniformly
    supplementary material for definitions). While the ionization con-         at random, without replacement. To reduce variance, we report
    stant of conjugated acid/base pairs typically lies between 10−2 and        the average performance over ten independently drawn train/test
    1016 , we considered compounds with pK a values between −10 and            sets. Ouyang et al.36 emphasized that SISSO works reliably when
    20.44 This led to a dataset of 418 828 compounds used as part of this      the number of materials in a training set, N, sufficiently exceeds
    work. A follow-up work to Menichetti et al. provided PMFs for the          the number of candidate features. In particular, SISSO requires
    same set of neutral Martini small molecules in different phospho-          N ≥ kd ln(#Φ), where k ∼ 1–10, d is the dimension, and #Φ is the
    choline (PC) lipid membranes: 1,2-diarachidonoyl-sn-glycero-3-PC           size of the feature space. For Φ2 , the relevant feature space used
    (DAPC); 1,2-dilinoleoyl-sn-glycero-3-PC (DIPC); 1,2-dilauroyl-sn-          to train our model, the relation requires N ≥ 10 ⋅ 2 ⋅ ln(2 ⋅ 103 )
    glycero-3-PC (DLPC); 1,2-dioleoyl-sn-glycero-3-PC (DOPC); 1,2-             ≃ 150. By training our models with only 10% of the dataset (∼42 000
    dipalmitoyl-sn-glycero-3-PC (DPPC); and 1-palmitoyl-2-oleoyl-sn-           compounds), SISSO is well within a regime to provide meaningful
    glycero-3-PC (POPC).45                                                     and consistent results.

J. Chem. Phys. 154, 244114 (2021); doi: 10.1063/5.0053931                                                                                    154, 244114-3
© Author(s) 2021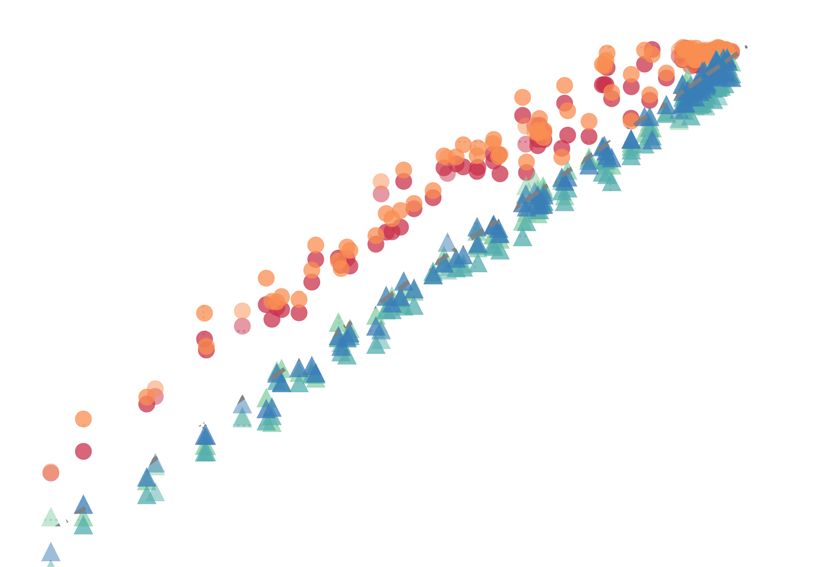
The Journal
                                                                                                                         ARTICLE               scitation.org/journal/jcp
 of Chemical Physics

    III. RESULTS AND DISCUSSIONS
    A. Learning permeability models
          Table I contains the four models considered in this work: (i)
    f Hyd is a baseline hydrophobicity model, which linearly correlates
    with water/octanol partitioning free energy; and (ii)–(iv) f 1D to
    f 3D linearly correlate with one to three secondary feature(s) iden-
    tified by SISSO. For each model, cim correspond to non-zero coeffi-
    cients for model m and index i, reported in Table I. For all models,
    ΔGW→Ol takes on a central role, as expected by the performance
    of the baseline. The simplest SISSO model, f 1D = c01D + c11D (apKa
    − bpKa − 2βΔGW→Ol ), is remarkably robust: it is systematically iden-
    tified as the best performing 1D model across all ten training sets.
    Given that we trained on only 10% (∼42 000 compounds) of the
    dataset, this highlights this model’s performance compared to all
    other candidates (see the supplementary material for a list of can-
    didate one-dimensional models). The stability of the model—given
    such a small training fraction—speaks for the robustness of the
    equation. Its improved accuracy compared to the baseline will be
    evaluated further down.
          We also report more complex 2D and 3D models in Table I.
    While we will show below that these yield even better accuracy com-                            FIG. 1. Performance of the four permeability models against the reference for the
                                                                                                   dataset of 418 K small molecules: (a) baseline hydrophobicity model f Hyd and
    pared to f 1D , they are specifically tailored to the training set used:                       (b)–(d) 1D to 3D data-driven SISSO models. See Table I for their expressions.
    f 2D and f 3D are ranked as the best model in eight and five out of the
    ten training sets, meaning that other models of similar complexity
    closely compete.
                                                                                                  line. The presence of horizontal stripes in Fig. 1 results from the
                                                                                                  degenerate use of CG mappings for many molecules.17 This arti-
    B. Model performance                                                                          fact is most notable for f Hyd , which solely relies on hydrophobicity,
          We now turn to the performance of these four models. Table I                            whereas the others have chemically specific acidity information. For
    reports their RMSE, MaxAE, and squared Pearson correlation coef-                              the 2D and 3D models, we also point out outliers at the lowest per-
    ficient, r2 , averaged over the test sets. Going from the baseline to                         meability values. Figure S1 of the supplementary material shows
    more complex SISSO models, the systematic decrease in the RMSE                                the distribution of compounds: these low-permeability values are
    is accompanied by an increase in the correlation coefficient. On                              scarcely populated, both in algorithmically and synthesized com-
    the other hand, the maximum absolute error does show a clear                                  pound databases.16 Here, they represent only 0.07% of the dataset,
    minimum for f 1D . This offers a first hint at the appealing balance                          and our uniform sampling of training points likely brought in only
    between generalization and interpretability of the 1D SISSO model.                            few of them. They likely result from poor extrapolation behavior
    The performance of these four models is depicted in Fig. 1 for the                            of the 2D and 3D models, which notably include powers of two of
    entire dataset, where we report each model against reference values.                          several variables.
    Going from the baseline to SISSO models of increasing complexity,                                   To better understand the performance of each model, we ana-
    the distribution does lean increasingly toward the y = x correlation                          lyze their errors in greater detail. Figure 2(a) shows the distribution

    TABLE I. Permeability models, descriptor coefficients, and model performance: RMSE, MaxAE (both in log10 units of the permeability coefficient), and r 2 . The models considered
    are baseline hydrophobicity model, f Hyd , as well as SISSO with up to three feature dimensions: f 1D , f 2D , and f 3D . Compared to the baseline, SISSO systematically leads to
    more accurate models. Descriptor coefficients and performance metrics are averaged over training and test sets, respectively. All standard errors are small and reported in the
    supplementary material.

    Model                                                                  c0                c1                 c2              c3            RMSE            MaxAE              r2
             Hyd    Hyd
     f Hyd = c0 +c1 βΔGW→Ol                                             −3.444           −0.648                                                1.53            11.82            0.64
     f 1D = c01D +c11D (apK
                        √ a − bpKa − 2βΔGW→Ol )                         −5.419            0.163                                                1.40             6.35            0.70
     f 2D = c02D +c12D ( 3 βΔGW→Ol + βΔGW→Ol − apKa )                   −5.753           −0.487             −0.017                             1.06             8.28            0.83
           +c22D (apKa2 + bpKa2 )
     f 3D = c03D +c13D (βΔGW→Ol − apKa )                                −7.101           −0.614             −0.001           −0.018            0.94              8.19           0.86
           +c23D (bpKa2 (apKa + bpKa ))
           +c33D (apKa2 + (βΔGW→Ol )2 )

J. Chem. Phys. 154, 244114 (2021); doi: 10.1063/5.0053931                                                                                                               154, 244114-4
© Author(s) 2021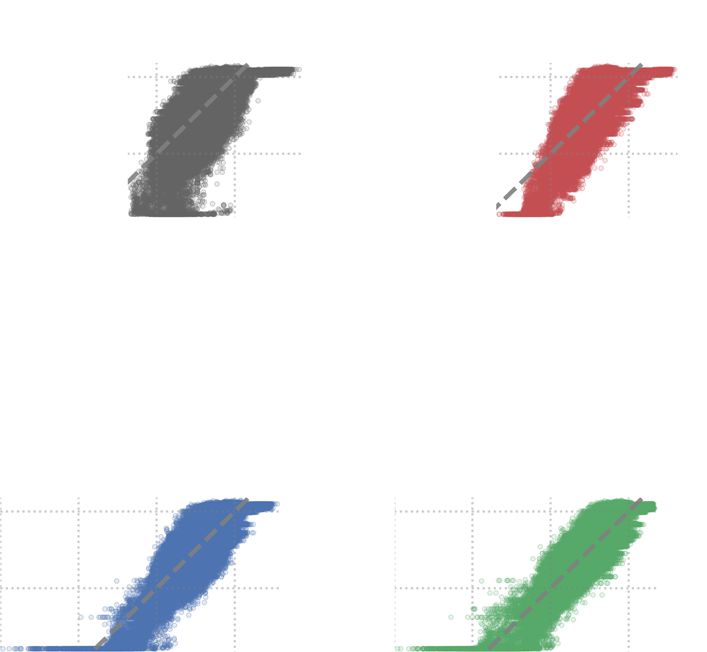
The Journal
                                                                                                                          ARTICLE                 scitation.org/journal/jcp
 of Chemical Physics

      FIG. 2. Absolute error analysis. (a) Error (in log10 units) distribution for all models. Error decomposed as a function of (b)–(e) apK a and (f)–(i) bpK a . Stronger acids/bases
      are shown in darker colors.

    of absolute error. The large dataset at our disposal allows us to eval-                       12 organic compounds covers a range of molecular weights that goes
    uate more than four orders of magnitude of this distribution. The                             significantly beyond our training set: an average of 243 Da and up to
    comparison between f Hyd and f 1D proves insightful: while they are                           319 Da, comparable to that of real drugs, given that more than 60%
    remarkably close up to errors of 5 log10 units, the baseline then dis-                        of drugs have molecular weight below 300 Da.48 On the other hand,
    plays a significant hump, while the SISSO 1D model keeps decaying                             our training HTCG database only contained compounds up to 160
    monotonously. Both models rely on βΔGW→Ol , which explains the                                Da. This thus presents a challenging test for the generalizability of
    remarkable agreement early on, while the stark difference between                             the SISSO models.
    the two curves is entirely due to the effect of acidity. This is con-                              Figure 3 shows the absolute error against atomistic simulations
    firmed by a further decomposition of the error as a function of                               across all 12 small molecules and for our four models. For each
    acidity, showing that f Hyd leads to larger errors for stronger acids                         model, we display the error as a function of both apK a and bpK a . The
    and bases [panels (b) and (f)], while SISSO 1D significantly reduces                          baseline model yields absolute errors between 1 and almost 4 log10
    the error in this regime [panels (c) and (g)].                                                units. While larger errors correlate with strong acids, they do not
          In comparison, the more complex SISSO 2D and 3D display a                               seem to correlate with larger bases. Unlike Fig. 2, the minuscule set
    shift in the error distribution toward lower errors [Fig. 2(a)] com-                          of atomistic compounds prevents us from drawing conclusions that
    pared to the 1D model. At low probability, however, we observe a                              would hold across any significant subset of chemical space. Turning
    significant change in the slope of the decay, indicating worse perfor-                        to SISSO 1D, we observe a small but notable decrease in perfor-
    mance for a small number of outliers. This is also illustrated when                           mance, where the mean absolute error (MAE) increases from 1.55
    decomposing the error in terms of acidity in Panels (d)–(i): while                            to 2.03 log10 units. The MAE, however, decreases against the base-
    the overall performance improves, we identify more outliers. These                            line when considering the more complex SISSO 2D and 3D: 0.87
    outliers mostly lie at low-permeability values (reminiscent of Fig. 1)                        and 1.33 log10 units, respectively. The non-monotonic decrease in
    and for strong apK a or bpK a . Poor performance at large acidity                             the MAE with increasing complexity in Figs. 3(b)–3(d) suggests the
    values could take place if these were absent of the small training                            role of the small validation dataset considered. Overall though, the
    fraction.                                                                                     incorporation of acidity does lead to an improved reproduction of
                                                                                                  the permeability coefficient. It validates the SISSO-derived equations
                                                                                                  on permeability coefficients derived using independent methods and
    C. Validation against atomistic simulations                                                   outside the chemical space of the training data.
          The SISSO models should naturally be prone to systematic
    errors inherent to the training dataset. While we expect our sys-                             D. Acid–base asymptotes
    tematic integration of the ISDM permeability coefficient [Eq. (1)]                                  The analysis so far highlights how model complexity impacts
    to ensure robust functional relationships, systematic errors in the                           accuracy. Missing from the analysis so far is the consideration
    parameters are likely to affect the fitting coefficients. Reference                           of interpretability. The two one-dimensional models—the baseline
    permeability values were extracted from computationally efficient                             and SISSO 1D—highlight a simple mechanism as to the functional
    coarse-grained computer simulations at the cost of force-field accu-                          dependence of the permeability coefficient on both hydrophobicity
    racy. Still, a comparison of the coarse-grained simulations against                           and acidity. Focusing on SISSO 1D specifically, we rewrite the model
    atomistic computer simulations had indicated an excellent agree-                              in terms of two contributions,
    ment of 1 log10 unit across a limited set of small molecules.16
    Here, we compare the performance of the four permeability mod-
    els against the atomistic simulations of Carpenter et al.10 This set of                         f 1D = c01D + c11D [(apKa − βΔGW→Ol ) + (−bpKa − βΔGW→Ol )]. (2)

J. Chem. Phys. 154, 244114 (2021); doi: 10.1063/5.0053931                                                                                                                   154, 244114-5
© Author(s) 2021
The Journal
ARTICLE scitation.org/journal/jcp
of Chemical Physics
FIG. 3. Absolute error (in log10 units) against atomistic simulations for 12 reference small molecules.10 The error is displayed for all four models and as a function of (a)–(d)
apK a and (e)–(h) bpK a .
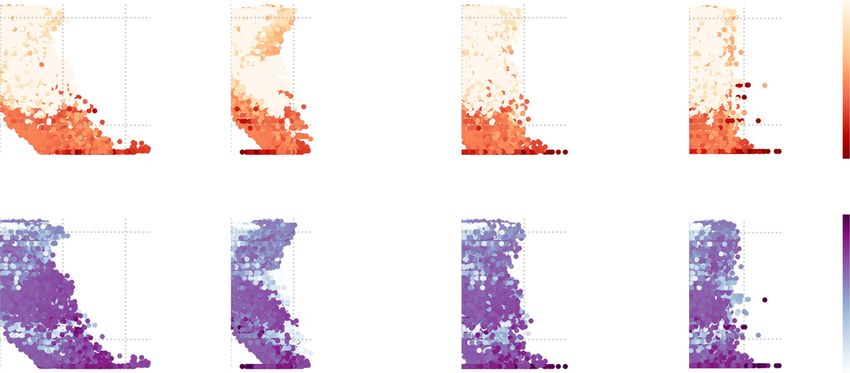
Figure 4 displays the permeability coefficient as a function of To rationalize Eq. (2), we first outline the role of our three pri-
these two contributions. The symmetric contribution of βΔGW→Ol mary descriptors in the ISDM model [Eq. (1)]. Figure 5 illustrates the
in the two terms of Eq. (2) indicates that the baseline hydrophobic- well-known interplay between PMF and acidity, in particular, how
ity model manifests itself along the diagonal. Notably, missing from the latter shifts the PMFs of the neutral and (de)protonated species.
the diagonal behavior are the dark vertical and horizontal basins. In the following, we will denote the PMFs of the neutral, protonated,
They localize at apK a − βΔGW→Ol ∼ 0 and −bpK a − βΔGW→Ol ∼ −15 and deprotonated species as GN (z), GB (z), and GA (z), respectively.
and represent strong-acid and strong-base regimes. In what follows, The difference between apK a or bpK a and pH dictates the
we provide an asymptotic rationalization of the functional form of propensity for the PMFs to cross each other. The ISDM relies
Eq. (2). on a total resistivity [defined in Eq. (1)], RT , such that R−1 T (z)
= R−1 −1 −1
N (z) + RB (z) + RA (z), analogous to the total resistance in a
parallel electric circuit.
The PMFs of the neutral, protonated, and deprotonated species
can be linked in water, thanks to their apK a and bpK a values, as well
as the pH of the environment, through the following equations:
β−1 (pH − apKa ) ln 10 = GN (∞) − GA (∞), (3)
−1
β (pH − bpKa ) ln 10 = GB (∞) − GN (∞), (4)
where G(∞) indicates that the compound is located in bulk water.
Equations (3) and (4) effectively link the difference between the
pH of the environment with the pK a of the compound to a shift
in the PMFs. Without loss of generality, we will shift all free ener-
gies such that zero corresponds to the most favorable compound
in bulk water. Equations (3) and (4) allow us to explicitly link pK a
information with the total resistivity
FIG. 4. SISSO 1D model of passive permeability. The decomposition of the sec- R−1
T (z) = D(z)[e
−β(GN (z)−GN (∞))
+ e−β(GB (z)−GB (∞))
ondary feature in two axes highlights the role of hydrophobicity (along the diagonal)
compared to acidity (vertical and horizontal). + e−β(GA (z)−GA (∞)) ], (5)
J. Chem. Phys. 154, 244114 (2021); doi: 10.1063/5.0053931 154, 244114-6
© Author(s) 2021The Journal
ARTICLE scitation.org/journal/jcp
of Chemical Physics
where we assume that all protonation states yield identical diffusiv-
ity.16 Because Eq. (5) takes on a relatively complex form, we will
consider only asymptotic regimes:
● Neutral compounds entail no strong acid or base char-
acteristic, i.e., apK a ≫ pH and bpK a ≪ pH, such that
the compound is effectively unable to (de)protonate, and
GN (∞) = 0. Equation (5) can be simplified to RT (z)
≈ D−1 (z) exp[βGN (z)].49
● Strong acids consist of solutes that display at least
one functional group for which apK a ≪ pH. For neu-
tral pH (≈7), this would correspond to apK a < 4. We set
GA (z → ∞) = 0. In this regime, the third exponential in
Eq. (5) would dominate the other two, leading to RT (z)
≈ D−1 (z) exp[βGN (z) + (pH − apKa ) ln 10].
● Strong bases would display at least one functional
group, where bpK a ≫ pH. For neutral pH, this would
correspond to bpK a > 10. We set GB (z → ∞) = 0.
Using a similar argument, Eq. (5) would be dom-
inated by the second exponential, leading to
RT (z) ≈ D−1 (z) exp[βGN (z) − (pH − bpKa ) ln 10].
The total resistivities still require integration over the reac-
tion coordinate z, which we simplify to the largest contribution of
the PMF.11 The effective resistivity model is equivalent to choos-
ing the lowest PMF at any value of z: Geff (z) = mini Gi (z), where
i runs over the neutral, protonated, and deprotonated species. In
addition, the dominating contribution of the effective permeabil-
FIG. 5. Sketch of the permeation mechanism in three regimes: (a) strong acid, ity will come from its maximum value, corresponding to a posi-
(b) neutral compound, and (c) strong base. The curves display the neutral tion z∗ = arg max Geff (z). Assuming that the largest contribution of
(orange solid curve), acidic (green dashed curve), and basic (pink dotted curve) z
PMFs. The blue area under the effective PMF directly links to the permeability the permeability arises from the total resistivity at z∗ , we obtain P
coefficient. ≈ R−1 ∗
T (z ). This yields the following acid–base asymptotic regimes:
log10 D(z∗ ) − GN (z∗ ) − pH + apKa
⎧
⎪ β
⎪
⎪
⎪ if apKa ≪ pH
⎪
⎪ ln 10
log10 P ≈ ⎨ log10 D(z∗ ) − GN (z∗ ) + pH − bpKa
⎪
⎪ β
if bpKa ≫ pH (6)
⎪
⎪
⎪ ln 10
log D(z∗ ) − GN (z∗ )
⎪
⎪ β
⎪
⎪
⎪ if apKa ≫ pH and bpKa ≪ pH.
⎩ 10 ln 10
To numerically test Eq. (6), we identify datapoints corre- − βΔGW→Ol and −bpK a − βΔGW→Ol . We first note that ΔGW→Ol is
sponding to the three asymptotic regimes: the neutral compounds related to GN (z∗ ). The depth at which the effective PMF is the
(apK a > 10 and bpK a < 4), strong acids (0 < apK a < 4 and bpK a highest, z∗ , will almost always be close to the membrane midplane:
< 4), and strong bases (10 < bpK a < 14 and apK a > 10). For simplic- z∗ ≈ 0. The main exception to this is hydrophobic compounds for
ity, we only considered non-zwitterionic compounds. We assume which the highest point in the PMF is in water [Fig. 5(c)]. Further-
that log10 D(z) yields no significant, chemically specific effect and more, G(z∗ = 0), which corresponds to the transfer free energy from
uniformly shifts the permeability coefficient across the chemical water to the membrane midplane, has been shown to linearly relate
space of compounds considered. Figure 6 shows the agreement to the water/octanol partitioning free energy, ΔGW→M ∝ ΔGW→Ol .50
between Eq. (6) and the reference permeability coefficients. All This connects GN (z∗ ) present in Eq. (6) to ΔGW→Ol in Eq. (2). We
show strong linear correlation for neutral compounds (r2 = 0.998), then observe that the asymptotes and Eq. (2) have the same signs and
strong acids (r2 = 0.959), and strong bases (r2 = 0.986). These results exponents of apK a and bpK a . For an acidic or a basic compound,
numerically validate the asymptotes of Eq. (6). if we consider the compound-specific pK a and substitute ΔGW→Ol
More importantly, the asymptotes provide a physically moti- by the compound’s GN (z∗ ) in the relevant among the two contri-
vated rationale for the two contributions of Eq. (2): apK a butions of Eq. (2), we indeed recover one of the asymptotes. As
J. Chem. Phys. 154, 244114 (2021); doi: 10.1063/5.0053931 154, 244114-7
© Author(s) 2021The Journal
ARTICLE scitation.org/journal/jcp
of Chemical Physics
FIG. 6. Simple asymptotic estimates [Eq. (6)] against reference permeability coefficients at neutral pH. (a) Neutral compounds, (b) strong acids, and (c) strong bases.
for neutral compounds, GN (z∗ ) is the only relevant quantity while same shift in −βGN (z∗ ). As such, the level of unsaturation is a
estimating permeability. determining factor but does not gradually impact −βGN (z∗ ).
Interestingly, previous Martini studies of ternary membranes
with DPPC and cholesterol have shown that DIPC and DAPC
E. Drug–membrane permeability across membranes strongly phase separate into a liquid-disordered (Ld) phase.51–53
The following paragraphs analyze how drug–membrane Inconsistent conclusions were drawn from different studies with
permeability changes according to membrane composition. We DOPC, pointing to a thermodynamic drive that is weak at best.52,54,55
hypothesize that the functional form of SISSO 1D is applicable As for POPC, there is no sign of phase transition.52 The results
to other lipid membranes and use it as a starting point. We take on Fig. 7 mirror these trends: we find a clear shift of −βGN (z∗ ),
advantage of the above-mentioned asymptotic regimes to limit the depending on the ability of the membrane to form an Ld domain.
amount of information needed from new membranes. The regime of The Ld-domain formation of course hinges on the presence of
neutral compounds described in Eq. (6) can be used advantageously DPPC and cholesterol, which are notably absent from our refer-
because it only requires information on neutral PMFs. We rely ence simulations.45 The trends are surprising in that they show
on the dataset of Hoffmann et al., which precisely contains PMF a dependence on lipid-tail unsaturation that is stepwise rather
information—but no permeability—in various membranes and only than proportional. While we defer a more detailed study to future
for neutral compounds.45 We specifically analyze the change in work, we suggest the role of the entropic character of the lipid-tail
permeability when turning to phosphocholine (PC) membranes fluctuations.
made of different lipids, varying in both the tail length and level of Other studies before us have reported a clear change in per-
unsaturation. meability between Ld and Lo domains: Ghysels et al. used both
Figure 7 shows the relation of −βGN (z∗ )—the dominant term
for the permeability of neutral compounds [Eq. (6)]—between the
original membrane used in this work, DOPC, and others. All curves
follow a line, indicating that the asymptotic regime for neutral com-
pounds of Eq. (6) holds for all membranes. We find two families
of lines with different intercepts: DLPC, DPPC, and POPC show an
intercept with DOPC that is roughly 0, while DIPC and DAPC have
an intercept that is ∼1.4.
To better understand these results, we first recall that GN (z∗ )
corresponds to the highest value of the neutral PMF. We can safely
ignore contributions of the charged PMFs such that GN (z∗ ) denotes
the highest point of the effective PMF. The excellent agreement
between DLPC and DPPC indicates that the tail length (3 and 4
beads long, respectively) does not impact the permeability. This is
expected, given that the tail length is only expected to change the
length, but not the height, of the hydrophobic plateau. On the other
hand, the further agreement between them and POPC and DOPC
indicates a lack of dependence on tail saturation for these lipids
(1 and 2 unsaturated beads, respectively). Remarkably, the shift in FIG. 7. Variation of −βGN (z∗ ) between the original membrane, DOPC, and
the intercept appears only for DIPC and DAPC—lipids that exhibit others. Note the shift between (i) DLPC, DPPC, and POPC and (ii) DIPC and
more unsaturations: 4 and 8, respectively. Notably, they display the DAPC.
J. Chem. Phys. 154, 244114 (2021); doi: 10.1063/5.0053931 154, 244114-8
© Author(s) 2021The Journal
ARTICLE scitation.org/journal/jcp
of Chemical Physics
atomistic simulations and electron paramagnetic resonance spec- (Ld) and liquid-ordered (Lo) domains. The approach offers a data-
troscopy experiments on the permeation of water and oxygen and driven, interpretable analysis of drug–membrane passive permeabil-
found a permeability ratio of P(Ld)/P(Lo) ≈ 3.56 Here, the CG sim- ity across both drugs and membranes.
ulations yield a shift in −βGN (z∗ ), which translates into a ratio of
the permeability coefficients of ≈ 25. Our estimates are thus within SUPPLEMENTARY MATERIAL
one log10 unit of the results of Ghysels et al. for their specific com-
pounds. The mechanism remains to be clearly identified, although See the supplementary material for definitions of dissociation
this could be consistent with the proposed role of local membrane constants (apK a and bpK a ), the distribution of compounds across
surface density (i.e., its propensity to form transient holes).57 permeability, Table I along with the error values, the list of best one-
To summarize, our use of single-component lipid mem- dimensional descriptors, and the SISSO input script.
branes only allows us to speculate the shift in Fig. 7. The link
to Lo/Ld-domain formation is in line with prior atomistic simu- ACKNOWLEDGMENTS
lations and experiments for specific compounds.56 In the broader The authors thank Oleksandra Kukharenko, Roberto
context, our results could help generalize their results across the Menichetti, and Yasemin Bozkurt Varolgüneş for critical reading of
chemical space of drugs. The results also suggest simple additive the manuscript and Kiran Kanekal and Martin Girard for insightful
corrections to our effective equation when considering different discussions. Data analysis relied extensively on the open source
membranes. packages Numpy,58 Matplotlib,59 and Pandas.60,61 We acknowl-
edge support from BiGmax, the Max Planck Society’s Research
IV. CONCLUSIONS Network on Big-Data-Driven Materials Science. T.B. was partially
supported by the Emmy Noether Programme of the Deutsche
We propose to learn the functional relationship between Forschungsgemeinschaft (DFG).
hydrophobicity and acidity as a simple surrogate for passive mem-
brane permeability. Our approach, combining symbolic regression
and compressed sensing, is data-driven and interpretable and based DATA AVAILABILITY
on large databases of high-throughput coarse-grained simulations.
In this study, we used the database provided by Menichetti
Sure-Independence Screening and Sparsifying Operator (SISSO)
et al.16 It is openly available at https://doi.org/10.1021/acscentsci.
builds a hierarchy of models of increasing complexity. Models prove
8b00718.
increasingly accurate, yet more complex models are more prone
to discrepancies for a few outliers. Our SISSO 1D model offers
improved accuracy compared to the hydrophobicity baseline and yet REFERENCES
excellent interpretability. We identify the simple and interpretable 1
C. A. Lipinski, F. Lombardo, B. W. Dominy, and P. J. Feeney, “Experimental
equation f 1D = c01D + c11D (apKa − bpKa − 2βΔGW→Ol ), where apK a and computational approaches to estimate solubility and permeability in drug
and bpK a characterize acidity, ΔGW→Ol is the water/octanol parti- discovery and development settings,” Adv. Drug Delivery Rev. 46, 3–26
tioning coefficient, and c01D and c11D are the only two fitting para- (2001).
2
meters. We rationalize the model by an analysis of the asymptotic A. Avdeef, Absorption and Drug Development: Solubility, Permeability, and
regimes of the inhomogeneous solubility–diffusion model (ISDM). Charge State (John Wiley & Sons, 2012).
3
The asymptotes are validated numerically and confirm the SISSO L. Di and E. H. Kerns, Drug-Like Properties: Concepts, Structure Design and
Methods from ADME to Toxicity Optimization (Academic Press, 2015).
1D equation, implicitly testifying to the accuracy of the underlying 4
F. Broccatelli, L. Salphati, E. Plise, J. Cheong, A. Gobbi, M.-L. Lee, and I. Aliagas,
HTCG resolution. Broad agreement numerically validates the use “Predicting passive permeability of drug-like molecules from chemical structure:
of a single bulk hydrophobicity measure to effectively replace the Where are we?,” Mol. Pharm. 13, 4199–4208 (2016).
potential of mean force, which has been exploited by others before.11 5
N. Bodor, A. Harget, and M. J. Huang, “Neural network studies. 1. Estimation of
Importantly, the interplay of hydrophobicity together with acidity the aqueous solubility of organic compounds,” J. Am. Chem. Soc. 113, 9480–9483
leads to a significant improvement in the model accuracy of the (1991).
6
SISSO 1D equation for ionizable groups. The SISSO equations show C. M. Dobson, “Chemical space and biology,” Nature 432, 824–828 (2004).
7
improvements over a challenging set of compounds that are much L. H. Gilpin, D. Bau, B. Z. Yuan, A. Bajwa, M. Specter, and L. Kagal, “Explaining
explanations: An overview of interpretability of machine learning,” in 2018 IEEE
larger than the training set. Critically, our work refines the common
5th International Conference on Data Science and Advanced Analytics (DSAA)
role of hydrophobicity in passive permeation to relate it functionally (IEEE, 2018).
with acidity. 8
T. Bereau, “Computational compound screening of biomolecules and soft mate-
The separation of the ISDM in asymptotic regimes allows us rials by molecular simulations,” Modell. Simul. Mater. Sci. Eng. 29, 023001
to build drug-permeability models across membranes with limited (2021).
9
information only. Using only the potential of mean force of neu- M. Orsi and J. W. Essex, “Passive permeation across lipid bilayers: A litera-
tral solutes, we infer the change in permeability for membranes ture review,” in Molecular Simulations and Biomembranes: From Biophysics to
with lipids of varying tail length and level of unsaturation. We Function (The Royal Society of Chemistry, 2010), pp. 76–90.
10
T. S. Carpenter, D. A. Kirshner, E. Y. Lau, S. E. Wong, J. P. Nilmeier, and F.
observe a surprising change in permeability coefficient: lipid-tail
C. Lightstone, “A method to predict blood-brain barrier permeability of drug-
unsaturation contributes stepwise rather than proportionally. Our like compounds using molecular dynamics simulations,” Biophys. J. 107, 630–641
findings are in line with recent atomistic simulations and electron (2014).
paramagnetic resonance spectroscopy experiments, highlighting the 11
C. T. Lee, J. Comer, C. Herndon, N. Leung, A. Pavlova, R. V. Swift, C.
distinction between lipids primarily involved in liquid-disordered Tung, C. N. Rowley, R. E. Amaro, C. Chipot, Y. Wang, and J. C. Gumbart,
J. Chem. Phys. 154, 244114 (2021); doi: 10.1063/5.0053931 154, 244114-9
© Author(s) 2021The Journal
ARTICLE scitation.org/journal/jcp
of Chemical Physics
“Simulation-based approaches for determining membrane permeability of small descriptor in an immensity of offered candidates,” Phys. Rev. Mater. 2, 083802
compounds,” J. Chem. Inf. Model. 56, 721–733 (2016). (2018).
12 37
S. J. Marrink, A. H. de Vries, and A. E. Mark, “Coarse grained model for R. Ouyang, E. Ahmetcik, C. Carbogno, M. Scheffler, and L. M. Ghir-
semiquantitative lipid simulations,” J. Phys. Chem. B 108, 750–760 (2004). inghelli, “Simultaneous learning of several materials properties from
13 incomplete databases with multi-task SISSO,” J. Phys.: Mater. 2, 024002
S. J. Marrink, H. J. Risselada, S. Yefimov, D. P. Tieleman, and A. H. de Vries,
“The Martini force field: Coarse grained model for biomolecular simulations,” (2019).
38
J. Phys. Chem. B 111, 7812–7824 (2007). D. L. Donoho, “Compressed sensing,” IEEE Trans. Inf. Theory 52, 1289–1306
14
S. J. Marrink and D. P. Tieleman, “Perspective on the Martini model,” Chem. (2006).
39
Soc. Rev. 42, 6801–6822 (2013). E. J. Candes, J. Romberg, and T. Tao, “Robust uncertainty principles: Exact sig-
15
R. Alessandri, F. Grünewald, and S. J. Marrink, “The martini model in materials nal reconstruction from highly incomplete frequency information,” IEEE Trans.
science,” Adv. Mater. 33, 2008635 (2021). Inf. Theory 52, 489–509 (2006).
16 40
R. Menichetti, K. H. Kanekal, and T. Bereau, “Drug–membrane permeability R. G. Baraniuk, “Compressive sensing,” IEEE Signal Process. Mag. 24, 118–121
across chemical space,” ACS Cent. Sci. 5, 290–298 (2019). (2007).
17 41
K. H. Kanekal and T. Bereau, “Resolution limit of data-driven coarse-grained I. V. Tetko and V. Y. Tanchuk, “Application of associative neural networks for
models spanning chemical space,” J. Chem. Phys. 151, 164106 (2019). prediction of lipophilicity in ALOGPS 2.1 program,” J. Chem. Inf. Comput. Sci.
18
L. M. Ghiringhelli, J. Vybiral, S. V. Levchenko, C. Draxl, and M. Scheffler, “Big 42, 1136–1145 (2002).
42
data of materials science: Critical role of the descriptor,” Phys. Rev. Lett. 114, See https://chemaxon.com/products/marvin for calculator plugin of chemaxon
105503 (2015). marvin; accessed 12 January 2021.
19 43
S. L. Brunton, J. L. Proctor, and J. N. Kutz, “Discovering governing equations T. Fink, H. Bruggesser, and J.-L. Reymond, “Virtual exploration of the small-
from data by sparse identification of nonlinear dynamical systems,” Proc. Natl. molecule chemical universe below 160 daltons,” Angew. Chem., Int. Ed. 44,
Acad. Sci. U. S. A. 113, 3932–3937 (2016). 1504–1508 (2005).
20 44
M. Schmidt and H. Lipson, “Distilling free-form natural laws from experimental S. L. Dixon and P. C. Jurs, “Estimation of pK a for organic oxy-
data,” Science 324, 81–85 (2009). acids using calculated atomic charges,” J. Comput. Chem. 14, 1460–1467
21
S.-M. Udrescu and M. Tegmark, “AI Feynman: A physics-inspired method for (1993).
45
symbolic regression,” Sci. Adv. 6, eaay2631 (2020). C. Hoffmann, A. Centi, R. Menichetti, and T. Bereau, “Molecular dynamics
22
D. B. Kell and S. G. Oliver, “How drugs get into cells: Tested and testable pre- trajectories for 630 coarse-grained drug-membrane permeations,” Sci. Data 7, 51
dictions to help discriminate between transporter-mediated uptake and lipoidal (2020).
46
bilayer diffusion,” Front. Pharmacol. 5, 231 (2014). R. Ouyang, SISSO, https://github.com/rouyang2017/SISSO, 2017.
23 47
H. Meyer, “Zur theorie der alkoholnarkose,” Arch. Exp. Pathol. Pharmakol. 42, C. Liao and M. C. Nicklaus, “Comparison of nine programs predicting pK a
109–118 (1899). values of pharmaceutical substances,” J. Chem. Inf. Model. 49, 2801–2812
24
C. E. Overton, Studien Über die Narkose: Zugleich ein Beitrag zur Allgemeinen (2009).
48
Pharmakologie (G. Fischer, 1901). M. Feher and J. M. Schmidt, “Property distributions: Differences between drugs,
25
V. A. Levin, “Relationship of octanol/water partition coefficient and molecular natural products, and molecules from combinatorial chemistry,” J. Chem. Inf.
weight to rat brain capillary permeability,” J. Med. Chem. 23, 682–684 (1980). Comput. Sci. 43, 218–227 (2003).
26 49
J. M. Diamond and Y. Katz, “Interpretation of nonelectrolyte partition coef- R. Menichetti and T. Bereau, “Revisiting the Meyer-Overton rule for drug-
ficients between dimyristoyl lecithin and water,” J. Membr. Biol. 17, 121–154 membrane permeabilities,” Mol. Phys. 117, 2900–2909 (2019).
50
(1974). R. Menichetti, K. H. Kanekal, K. Kremer, and T. Bereau, “In silico screen-
27
B. K. Radak, C. Chipot, D. Suh, S. Jo, W. Jiang, J. C. Phillips, K. Schulten, and ing of drug-membrane thermodynamics reveals linear relations between bulk
B. Roux, “Constant-pH molecular dynamics simulations for large biomolecular partitioning and the potential of mean force,” J. Chem. Phys. 147, 125101
systems,” J. Chem. Theory Comput. 13, 5933–5944 (2017). (2017).
28 51
D. T. Manallack, “The pK a distribution of drugs: Application to drug discovery,” C. Rosetti and C. Pastorino, “Comparison of ternary bilayer mixtures with
Perspect. Med. Chem. 1, 1177391X0700100 (2007). asymmetric or symmetric unsaturated phosphatidylcholine lipids by coarse
29 grained molecular dynamics simulations,” J. Phys. Chem. B 116, 3525–3537
D. T. Manallack, R. J. Prankerd, E. Yuriev, T. I. Oprea, and D. K. Chalmers,
“The significance of acid/base properties in drug discovery,” Chem. Soc. Rev. 42, (2012).
52
485–496 (2013). R. S. Davis, P. B. Sunil Kumar, M. M. Sperotto, and M. Laradji, “Predictions
30 of phase separation in three-component lipid membranes by the MARTINI force
P. A. Shore, B. B. Brodie, and C. A. M. Hogben, “The gastric secretion of drugs:
A pH partition hypothesis,” J. Pharmacol. Exp. Ther. 119, 361–369 (1957). field,” J. Phys. Chem. B 117, 4072–4080 (2013).
31 53
S. M. Saparov, Y. N. Antonenko, and P. Pohl, “A new model of weak acid per- G. A. Pantelopulos and J. E. Straub, “Regimes of complex lipid bilayer
meation through membranes revisited: Does Overton still rule?,” Biophys. J. 90, phases induced by cholesterol concentration in MD simulation,” Biophys. J. 115,
L86–L88 (2006). 2167–2178 (2018).
32 54
P. Langguth, A. Kubis, G. Krumbiegel, W. Lang, H. P. Merkle, W. Wächter, S. Baoukina, E. Mendez-Villuendas, and D. P. Tieleman, “Molecular view of
H. Spahn-Langguth, and R. Weyhenmeyer, “Intestinal absorption of the quater- phase coexistence in lipid monolayers,” J. Am. Chem. Soc. 134, 17543–17553
nary trospium chloride: Permeability-lowering factors and bioavailabilities for (2012).
55
oral dosage forms,” Eur. J. Pharm. Biopharm. 43, 265–272 (1997). M. Girard and T. Bereau, “Regulating lipid composition rationalizes
33 acyl tail saturation homeostasis in ectotherms,” Biophys. J. 119, 892–899
H. Fischer, M. Kansy, A. Avdeef, and F. Senner, “Permeation of permanently
positive charged molecules through artificial membranes—Influence of physico- (2020).
56
chemical properties,” Eur. J. Pharm. Sci. 31, 32–42 (2007). A. Ghysels, A. Krämer, R. M. Venable, W. E. Teague, E. Lyman, K. Gawrisch,
34
K. Palm, K. Luthman, J. Ros, J. Gråsjö, and P. Artursson, “Effect of molecular and R. W. Pastor, “Permeability of membranes in the liquid ordered and liquid
charge on intestinal epithelial drug transport: pH-dependent transport of cationic disordered phases,” Nat. Commun. 10, 5616 (2019).
57
drugs,” J. Pharmacol. Exp. Ther. 291, 435–443 (1999). C. Liu, P. Elvati, S. Majumder, Y. Wang, A. P. Liu, and A. Violi, “Predicting the
35
Z. Yue, C. Li, G. A. Voth, and J. M. J. Swanson, “Dynamic protonation dramat- time of entry of nanoparticles in lipid membranes,” ACS Nano 13, 10221–10232
ically affects the membrane permeability of drug-like molecules,” J. Am. Chem. (2019).
58
Soc. 141, 13421–13433 (2019). C. R. Harris, K. J. Millman, S. J. van der Walt, R. Gommers, P. Virtanen, D.
36
R. Ouyang, S. Curtarolo, E. Ahmetcik, M. Scheffler, and L. M. Ghiringhelli, Cournapeau, E. Wieser, J. Taylor, S. Berg, N. J. Smith, R. Kern, M. Picus, S. Hoyer,
“SISSO: A compressed-sensing method for identifying the best low-dimensional M. H. van Kerkwijk, M. Brett, A. Haldane, J. F. del Río, M. Wiebe, P. Peterson,
J. Chem. Phys. 154, 244114 (2021); doi: 10.1063/5.0053931 154, 244114-10
© Author(s) 2021You can also read