How much can air conditioning increase air temperatures for a city like Paris, France?
←
→
Page content transcription
If your browser does not render page correctly, please read the page content below
INTERNATIONAL JOURNAL OF CLIMATOLOGY
Int. J. Climatol. 33: 210–227 (2013)
Published online 17 January 2012 in Wiley Online Library
(wileyonlinelibrary.com) DOI: 10.1002/joc.3415
How much can air conditioning increase air temperatures
for a city like Paris, France?
Cécile de Munck,a * Grégoire Pigeon,a Valéry Masson,a Francis Meunier,b Pierre Bousquet,b
Brice Tréméac,b Michèle Merchat,c Pierre Poeufc and Colette Marchadiera
a CNRM/GAME, Météo France, 42 avenue Gaspard Coriolis, 31 057 Toulouse Cedex, France
b LGP2ES (EA21), CNAM IFFI, Case 331, 292 rue Saint Martin, 75 141 Paris Cedex 03, France
c Climespace, 185 rue de Bercy, 75 012 Paris, France
ABSTRACT: A consequence of urban heat islands in summer is an increase in the use of air conditioning in urbanized
areas, which while cooling the insides of buildings, releases waste heat to the atmosphere. A coupled model consisting
of a meso-scale meteorological model (MESO-NH) and an urban energy balance model (TEB) has been used to simulate
and quantify the potential impacts on street temperature of four air conditioning scenarios at the scale of Paris. The first
case consists of simulating the current types of systems in the city and was based on inventories of dry and evaporative
cooling towers and free cooling systems with the river Seine. The other three scenarios were chosen to test the impacts
of likely trends in air conditioning equipment in the city: one for which all evaporative and free cooling systems were
replaced by dry systems, and the other two designed on a future doubling of the overall air conditioning power but with
different technologies. The comparison between the scenarios with heat releases in the street and the baseline case without
air conditioning showed a systematic increase in the street air temperature, and this increase was greater at nighttime
than day time. It is counter-intuitive because the heat releases are higher during the day. This is due to the shallower
atmospheric boundary layer during the night. The increase in temperature was 0.5 ° C in the situation with current heat
releases, 1 ° C with current releases converted to only sensible heat, and 2 ° C for the future doubling of air conditioning
waste heat released to air. These results demonstrated to what extent the use of air conditioning could enhance street air
temperatures at the scale of a city like Paris, and the importance of a spatialized approach for a reasoned planning for
future deployment of air conditioning in the city. Copyright 2012 Royal Meteorological Society
KEY WORDS meso-scale atmospheric modelling; air conditioning; urban micro-climate; urban heat island
Received 15 June 2011; Revised 21 October 2011; Accepted 23 November 2011
1. Introduction Hence, considering that the use of AC systems, while
During the 2003 European heat wave, which could be cooling the insides of buildings, releases waste heat to
representative of a normal summer by the end of the the lower part of the urban atmosphere, it is legitimate to
century (Déqué, personal communication), the urban heat question its effect on the local climate at the scale of the
island (UHI) observed in Paris, with temperatures up city. What is the order of magnitude of potential impacts
to 8 ° C higher in central Paris than in the countryside, on street air temperatures? Are they localized or spread
exacerbated the heat stress situation. Paris is faced with out? Do they worsen during the day or during the night?
an increasing urban population, a specific micro-climate, Are they dependent on the density of AC installations
and recent episodes of high summer temperatures. In this and the cooling technology implemented such as dry and
context, the cooling requirements for the city of Paris, evaporative cooling towers and free cooling systems?
in order to cool or maintain constant the temperature Literature is scarce on the effects of AC on urban
of goods and people for health, comfort, commercial microclimates worldwide. Surprisingly, the literature on
and industrial reasons, could increase. Current energy North American urban areas (Akbari et al., 2001; Akbari
demand projections suggest that air conditioning (AC) and Konopacki, 2004; Salamanca et al., 2011) or Euro-
usage is likely to increase significantly in the short pean cities, such as Athens (Hassid et al., 2000) and
term. The Energy Efficiency and Certification of Central London (Kolokotroni et al., 2006), mainly focuses on the
Air Conditioners Report commissioned in 2003 by the impact of the urban heat islands on AC-related energy
European Union (Adnot, 2003b) forecasts a doubling of consumption/demand but not on the feedback on out-
the energy consumption due to AC by 2020 in France. door temperatures. On this point, studies were only found
for one North American city (Houston) and three Asian
∗ Correspondence to: C. de Munck, CNRM/GAME, Météo France, 42 cities (Tokyo, Taipei and Wuhan), and they differ in the
avenue Gaspard Coriolis, 31 057 Toulouse Cedex, France. level of sophistication of the models that the authors
E-mail: cecile.demunck@meteo.fr used and the spatial scale that they focused on. Of those
Copyright 2012 Royal Meteorological Society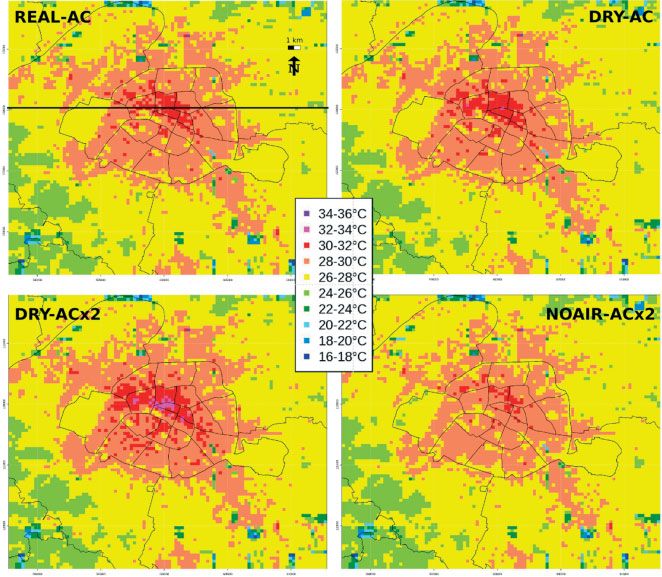
MODELLING IMPACTS OF AIR CONDITIONING ON PARIS MICRO-CLIMATE 211
studies, that of Salamanca et al. (2011) investigated the has yet been carried out at a larger scale than the
feedbacks of AC systems on outdoor air temperatures neighbourhood with detailed meso-scale models. The
at the scale of Houston City (Texas) based on the cou- present paper describes the methodology implemented to
pling between a meso-scale model, a multilayer urban do so at the scale of Paris City. Simulation results are
canopy model and a simple building energy model. They presented for a set of AC scenarios chosen to represent
found an increase in night temperatures of up to 2 ° C in likely equipments for the city, currently (based on the
the densest areas of Houston. For Tokyo, Ohashi et al. inventory of current AC waste heat emissions) and in the
(2007) have simulated a 1–2 ° C increase in air tempera- near future.
tures in the office districts due to AC usage during week
days, by using a multilayer urban canopy model and a
building energy analysis model. Kikegawa et al. (2003)
2. Methodology
used a coupled model consisting of a building energy
analysis model, an urban canopy model and a meso- 2.1. Overview
scale meteorological model. Their simulation results were
focussed on a single office district in central Tokyo and The methodology implemented in this work (Figure 1)
corroborate Ohashi et al. (2007) findings, with an aver- is a numerical atmospheric meso-scale simulation of
age 1 ° C increase in street air temperature across three air the 2003 European heat wave for the City of Paris
conditioner-placement scenarios. The Hsieh et al. (2007) for different scenarios of AC usage. With the aim
study, based on a building energy software (EnergyPlus) of comparing and estimating the influence of cooling
and a computational fluid dynamics software (Windper- systems on the street air temperatures and the magnitude
fect), shows a similar effect on street air temperature of the UHI of Paris City, several configurations/scenarios
for the densest residential district of Taipei city where of AC were simulated (Table I) by varying the form of
buildings were equipped with window-type air condi- heat waste discharged to the atmosphere (as sensible or
tioners: a local temperature rise between 0.78 ° C and latent heat), the distribution pattern of AC (individual
1.84 ° C, with the maximum rise occurring between 23 : 00 versus networked systems) or the intensity of cooling
and 24 : 00 h. Contrary to previous studies, figures for power. The different cases of AC usage are as follows:
the city of Wuhan (China) were obtained by Wen and
Lian (2009) based on simple calculations (box model (1) without AC to allow referring to a baseline (NO-AC),
type). They show that domestic air conditioner usage (2) with the current types of AC systems coexisting in
may increase Wuhan City’s mean temperature of 0.2 the city, dry and evaporative cooling towers and free
or 2.56 ° C, depending on the temperature profile mod- cooling systems (REAL-AC),
elled for the city (under normal or inversion conditions, (3) with all current AC systems converted to dry cooling
respectively). systems (DRY-AC),
However, no estimate of the impacts of different (4) a future projection of AC, with doubling of the dry
types of cooling technologies on outdoor temperatures waste heat releases (DRY-ACx2),
Figure 1. General methodology. This figure is available in colour online at wileyonlinelibrary.com/journal/joc
Copyright 2012 Royal Meteorological Society Int. J. Climatol. 33: 210–227 (2013)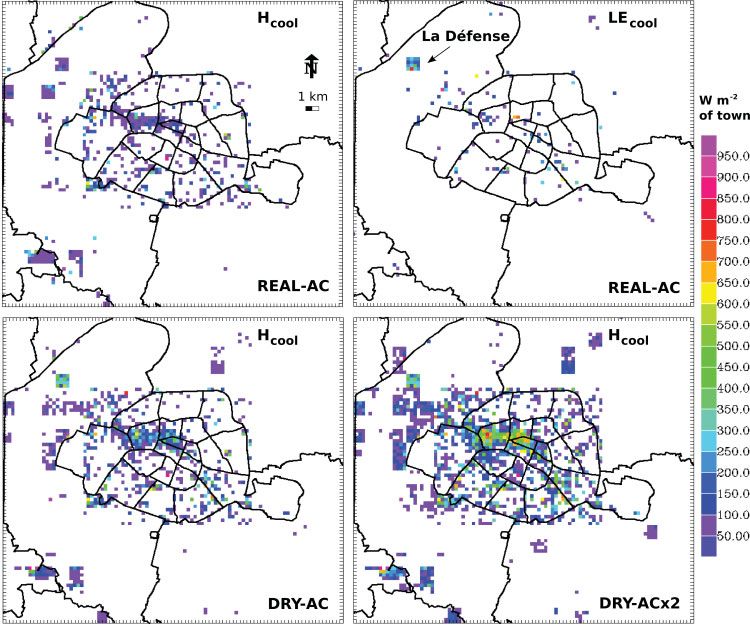
212 C. DE MUNCK et al.
Table I. Air conditioning scenarios.
Case Description
NO-AC A scenario without AC (baseline)
REAL-AC The current situation with an overall heat release power of 5.16 GW, which encompasses three types of
AC systems in the city:
• dry air conditioners discharging sensible waste heat to air implemented for individual flats or
houses (such as window units) or at the scale of a building (such as rooftop units),
• evaporative air conditioners (such as evaporative cooling towers) discharging 95% of latent waste
heat and 5% of sensible waste heat to air implemented at the scale of a building or a
neighbourhood, with a distribution network,
• free cooling systems discharging waste heat to the river Seine and implemented at the scale of a
neighbourhood with a district network (such as the ones developed and maintained by the
Climespace Company).
DRY-AC Same overall heat release power than in the REAL-AC case, with conversion of latent heat releases to
sensible releases (which implies that all evaporative air conditioners are replaced by dry air conditioners).
Moreover, we assume that systems are autonomous and that network districts disappear. Consequently, the
heat releases are located where the cooling power is used.
DRY-ACx2 A future projection of AC usage assuming a doubling of the overall power of the heat released over the
simulation domain covered only by dry air conditioners. This increase would be mainly due to an increase
in usage in the office district. The overall power of the sensible heat released (10.32 GW) is distributed
with two thirds in central Paris and one third outside. The distribution is carried out by increasing the
power of the grid cells up to what the floor area can allow.
NOAIR-ACx2 A future projection of AC usage for which all the cooling needs for Paris are satisfied by free cooling
district networks that do not release their waste heat to air. The cooling power inside the buildings is kept
identical to that of scenario DRY-ACx2.
(5) a future projection of AC with the same cooling weather conditions Paris and its inhabitants are likely to
power as in scenario DRY-ACx2 but without dis- face in the future.
charging waste heat to air, implying the use of alter- The summer of 2003 has been the warmest in France
native methods for heat discharge (NOAIR-ACx2). since the establishment of the French weather station
network (in 1951). The heat wave observed during
The choice for dry scenarios is based on the assumption the month of August 2003 was notable not only by
that existing evaporative cooling towers (with a lifetime the amplitude of its maximum temperature but also by
of around 15 years) might be replaced in the future by dry its records for night temperatures (above 25 ° C on the
cooling towers because of their heavy maintenance and 11th and 12th of August in the Park Montsouris on
the fear associated with the risk of legionellosis. Then the the southern outskirts of inner Paris (Figure 2), and its
nationwide projections of AC usage from Adnot (2003a, duration (about 2 weeks). There was a gradual rise in
2003b) allowed to choose a realistic figure for future temperatures between the 1st and 5th of August (with
projections of heat releases. Not only is doubling the first record-breaking temperatures in the southwest of
power of AC releases a realistic hypothesis for the 2020s France on the 3rd and 4th of August) followed by a
(even if it is probably underestimated), but its tangible period of high heat until the 13th of August, the date
aspect also facilitates the interpretation of simulation of the beginning of the gradual decline in temperatures
outputs. (Bessemoulin et al., 2004). Consequently, we focused on
Finally, the outputs of numerical models were statisti- a 6-day simulation period, extending from the 8th to the
cally processed to derive two indicators: the temperature 13th of August, chosen to be the hottest period of the heat
anomalies in the streets and the characteristics of Paris wave. At the scale of France, this period was marked by
heat island. settled anticyclonic conditions, with dry and stable air
masses in the lower layers of the atmosphere which got
warmer and warmer until the 14th of August, the date
2.2. Meteorological conditions
marking the end of the heat wave.
We have chosen to simulate the meteorological conditions Moreover, Bessemoulin et al. (2004) noted that the
of the 2003 European heat wave because this heat wave temperature records of the 11th and 12th of August
is estimated to be representative in mean temperature of in Paris were aggravated by the presence of a low
summers of the second half of the 21st century, according wind, which had implications not only in terms of
to the Météo France global climate model projection pollution (non-dispersion of pollutants accentuated) but
(Déqué, personal communication). The characteristics of also in terms of health (higher risk of non-cooling of
this heat wave allow us to understand what kind of the body). Moisture, which is also recognized as an
Copyright 2012 Royal Meteorological Society Int. J. Climatol. 33: 210–227 (2013)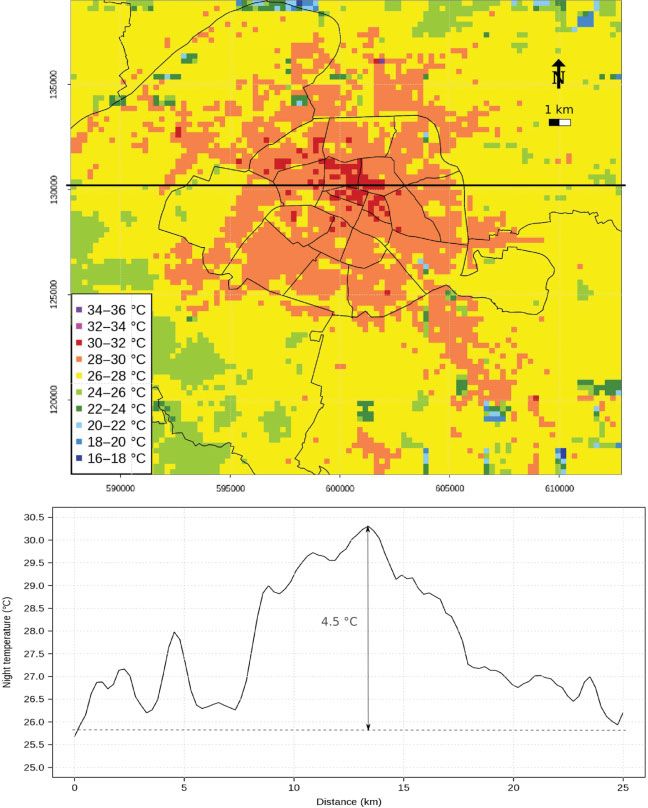
MODELLING IMPACTS OF AIR CONDITIONING ON PARIS MICRO-CLIMATE 213
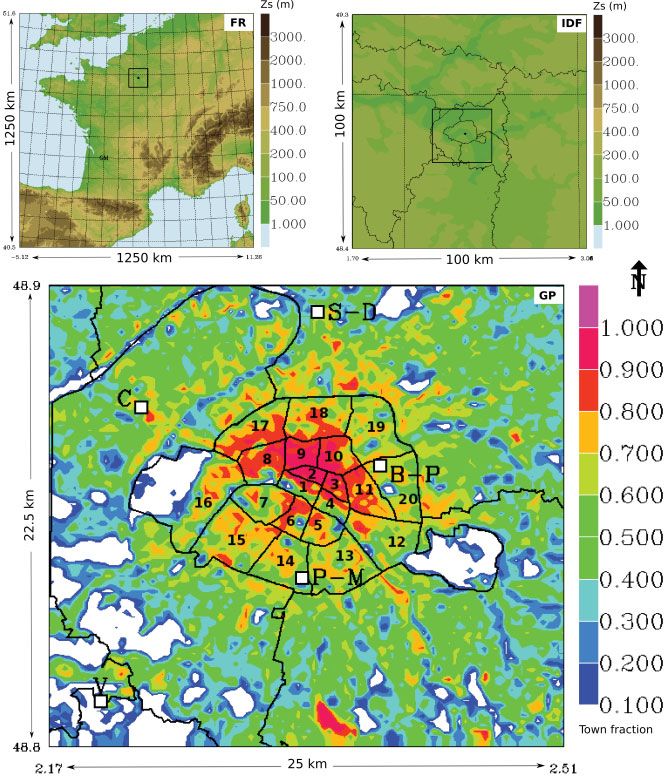
Figure 2. The three-nested simulation domains for the three spatial resolutions (FR: 2.5 km; IDF: 1.25 km; GP: 250 m). Orography (Zs) is
shown for FR and IDF, town fraction for GP. On GP domain are also annotated the locations of 5 weather stations (V for Villacoublay, C for
Courbevoie, S-D for Saint-Denis, B-P for Belleville-Park, P-M for Paris-Montsouris) and inner Paris district numbers.
aggravating factor in heat waves, has not played a countryside northwest of Paris and central Paris (i.e. for a
determinant role because the situation remained relatively distance of 65 km), with the mean minimum temperature
dry all along that period except for some sporadic storm rising up to 24 ° C in central Paris when the countryside
events. These storms, often occurring in mountainous peaked at 16 ° C. At a smaller scale, between the city
regions, were also observed over plains, with variable centre and the limit of the dense agglomeration of Paris
daily precipitation totals (3–35 mm). These precipitation (4 km from Notre Dame Cathedral, Paris), the magnitude
events might have affected the IDF region on the 10th, of the nighttime heat island was about 4 ° C.
11th and 13th of August (Figure A1). Also, the effects
of the heat wave over the capital were compounded at 2.3. Atmospheric model implementation
nighttime due to the smaller decline in temperatures in The simulations were performed with a coupled model
the city than in its surroundings (UHI). On the basis of consisting of the non-hydrostatic meso-scale atmospheric
a spatial extrapolation of station records (available at model MESO-NH (Lafore et al., 1998; Stein et al., 2000)
http://climascope.meteo.fr/), it was possible to estimate and four surface-atmosphere energy-exchange models
the intensity of the Paris nighttime heat island during gathered in the SURFEX numerical tool. The implemen-
the 2003 heat wave: it reached about 8 ° C between the tation of the models actually rely on a combination of
Copyright 2012 Royal Meteorological Society Int. J. Climatol. 33: 210–227 (2013)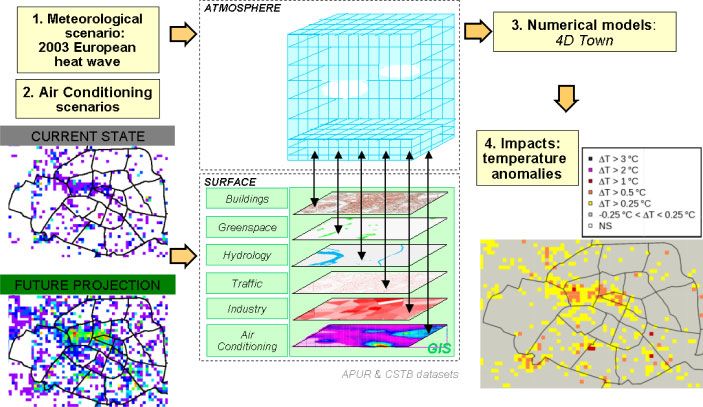
214 C. DE MUNCK et al.
3 nested domains (Stein et al., 2000) of different spatial energy consumptions for a wide range of cities under var-
and temporal resolutions to go down to a 250 m hori- ious climates and seasons: Vancouver and Mexico (Mas-
zontal resolution: the first domain includes all of France son et al., 2002), Marseille (Lemonsu et al., 2004), Basel
(FR, with a size of 500 × 500 grid cells and a 2.5 km res- (Hamdi and Masson, 2008), Łódź (Offerle et al., 2005),
olution, top left of Figure 2), while the second extends Toulouse (Pigeon et al., 2008) and Montréal (Lemonsu
to the Île-de-France region (IDF, with a size of 80 × 80 et al., 2010).
grid cells and a 1.25 km resolution, top right of Figure 2), TEB simulates the thermal functioning of a generic
and the third and last domain focuses on Greater Paris building (Figure 3): an energy balance is established on
(GP, domain of interest, with a size of 100 × 90 grid the outer surfaces of both wall and roof, taking into
cells and a 250 m resolution, bottom of Figure 2). To account the solar and infrared net radiation (Q*), the
model the period of interest (8–13 August 2003), the convective heat flux (QH ), and the water evaporation (QE )
atmospheric model running on FR is initiated and then for the roof. The evolution of the wall and roof internal
coupled at its lateral boundaries every 6 h with the anal- temperatures (Tw and Tr , respectively) by heat conduction
ysis of the weather forecasts from the European Centre is then solved at each time step by the model. Finally,
for Medium-Range Weather Forecasts (ECMWF). Then, exchanges with the air inside the building are calculated
the models running on the IDF and GP are nested 2 from the air temperature inside the building (Ti ). Ti is
ways. For the three simulation domains, a vertical grid described in a simplified way to account for the inertia
of 55 levels is used, with a stretched resolution ranging of buildings and the temperatures of the inner surfaces of
from 30 m at the lowest level to 1000 m at the high- walls and roofs (Masson et al., 2002).
est (17 600 m). The simulations are conducted using an
Eddy-Diffusivity Mass Flux (EDMF) approach. The mass 2.5. Baseline surface input data
flux scheme (Pergaud et al., 2009) simulates boundary The surface models require input data to estimate their
layer thermals (and cumuli clouds if any). The turbulence parameters. The terrain for each simulation domain was
scheme (Cuxart et al., 2000) uses a Turbulent Kinetic described by Shuttle Radar Topography Mission data
Energy (TKE) approach. The mixing length formula- (SRTM), the spatial resolution of which is finer than
tion varies with the spatial resolution of the simulation those of the simulation domains described. Then, land
domain: Bougeault and Lacarrère (1989) at 2.5 km and cover types (urbanized fraction, fractions of natural or
at 1.25 km, and that of Deardorff at 250 m. 3D turbulent agricultural covers, freshwater and ocean) for the two
fluxes are computed for the last two domains (1.25 km domains with the coarsest spatial resolution (FR and
and 250 m). IDF) were taken from the Ecoclimap database (Masson
et al., 2003). A specific database was developed by the
2.4. Surface model description
Paris Urban Planning Agency (APUR) to characterize
The four surface models allow to characterize each grid urban parameters necessary in TEB (Masson, 2000, for
cell of the simulation domain by four different land cov- the necessary parameters) at 250 m spatial resolution
ers (agricultural and natural land, urban areas, inland (APUR, 2007). It was based on surface inventories and
waters and sea or oceans). The surface schemes consist spatial analyses of the vector maps of buildings and
in Interaction between Soil Biosphere and Atmosphere parks and completed by the Scientific and Technical
(ISBA; Noilhan and Mahfouf, 1996) for agricultural and Construction Center (CSTB) for the radiative and thermal
natural land, and two parameterisations of the Charnock parameters of the materials.
(1955) formulation for inland waters, seas and oceans and Additional sources were needed for the estimation of
Town Energy Balance (TEB; Masson, 2000), designed for anthropogenic fluxes for the City of Paris. An initial
urban and artificial surfaces. Finally, water, heat (radi- estimate of the heat flow generated by the road traffic
ation, conduction, convection), momentum and carbon within the street canyon was completed and incorporated
dioxide fluxes between the Earth’s surface and the atmo- in the surface parameterisation. Within each grid cell of
sphere are aggregated according to the area fraction of the the Paris domain, this heat flow was approximated by
land covers within each grid cell. Within TEB, the urban weighting the global heat flow generated by traffic within
landscape is simplified as a network of street canyons Paris (Colombert, 2008) by the fraction of road within
(Figure 3) of infinite length and equiprobable orienta- the grid cell (normalized to the total fraction within the
tion. TEB simulates the exchanges of heat and water domain), and assuming that combustion of fuels generates
from three generic surfaces (road, wall, roof, Figure 3). 92% of sensible heat and 8% of latent heat, as postulated
In order to estimate microclimate within street canyons, by Pigeon et al. (2007).
TEB is generally used in conjunction with the Surface
Boundary Layer (SBL) model which solves vertical tur- 2.6. Modelling AC
bulent diffusion within the average street canyon from
2.6.1. Implementation of AC within TEB
the surface fluxes provided by the road, wall and roof
(Hamdi and Masson, 2008; Masson and Seity, 2009). In the baseline case (NO-AC), the indoor temperature
Off-line simulations with TEB have already demonstrated within the TEB model evolves in a simplified way
that TEB was able to accurately reproduce the energy bal- which accounts for the inertia of buildings and the
ance of urban surfaces, the street air temperatures and the temperatures of the inner surfaces of the walls. To
Copyright 2012 Royal Meteorological Society Int. J. Climatol. 33: 210–227 (2013)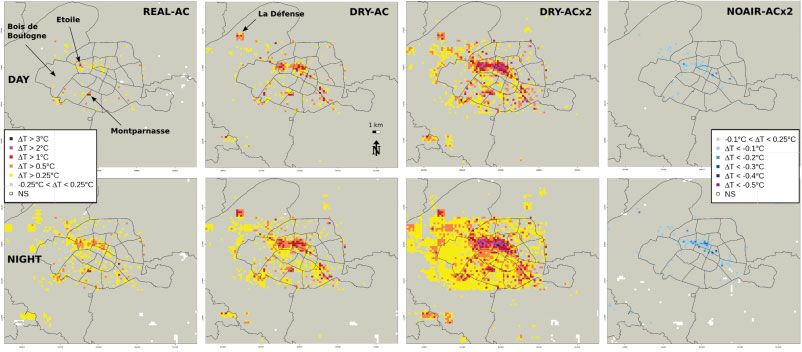
MODELLING IMPACTS OF AIR CONDITIONING ON PARIS MICRO-CLIMATE 215
Figure 3. Schematic description of TEB model, showing how AC is accounted for at the building level. This figure is available in colour online
at wileyonlinelibrary.com/journal/joc
Table II. Anthropogenic fluxes parameterisation within TEB.
Input data Unit Description
Hcool W.m−2 of urban area Maximum sensible waste heat flux associated with AC of buildings
LE cool W.m−2 of urban area Maximum latent waste heat flux associated with AC of buildings
Fcool – Fraction of air conditioned buildings
T I MEcool (j,h) – Coefficients for the hourly modulation of the maximum AC waste
heat flux, function of day type (j) and time of day (h)
Tcool °C Set-point temperature for air conditioned buildings
address the objectives of this study and account for AC at roof level. The new surface data necessary for the
usage, the TEB model has been slightly modified: the model are presented in Table II. Two forms of AC waste
cooling of buildings has been represented by limiting heat released to the atmosphere are accounted for, which
the indoor temperature of air conditioned buildings to allow to describe common types of AC systems: sensible
26 ° C (whereas, in the baseline case, there is no limiting heat for dry cooling systems (Hcool , bottom diagram of
of the indoor temperature), and by prescribing for those Figure 3) and latent heat for evaporative cooling towers
buildings the waste heat generated by air conditioners (LE cool , bottom diagram of Figure 3).
Copyright 2012 Royal Meteorological Society Int. J. Climatol. 33: 210–227 (2013)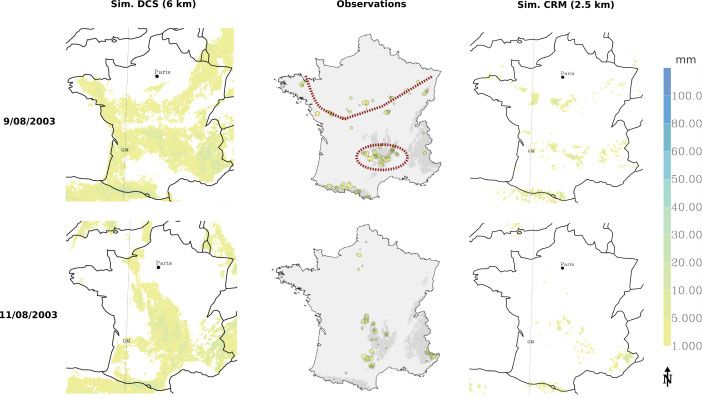
216 C. DE MUNCK et al.
This current implementation of AC within TEB, with a Finally, the heating of small corridors of the river Seine
single setpoint temperature for air conditioned buildings induced by the free cooling systems (4) was not inte-
and the integration of AC waste heat fluxes towards the grated because the analysis of their temperature records
energy balance of the roof, represents the cooling of (Climespace, personal communication) showed that they
buildings in a simplified way. Although 26 ° C is a legal would not cause a significant impact on the temperatures
setpoint for comfort cooling, it is common knowledge, for of the lower layers of air above the Seine. Then, in addi-
example, that most luxury hotels in Paris apply an internal tion to the sources of AC waste heat themselves, the
setpoint temperature below 26 ° C, and frequently around thermal discharge of the power transformers supplying
21 ° C or lower. Also, some processes require much more the AC systems was accounted for amounting to 3% of
cooling than required for comfort, as is the case, for the electrical power requested by the AC systems identi-
example, with the food industry. Also, since the AC heat fied.
discharges to the atmosphere are currently prescribed to Gathering the information from all the current sources
the model and not calculated from the cooling power of waste heat emission (AC systems and power trans-
demand of the buildings, it is not currently possible to formers) resulted in the sensible waste heat fluxes (Hcool )
model the retrofitting of the outdoor temperatures on the and latent waste heat fluxes (LEcool ) presented on top of
demand of cooling power in the buildings. Figure 4 for the REAL-AC case. These stand for maxi-
mum values which are modulated by the hourly schedules
2.6.2. AC current heat releases provided in Figure 5, depending on the day of the week
simulated. The hourly schedules of AC power demand
The AC systems currently used in Paris can be clas- for the period of simulation were gathered for each day
sified in four broad categories: (1) small dry cooling type of the week (weekday, Saturday, Sunday) based on
systems (from 6 to 70 kW per unit), (2) large dry cool- records from the Climespace Company, and then nor-
ing towers (for commercial centres, leisure facilities, data malized. In conclusion, the inventory of AC waste heat
centres. . .); both systems discharge sensible waste heat releases for the REAL-AC scenario reports a waste heat
to air, (3) evaporative cooling towers discharging latent power of 5.16 GW over the Paris domain and shows
waste heat to air, and (4) the free cooling plants (50 that sensible heat releases are more spread out than those
MW) developed by the Climespace Company discharg- of latent heat (Figure 4), which is consistent with the
ing waste heat to the river Seine. These last two types higher spatial density of small or large dry systems com-
of installations are mainly used for cooling large spaces, pared to evaporative cooling towers. Continuous zones
computer rooms, hospitals, and museums, or for cooling present sensible heat releases of about 75 Wm−2 of urban
industrial processes, and are sometimes distributed via cover area (top left of Figure 4), when higher values up
district networks such as those developed and maintained to 650–900 Wm−2 occur locally. The highest values are
by the Climespace Company. located at powerful evaporative cooling towers connected
The estimation of the heat released by dry AC systems to district networks and, in this case, a part of the cooling
(1 and 2) over the Paris domain was undertaken based power generated is used in grid cells adjacent to where
on a visual inventory via open-source satellite images for it is produced.
roof condensers and Google Street View for front con- Then, from these data of waste heat release, the build-
densers. The visual inventory of small condensers (1) was ing surface and a median level of cooling power require-
first carried out within inner Paris on a sub-sample of ment, the fraction of cooled buildings in each grid cell
five districts (1, 11, 14, 16 and 18, Figure 2), represen- was estimated. A cooling power of 90 Wm−2 of floor
tative in dwellings/businesses diversity and building type was chosen as being representative of a building fully
(building date, shape and allocation). The number and air conditioned (median value for various building types
the cooling power of the small dry condensers observed such as offices in central Paris, offices with data centres or
yielded two levels of dry waste heat intensity for these IT department, shops and malls, with 100% of air cooled
five districts: 8 and 34 W m−2 of ground area. Each grid floor area). Consequently, the fraction of air conditioned
cell of the GP simulation domain was classified according buildings (Fcool ) was calculated as follow for each grid
to these two levels. Then, the waste heat associated with cell.
the large dry cooling towers (2) was added to each grid
Hcool + LEcool
cell according to the number and the power of the instal-
zBLD
lations observed during the visualisation phase. In terms BLD ×
2.5
of collating data for the evaporative cooling towers (3), Fcool = min , 1
1 + COP
their inventory was facilitated by the legal requirement 90 ×
imposed on them, as ‘classified installations’, to declare COP
their power and other characteristics to the authorities
due to the sanitary hazard that they might carry. The col- where BLD is the grid cell average building plan area
lation of their cooling power was obtained upon request density of the urban area, zBLD is the grid cell average
from the ‘Prefecture de département’ (local authorities). building height, COP is the Coefficient of Performance
In terms of heat discharge, the waste heat is assumed taken as 2.5 and the floor-to-floor height is fixed at
partitioned into 95% latent heat and 5% sensible heat. 2.50 m. Then the waste heat fluxes estimated for the
Copyright 2012 Royal Meteorological Society Int. J. Climatol. 33: 210–227 (2013)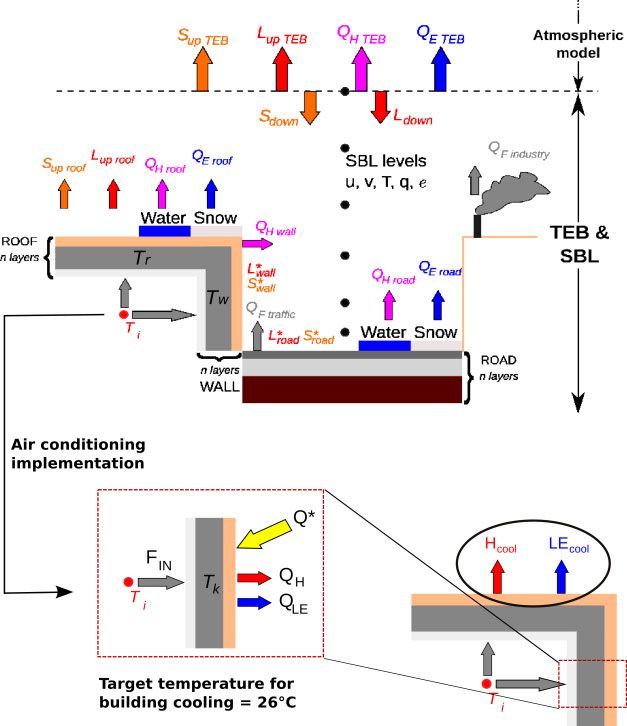
MODELLING IMPACTS OF AIR CONDITIONING ON PARIS MICRO-CLIMATE 217
Figure 4. Maximum AC waste heat fluxes for the three scenarios with heat discharges to air Top: REAL-AC scenario, sensible heat fluxes (left)
and latent heat fluxes (right) Bottom: DRY-AC scenario sensible heat fluxes (left), DRY-ACx2 scenario sensible heat fluxes (right).
released by evaporative cooling towers or free cooling
installations to sensible heat. Moreover, in the case of
cooling installations connected to the district network,
the sensible heat releases have been attributed to the
grid cells where the cooling power is used. A good
example of the consequences of the relocation of those
waste heat discharges at the level of the cooled buildings
is the office district of ‘La Défense’ (Figure 4, REAL-
AC and DRY-AC scenarios). Also, a ratio of 1.05 was
used to convert latent heat discharges to sensible heat,
assuming a drop in the COP value between evaporative
Figure 5. Hourly schedule for the modulation of maximum AC waste cooling towers and small dry systems. This drop has
heat fluxes based on records from the Climespace Company. been observed by the Climespace Company and occurs
because the dry autonomous systems have generally a
REAL-AC case served as a basis for the development lower-level performance by construction, and a lower
of the waste heat fluxes for the remaining AC scenarios level of monitoring and maintenance. By comparison,
(Table I). the large evaporative cooling towers, or free cooling
plants that distribute their cooling power by district
2.6.3. AC scenario heat releases network, are monitored and adjusted around the clock
to have the best level of performance. For the DRY-
The maps of heat fluxes for the two AC scenarios ACx2 scenario, the heat discharge power over the Paris
discharging only dry waste heat to air (bottom maps on domain was doubled (10.32 GW) to be consistent with
Figure 4) were developed by converting the latent heat the forecasts by Adnot (2003a, 2003b) predicting by
Copyright 2012 Royal Meteorological Society Int. J. Climatol. 33: 210–227 (2013)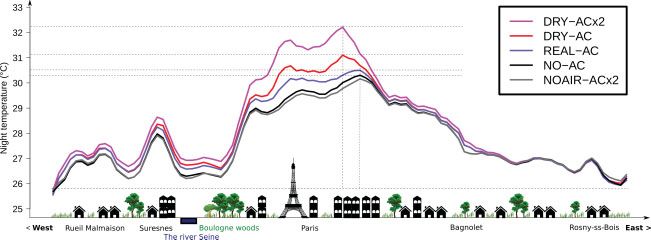
218 C. DE MUNCK et al.
2020 an increase in commercial and office surfaces in wave at a 1.25 km resolution for the 31 weather stations
France such that it would induce about a doubling of the of the IDF domain (top left), and at a 250 m resolution
AC consumption in comparison to 2003 (mean across for each of the five weather stations of the GP domain.
11 AC technical scenarios, Adnot, 2003b). Two thirds At 1.25 km horizontal resolution, the standard deviations
of this increased AC power was distributed in central for simulated temperatures are lower than those observed
Paris (on the hypothesis that the increase in commercial for daily minima (top left of Figure 6), showing that the
and business surfaces would occur there) and one third model, at this resolution, underestimates the geographic
outside. In this scenario and the NOAIR-ACx2 scenario, variability of daily minima. Nevertheless, the model is
Fcool has been recalculated to represent this increase in able to properly simulate the evolution of daily temper-
cooled buildings. atures at the scale of the IDF. On average, the model is
slightly too cold during the day and too warm at night
2.6.4. Uncertainties and limitations (Table III). This tendency of the model to overestimate
The accuracy of the current heat release inventory the daily minima is also observed across the GP domain,
(REAL-AC case) has been evaluated. Firstly, to assess but to a lesser extent because the increase in resolution
the quality of the visual inventory, the cooling power (from 1.25 km down to 250 m) shows a better correlation
values have been recovered for a set of ten buildings between simulated and observed 2-m air temperatures
(mostly hotels within inner Paris). For the buildings of (Table III). This improved correlation is characterized by
this set for which the condensers have been visualized, a root mean square error (RMSE) on the 2-m tempera-
the uncertainty has been estimated to be 15%. For some ture of 1.5 ° C for the GP model compared to 2.6 ° C for
buildings, although present, the systems had not been the IDF model, with respective mean bias errors (MBE)
visualized because they were placed on the inner facet of of 0.2 ° C and 1.0 ° C. Increasing in resolution, the pre-
the building, hidden within a compartment, the attic or diction of minimum temperatures is the most improved,
the basement. The global result of the visual estimation with a RMSE of 1.3 ° C for the GP domain versus 3.5 ° C
for this set of ten buildings in comparison with the real across the IDF domain and respective MBE of 1.0 ° C
consumption was an underestimation of the heat releases and 3.0 ° C. The prediction of the maximum temperatures
by a factor of two. remains relatively unchanged when changing resolution,
Secondly, concerning the accuracy of the releases by with an average RMSE and MBE of 1.7 ° C and −0.2 ° C.
the classified installations (evaporative cooling towers), These improvements are attributable not only to the spa-
it did not prove to be feasible to collate data for all tial resolution itself, but also to a better description of the
installations in Greater Paris. This study was based on different types of surface covers on the GP domain.
a record of 1740 classified installations out of 2118 (i.e. The RMSE and the MBE were also calculated for
82% of operating installations). the REAL-AC scenario as this is the scenario closest
to reality. They were equivalent to those estimated for
the baseline simulation. Indeed, there are not enough
3. Evaluation and analysis of the baseline stations within the GP domain and they are not located
simulation near enough to substantial sources of AC waste heat
emissions to demonstrate a better agreement between the
3.1. Evaluation against meteorological observations
temperatures simulated and observed when current AC
The baseline simulation without AC has been evaluated waste heat emissions are accounted for.
against meteorological observations to establish how well The evaluation of the simulation on the FR domain
the configuration of the coupled models behaves in the against meteorological observations is presented in
context of this study. For this purpose, we used the tem- Appendix A.
peratures simulated at 2 m for the vegetated fraction of
each grid cell in order to be consistent with the temper-
3.2. Characteristics of the baseline UHI
atures provided by weather stations which are measured
on a grassy area away from any obstacle (hence, gener- The description of results from the NO-AC scenario is of
ally in parks in urban settings). In the case of the IDF importance as it sets a baseline for further comparison,
domain, there are 31 stations providing hourly records as the model results are analysed in terms of differences
of temperatures. On the other hand, rare are the urban (temperature anomalies). This enables, over the Paris
weather stations recording hourly temperatures. In the domain, not only to compare the impacts of AC scenarios
case of Paris, there are five. Their location is shown on the with the baseline situation, but also to free oneself
bottom of the map in Figure 2. Two stations are located from the remaining bias between the modelled and the
in inner Paris: Paris-Montsouris (P-M) within the Park observed temperatures. Figure 7 presents a map of 2-m
Montsouris, south of the river Seine and Belleville Park air temperatures as well as a 2-m air temperature profile
(B-P). The other three are located outside inner Paris: obtained for a west-to-east cross-section passing through
southwest of Paris for Villacoublay (V) at the military the hottest districts of inner Paris. This profile is used to
airport, northwest of Paris for Courbevoie (C) and north visualize with a finer scale of temperature the structure
of Paris for Saint-Denis (S-D). Figure 6 presents the evo- of the heat island for that cross-section, and to refine the
lution of the 2-m temperature modelled during the heat magnitude of the heat island in the direction indicated.
Copyright 2012 Royal Meteorological Society Int. J. Climatol. 33: 210–227 (2013)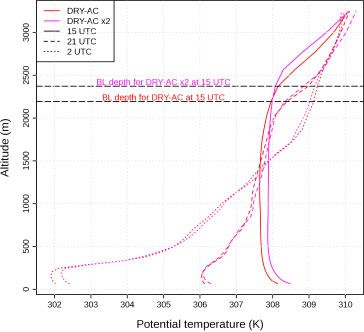
MODELLING IMPACTS OF AIR CONDITIONING ON PARIS MICRO-CLIMATE 219
Figure 6. Temperatures observed and modelled between 8 and 12 August 2003, for IDF weather stations (top left: full lines represent the mean
across 31 stations; standard deviations are indicated by whiskers for the model and by a grey envelope for observations) and for each of the five
Greater Paris stations.
Table III. Root Mean Square Error (RMSE) and Mean Bias Error (MBE) Mod-Obs on 2-m air temperatures, calculated between
8 August 2003, 12 UTC, and 13 August 2003, 23 UTC, based on the maximum number of weather stations in each domain (31
for IDF and 5 for GP).
Domain/Spatial resolution T (° C) Tmin (° C) Tmax (° C)
RMSE MBE RMSE MBE RMSE MBE
IDF/1.25 km (for 31 stations) 2.6 +1.0 3.5 +3.0 1.9 −0.5
GP/250 m (for 5 stations) 1.5 +0.2 1.3 +1.0 1.6 +0.1
The mean nighttime 2-m air temperatures present the temperatures over the densest urbanized areas (between
structure of a standard UHI (Figure 7), which demon- 8 and 15 km) and lower temperatures over the Bois de
strates the influence of the most urbanized areas in cen- Boulogne (between 6 and 8 km), and the river Seine (at
tral Paris on the temperatures. Its maximum amplitude approximately 3.5 km). The temperature profile shows
(between the hottest districts 2, 3, 9 and 10) and the least a baseline UHI amplitude of about 4.5 ° C, which can
urbanized areas in the southwest of Paris) is about 6 ° C. stand as a reference for assessing the potential impacts
The mean nighttime temperature profile for the west- of AC scenarios on UHI. The UHI amplitude was esti-
to-east cross-section passing through the districts 8, 9 mated as the difference between the maximum of the
and 10 (bottom of Figure 7) shows finer temperature mean nighttime temperature profile and the average of
variations and, in particular, the influences of artificial its two minima (east and west of the cross-section). The
and natural surfaces on temperatures, with the highest value of 4.5 ° C agrees well with that of 4 ° C observed
Copyright 2012 Royal Meteorological Society Int. J. Climatol. 33: 210–227 (2013)220 C. DE MUNCK et al.
Figure 7. Characteristics of Paris nighttime UHI without activation of air conditioning (top: map of temperatures; bottom: mean temperature
profile for the west-to-east cross-section mentioned on the top map, estimated across three hourly terms – 2, 3 and 4 UTC). The amplitude of
the heat island is estimated on the temperature profile as the difference between the maximum and the average of the two minima (east and
west).
during the 2003 heat wave between the city centre and baseline scenario, both based on street air temperatures.
the limit of the dense agglomeration of Paris. Firstly, we have estimated the differences in 2-m street
air temperatures between each scenario and the baseline
over the simulation period, and it is called the ‘tem-
4. Results and discussion: analysis of the AC perature anomaly’. Secondly, we have compared urban
scenarios heat islands morphology (maps) and amplitude (maps and
4.1. Statistical processing to estimate the impacts of temperature profiles) between all the scenarios.
AC scenarios Prior to the analysis, the temperature anomaly time
Potential impacts of AC have only been analysed for series within each grid cell were processed in three
the Paris simulation domain where it was parameterized steps using the R tool (R Development Core Team,
in the model. We have chosen two indicators to com- 2010). Firstly, the filtering of anomaly time series was
pare the differences between each AC scenario and the necessary to remove some storm-type events that have
Copyright 2012 Royal Meteorological Society Int. J. Climatol. 33: 210–227 (2013)MODELLING IMPACTS OF AIR CONDITIONING ON PARIS MICRO-CLIMATE 221
occurred during the period as described in Section 2.2 and 4.2.1. Increase in street air temperatures
Appendix A. Indeed, in the simulations for which only
Firstly, all AC scenarios, but the NOAIR-ACx2, show
the AC heat releases have been changed, some storm-
type events have appeared at different locations and an increase in street air temperatures, and the amplitude
timings between two cases and have generated impacts of this increase varies with the scenario of AC waste
on air temperature. However, given the current state- heat emission considered and the time of day. Under
of-the-art in storm prediction, the perturbations of deep the present time REAL-AC case, 2-m air temperature
convection between two different simulations can grow anomalies range from 0.25 to 1 ° C locally (across a
rapidly (Hohenegger and Schär, 2007), and it is not grid cell, i.e. at 250 m), with the greatest temperature
possible to attribute these storm pattern modifications to anomalies (1 ° C) observed in districts 8 (‘Etoile’), 12, 13
the AC heat releases. Secondly, a random resampling and 14 (‘Montparnasse’) for grid cells which are strongly
of filtered anomalies by daytime (9 a.m.–7 p.m.), and air conditioned. Moving on to the DRY-AC scenario
nighttime (8 p.m.–6 a.m.) series was necessary so as shows increased impacts, ranging from 0.25 to 2 ° C. In
to (1) obtain uncorrelated data, and (2) generate for this scenario, temperature anomalies of at least 0.5 ° C
each grid cell a larger sample that would follow a are widespread in districts 2, 8 and 9 and ‘La Défense’
quasi-normal distribution before proceeding to anomaly office district, and can be up to 1 and 2 ° C locally (e.g.
characterisation. This resampling was performed using for the ‘Etoile’ and ‘Montparnasse’ neighbourhoods, in
a bootstrapping method (Efron and Tibshirani, 1993). districts 8 and 14, respectively). Under the DRY-ACx2
Thirdly, the characterisation of daytime and nighttime scenario, impacts are even greater than for the DRY-AC
anomalies was based on a one-sided statistical test at 95% scenario, ranging from 0.25 ° C to 3 ° C locally, with the
confidence on the average of the filtered and resampled greatest anomalies found in districts 2, 8 and 9. For these
daytime and nighttime temperature anomaly series to rank three AC scenarios, the increase in street air temperature
them in relation to fixed temperature thresholds. is generally greater near the sources of emission of AC
To analyse the morphology and the amplitude of Paris waste heat (shown in the maps of waste heat fluxes in
mean UHI for each simulation, the 2-m temperatures for Figure 4). It should also be noted that impacts of AC on
three nighttime hourly terms (2, 3 and 4 UTC) and the local air temperatures in the area of ‘La Défense’ office
last four nights of the simulation (9–10, 10–11, 11–12 district (northwest outside inner Paris, see Figure 8) only
and 12–13 August) were selected and averaged. appear clearly with the DRY-AC and the DRY-ACx2
scenarios, due to converting latent heat releases from the
4.2. Impacts of AC scenarios on street level air REAL-AC scenario to only dry releases (heat fluxes in
temperatures Figure 4).
Figure 8 shows the location and the amplitude of the Moreover, the uncertainty carried by the inventory
daytime and nighttime temperature anomalies obtained of AC waste heat intensities over Greater Paris for the
for each of the four scenarios with AC (REAL-AC, DRY- REAL-AC case (Section 2.6.4) suggests that the impacts
AC, DRY-ACx2, NOAIR-ACx2). These results highlight on street air temperatures of the AC scenarios simulated
four main outcomes. estimated in this study are likely to be underestimated.
Figure 8. Street level (2 m) air temperature anomalies estimated at daytime (top) and nighttime (bottom) between 8 and 13 August 2003 for
each scenario with air conditioning (by reference to the baseline/NO-AC scenario). Temperature anomalies were obtained through a random
resampling of simulated temperature anomalies (from 9 a.m. to 7 p.m. daytime, and from 8 p.m. to 6 a.m. night time) and a one-sided statistical
test at 95% confidence. NS stands for non-significant temperature anomalies.
Copyright 2012 Royal Meteorological Society Int. J. Climatol. 33: 210–227 (2013)222 C. DE MUNCK et al.
Nevertheless, at the scale of Paris City, the magnitude 250 m, Figure 9) and the much lower turbulent mixing,
of the impacts of the AC scenarios discharging waste the impacts of heat releases on temperature are greater
heat to air corroborates relatively well with the results than those observed during the day. These processes
from Kikegawa et al. (2003) and Ohashi et al. (2007) can explain the greater anomalies observed at night for
obtained at the scale of Tokyo office districts, showing some grid cells, as well as the occurrence of temperature
an increase in street air temperatures of 1 and 1–2 ° C, anomalies at night where they did not exist during the
respectively. Hsieh et al. (2007) for Taipei’s densest day (areas with 0.25 ° C anomalies). For example, for the
residential district, demonstrated a similar increase in DRY-ACx2 scenario, temperature anomalies observed
street air temperature of between 0.78 and 1.84 ° C. during the day range from 0.25 to 2 ° C (Figure 8). At
Results for the NOAIR-ACx2 are of a different nature: night, they can reach up to 3 ° C locally and wide areas
they present temperature anomalies which are negative, with a 0.25 ° C anomaly appear. Under this scenario,
meaning that this scenario has a potential for cooling districts 2, 8 and 9 again show the strongest impact at
the streets. However, the activation of AC within the nighttime (1–2 ° C in almost all the grid cells concerned).
buildings did not reduce the street air temperature by The appearance at night of areas with a 0.25 ° C anomaly
more than 0.2 ° C during the day. is also the case with the DRY-AC scenario but to a
lesser extent (Figure 8). Besides, it may be noted that the
4.2.2. Greatest impacts at night impacts on temperatures observed at night for the DRY-
AC scenario are equivalent to those for the DRY-ACx2
Secondly, AC is used more during the day (when it is during the day (both in terms of amplitude and spatial
the hottest) than during the night (Figure 5). However, extent). This can again be explained by Figure 9 which
the impacts on local air temperature are the strongest at highlights similar depths of the mixing layer for the DRY-
night and all the AC scenarios with heat discharge to AC and the DRY-ACx2 scenarios, whether at nighttime
air show an increase in street air temperatures that is or daytime (around 250 m at nighttime, and 2200 and
greater at nighttime than daytime (first three scenarios, 2350 m at daytime, respectively), and therefore explains
left of Figure 8). Why is this? In fact, this common why, with greater waste heat releases in the DRY-ACx2
characteristic is consistent with, and can be explained by, than in the DRY-AC, the DRY-ACx2 presents greater
a different structure of the atmospheric boundary layer at temperature anomalies than the DRY-AC (Figure 8).
nighttime and daytime. The vertical profiles of simulated In the case of the NOAIR-ACx2 scenario, the temper-
potential temperatures presented in Figure 9 for the DRY- ature reduction is also slightly more pronounced at night
AC and the DRY-ACx2 allow to estimate the depths of than during the day (for a few grid cells, the temperature
the mixing layer at different times of the day (based on reduction has improved by 0.1 ° C), although still less than
Sullivan et al., 1998). The large boundary layer thickness 0.5 ° C (bottom right of Figure 8). These impacts remain
of about 2300 m observed throughout the day, correlated marginal and we can not conclude that this scenario,
to a strong turbulent mixing, explains the low amplitude which constitutes an attempt to mitigate AC impacts on
of temperature anomalies observed during the day. At the urban climate, would allow to substantially cool the
night, due to the thinness of the boundary layer (about streets of inner Paris (and, consequently, reduce the UHI)
in addition to cooling the buildings. The slight cooling
effect observed might not be perceptible or beneficial to
the inhabitants.
4.2.3. Variable extent of AC scenario impacts
Thirdly, while the impacts on temperature in the REAL-
AC case are relatively localized by or near the sources
of release of AC waste heat, in the DRY-AC, the grid
cells which are heavily air conditioned start to affect
slightly adjacent grid cells (Figure 8). Indeed, with this
latter scenario are emerging wide zones of several grid
cells bearing temperature anomalies of 0.5 ° C even during
the day (in districts 2, 8, 9 and ‘La Défense’ office
district). The comparison of these two scenarios (REAL-
AC and DRY-AC) shows that assigning the sources of
heat emission locally to user buildings (DRY-AC) instead
of centralising them to a cooling production unit (as is the
case when buildings are connected to a cooling network
Figure 9. Vertical profile of potential temperature (averaged across a in the REAL-AC case) does have an effect, however
2.5 × 2.5 km2 zone centred on the west-to-east cross-section shown
in Figure 7) for the DRY-AC and the DRY-ACx2 scenarios, on limited, on the spatial spread of the temperature increase
10/08/2003 15 and 21 UTC and 11/08/2003 2 UTC. This figure is at the scale of the city. Our results suggest two factors
available in colour online at wileyonlinelibrary.com/journal/joc that generate a significant spatial extent of impacts.
Copyright 2012 Royal Meteorological Society Int. J. Climatol. 33: 210–227 (2013)MODELLING IMPACTS OF AIR CONDITIONING ON PARIS MICRO-CLIMATE 223
The first one is the nighttime situation (explained just sustainable option in terms of street temperatures and,
above) since during the night more grid cells presented therefore, energy demand.
significant temperature anomalies than during the day
(areas with anomalies above 0.25 ° C for example). The 4.3. Impacts of AC scenarios on Greater Paris heat
second one is the intensity of AC heat discharge. Indeed, island
contrary to the DRY-AC scenarios, the DRY-ACx2 The urban heat islands for each AC scenario are analysed
impacts wider zones in the city, with repercussions on in the form of maps (Figure 10) and temperature profiles
the temperature that extend beyond the areas where the (Figure 11) which are compared to those of the baseline
heat emissions are prescribed (west of Paris, including NO-AC scenario (Figure 7). Given the results obtained
the ‘Bois de Boulogne’ and further, Figure 8) and larger for street level temperatures, remarkable trends have been
zones bearing 1 ° C temperature anomalies at daytime and observed for the nighttime UHI. Figure 10 illustrates
2 ° C at nighttime. In summary, the thermal impact of well the variations in the spatial structure of the heat
heavily air conditioned grid cells on surrounding grid island between the scenarios with AC and the baseline
cells is gradually increasing at night and with the intensity (Figure 7). Although the heat islands diagnosed for each
and the type of heat discharge (first three AC scenarios scenario retain a standard UHI structure, the heat island
from left to right in Figure 8). simulated for the AC scenarios with heat release to air
present a spreading of the hottest areas in central Paris
4.2.4. Greatest impacts of dry systems compared to the baseline scenario. This spreading is
gradual from the REAL-AC case to the DRY-AC and the
When analysing the previous results by focusing on the DRY-ACx2 scenarios. A clear amplification of the heat
type of AC systems simulated (air-cooled versus water- island appears with the future projections of waste heat
cooled), it appears that the scenarios that evaluate the emissions of the DRY-ACx2 scenario. The maximum
equipment of the city with only dry and individual AC amplitude across the Paris simulation domain reaches
systems (DRY-AC and DRY-ACx2) generate the greatest approximately 8 ° C, which corresponds to a 2 ° C increase
increase in temperature, both in terms of amplitude and compared to all the other scenarios (Figures 7 and 10).
spatial extent. This suggests that a conversion from District 8 of inner Paris seems to be the most affected
water-cooled to air-cooled AC systems would not be a by the gradual spreading and amplification of warmer
Figure 10. Comparison of the UHI generated by the four air conditioning scenarios.
Copyright 2012 Royal Meteorological Society Int. J. Climatol. 33: 210–227 (2013)224 C. DE MUNCK et al.
Figure 11. Temperature profiles showing Paris UHI for a west-to-east section passing through the warmest districts of inner Paris (8, 9 and 10,
as shown by the black line in Figure 7 for the NO-AC scenario).
temperatures. As expected, the heat island diagnosed for impacts have probably been underestimated because of
the NOAIR-ACx2 scenario presents a much less spread- the uncertainty in the inventory of waste heat from air
out structure of the warmest areas than the baseline NO- conditioning systems. Finally, the impact of a future
AC scenario. situation with a large number of air-cooled buildings
Looking at the temperature profiles (Figure 11), the without generating waste heat to the air lowered street
increase in waste heat logically resulted in an increase in air temperatures but not significantly enough to be
the magnitude of the urban heat island. Indeed, compared perceptible by the inhabitants. Besides, if the free cooling
with an amplitude of 4.5 ° C in the baseline NO-AC systems were to be generalized at the scale of the entire
scenario (bottom of Figure 7 and dotted lines reported in city in the future, the impacts of the warming up of
Figure 11), scenarios with AC heat releases to air show a the river Seine (due to this cooling technique) on air
steady increase in UHI amplitude with a value of 4.8 ° C temperatures should be studied with caution.
for the REAL-AC case, 5.3 ° C for the DRY-AC scenario, This study shows that future developments of cooling
and 6.4 ° C for the DRY-ACx2 scenarios. facilities at the scale of a city like Paris should prefer-
ably be controlled so as to be sustainable. Besides, the
increase in temperature observed for most of the AC sce-
5. Conclusions and perspectives narios bears consequences, not only in terms of energy
consumption, but also regarding public health. Our sim-
Compared with pre-cited studies on the impact of AC ulations showed the greatest increase in temperature at
on temperatures at the scale of neighbourhoods, this nighttime, which might exacerbates night thermal stress
study, by coupling an urban energy balance model to (for those without access to AC), a factor identified in
a meso-scale atmospheric model, has allowed to access Paris as highly related to excess mortality during the 2003
the impact of AC on temperatures at the scale of a city. heat wave (Ledrans et al., 2005; Dousset et al., 2011). In
This study was conducted to compare, for the City of terms of energy, the increase in temperatures related to
Paris, different systems and intensity of cooling power to the usage of AC is likely to lead to an increasing demand
meet the chilling requirements inherent to some buildings for air cooling (and, consequently, energy consumption),
now and in the near future. Our results suggest that while at the same time lowering the efficiency of air con-
the classic means to meet the cooling needs of the ditioners. But in order to study these feed-back processes,
buildings in Paris during a heat wave event similar to the urban energy model TEB will need to be improved. To
that of 2003 are likely to increase street air temperatures provide an energy balance for the buildings that would
and, consequently, the amplitude of the heat island, be not only more consistent with the observations but
with the most intense impacts near the greatest AC also dynamic, the new version of TEB will calculate the
waste heat releases. The impacts observed on street air evolution of the internal temperature of buildings by an
temperatures varied with the type of AC systems and energy balance equation that will account for heat gains
the intensity of emission simulated, but the proliferation such as the internal loads of the building (corresponding
of dry systems demonstrated the greatest increase in to people, uses of energy for lighting and various elec-
street air temperatures and the worst enhancement of the trical needs) and the direct solar gain through glazing, as
nighttime heat island. All the systems releasing waste well as the representation of the building internal thermal
heat to air showed an increase in street air temperatures mass (floors and load-bearing walls). These implementa-
in the most urbanized parts of central Paris, of 0.5 ° C tions will allow for calculating AC waste heat emissions
considering the current AC equipments (with reference in relation to the demand for cooling within the buildings
to 2003), of 1 ° C if all current systems were replaced by (i.e. in relation to outdoor temperatures). These develop-
dry autonomous AC systems, and 2 ° C in case Greater ments will also allow to run simulations for cities which
Paris was led to double its cooling load. And these do not have access to AC waste heat records. Future work
Copyright 2012 Royal Meteorological Society Int. J. Climatol. 33: 210–227 (2013)You can also read