UNECE Forestry and Timber Market
Statement for the United Kingdom
2018
←
→
Page content transcription
If your browser does not render page correctly, please read the page content below
UNECE Forestry and Timber Market Statement for the United Kingdom 2018
Contents
1 General economic trends affecting forestry industries and the timber market in
the UK .................................................................................................................................. 5
    1.1      Overview ................................................................................................................. 5
    1.2      Monetary Policy ...................................................................................................... 6
    1.3      GDP Growth ........................................................................................................... 7
    1.4      Inflation ................................................................................................................... 9
    1.5      Employment .......................................................................................................... 10
    1.6      UK Economic Indicators ........................................................................................ 12
2     Policy developments potentially affecting the UK timber products trade ............. 13
    2.1      Priorities for the current UK government ............................................................... 13
      2.1.1         England ......................................................................................................... 13
      2.1.2         Scotland......................................................................................................... 14
      2.1.3         Wales ............................................................................................................ 15
      2.1.4         Northern Ireland ............................................................................................. 15
    2.2      Plant Health .......................................................................................................... 15
      2.2.1         Import and Export Restrictions ....................................................................... 15
      2.2.2         Tree diseases ................................................................................................ 17
    2.3      National Forest Inventory (NFI) ............................................................................. 18
    2.4      Climate Change .................................................................................................... 18
      2.4.1         Carbon reduction initiatives ............................................................................ 19
    2.5      UK Grown Timber Initiatives ................................................................................. 20
3     Market Drivers ............................................................................................................ 21
    3.1      Construction, manufacturing and distributive trades .............................................. 21
      3.1.1         Construction .................................................................................................. 21
      3.1.2         Manufacturing and distributive trades ............................................................ 24
      3.1.3         Wooden Pallets.............................................................................................. 25
    3.2      Energy Markets..................................................................................................... 25
      3.2.1         Renewable electricity ..................................................................................... 27
      3.2.2         Renewable heat ............................................................................................. 27
      3.2.3         Forecast......................................................................................................... 28

2
4 Developments in forest products markets ............................................................... 29
4.1 Wood Raw Materials ............................................................................................. 29
4.1.1 Removals of roundwood ................................................................................ 29
4.1.2 Deliveries of roundwood ................................................................................ 29
4.2 Wood Energy ........................................................................................................ 31
4.2.1 Consumption and production ......................................................................... 31
4.2.2 Imports of wood pellets .................................................................................. 32
4.3 Certified forest products ........................................................................................ 32
4.4 Apparent consumption and production of wood in the UK ..................................... 33
4.4.1 Sawn softwood .............................................................................................. 33
4.4.2 Sawn hardwood ............................................................................................. 33
4.4.3 Wood-based panels ....................................................................................... 34
4.4.4 Paper and paperboard ................................................................................... 34
4.5 Value-added forest products and engineered wood products ................................ 35
4.5.1 Sales of UK manufactured wood products ..................................................... 35
4.6 High performance wood construction .................................................................... 35
4.6.1 Housing and construction .............................................................................. 36
4.6.2 Related Barriers and Incentives for the Use of Engineered Wood Products ... 37
3Figures Figure 1.1 Real GDP Growth Rate 2007-2018, Selected Economies, % ............................... 5 Figure 1.2 Exchange Rate of EURGBP and USDGBP, 2014 to 2018 ................................... 6 Figure 1.3 Households’ Savings Ratio, 2007-2018, %........................................................... 7 Figure 1.4 Real Gross Domestic Product (GDP) per quarter 2007 to 2018 (in 2018 prices), £bn........................................................................................................................................ 8 Figure 1.5 Real Gross Domestic Product (GDP) Growth per quarter since 2007, % ............. 8 Figure 1.6 Gross Domestic Product (GDP) 2013 to 2017 and GDP projections 2018 to 20219 Figure 1.7 Consumer Prices Index including owner occupiers’ housing costs (CPIH), 2006 to 2018, %............................................................................................................................... 10 Figure 1.8 Consumer Price Index (CPI) inflation projection based on market interest rate expectation: CPI Inflation Rate 2014-2018 and CPI Inflation rate Projections 2018 to 2021, UK, % ................................................................................................................................. 10 Figure 1.9 Employment and unemployment rates in the UK, 2007 – 2018 .......................... 11 Figure 1.10 Unemployment in the UK 2013-2018 and Unemployment projections 2018-2021 ........................................................................................................................................... 12 Figure 3.1 UK Housing Starts and Completions, 2002-2017 ............................................... 22 Figure 3.2 Construction Industry Sector Output: volume seasonally adjusted, percentage change period on previous year, by sector, 2017 ................................................................ 23 Figure 3.3 UK Manufacturing Index, 2007-2017 and percentage change year-to-year ........ 24 Figure 3.4 The change in energy consumption from 2016 to 2017 split by fuel and sector .. 26 Figure 3.5 The consumption of bioenergy and waste in the UK, 2002-2017 ........................ 27 Figure 4.1 Softwood removals from UK forests by private and public sectors, 2007-2017... 29 Figure 4.2 Deliveries of softwood from UK forests to user industries, 2017 ......................... 30 Figure 4.3 Country of origin of wood pellet imports to the UK, 2017 .................................... 32 Figure 4.4 Apparent consumption of wood in the UK, 1999-2017........................................ 33 Figure 4.5 Total UK Manufacturer Sales of Milled and Planed Wood, 2008-2017 ............... 35 Figure 4.6 Total UK Manufacturer Sales of Builders’ Carpentry and Joinery ....................... 36 4
Chapter 1: Economic Trends

1 General economic trends affecting forestry industries and the
  timber market in the UK
1.1 Overview
The UK economy has delivered moderate quarter-on-quarter growth in Q4 2017 of 0.3% and
Q1 2018 of 0.2%. Growth in the UK has been relatively stable since 2010 at approximately
0.5% quarter-on-quarter (Figure 1.1).

Figure 1.1 Real GDP Growth Rate 2007-2018, Selected Economies, %

Real Growth of Gross Domestic Product (GDP) (see section 0) in the UK and other selected economies over the last decade.
Source: Organisation for Economic Co-operation and Development (OECD, 2018) “Quarterly GDP” (indicator), doi:
10.1787/b86d1fc8-en (Accessed on 12 July 2018).

The Pound Sterling has stabilised after a period of depreciation against the Euro, whilst the
value against the US dollar has strengthened since March 2017 (Figure 1.2). The Pound
Sterling substantially fell in value against the Euro and the Dollar in the days following the
UK’s European Union membership referendum on 23rd June 2016. Despite this fall in the
Pound’s value against the Euro, the UK trade deficit (Value of Exports – Value of Imports)
with the Eurozone has not decreased.

5
Chapter 1: Economic Trends

Figure 1.2 Exchange Rate of EURGBP and USDGBP, 2014 to 2018

The value of the Pound Sterling over time against the Euro and the US dollar.
Source: Bank of England (2018), Spot Exchange Rate (Euro into Sterling), Spot Exchange Rate (Dollar into Sterling).

1.2 Monetary Policy
The Bank of England’s Monetary Policy Committee vote on whether to raise, lower or
maintain the Bank of England’s Base Rate, upon which many other interest rates are based.
Setting ‘the interest rate’ is one of the key macroeconomic instruments in monetary policy
that help to achieve the Bank of England’s inflation target and stimulate economic growth.

The Monetary Policy Committee voted to raise the Base Rate from an historic low of 0.25%
to 0.5% in November 2017 and by a further quarter percent to 0.75% in August 2018. This
rise in August 2018 is only the second rise in interest rates in a decade and interest rates are
now at their highest level since 2009. According to the May 2018 Bank of England Inflation
Report, the expectation is that there will be two increases of 0.25 percentage points over the
next three years.

Despite low interest rates, the household savings ratio increased in the wake of the 2007-08
financial crisis as consumers chose to pay off existing debts and increase their savings
rather than increasing spending using cheap credit. This had a negative effect on
consumption and economic growth. In Q1 of 2018, households saved approximately 4.1% of
their disposable income following a decline in the savings rate over the past decade (Figure
1.3).

6
Chapter 1: Economic Trends

Figure 1.3 Households’ Savings Ratio, 2007-2018, %

Source: ONS (2018), Households’ saving ratio (per cent): Current price: £m: SA.

As the Pound Sterling has continued to be valued below pre-referendum levels against the
Euro and the Dollar, there has been an inflationary effect on goods and services due to
increased import prices. This is demonstrated in the latest Consumer Price Index (CPI)
figures, which show that inflation has been above the Bank of England’s 2% target since
February 2017.

1.3 GDP Growth
Change in Gross Domestic Product (GDP) is the main indicator of economic growth. It
measures the market value of all ‘final’ goods and services produced over a period of time
(i.e. monthly, quarterly, or annually) in monetary terms. Real GDP also takes into account
the effect of inflation, which is a measure of changes in prices. Therefore, Real GDP
provides a more accurate picture of how much the UK economy produces and how this has
changed over time in comparison to Nominal GDP, which does not take into account
changing prices (Figure 1.4).

A recession is defined as a period of two successive quarters of negative economic growth.
Although the UK has not experienced a recession since 2009, economic growth remains
modest despite the setting of low interest rates by the Bank of England in attempts to
stimulate spending and thus the economy (Figure 1.5).

7
Chapter 1: Economic Trends

Figure 1.4 Real Gross Domestic Product (GDP) per quarter 2007 to 2018 (in 2018 prices), £bn

The value of output from the UK economy since 2007.
Source: ONS (2018), Gross Domestic Product at market prices: Current price: Seasonally Adjusted £m

Figure 1.5 Real Gross Domestic Product (GDP) Growth per quarter since 2007, %

The rate at which the national economy is growing each quarter compared to the previous quarter.
Source: ONS (2018), Gross Domestic Product at market prices: Current price: Seasonally Adjusted £m

8
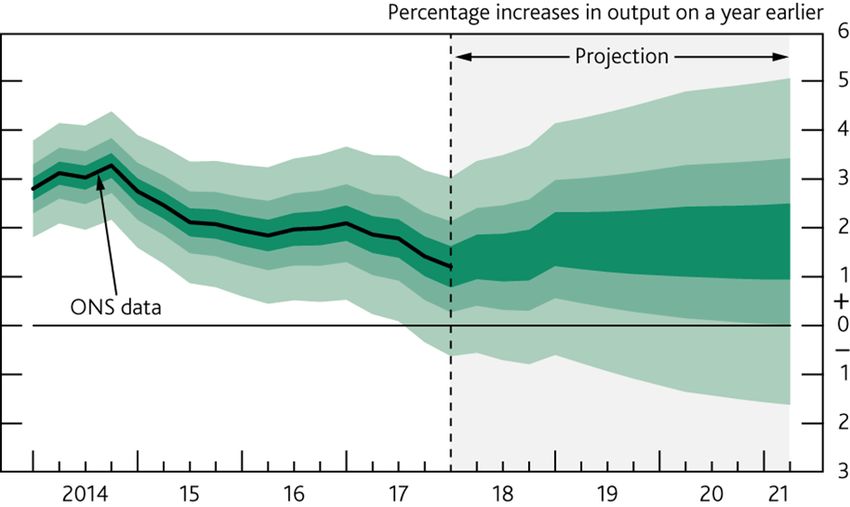
Chapter 1: Economic Trends

The Bank of England publishes a quarterly report containing updates on key economic
indicators. This includes a projection of the likely path of GDP over the coming years (Figure
1.6).

The OECD (Organisation for Economic Co-operation and Development) Business
Confidence Index (BCI) shows that businesses expectations for the immediate future are
positive with expectations for Business in the UK being consistently more positive than the
average for OECD member countries.

Figure 1.6 Gross Domestic Product (GDP) 2013 to 2017 and GDP projections 2018 to 2021

Dark green represents higher likelihood and lighter green representing lower likelihood.
Source: Bank of England Inflation Report; published May 2018 (quarterly). ONS = Office for National Statistics.

1.4 Inflation
The Consumer Prices Index, including owner occupiers’ housing costs (CPIH), shows the
rate at which prices are rising, or falling, in the domestic economy (Figure 1.7). The Bank of
England’s (BoE) target for inflation is 2% per year. In March 2009, the BoE set interest rates
at 0.5%. This was coupled with a sustained period of quantitative easing1. A period of higher
inflation in the economy followed, reaching a high of around 4.5% as credit became cheaper
to obtain and demand for goods and services increased in the economy. The fall in the
inflation rate between 2012 and 2015/16 is believed to have been largely caused by external
factors to the UK economy, in particular a fall in energy, food and imported goods prices,
which in turn were primarily due to fluctuations in exchange rates. The Bank of England
Inflation Report May 2018 suggests that inflation will fall to the 2% target by the end of 2018
(Figure 1.8).

1
 The Bank of England creates new digital currency in order to purchase assets, such as government bonds.
Buying assets in large quantities increases the price of these assets, which reduces the yield, or return, on that
asset. This encourages owners of these assets to sell them and use the money from the sale to invest in
alternative assets, such as company shares and bonds, which enables businesses to invest.

9
Chapter 1: Economic Trends

Figure 1.7 Consumer Prices Index including owner occupiers’ housing costs (CPIH), 2006 to 2018, %

Source: ONS, CPIH Annual Rate 00: All Items 2015=100

Figure 1.8 Consumer Price Index (CPI) inflation projection based on market interest rate expectation: CPI
Inflation Rate 2014-2018 and CPI Inflation rate Projections 2018 to 2021, UK, %

Dark red represents higher likelihood and lighter red represents a lower likelihood.
Source: Bank of England Inflation Report; published May 2018 (quarterly).

1.5 Employment
The year to Q2 2018 delivered continued increases in employment rates. Since Q3 2014,
the employment rate has been at a record high, with either quarter-on-quarter stability or
increases since then. The current record high of employment rate at Q1 2018 is 75.6%. For

10
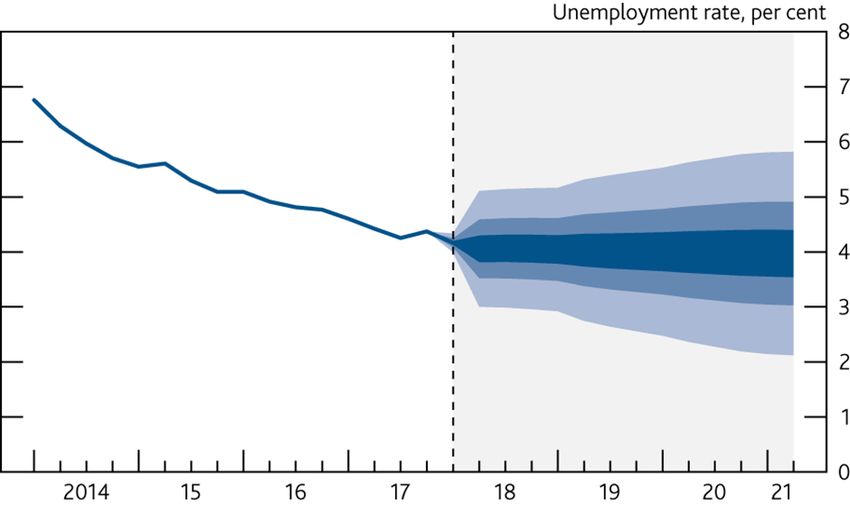
Chapter 1: Economic Trends

February to April 2018, there were 32.39 million people in work, 146,000 more than for
November 2017 to January 2018 and 440,000 more than for a year earlier.

The unemployment rate fell to 4.2% in the three months to April 2018, a joint record low
since 1975. The unemployment level stood at 1.42 million, 38,000 fewer than the previous
three months and 115,000 fewer than the previous year (Figure 1.9)

Figure 1.9 Employment and unemployment rates in the UK, 2007 – 2018

The quarterly employment and unemployment rates in the UK for the last ten years.
Source: Office for National Statistics (ONS) Labour Market; updated 12 June 2018.

Labour productivity in the UK, as measured by output per hour is estimated to have
increased by 0.9% from Q1 2017 to Q1 2018. However, UK labour productivity is estimated
to have fallen by 0.4% in the first three months of 2018. This is due to continued strength in
employment growth (more hours worked), combined with weaker output growth. This is the
first fall in output per hour since the second quarter of 2017.

The annual increase in the number of people in employment (440,000) was mainly due to
more people in full-time employment (259,000), accounting for 58.8% of the total increase.

Increases in the number of people in employment in recent years have not been matched by
increases in wages. Average total pay (including bonuses) for employees in Great Britain
was £490 per week before tax in real terms for April 2018 and other deductions from pay,
£32 lower than the pre-downturn peak of £522 per week recorded for February 2008,
however, wages are now increasing at a faster rate than inflation.

The Bank of England expects the unemployment rate to remain relatively stable over the
next four years with a slight decrease expected (Figure 1.10).

11
Chapter 1: Economic Trends

Figure 1.10 Unemployment in the UK 2013-2018 and Unemployment projections 2018-2021

Dark blue represents higher likelihood and lighter blue represents a lower likelihood.
Source: Bank of England Inflation Report; published May 2018 (quarterly)

1.6 UK Economic Indicators
Table 1.1 UK Economic Indicators, 2011-2019

                                2011        2012        2013       2014        2015      2016       2017       2018      2019
                                                                                                                     a
GDP growth (%)                  1.97        1.18        2.16        2.85       2.33      1.90        1.80      1.40      1.50b
Interest Rate (Base
                                 0.5         0.5         0.5        0.5         0.5      0.25         0.5       1.0c      1.2d
Rate at year end) (%)
Consumer Price Index             4.5         2.8         2.6        1.5          0       1.32         2.9       2.3b      2.1b
Unemployment Rate
                                 8.1          8          7.6        6.2         5.4      5.32         4.6       2.3b      4.3b
(%)
UK Housebuilding
                                138.3      125.4       150.0       170.1      180.1      188.7      197.8
Starts (000s)2

All figures are percentages unless otherwise indicated. (a) HM Treasury, Forecast for the UK Economy: A comparison of
Independent Forecasts, June 2018 (b) The Bank of England creates new digital currency in order to purchase assets, such as
government bonds. Buying assets in large quantities increases the price of these assets, which reduces the yield, or return, on
that asset. This encourages owners of these assets to sell them and use the money from the sale to invest in alternative
assets, such as company shares and bonds, which enables businesses to invest. (c) Bank of England Inflation Report, May
2018. (d) Given in 2015 prices.

2
 Ministry of Housing, Communities & Local Government; Table 212: permanent dwellings started and completed,
by tenure, United Kingdom (quarterly). Accessed 09 October 2018.

12
Chapter 2: Policy Developments 2 Policy developments potentially affecting the UK timber products trade Forest ownership in the UK remains fairly stable with around 27% state owned and 73% privately owned3. Domestic forestry policy in the UK is a devolved matter. Some of the functions supporting domestic forestry are currently delivered on a Great Britain (GB)4 or United Kingdom (UK)5 wide basis by agreement, by the Forestry Commission. Devolution of forestry will complete in April 2019, but some cross-border collaboration will remain for a number of functions as agreed by Ministers. Scotland, England and Wales will each deliver some of these functions (commissioning and monitoring of forestry research, management of the UK Forestry Standard and Woodland Carbon Code, Plant Health (forestry) and Forest Reproductive Material functions, provision of economist advice). International forestry policy remains a reserved UK Government matter. The Forestry Commission is the non-Ministerial government department advising on forestry policy and its implementation, with Forestry Commission England and Forestry Commission Scotland reporting directly to their respective Ministers. From April 2019, regulatory and policy support and grant-giving functions will transfer from Forestry Commission Scotland to Scottish Forestry, a new agency of the Scottish Government. In Wales, these functions have been delivered by Natural Resources Wales and by the Welsh Government Forest Resources policy team since 2013. Both the UK Government and the devolved administrations are committed to sustainable forest management, as articulated in the Forest Europe Ministerial agreements. Sustainable forest management serves as an overarching concept and framework and the UK approach to delivery is set out in the UK Forestry Standard (fourth edition) published in 2017. 2.1 Priorities for the current UK government 2.1.1 England Priorities in England include increasing afforestation rates; increasing the use of timber in construction; improving the resilience of trees, forests and woodland; developing a domestic carbon offset mechanism; increasing the benefits delivered by trees and woodland in and around towns and cities and strengthening the biosecurity of supply chains6. In England, objectives and policies for woodland expansion are set out in the 25 Year Plan for improving the Environment6 which states the commitment to plant 11 million trees between 2017 and 2022 on a pathway to achieving the aspiration to increase woodland cover from 10% to 12% by 2060. The 25-Year Plan recognises the need to make woodland planting more attractive to landowners and attract private investment to fund it, through initiatives such as Forestry Investment Zones, the establishment of the Northern Forest and strengthening of Domestic Carbon Markets. 3 Forestry Statistics (2018) Chapter 1: Woodland Area and Planting. Forest Research. 4 Great Britain; England, Scotland and Wales 5 United Kingdom; England, Scotland, Wales and Northern Ireland. 6 For more information see A Green Future: our 25 year plan to improve the environment and Clean Growth Strategy: leading the way to a low carbon future. 13
Chapter 2: Policy Developments

The Rural Development Programme for England co-financed Countryside Stewardship
Woodland Creation Grant is the principal source of financial support for woodland expansion
in England, with its main objectives to enhance biodiversity, improve water quality and
contribute to flood risk management. The Environmental Impact Assessment (Forestry)
Regulations, as they apply in England, were revised in May 2017, requiring that more
information is provided by proposers of afforestation projects, while increasing the
Environmental Impact Assessment threshold in areas mapped as low risk if a UK Forestry
Standards woodland creation plan or the environmental and social information required to
produce one is submitted. The design of larger scale productive woodlands is supported
through the Woodland Creation Planning Grant (from 2015), while their establishment is
supported through the Woodland Carbon Fund (from 2016).

A policy on whether to convert woods and forests to open habitats in England is in place,
which includes an assessment of implications for carbon balance and requirements for
compensatory planting in the process of prioritising sites for restoration.

2.1.2 Scotland
In Scotland, forestry is recognised as having an important role in contributing to emissions
reduction targets through carbon sequestration which is a specific objective of woodland
creation. The Scottish Government is committed to expanding this important carbon sink and
the Programme for Government spells out the support to a growing forestry industry to
contribute to climate change targets. The Climate Change Plan (third report on policies and
proposals) sets out how the Scottish Government will meet its greenhouse gas emission
reduction targets for the period 2017-2032 and includes a policy on increasing the long term
annual woodland creation target from the current 10,000 hectares of new woodland per year
to 15,000 hectares per year from 2024/25. To complement woodland creation, a framework
to better control woodland removal is also in place with a proposed policy to further increase
emissions abatement through greater use of Scottish timber in building construction and
refurbishment. These targets will be taken forward in a sustainable way and require the
creation of a range of different woodland types, on different sites, with different objectives.
The Scottish Government is committed to supporting the creation of at least 3,000 hectares
of new native woodland a year (Scottish Biodiversity Strategy: Route Map 2020).

To support the delivery of the Climate Change Plan, the Forestry Grant Scheme offers
financial support for the creation of new woodland and the sustainable management of
existing woodland. All applications are assessed against the UK Forestry Standard and
associated guidelines.

The Scottish Government has recently passed the Forestry and Land Management
(Scotland) Act to replace the 1967 Forestry Act in Scotland from April 2019. The Act includes
duties on Ministers to promote sustainable forest management and to publish a forestry
strategy which will set out the Government’s priorities in relation to the economic,
environmental and social benefits of forestry.

The Forestry (Environmental Impact Assessment) (Scotland) Regulations 2017 came into
force in May 2017, driven by EU Environmental Impact Assessment Directive 2014 that aims
to streamline aspects of the Environmental Impact Assessment process and improve
transparency and consistency in Environmental Impact Assessment practice across a
number of regimes. The main changes include an increase of the threshold for

14
Chapter 2: Policy Developments

Environmental Impact Assessment determination of afforestation projects outside sensitive
areas from 5 to 20 hectares to secure a more effective way in assessing woodland creation
applications to contribute to emission reductions. The 2017 Regulations have been reflected
in new guidance and training.

2.1.3 Wales
Woodlands for Wales is the Welsh Government’s fifty-year Strategy to promote sustainable
land use. The Strategy was updated in 2018 and includes an aim to plant 2,000 ha per
annum from 2020 as a contribution to meeting national emissions reduction targets.

2.1.4 Northern Ireland
Forestry in Northern Ireland is undertaken by the Forest Service (FS), an Executive Agency
of the Department of Agriculture, Environment and Rural Affairs (DAERA). It promotes
afforestation and sustainable forestry, and is responsible for plant health matters.

The Chief Executive is responsible to the Minister for the Agency's operations and
performance. The Minister determines the policy framework within which the Agency
operates, the level of resources made available each year and the scope of Agency
activities. The Minister also approves the annual business plan, sets key performance
targets, and monitors the Agency’s performance.

While a Minister was not appointed to the Department in 2017/18, the Agency business plan
and budget was endorsed by the Department Board who monitored the Agency’s
performance during the year. No major policy decisions were required in respect of the
Agency’s business that could not be taken in the absence of a Minister and Executive.

The Forestry Act (Northern Ireland) 2010 requires the Department to promote afforestation
and sustainable forestry, to encourage public enjoyment and recreational use of its forests.
The Act defines forestry to include the production and supply of timber and other forest
products, the maintenance of adequate reserves of growing trees and the management and
development of forests to contribute to the protection of the environment, biodiversity and
the mitigation of, or adaptation to, climate change.

Both the UK Government and the devolved administration in Northern Ireland are committed
to sustainable forest management, as articulated in the Forest Europe Ministerial
agreements and an expansion of woodland cover to increase the many diverse benefits that
forests provide.

Northern Ireland’s Forestry Strategy was published in 2006 and includes an aspiration to
double woodland cover over 50 years.

2.2 Plant Health
2.2.1   Import and Export Restrictions

2.2.1.1 Import requirements for wood and wood products
The Forestry Commission keeps an updated list of restrictions and conditions on timber and
wood imports and exports on their website. There have been two recent publications

15
Chapter 2: Policy Developments

updating the import requirements for wood and wood products from EU7 and non-EU
countries8.

2.2.1.2 Forestry Border Control Checks 2017-18
Forestry Commission Plant Health Inspectors performed 3,280 inspections of 375,569 m3 of
controlled timber9 from non EU countries of which 15 were found to be non-compliant and
remedial action was taken. Additional checks were performed where there was evidence of
poor compliance including imports of sawn softwood from other parts of the EU and Russia.

Inspection continued of wood packaging material associated with steel and stone
consignments from China with 1,387 inspections taking place. There was a total of 32
interceptions of non-compliant wood packaging consignments associated with these imports.
A rare interception was made of an Asian longhorn beetle from dunnage associated with a
bulk shipment of Chinese steel.

2.2.1.3 Statutory notification scheme for firewood imported into England and
         Scotland
A statutory notification scheme (SNS) was introduced for firewood imports in January 2017.
During 2017 attention focused on those aspects of the firewood trade which were believed to
represent the greatest risk of introducing harmful tree pests to the UK. Corrective action was
taken where any firewood imports or the associated wood packaging material were
inspected and did not meet GB landing requirements. The evidence about the movement of
ash firewood from Eastern Europe to the UK will be used to assess the potential risk that this
trade represents as a pathway for the introduction of Emerald ash borer which is a serious
pest of ash trees and is present in western parts of Russia.

1,979 notifications were received in 2017 and 81 inspections were carried out. The firewood
that was inspected was generally compliant; however 25 consignments were found to be
non-compliant mainly due to the presence of bark on conifer wood packaging material
associated with the firewood imported from the EU. Inspections are mainly risk based and
focus on regulated species. 80% of the firewood was notified as being kiln dried to below
20% moisture content.

The quantity imported in 2017 was 60,018 tonnes. Approximately 90% of firewood is
imported from the EU with Latvia and the other Baltic nations as the most important
suppliers.

The market is dominated by birch, ash, oak and alder which are declared as originating the
EU, predominately from Latvia (67%).

7
  Regulated EU Trade and Plant Passporting Requirements. Forestry Commission.
8
  Importing Wood, wood products and bark: requirements for landing controlled material in Great Britain from
non-EU countries. Forestry Commission, Edinburgh.
9
  Controlled timber: virgin wood or wood fibre which has been verified as having a low probability of including
wood from any of the following categories:(a) Illegally harvested wood;(b) Wood harvested in violation of
traditional and civil rights;(c) Wood harvested in forests in which high conservation values are threatened by
management activities;(d) Wood harvested in forests being converted from natural and semi natural forest to
plantations or non- forest use;(e) Wood from forests in which genetically modified trees are planted. For more
info refer to the FSC website.

16
Chapter 2: Policy Developments 2.2.2 Tree diseases 2.2.2.1 Sweet Chestnut Blight Since sweet chestnut blight was confirmed in England 2016, there have been cases at eight sites in Devon, a site in Dorset, eight sites in East London, a site in Berkshire, three sites in Derbyshire, and one site in Leicestershire. In all cases action was taken to limit spread of the disease from sites and determine its local distribution. Further action will be taken on the basis of surveillance information and the best available scientific evidence. Following the outbreak in Devon in December 2016, a prohibition was imposed on the movement of oak and sweet chestnut material, including plants, logs, bark, branches, foliage and firewood out of, or within, six zones. Five of these zones were in Devon and one in Dorset. The prohibitions in all six zones took effect on Friday 12 May 2017 and were lifted on Tuesday 27 March 2018. Movement restrictions at affected sites where infected trees were found continue on a site by site basis taking account of the situation in each area based on the current policy approach. 2.2.2.2 Phytophthora ramorum Phytophthora ramorum has continued to be to be a major plant health issue affecting Japanese larch (Larix kaempferi) tress and to a lesser extent European larch (Larix decidua) and hybrid larch (Larix x eurolepis). Flight observations of P. ramorum symptoms in England on larch have generally remained consistent, i.e. low-level symptoms in the vicinity of previously confirmed infection (either on larch or rhododendron). Symptoms observed have comprised mainly of small groups of trees or individuals. No observations of wide spread infection on a compartment or woodland scale were observed, nor in any significant new geographical areas. 23 Statutory Plant Health Notices (SPHN) were issued in England scheduling 43.5 hectares of larch to be felled. The average felling area for 2017 was 1.9 hectares, whereas in comparison the average felling area in 2010 was 10.7 hectares. New infections in close proximity to the previously known extensive infections in the P. ramorum Management Zone of south west Scotland were limited to single trees or small groups of infected trees. In the Management Zone itself, some disease progression was observed in larch stands known to have existing infection and in general, progression appears consistent with what was observed in 2016. A total of 428 suspect larch sites across Scotland were identified for follow-up ground surveys. 62 were subsequently confirmed to have P. ramorum infection. ‘Outlier’ infections on Larch were confirmed in in a number of areas of Scotland that are considered less climatically suitable for P. ramorum but were generally restricted to regions where infections had been found in previous years. From the flight data and other local information in Wales, Natural Resources Wales (NRW) identified 2,045 hectares for further ground investigation. The majority of these sites lie 17
Chapter 2: Policy Developments

outside the Control Disease Zone in areas with only previously light infection. NRW issued
Statutory Notices on 950 hectares of larch woodlands.

The reason for this significant increase is thought to be due to the combined effect of heavier
than average rainfall in the summer of 2016 followed by a wetter than average and very
warm winter in 2016/17 and has followed the early predictions on the Climex modelling of
the high-risk areas.

In Northern Ireland the flight survey findings and follow up were similar to 2015 and 2016
with limited spread.

2.3 National Forest Inventory (NFI)
The National Forest Inventory of Great Britain (NFI) provides a record of the size and
distribution of forests and woodlands in Great Britain and information on key forest attributes.
This information, together with Forestry Commission growth and yield models, is used to
forecast softwood and hardwood timber availability.

In 2017 a report providing an estimate of the amount of tree cover outside NFI woodland
areas10 in Great Britain was published. This report estimated that there are 742 thousand
hectares of tree cover outside woodland in total, representing 19.4% of all tree cover (both
woodland and outside woodland) and 3.2% of land area. The findings in this report are
relevant to UK policy and practice in a number of areas including tree health, ecological
networks, woodfuel, carbon accounting and urban planning11.

2.4 Climate Change
The UK’s forests are a net sink, removing around 21 million tonnes of carbon dioxide per
year in 2015, although the strength of the sink is projected to decline to around 19 million
tonnes of carbon dioxide per year by 203012, as existing forests are harvested and
restocked. The UK’s LULUCF Action Progress Report (2016) sets out the relative
contribution of afforestation, reducing deforestation, improved management, woodland
enrichment and enhanced resilience to GHG emissions abatement, concluding that
afforestation has the greatest potential as an abatement measure.

The Clean Growth Strategy (CGS) was published in October 2017 and sets out broad
aspirations to increase the rate of afforestation and use of timber in construction in an
illustrative pathway to meet the fifth carbon budget (2028-32) and longer term emissions
reduction commitments. The ‘headline scenario’ includes assumptions that woodland cover
will increase by 130,000 hectares in England by 2032 and by 493,000 hectares across the
UK, recognising the cost-effectiveness of afforestation in emissions abatement. The role of
forest biomass and new ‘energy forestry’ in emissions reduction is also highlighted.

The second UK Climate Change Risk Assessment was published in 2017 and identified six
priority risks, two of which are relevant to forestry: risks to natural capital, including
terrestrial, coastal, marine and freshwater ecosystems, soils and biodiversity; new and
emerging pests and diseases, and invasive non-native species, affecting people, plants and
animals. The second National Adaptation Programme (NAP) was published in 2018, with
10
   Woodland is tree cover over half a hectare in extent and greater than 20 metres in width.
11
   For more information see the National Forest Inventory.
12
   Forestry Statistics (2018) Chapter 4: UK Forests and Climate Change. Forest Research.

18
Chapter 2: Policy Developments

forestry-related actions brigaded around four goals for the five year period of the National
Adaptation Programme: (1) Woodland resource is expanded and better linked to enhance its
resilience at stand and landscape scale; (2) Existing woodlands are more resilient to the
impacts of climate change and pests and diseases; (3) Adaptation is embedded within future
forestry policy to contribute to long-term reduction of climate change risks; and (4)
Woodlands are more resilient to natural hazards.

Climate change adaptation is included in the UK Forestry Standard, which underpins forest
certification through the UK Woodland Assurance Standard and the Woodland Carbon
Code, and meeting its requirements is a consideration of receiving grant aid in the four
devolved administrations.

Resilience and climate change adaptation are at the core of the Science and Innovation
Strategy for Forestry in Great Britain, with three of Forest Research’s seven research
programmes focussing on different aspects of resilience.

2.4.1    Carbon reduction initiatives

2.4.1.1 Woodland Carbon Code
Private sector investment in woodland creation under the Woodland Carbon Code is
continuing to increase. The Woodland Carbon Code, launched in July 2011, sets out
requirements of voluntary woodland creation projects in the UK wishing to make claims
about the carbon they sequester. Companies are able to report verified Woodland Carbon
Units to compensate for their gross emissions following the Department for Environment,
Food and Rural Affairs’ Environmental Reporting Guidelines and use them in claims of
‘Carbon Neutrality’ as set out in the British Standards Institute’s PAS2060: 2014
Specification for the Demonstration of Carbon Neutrality.

2.4.1.2 Carbon Markets in the Forest Sector
The Woodland Carbon Code has generated much interest among landowners and investors
alike. As of 30 March 2018, 239 projects were registered with the Code; together they will
create around 16,100 hectares of new woodland and are predicted to sequester around 5.8
million tonnes of carbon dioxide equivalent over their lifetime (up to 100 years)13. Of the 239
registered projects, 156 are now validated14 and 37 projects are now verified15 and projected
to sequester 713 thousand tonnes of carbon dioxide equivalent over their lifetime.

A proportion of the revenue for each project comes from private sector investment, mainly
from companies considering their Corporate and Social Responsibility. Until now, companies
have paid in advance for carbon to be sequestered with well over half of the validated
carbon being sold in this manner. Case studies of buyers are available on the Woodland
Carbon Code website.

13
   Woodland Carbon Code Statistics: Data to March 2018 Forestry Commission.
14
   Validated: is the initial evaluation of a project or group against the requirements of the Woodland Carbon
Code. Upon completion a project/group will receive a 'Validation Opinion Statement'. The project/group will then
be certified for a period of up to 5 years.
15
   Verified: Verification is the evaluation of a project as it progresses to confirm the amount of CO2 sequestered
to date as well as that it continues to meet the requirements of the Code.

19
Chapter 2: Policy Developments

2.5 UK Grown Timber Initiatives
Since 2013 the not-for-profit, government backed Grown in Britain campaign has developed
and promoted the case for increasing British grown timber. The Grown in Britain programme
combines efforts to increase private sector forest/woodland creation and management, grow
the British timber processing sector, and encourage the promotion of Grown in Britain
branded products in the eyes of merchants, retailers and consumers in the UK. Grown in
Britain has over 1 million tonnes of UK timber licensed to use the ‘Grown in Britain’ brand
and over 300,000 hectares of trees, woods and forests within the scheme.

Following on from the 2016 Grown in Britain Woodstock report that found that UK grown
hardwood sawlog supply has the potential to double to 2050, Grown in Britain has launched
an online portal. This is aimed at the non-professional owner and contains a video on
valuing hardwoods along with up to date guidance of potential prices for a range of UK
grown hardwoods16.

16
     Selling Hardwood Trees (2017) Grown In Britain

20
Chapter 3: Market Drivers 3 Market Drivers Timber prices remain the biggest single influence on the market value of forestry in the UK. The weaker £GBP in 2017 led to increased demand for domestic product as imports became more expensive. The value of UK manufacturers’ sales of wood and wood products increased from £6.4 billion in 2016 to £6.6 billion in 2017, representing a 3.1% increase in sales17. Demand within the construction industry also remains a large influence on the timber market within the UK. Government initiatives to meet housing needs mean that this demand within the construction industry is unlikely to diminish in the short term. 3.1 Construction, manufacturing and distributive trades 3.1.1 Construction The value of UK manufacturer sales of builders’ carpentry and joinery18 increased from £3.4 billion in 2016 to £3.7 billion in 2017, representing an increase of 7.3% (see also section 4.6 and Figure 4.6) There has been a steady increase in the Construction Material Price index within the UK since the latter end of 201519. The ‘All Work’ construction material price index increased by 6% in June 2018 compared to the same month in the previous year. Construction output however, continued to decline in the three-month on three-month series, falling by 1.7% in May 2018; representing the third consecutive decline in this series. This decrease in construction output was driven predominantly by a fall in new work20. Construction activity has remained little changed on a year ago. 3.1.1.1 Housing Starts Across the UK 198,000 permanent dwellings were started in 2017, compared to 189,000 in 2016, representing a 5% increase (see Table 1.1). Housing completions also increased in 2017 with 195,000 permanent dwellings completed in 2017 compared to 171,000 completed in 2016, representing a 14% increase (Figure 3.1). 17 Referring to data from the Office for National Statistics, PRODCOM, UK Manufacturers’ sales by product: provisional estimates 2017 (July 2018): Data from division 16: ‘Manufacture of wood and of products of wood and cork; except furniture; manufacture of articles of straw and plaiting materials’. 18 Referring to data produced by the Office for National Statistics, PRODCOM. Data set: UK Manufacturers’ sales by product: provisional estimates 2017 (July 2018), Data from Division 16: ‘Manufacture of wood and of products of wood and cork; except furniture; manufacture of articles of straw and plaiting materials’. SIC(07) 1623 – Manufacture of other builders’ carpentry and joinery: Total UK manufacturer sales of products in this product group. 19 Monthly Statistics of building Materials and Components No. 517 (July 2018) Department for Business, Energy and Industrial Strategy. 20 Monthly Statistics of building Materials and Components; commentary (July 2018) Department for Business, Energy and Industrial Strategy. 21
Chapter 3: Market Drivers

Figure 3.1 UK Housing Starts and Completions, 2002-2017

Source: Ministry of Housing, Communities and Local Government (October 2018) Live tables on house building: new build
dwellings. Table 211: permanent dwellings started and completed, by tenure, United Kingdom (quarterly). Accessed 09
October 2018.

Provisional data from the first quarter of 2018 suggests that both housing starts and housing
completions have decreased compared to the same quarter in 2017. The majority of
housing starts and completions have consistently occurred in England, accounting for over
74% of starts and completions each year for the last decade, with the latest figures
suggesting this is over 85% for 2017/1821. The private sector dominates housing starts and
completions in the UK, accounting for 82% of housing completions in the UK in 2017/1821.
However, the greatest percentage increase in output was reported within the public housing
sector, with an increase of 22% between 2016 and 2017 (Figure 3.2).

3.1.1.2 Other construction
All construction industry sectors22 increased output between 2016 and 2017, with the
exception of public industrial and public housing repair and maintenance (Figure 3.2).

21
   For detail on other countries see Ministry of Housing, Communities and Local Government (August 2018) Live
tables on house building: new build dwellings. Table 209: permanent dwellings completed, by tenure, and
country and Table 209: permanent dwellings started, by tenure, and country. Accessed 07 August 2018.
22
   Construction industry sectors refer to: public and private housing, infrastructure, public and private industrial*,
private commercial*, public and private housing repair and maintenance, *excluding infrastructure.

22
Chapter 3: Market Drivers

Figure 3.2 Construction Industry Sector Output: volume seasonally adjusted, percentage change period
on previous year, by sector, 2017

Source: Output in the construction industry: reference tables ; Table 3b (May 2018) Office for National Statistics. R&M = Repair
and Maintenance. * Excluding Infrastructure.

3.1.1.3 Forecast23
The UK’s construction industry is expected to experience a moderate decline in 2018,
following five consecutive years of growth. The Construction Products Association’s Summer
Forecasts anticipate growth for the whole of 2018 to fall 0.6%, before accelerating to 2.3% in
2019 and 1.9% in 2020, with house builders the primary drivers of growth for the whole
industry.

In private housing, first-time buyer demand, enabled by the government’s Help to Buy
scheme, continues to encourage an increase in housebuilding activity outside London. The
sector’s output is forecast to rise 5% in 2018 and 2% in 2019. The infrastructure sector also
remains a primary driver of growth for the whole construction industry, with output forecast to
hit a historic high of £23.6 billion by 2020, driven by large projects such as HS224 and
Hinkley Point C25.

The liquidation of Carillion plc, the second largest construction company in the UK, resulted
in a poor performance for the construction industry at the start of the 2018, which combined
with the bad weather, lost UK construction £1 billion of work. It is estimated 60% of this work
may be recovered, but Carillion’s collapse will cause further delays at two major hospitals as
work on the £335 million Royal Liverpool University and Birmingham’s £350 million Midland
Metropolitan hospitals is on hold until at least 2019.

Overall in construction, there is forecast to be a slight decrease in activity, of -0.6%, in 2018.
However, in 2019, it is anticipated there will be growth of 2.3% due to increases house
building and infrastructure.

23
   This section has been taken from The Construction Products Association Summer Forecasts, July 2018.
24
   HS2: High Speed Two
25
   Two new nuclear reactors are being built at Hinkley Point C.

23
Chapter 3: Market Drivers

3.1.2 Manufacturing and distributive trades
UK manufacturing output rose by 2.5% between 2016 and 2017, this is the largest
percentage change since 2013 to 2014 (Figure 3.3). However, manufacturing output over
the three months to May 2018 compared with the three months to February 2018 has fallen
by 1.2%, due to widespread weakness across the sector. This is the largest three-monthly
decline since December 2012, when output fell by 1.8%26.

The UK Index of Production27 suggests that the wood, paper and printing sector has seen a
1.2% growth in March-May 2018 compared to the same three month period in 2017,
although the index reports a 0.3% decrease over the three months to May 2018 compared to
the three months to February 2019.

Figure 3.3 UK Manufacturing Index, 2007-2017 and percentage change year-to-year

Source: Time series: C: Manufacturing (Index): CVM (July 2018) Office for National Statistics. Index year 2016 = 100.

3.1.2.1 Price development; imported softwood, hardwood and plywood28
There are variations in price movements among the different product groups, but the general
trend of rising prices for timber and panel products has continued in 2017.

The 12 month comparison of average price for softwood imports between the two periods
December 2015 to November 2016 and December 2016 to November 2017 reveals that the
softwood import price rose by nearly 6%. Prices rose strongly and steadily throughout most
of 2016 before a sharp correction at the beginning of 2017. However, since the spring of
2017 prices have continued to rise and the average for the whole ’basket’ of softwood
imports has hovered around the £200 per m3 at the end of 2017.

26
   Index of Production, UK: May 2018: Figure 3. Office for National Statistics.
27
   Index of Production, UK: May 2018: Table 2. Office for National Statistics.
28
   This section was taken from the Timber Trade federation Statistical Bulletin (February 2018)

24
Chapter 3: Market Drivers

In contrast, the average price of hardwood imports over the same 12-month period has fallen
slightly, by just over 1%. Being of much lower volume than softwood, there tends to be
greater volatility in price movements of hardwood and there are distinct differences in the
price movement by hardwood species. Over the 12-month period, average tropical
hardwood prices rose by 5% while prices of temperate species fell by 3%, this was
accompanied by a 19% increase in volume.

Hardwood plywood prices increased strongly between 2015 and 2017 (average of the period
Dec 2015-Nov 2016 compared to the average for Dec 2016-Nov 2017 increased by 8.6%).
As prices increased, volume showed a small decline of 2% over the same period. However,
during the autumn of 2017, average prices began to fall back and by November 2017 were
around 3% below the previous 12-month average.

Strong upward price movement has also been a feature of the market for softwood plywood.
The highest average price increase (13.3%) of all the products shown here has been
accompanied by a 5% rise in volume. Average prices of softwood plywood imports have
continued to rise during the autumn of 2017 and by November 2017 had risen to the record
high levels last seen in the previous November of 2016.

3.1.2.2 UK Timber Price Indices

3.1.2.2.1 Coniferous Standing Sales Price Index
There has been an overall increase in the index over the last 15 years, following an overall
decrease in earlier years. The index was 28.2% higher in real terms (30.5% in nominal
terms) in the year to March 2018, compared with the previous year. The average price for
coniferous standing sales was £24.64 per cubic metre overbark standing in nominal terms in
the year to March 2018, an increase from £19.05 in the year to March 201729.

3.1.2.2.2 Softwood Sawlog Price Index
The index was 18.8% higher in real terms (20.8% in nominal terms) in the 6 months to
March 2018, compared with the corresponding period of the previous year. The average
price for softwood sawlog sales was £48.36 per cubic metre overbark in nominal terms in the
6 month period to March 2018, an increase from £41.83 in the 6 months to September 2017
and £40.01 in the 6 months to March 2017.

3.1.3 Wooden Pallets
In 2017 in the UK 39 million new pallets were sold, representing an 11% decrease since
2016. This follows a slow but steady decline in sales since 2014. This decline is likely to be
linked to the increase in sale of refurbished and recycled pallets. In 2017 37 million
refurbished pallets were sold, representing a 13% increase since 201630.

3.2 Energy Markets
Final energy consumption in the UK in 2017 was 141,175 ktoe (tonne of oil equivalent), this
represents a 0.7% decrease since 2016. The decrease in consumption was mostly due to a
decrease in gas consumption in the domestic sector resulting from warmer average
temperatures, particularly in the winter. Therefore, when corrected for temperature, energy

29
   For more information see Timber Price Indices: data to March 2018. Forest Research, IFOS-Statisitcs.
30
   For more information see UK manufacturers’ sales by product (July 2018) Office for National Statistics.
Division 16: Manufacture of Wood and of Products of Wood and Cork, except Furniture, Manufacture of Articles
of Straw and Plaiting Materials.

25
Chapter 3: Market Drivers

consumption in 2017 in the UK actually increased by 0.9%. The transport sector accounted
for 40% of the final energy consumption in 2017, with the domestic, industry and services
sectors using 28%, 17% and 15% respectively.

Figure 3.4 The change in energy consumption from 2016 to 2017 split by fuel and sector

Ktoe = thousand tonnes of oil equivalent: this is a common unit of energy measurement which enables different fuels to be
directly compared and aggregated. One tonne of oil equivalent is set equal to 41.868 Giga Joules (GJ) or 11,630 kilo Watt
hours (kWh). Source: Energy Consumption in the UK (July 2018) Department for Business, Energy and Industrial Strategy.

The sectors that saw the largest increase in use of bioenergy and waste31 between 2016 and
2017 were industry and services although the domestic sector is also a significant user of
bioenergy but there was very little change in usage between 2016 and 2017. Since 2012,
the share of solid fuels in the UK fuel mix has decreased rapidly; its share in 2012 was 20%,
now reduced to just 5.3%. During this period, the contribution of bioenergy and waste has
increased from 4.1% in 2012 and has now overtaken solid fuel32 at 8.3%. The UK
consumed 6,145 Ktoe of bioenergy and waste in 2017 compared to 682 Ktoe in 2002
(Figure 3.5).

31
  Bioenergy and waste are predominantly used for renewable heat; includes liquid biofuels from 2006.
32
  Solid fuels include coal, manufactured solid fuels, benzole, tars, coke, oven gas and blast furnace gas. Wood
and wood waste is included in renewable fuels and waste.

26
You can also read