Chimpanzee population structure in Cameroon and Nigeria is associated with habitat variation that may be lost under climate change
←
→
Page content transcription
If your browser does not render page correctly, please read the page content below
Sesink Clee et al. BMC Evolutionary Biology (2015) 15:2
DOI 10.1186/s12862-014-0275-z

 RESEARCH ARTICLE                                                                                                                                  Open Access

Chimpanzee population structure in Cameroon
and Nigeria is associated with habitat variation
that may be lost under climate change
Paul R Sesink Clee1,2*, Ekwoge E Abwe3,4, Ruffin D Ambahe5, Nicola M Anthony6, Roger Fotso5, Sabrina Locatelli2,7,
Fiona Maisels8,9, Matthew W Mitchell1,2, Bethan J Morgan3,4,8, Amy A Pokempner2,9 and Mary Katherine Gonder1,2*

  Abstract
  Background: The Nigeria-Cameroon chimpanzee (Pan troglodytes ellioti) is found in the Gulf of Guinea biodiversity
  hotspot located in western equatorial Africa. This subspecies is threatened by habitat fragmentation due to logging
  and agricultural development, hunting for the bushmeat trade, and possibly climate change. Although P. t. ellioti
  appears to be geographically separated from the neighboring central chimpanzee (P. t. troglodytes) by the Sanaga
  River, recent population genetics studies of chimpanzees from across this region suggest that additional factors may
  also be important in their separation. The main aims of this study were: 1) to model the distribution of suitable habitat
  for P. t. ellioti across Cameroon and Nigeria, and P. t. troglodytes in southern Cameroon, 2) to determine which
  environmental factors best predict their optimal habitats, and 3) to compare modeled niches and test for their
  levels of divergence from one another. A final aim of this study was to examine the ways that climate change
  might impact suitable chimpanzee habitat across the region under various scenarios.
  Results: Ecological niche models (ENMs) were created using the software package Maxent for the three populations of
  chimpanzees that have been inferred to exist in Cameroon and eastern Nigeria: (i) P. t. troglodytes in southern Cameroon,
  (ii) P. t. ellioti in northwestern Cameroon, and (iii) P. t. ellioti in central Cameroon. ENMs for each population were
  compared using the niche comparison test in ENMtools, which revealed complete niche divergence with very little
  geographic overlap of suitable habitat between populations.
  Conclusions: These findings suggest that a positive relationship may exist between environmental variation and the
  partitioning of genetic variation found in chimpanzees across this region. ENMs for each population were also projected
  under three different climate change scenarios for years 2020, 2050, and 2080. Suitable habitat of P. t. ellioti in northwest
  Cameroon / eastern Nigeria is expected to remain largely unchanged through 2080 in all considered scenarios. In
  contrast, P. t. ellioti in central Cameroon, which represents half of the population of this subspecies, is expected to
  experience drastic reductions in its ecotone habitat over the coming century.

Background                                                                             to be divided into four subspecies [1-5]: P. t. verus occurs
Chimpanzees and bonobos belong to the genus Pan.                                       in the Upper Guinea region of western Africa; P. t. ellioti
Bonobos (Pan pansicus) occupy the dense wet forests                                    has a patchy distribution spanning from western Nigeria
south of the Congo River, whereas chimpanzees (P. trog-                                to central Cameroon; P. t. troglodytes occupies the Congo
lodytes) occupy a much broader range of forested habitats                              Basin with a range that spans from southern Cameroon
located north of the Congo River and across equatorial                                 and eastward to the Ubangi River; P. t. schweinfurthii
Africa [1-4] (Figure 1). Chimpanzees are widely considered                             occupies forests east of the Ubangi River to the Rift
                                                                                       Valley [6].
* Correspondence: psesinkclee@drexel.edu; gonder@drexel.edu
                                                                                         Recently Junker et al. [7] created ecological niche
1
 Department of Biology, Drexel University, Philadelphia, PA 19104, USA                 models (ENMs) for all African great apes. This study
2
 Department of Biological Sciences, University at Albany – State University of         was comprehensive, and included two composite maps
New York, Albany, NY 12222, USA
Full list of author information is available at the end of the article
                                                                                       of taxon-specific ENMs for each ape subspecies at a

                                         © 2015 Sesink Clee et al.; licensee BioMed Central. This is an Open Access article distributed under the terms of the Creative
                                         Commons Attribution License (http://creativecommons.org/licenses/by/4.0), which permits unrestricted use, distribution, and
                                         reproduction in any medium, provided the original work is properly credited. The Creative Commons Public Domain
                                         Dedication waiver (http://creativecommons.org/publicdomain/zero/1.0/) applies to the data made available in this article,
                                         unless otherwise stated.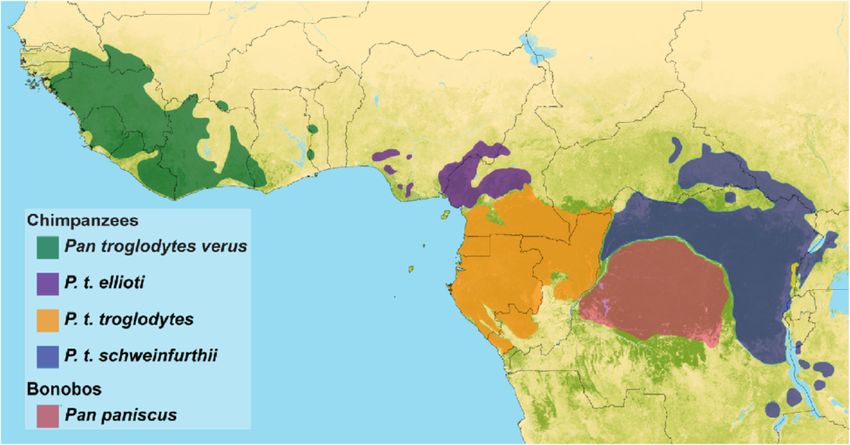
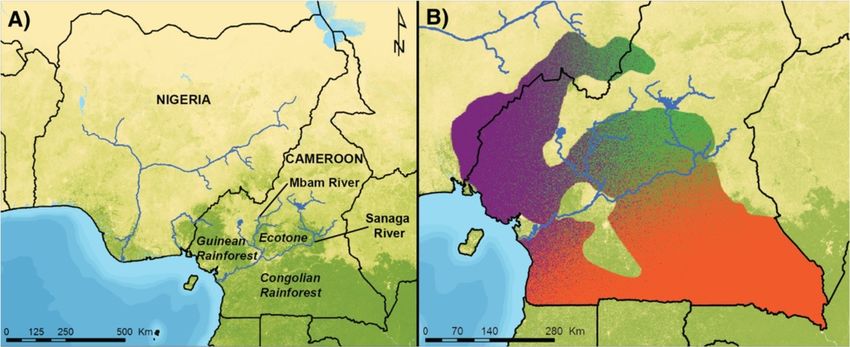
Sesink Clee et al. BMC Evolutionary Biology (2015) 15:2                                                                       Page 2 of 13

 Figure 1 Chimpanzee subspecies ranges. Distribution of the genus Pan, including bonobos and the four subspecies of chimpanzee.

continental scale. They compared ENMs from the 1990s                   composition in response to climate change, and these
and early 2000s in order to determine which ape taxa                   changes are expected to accelerate over the next century
had experienced the most significant loss of suitable                  [11-15].
habitat in the recent past. For chimpanzees, they re-
ported that P. t. verus and P. t. troglodytes had experi-              Study area and taxa
enced the most significant decline in suitable habitat,                The Gulf of Guinea region of Africa is widely recognized
but that P. t. ellioti and P. t. schweinfurthii have not ex-           as a biodiversity hotspot of global significance due to
perienced any significant changes in suitable habitat [7].             the region’s high number of endemic taxa [16,17]. The
These conclusions were attributed to previous wide-                    reasons why this region has so many endemic taxa remain
spread habitat loss in P. t. ellioti and P. t. schweinfurthii.         unclear, but this pattern of high endemism has been attrib-
However, this study was carried out at a coarse reso-                  uted to the effects of geographic barriers, such as the Niger
lution on a continental scale and did not account for                  River, Sanaga River, and the Cameroon Highlands, as well
two important factors, namely 1) the detailed population               as to the history of the forests in this area during the
genetic structure of chimpanzees across Africa, particu-               Pleistocene [1,16,18,19]. This area also includes a conspicu-
larly Cameroon, and 2) the potential role of future cli-               ous transition between three major biomes. Specifically, the
mate change on the distribution of suitable habitat for                Gulf of Guinea rainforest and the Congolian rainforest bi-
the two chimpanzee subspecies that occupy this region.                 omes converge with each other and with open savanna
Accounting for both of these factors in ENMs is import-                [20,21]. These three habitats meet in central Cameroon,
ant for at least two reasons. First, it is unknown what                forming an ecotone comprised of a forest-woodland-
role niche divergence plays in the genetic divergence of               savanna mosaic (Figure 2A). Ecotones across the world
chimpanzees, or even if the various chimpanzee subspe-                 are increasingly recognized as being important in driving
cies occupy significantly different types of habitats. Data            variation in a number of taxa [22,23], and this ecotone in
regarding the relationship between the distribution of                 Cameroon has been shown to be important in driving di-
genetic diversity and environmental variation remain                   versification in insects, reptiles, and birds [8-10].
sparse for the study region, but a growing body of evi-                  With respect to chimpanzees, Cameroon is unique be-
dence suggests that a strong relationship exists between               cause it is home to two of the four subspecies: P. t. ellioti
the partitioning of adaptive genetic variation and envir-              (the Nigeria-Cameroon chimpanzee) and P. t. troglodytes
onmental variation in Cameroon for the few taxa studied                (the Central chimpanzee). The ranges of these two subspe-
to date [8-10]. Second, this region of Africa is expected              cies meet along the Sanaga River in central Cameroon,
to experience dramatic changes in forest cover and                     which has been proposed to separate them [3,24-26]. The
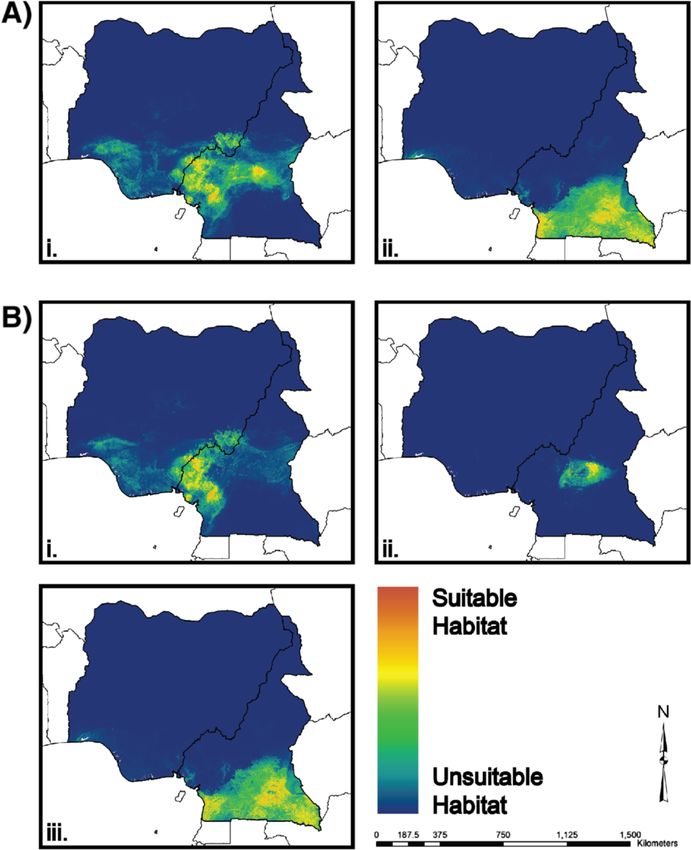
Sesink Clee et al. BMC Evolutionary Biology (2015) 15:2                                                                       Page 3 of 13

 Figure 2 Habitat types and chimpanzee population history in Cameroon and Nigeria. A. Different habitat types and major rivers across
 Cameroon and Nigeria B. Population history of chimpanzees in Cameroon and adjacent parts of Nigeria inferred from the analysis of 21
 autosomal microsatellite loci in 187 unrelated chimpanzees [27].

Sanaga River is also notable because it has been proposed              where the Gulf of Guinea rainforest meets the Congo
to influence the distributions of several other species                Basin rainforest, and its headwaters are in an ecotone in
that occupy different niches including, Mandrillus leuco-              central Cameroon. This complexity makes it difficult to
phaeus/M. sphinx, Cercopithecus erythrotis/C. cephus, C.               attribute the separation of these taxa solely to their sep-
nictitans martini/C. n. nictitans, and C. pogonias                     aration along the banks of the Sanaga, particularly since
pogonias/C. p. grayi [1,16,18,19,24]. A clearer under-                 habitat variation across this region appears to influence
standing of the role that environmental variation has                  the distribution of other taxa that occupy vastly different
played in delimiting the distribution of chimpanzee sub-               niches [1,16,18,19,24]. These observations suggest that
species across this region may help to clarify why this re-            ENMs predicated upon the population genetic structure
gion plays an important role in shaping the distribution               of chimpanzees across the region on a fine geographic
of other forest-dwelling primates.                                     scale may help resolve the role that habitat variation
  Figure 2B shows the population structure of chimpan-                 plays in delimiting the distributions of chimpanzees in
zees from this region inferred by fine scale population                the Gulf of Guinea and Congo Basin forests. In addition,
sampling and genetic analysis of wild chimpanzees [27]                 ENMs made at a fine geographic scale may be more use-
suggesting that chimpanzees across this region are divided             ful than continental-scale models (i.e., Junker et al. [7])
into as many as three distinct populations. A primary                  for more fully understanding future threats to these pop-
division of chimpanzee populations occurs at the                       ulations. Specifically, this study was designed to address
Sanaga River, which separates P. t. troglodytes in southern            two key questions: (1) Do the genetically defined popula-
Cameroon from P. t. ellioti in central and western                     tions of chimpanzees across this region occupy signifi-
Cameroon north of the Sanaga. In addition, P. t. ellioti may           cantly different habitats and if so, which environmental
be further subdivided into two additional populations: one             factors appear to be the most important in describing
in the rainforests of western Cameroon, which is separated             suitable habitat for each population? (2) If a relationship
from the second population located in the ecotone habitat              exists between environmental variation and the parti-
[9] east of the Mbam River (Figure 2A). For convenience,               tioning of genetic variation, will ongoing and future cli-
these three chimpanzee demes are called the P. t. ellioti              mate change contribute to altering the remaining
(Rainforest) population (shown in purple in Figure 2B),                distribution of their suitable habitat(s)?
the P. t. ellioti (Ecotone) population (shown in green in
Figure 2B) and the P. t. troglodytes population (shown in              Results and discussion
orange in Figure 2B) throughout this document.                         Maxent modeling under present conditions
  While this region of Africa appears to be an engine of               Aggregate ENMs were produced by averaging values
diversification in chimpanzees, the proximate mecha-                   from 100 replicate iterations of the data for both the
nisms that make this region so important for this species              two- and three-population models. These ENMs are
remain unclear [8-10]. The Sanaga River lies in the area               shown in Figure 3 and are displayed using a logarithmic
Sesink Clee et al. BMC Evolutionary Biology (2015) 15:2                                                                       Page 4 of 13

 Figure 3 Ecological niche models for chimpanzee populations in Cameroon and Nigeria. A. Two-population model: (i) P. t. ellioti, (ii) P.
 t. troglodytes, B. Three-population model: (i) P. t. ellioti (Rainforest), (ii) P. t. ellioti (Ecotone), (iii) P. t. troglodytes.

scale ranging from 0, corresponding to unsuitable habi-                two-population model, which separates P. t. ellioti from
tat (cooler colors), to 1, corresponding to most suitable              P. t. troglodytes [27]. Figure 3B shows ENMs assuming a
habitat (warmer colors). Figure 3A shows ENMs for the                  three-population model, which subdivides P. t. ellioti
Sesink Clee et al. BMC Evolutionary Biology (2015) 15:2                                                                    Page 5 of 13

Table 1 Average AUC values for each ecological niche model (average of 100 replicates)
                           2-population model                    3-population model
                           P. t. ellioti     P. t. troglodytes   P. t. ellioti (Rainforest)   P. t. ellioti (Ecotone)   P. t. troglodytes
AUC                        0.942             0.940               0.951                        0.989                     0.944
Standard deviation         0.036             0.037               0.045                        0.011                     0.041

into two populations [27], one that inhabits the rainfor-             ellioti (Ecotone) describes an entirely different habi-
ests of western Cameroon and a second population that                 tat, with high AUC values and the lowest standard devi-
inhabits the ecotone of central Cameroon.                             ation. Many variables contribute to describing from 5-
                                                                      12% of the suitable habitat of the ENMs for this popula-
Testing model performance                                             tion. Collectively these variables describe a suitable habi-
Table 1 shows the AUC (area under the curve) values                   tat for P. t. ellioti (Ecotone) that has greater variation in
for ENMs of each population under present conditions.                 tree cover and that is drier, warmer, and more variable
For evaluating the robustness of an ENM, AUC values                   throughout the year compared to the optimal habitat of
greater than 0.9 are considered to be ”very good” at                  P. t. ellioti (Rainforest). Although humans may be ex-
describing a population’s niche, while AUC values of 0.7-             pected to strongly influence wildlife distributions, hu-
0.9 are considered to be “good”, and less than 0.7 are                man population density contributed little compared to
classified as being “uninformative” [28]. All ENMs pro-               landscape variables in defining the habitat of any chimpan-
duced in this study performed better than ENMs produced               zee population considered in this study.
by random associations between species presence and the                 Response curves for each of the environmental pre-
environmental variables (AUC of 0.5). All empirical AUC               dicting factors were created for each ENM using Max-
values were greater than 0.94, suggesting that the ENM for            ent. These graphs show the range of values for each
each population was highly informative and described suit-            factor that are most important for describing the suitable
able habitats that corresponded very well with the environ-           habitat of the population in question. Many environ-
mental conditions found at presence localities recorded for           mental predicting factors contributed to differences in
each population considered in the study.                              the optimal habitat of each population. For example,
  Additional file 1 shows the results of the Maxent jack-             slope was found to be one of the most important factors
knife tests and the resulting percent contribution of each            that differentiate the habitat of P. t. ellioti (Rainforest)
environmental predicting factor for both the two- and                 versus P. t. ellioti (Ecotone) from the habitat of P. t. trog-
three-population models. In the two-population model,                 lodytes in southern Cameroon. Specifically, at slopes
44.5% of the ENM for P. t. troglodytes was defined by                 greater than 15 degrees the probability of suitable habi-
maximum temperature, and another 30% of the habitat                   tat was greater than 90% for P. t. ellioti as a whole as
was described by precipitation variables. The ENM for                 well as when the subspecies was subdivided into P. t.
P. t. troglodytes in the three-population model showed                ellioti (Rainforest) and P. t. ellioti (Ecotone). The ENM
similar trends in suitable habitat. In both the two- and              of P. t. ellioti (Ecotone) also showed elevated gain in re-
three-population model, optimal habitat for P. t. troglo-             gions with sparse tree cover and less gain within areas of
dytes is relatively uniform moist rainforest. In contrast,            dense tree cover compared to P. t. ellioti (Rainforest).
P. t. ellioti occupies a much broader range of suitable               Overall, individuals of P. t. ellioti (Rainforest) appear to
habitat, including moist rainforest, woodlands, and open              occupy steep, densely forested areas. These habitats also
savanna, with more than 80% of the ENM for P. t. ellioti              experience high levels of precipitation throughout the
defined by trends in slope, temperature seasonality, tree             year with a pronounced increase in precipitation from
cover, and precipitation.                                             May – October. In contrast, P. t. ellioti (Ecotone) ap-
  Subdividing the P. t. ellioti population into groups lo-            pears to occupy a wider breadth of habitats that include
cated in northwest Cameroon and the ecotone revealed                  both forest and savanna, and they likely experience more
marked contrast in the habitats occupied by each popu-                seasonal variation in terms of temperature and precipita-
lation. Over 30% of the ENM for P. t. ellioti (Rainforest)            tion throughout the year.
is described by slope, and measures of precipitation and
temperature seasonality described an additional 50% of                Comparison of ENMs under present conditions
their suitable habitat. The distribution of P. t. ellioti             Table 2 shows values for the Schoener’s D test statistic
(Rainforest) is currently limited to the Cameroon High-               [29] and the I test statistic [30] from the pairwise niche
lands and the Bakossi Mountains, where elevational gra-               comparison tests for the two- and three-population
dients are prominent and the neighboring coastal region               models calculated using ENMtools [29]. The two-
experiences high precipitation. The ENM for P. t.                     population model revealed that the niches occupied by
Sesink Clee et al. BMC Evolutionary Biology (2015) 15:2 Page 6 of 13
Table 2 ENMtools Niche overlap test
Schoener’s D I
Model Comparison Observed Null mean Null SD p Observed Null mean Null SD p
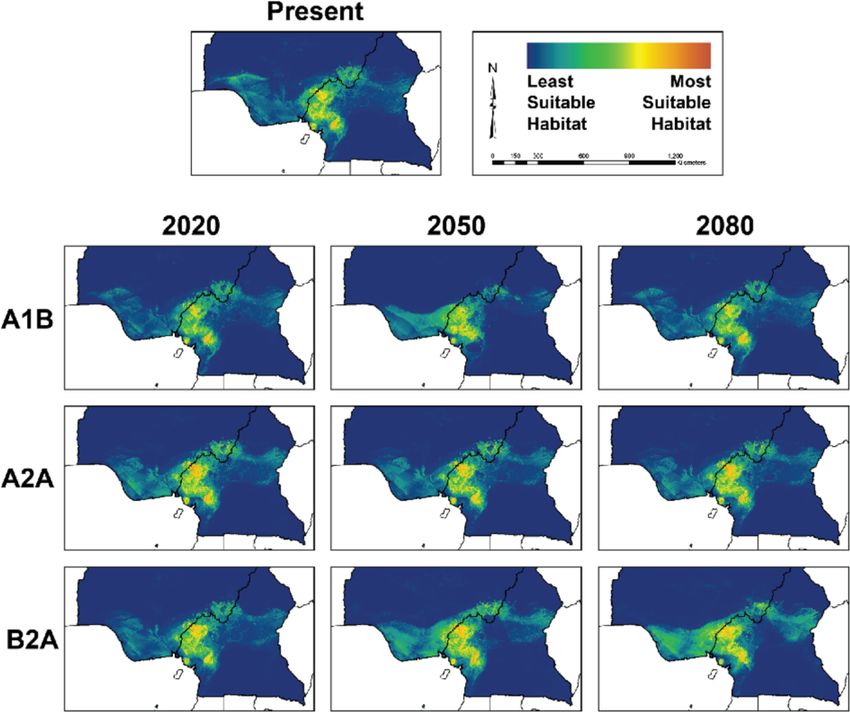
2-population Pte* and Ptt** 0.152 0.735 0.026Sesink Clee et al. BMC Evolutionary Biology (2015) 15:2 Page 7 of 13 Figure 4 Ecological niche models for P. t. ellioti (Rainforest) under scenarios of climate change. Final ecological niche models produced by Maxent for P. t. ellioti (Rainforest) under each of the three climate scenarios tested. Warm colors show most suitable habitat, while cold colors show less suitable habitat. The extent of the optimal habitats for each of these genetic differentiation and habitat variation [33]. Taken three populations correspond with the distribution of together, these studies propose that populations of chim- the three genetically distinct populations of chimpanzees panzees in Cameroon and Nigeria may be following a that have been inferred to exist across the study area pattern of isolation-by-environment [34]. Furthermore, [27]. These ENMs suggest that (i) a relationship exists these findings suggest that environmental variation may between environmental variation and the population also contribute to generating genetic variation within genetic structure of chimpanzees across the study area, P. t. ellioti, as this subspecies occupies two fundamen- and (ii) that the Sanaga River is unlikely to be the only tally different niches in two different areas of Cameroon. factor that contributes to the separation of P. t. ellioti The distribution of these two habitats corresponds very from P. t. troglodytes. These results provide an ecological precisely with the inferred distribution of the two P. t. basis for the assertion that environmental variation ellioti demes [27], which suggests that adaptation to dif- across the region may be driving local adaptation. This ferent niches may play a role in the diversification of is particularly compelling when coupled with the find- chimpanzee subspecies. ings of two related studies that found that simple allo- Recognizing that a positive relationship might exist be- patric speciation is unlikely to explain the observed tween environmental and genetic variation in the distri- patterns of chimpanzee genetic diversity [27], and that bution of chimpanzees also has important implications a clear association exists between spatial patterns of for broadening understanding about the puzzling
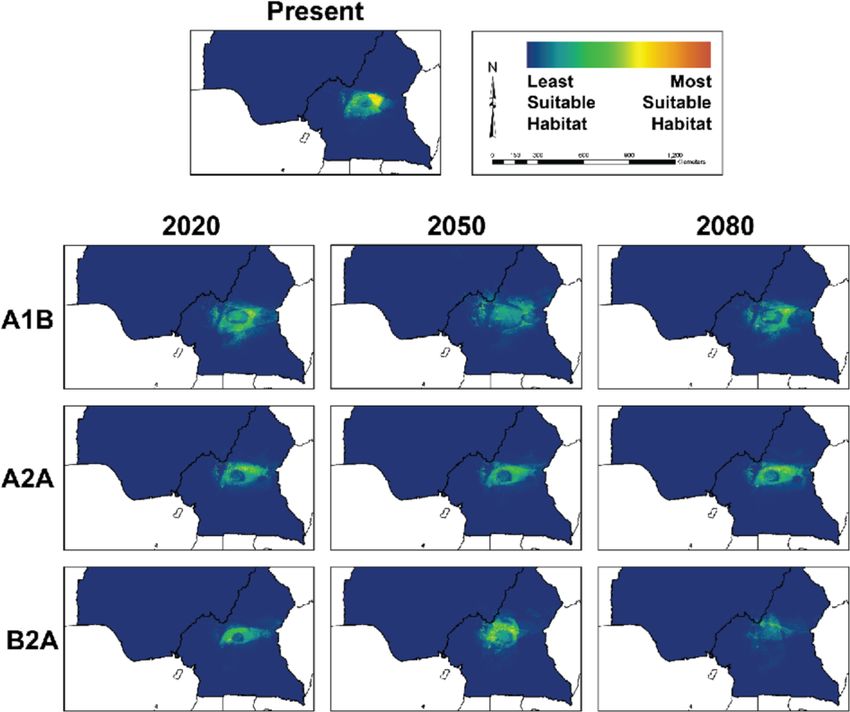
Sesink Clee et al. BMC Evolutionary Biology (2015) 15:2                                                                                 Page 8 of 13

 Figure 5 Ecological niche models for P. t. ellioti (Ecotone) under scenarios of climate change. Final ecological niche models produced by
 Maxent for P. t. ellioti (Ecotone) under each of the three climate scenarios tested. Warm colors show most suitable habitat, while cold colors show
 less suitable habitat.

distributions of other primates proposed also to be influ-                    The African continent and central Africa in particular
enced by the Sanaga River, including Mandrillus leuco-                      are predicted to be one of the most severely affected re-
phaeus/M. sphinx, Cercopithecus erythrotis/C. cephus, C.                    gions of the world by climate change [11-15]. Prelimin-
nictitans martini/C. n. nictitans, and C. pogonias pogo-                    ary projections suggest that rainfall patterns will change
nias/C. p. grayi [1,16,18,19,24]. These pairs of pri-                       dramatically in this region of Africa, which will result in
mates all occupy vastly different habitats and niches                       significant alterations of forest and savanna habitats [35].
[1,18], which suggests that other factors along with, or in-                Models of global climate change also have been used to
stead of, the Sanaga River may be important in separating                   show that 30% of plant and animal species are at risk of
the distribution of these species, subspecies, and popula-                  extinction if the rise in mean global temperature exceeds
tions across the region. The role that environmental vari-                  1.5°C - an increase that is nearly certain to occur under
ation may have played in delimiting the distribution of                     future climate scenarios [32,36]. Tropical forest taxa are
these taxa remains uninvestigated. The existence of such a                  widely believed to exist at a physiological optimum and
relationship would also be consistent with some insects                     their abilities to shift to new environmental conditions re-
[8], reptiles [9], and birds [10] in which the pronounced                   mains largely unknown [37]. Most of this evidence comes
ecological gradient across Cameroon has been shown to                       from amphibians, which suggests that even conservative
be important in driving the population genetic structure                    projections of global warming will likely lead to wide-
of these species.                                                           spread decline in amphibian populations across tropical
Sesink Clee et al. BMC Evolutionary Biology (2015) 15:2                                                         Page 9 of 13

regions [38,39]. Data regarding how climate change might       migration corridors between protected areas are im-
affect mammals remain sparse, but climate induced range        portant for securing the long-term survival of taxa in
contractions have been linked to the loss of pockets of        regions where climate change is predicted to heavily
genetic distinctiveness in South African animals [40]. This    modify the landscape [44]. The result of migration to
suggests that it is reasonable to expect similar losses to     new habitats is unknown, and should be studied in
occur in tropical forest mammals such as chimpanzees.          greater detail with the use of rigorous dispersal/demo-
Thus, the final step of this study involved examining how      graphic simulations [45]. One likely outcome is that
climate change might affect the optimal habitats of P. t.      pockets of genetic distinctiveness in P. t. ellioti will be
ellioti in the future. Specifically, the effects of climate    lost along with their optimal ecotone habitat. To the
change on the optimal habitats of P. t. ellioti were exam-     extent that genetic distinctiveness is an important con-
ined under the A1B, A2A, and B2A emission scenarios for        servation goal, it is important that planning efforts
years 2020, 2050, and 2080.                                    take into consideration the effects of climate change
   The predictions presented in this study suggest that        on the distribution of optimal habitat, especially for P. t.
the two distinct habitats occupied by P. t. ellioti will be    ellioti (Ecotone).
affected differently. Little change is expected in moun-          It is currently unknown whether chimpanzees will ex-
tainous, wet rainforests found in the northwest under          hibit niche conservatism or if they will adapt to changes
any scenario across this time series. By contrast, optimal     in their habitats that result from climate change. Popula-
habitat in the ecotone is predicted to decline quickly         tions that exhibit strict niche conservatism over time
under all scenarios by year 2020 and will disappear al-        may experience limited potential for range expansion
most entirely under the worst-case scenario by 2080.           and reduced dispersal opportunities since optimal habi-
These findings have important implications for under-          tat tracking may not be possible due to their divergent
standing the conservation outlook for this subspecies.         neighboring niches [46,47]. This possibility is especially
P. t. ellioti is the most endangered of all the chimpanzee     plausible for P. t. ellioti (Ecotone) since this popula-
subspecies, with only about 6,000 individuals estimated        tion exploits a niche that is completely divergent
to persist across their entire range today and of which        from the rainforest habitats of the neighboring P. t. ellioti
roughly half exist in this ecotone habitat [41]. Junker        (Rainforest) and P. t. troglodytes in southern Cameroon.
et al. [7] concluded that from the 1990s to the 2000s          This region of west central Africa is likely to experi-
there had not been significant reductions in suitable en-      ence drastic alterations that could lead to the loss of
vironmental conditions for this subspecies, but the fu-        nearly all optimal chimpanzee habitat found in central
ture predictions of our study indicate a drastic loss of       Cameroon by 2080. Although the threats of hunting
suitable habitat by year 2020 followed by progressive          and habitat fragmentation by logging and agricultural
degradation of suitable habitat for half of the range          plantations are immediate and are expected to have a
of P. t. ellioti due to climate change. However, future        large overall effect on chimpanzees in this region [41],
models presented in this study do not address the effects      the results of this study suggest that habitat loss due
of continued human population growth, urban sprawl,            to climate change is a serious concern within our life-
agricultural development, and hunting, which are all ex-       times and should not be ignored in conservation
pected to continue and accelerate across the region in         planning.
coming years [41].
   On a more positive note, there are several caveats to
these sobering predictions. The models presented in this       Methods
study do not take into account individual phenotypic           This study was carried out in three phases. The first
plasticity or the potential for migration amongst these        step involved generating ENMs for each of the two
populations. In cases where loss of suitable habitat is        or three inferred chimpanzee populations, which required
likely to be significant, it is possible that these chimpan-   the acquisition and preparation of chimpanzee presence
zees may be able to compensate and remain in their             data from across the study region and the processing of
degrading habitat. They might also respond by migrating        environmental data to define niche dimensions. The sec-
in order to track optimal environmental conditions,            ond step involved: (i) using quantitative methods to de-
which is the simplest way that a population may respond        termine whether optimal habitats for the inferred
to drastic changes in climate [42]. The effectiveness of       chimpanzee populations differed significantly from each
migration to more optimal habitat relies on the availabil-     other, and (ii) examining which variables made the lar-
ity of local suitable habitats for exploitation. Both micro-   gest contributions to differences between niches occu-
and macrorefugia have been shown to act as important           pied by each population. The final step involved
reservoirs of genetic diversity in past large climatic         examining how climate change might affect the optimal
events [43]. From a conservation point of view,                habitat of each population in the future.
Sesink Clee et al. BMC Evolutionary Biology (2015) 15:2                                                            Page 10 of 13

Preparation of species occurrence data                             range of when all occurrence data were collected. Maps of
Species occurrence data (Table 3 and Additional file 3)            environmental variables were transformed into the WGS
were obtained from www.ellioti.org [41] and from publi-            1984 coordinate projection because it preserves curvilinear
cations that involved sampling and/or observing wild               features of the data and keeps it from being warped since
chimpanzee populations across Cameroon and Nigeria                 the study area is within 15 degrees latitude of the equator
from the late 1990s and early 2000s including both P. t.           [59]. This coordinate system also assured that the data re-
ellioti (N = 656) and P. t. troglodytes (N = 98) [48-51].          tain compatibility with most publically available shapefiles
Occurrence data were compiled as geographic coordi-                for future projects and applications. All environmental
nates that indicated locations where chimpanzees were              layers used have a resolution of 30-arcseconds (about
seen, heard, and/or indirect evidence of chimpanzee ac-            1 km2), which was the finest resolution available at the time
tivity was found (nests, feeding sign, or tool use). Fecal         of publication for these layers at this multi-country scale.
and hair samples were shipped to the United States at
ambient temperature, then stored at -20°C upon receipt.            Maxent modeling under present conditions
All samples were transported from Cameroon to the                  ENMs were generated using a presence-only model im-
United States in full compliance with Convention of                plemented using the program Maxent [53]. This method
International Trade in Endangered Species of Wild                  was chosen for several reasons. Firstly, presence-only
Fauna and Flora (CITES) and Center for Disease Control             models, like Maxent, are useful because presence locality
(CDC) export and import regulations. Analysis of these             data are becoming more widely available for many taxa.
samples was carried out with IACUC approval from the               Secondly, absence records are not widely available for
University at Albany – State University of New York.               chimpanzees and those that are available have often
   Duplicate occurrences with the same geographic coor-            questionable accuracy due to the species’ large home
dinates were trimmed using ENMtools [29]. Second, an               ranges. Thirdly, a large comparative study has shown
altitude map layer was created and used to trim dupli-             that the Maxent model outperforms other presence-only
cate occurrences that fell into the same grid cell of              models such as GARP in many applications [60]. Finally,
1 km2. The remaining localities were projected in Arc-             Maxent has also performed successfully in recent studies
Map 10 [52] for visual inspection to confirm that no               of other elusive and motile species [61-64].
more than one occurrence point fell into any one grid                 The dataset of occurrence localities (described below)
cell of the environmental data. Coordinates of occur-              was divided into subsets for two- and three-populations
rence data were then exported as a .csv formatted file             from the inferred genetic structure shown by Mitchell
for input into the Maxent software [53].                           et al. [27]. In the two-population model, occurrence data
                                                                   for P. t. troglodytes were separated from P. t. ellioti ac-
Preparation of present environmental data                          cording to whether the point occurred north versus
Environmental data used for this study are listed in               south of the Sanaga. The three-population model, included
Additional file 4. These environmental predicting factors          the group of presence points from P. t. troglodytes located
were selected to best describe the habitat exploited by            south of the Sanaga, and the presence points from P. t.
chimpanzees in Cameroon and Nigeria and included:                  ellioti were subdivided into two groups. The first group
(i) climatic factors and measures of climate stress such as        was composed of presence points from P. t. ellioti west of
isothermality and temperature seasonality [54,55], (ii) topo-      the Mbam River, which is the main tributary of the Sanaga
graphic factors such as elevation, slope, and percent tree         and demarcates the boundary of the ecotone. The second
cover [56,57], and (iii) anthropogenic presence as measured        group of presence points was from P. t. ellioti located in
by human population density across the study area [58]. All        the ecotone region found east of the Mbam River in central
environmental predicting factors were based on data gath-          Cameroon.
ered from 1994 to 2010, which corresponds to the time                 Models were created using Maxent [53] with the default
                                                                   convergence threshold (10-5) and 100 cross-validated repli-
                                                                   cates. This cross-validation replicate process involved the
Table 3 Species occurrence data
                                                                   random splitting of occurrence data into a number of
Number of occurrences                  Subspecies         Source   equal-sized “folds” or groups where models were created
634                                    Pte and Ptt        [41]     leaving out one fold for each run. For each replicate, the
57                                     Pte* and Ptt**     [48]     excluded fold is used to evaluate the model [53].
19                                     Ptt                [49]
8                                      Ptt                [50]     Testing model performance
7                                      Ptt                [51]     Final models were evaluated using the area under the
*Pte (Pan troglodytes ellioti).
                                                                   curve (AUC), which is a value widely used to measure
**Ptt (Pan troglodytes troglodytes).                               model performance [60,65,66]. In brief, AUC values were
Sesink Clee et al. BMC Evolutionary Biology (2015) 15:2 Page 11 of 13
created by comparing model performance to a random Climate change scenarios
model of associations between presence localities and The three different scenarios implemented in this study
environmental predicting factors [66]. AUC values range were A1B, A2A, and B2A (Additional file 5). The A1B
from 0.5 to 1.0; with values close to 0.5 corresponding to scenario describes an integrated or homogenous world
a model that is no better at predicting an ecological where economic growth is high and there is a balance
niche than a random model, and a value of 1.0 corre- between the use of fossil fuels and non-fossil fuels [32].
sponds to a model with a perfect fit. Values greater than The A2A scenario describes a heterogeneous world with
0.9 are ”very good”, 0.7-0.9 are “good”, and less than 0.7 a steadily increasing human population throughout the
are “uninformative” [28]. century. The B2A scenario describes a divided world
A jackknife test was also performed using Maxent to similar to the A2A scenario, but with each country or
evaluate the individual contribution of each environmen- region working independently to reduce their emissions
tal predicting factor to each model. In the jackknife test, and the human population is steadily increasing through-
the contribution of each factor is tracked while the out the century at a slower rate than the A2A scenario.
model is being created. Maxent does this by creating These three scenarios describe a range of possible results
models with one predicting factor removed at a time of climate change over the next century that may play a
and compares the jackknifed model gain to the gain role in the niche availability of chimpanzees in Cameroon
of the complete model with all environmental predic- and Nigeria.
tors included. The factors that reduce the overall gain
of the model when excluded become the most im- Preparation of data for future climate modeling
portant [53]. In order to model the distribution of these chimpanzee
populations in the future, the following are required: 1)
presence localities of chimpanzees in the present time,
ENM comparison testing 2) a set of environmental variables used to describe their
Pairwise niche comparisons were carried out in ENMtools habitat for the present time, and 3) a matching set of en-
[29] to compare the degree of niche overlap between vironmental variables for each year under each climate
ENMs for both the two- and three-population models. For scenario being explored. Since some measures of the en-
the three-population model, a round-robin comparison vironment cannot be predicted well using climate sce-
approach was implemented. For each comparison, two test narios, due to other factors such as human disturbance,
statistics were calculated to estimate the degree of niche the projected models of distribution for the chimpanzee
overlap: Schoener’s D [29] and the test statistic I, which populations were created using only the climatic and
was developed by Warren et al. [30]. Values of D and I are topographic factors summarized in Additional file 4. For
observed measurements of niche overlap that were used each scenario, bioclimatic files were created for each
in the following analysis. In an ecological sense, Schoener’s year being tested. In order to obtain the best mean
D assumes that the suitability scores produced by Maxent values for each scenario, bioclimatic files were created
are proportional to species abundance, whereas the test- for a number of global climate models (GCMs) and aver-
statistic I, treats the two ENMs as probability distributions aged for each scenario/year combination. The GCMs
[29]. The significance of the observed D and I test statis- used for each scenario were obtained from www.ccafs-
tics were evaluated in ENMtools by randomly partitioning climate.org [31]. For any given scenario created by a
a pooled set of occurrence data from two populations into GCM, minimum temperature (tmin), maximum tem-
two new datasets with the same number of occurrences as perature (tmax), and precipitation (prec) layers were ob-
the original two populations. ENMtools then used these tained. Next, these three files were used to create the set
two new pseudo-populations to create ENMs using the of 19 bioclimatic files following the methods of Ramirez-
Maxent algorithm. The D and I test statistics were then Villegas and Bueno-Cabrera [68]. This was performed
calculated to estimate the degree of overlap between the for each GCM for each climate scenario/year combin-
two new ENMs. A null distribution of values of D and I ation. Finally, environmental factors from each set of
was created from 100 random pseudo-populations created GCMs for a given scenario/year combination were aver-
using ENMtools. The observed values of D and I were aged using ArcMap 10 for use in Maxent.
then compared to the null distribution of D and I values
generated by random permutation. Significant deviations Maxent modeling procedure under future climate
of observed values from the null values indicate that the scenarios
niches occupied by the two populations under consider- Modeling population distribution under climate change
ation are divergent [29]. The observed overlap values were with Maxent is similar to modeling present distributions,
compared to their respective null distributions using a stu- and requires the same present occurrence coordinates
dent t-test in R [67]. and present environmental predictor variables [69-71].Sesink Clee et al. BMC Evolutionary Biology (2015) 15:2 Page 12 of 13
However, modeling future climate scenarios additionally References
requires a matching sets of environmental variables for 1. Groves CP. Primate Taxonomy. Washington, D.C: Smithsonian Institution; 2001.
2. Pan troglodytes. In: IUCN 2011. IUCN Red List of Threatened Species.
each time interval and climate scenario be specified for Version 2011.2 [www.iucnredlist.org]
all populations under consideration. Maxent models the 3. Gonder MK, Locatelli S, Ghobrial L, Mitchell MW, Kujawski JT, Lankester FJ,
probability distribution for the present variables, as et al. Evidence from Cameroon reveals differences in the genetic structure
and histories of chimpanzee populations. Proc Natl Acad Sci U S A.
usual, to build a set of criteria that describes suitable 2011;108(12):4766–71.
habitat for the present time, and then examines future 4. Bowden R, MacFie TS, Myers S, Hellenthal G, Nerrienet E, Bontrop RE, et al.
environmental variables for areas across the study area Genomic tools for evolution and conservation in the chimpanzee:
Pan troglodytes ellioti is a genetically distinct population. PLoS Genetics.
that best meet the species’ niche requirements. This ana- 2012;8(3):e1002504.
lysis was completed by averaging 100 randomly-seeded 5. Prado-Martinez J, Sudmant PH, Kidd JM, Li H, Kelley JL, Lorente-Galdos B,
replicates using the previously described cross-validation et al. Great ape genetic diversity and population history. Nature.
2013;499(7459):471–5.
technique. 6. Caldecott JO, Miles L, United Nations Environment Programme., World
Conservation Monitoring Centre. World Atlas of Great Apes and their
Additional files Conservation. Berkeley: University of California Press, in association with
UNEP-WCMC, Cambridge, UK; 2005.
7. Junker J, Blake S, Boesch C, Campbell G, Toit L, Duvall C, et al. Recent
Additional file 1: Maxent Jackknife Test Results. Results from Maxent decline in suitable environmental conditions for African great apes. Divers
jackknife tests for the average of 100 replicated runs for each population Distrib. 2012;18(11):1077–91.
showing the percent contribution of each environmental variable to 8. Simard F, Ayala D, Kamdem G, Pombi M, Etouna J, Ose K, et al. Ecological
each ENM. niche partitioning between Anopheles gambiae molecular forms in
Additional file 2: Testing Model Performance for Future ENMs. Cameroon: the ecological side of speciation. BMC Ecology. 2009;9(1):17.
Average AUC values for each ecological niche model (average of 100 9. Freedman AH, Thomassen HA, Buermann W, Smith TB. Genomic signals of
replicates for each climate scenario. diversification along ecological gradients in a tropical lizard. Mol Ecol.
2010;19(17):3773–88.
Additional file 3: Species Occurrence Map. Map of occurrence data
10. Smith TB, Thomassen HA, Freedman AH, Sehgal RNM, Buermann W,
for Pan troglodytes in Cameroon and Nigeria.
Saatchi S, et al. Patterns of divergence in the olive sunbird Cyanomitra
Additional file 4: Environmental Predicting Variables. Table of olivacea (Aves: Nectariniidae) across the African rainforest-savanna
environmental predicting variables used in ENMs. ecotone. Biol J Linn Soc Lond. 2011;103(4):821–35.
Additional file 5: Climate Scenario Aggregates. Table showing 11. Penlap EK, Matulla C, von Storch H, Kamga FM. Downscaling of GCM
organization of climatic variables for each included climate scenario. scenarios to assess precipitation changes in the little rainy season
(March-June) in Cameroon. Clim Res. 2004;26(2):85–96.
12. McClean CJ, Jon CL, Küper W, Hannah L, Sommer JH, Barthlott W, et al.
Competing interests African plant diversity and climate change. Annals of the Missouri Botanical
The authors declare that they have no competing interests. Garden. 2005;92(2):139-152.
13. Thuiller W, Broennimann O, Hughes G, Alkemade JRM, Midgley GF, Corsi F.
Authors’ contributions Vulnerability of African mammals to anthropogenic climate change
PRSC and MKG designed research; PRSC performed research; PRSC, EEA, RDA, under conservative land transformation assumptions. Glob Chang Biol.
NA, RF, SL, FM, MWM, BJM, AAP, and MKG collected data; PRSC and MKG 2006;12(3):424–40.
prepared manuscript. All authors read and approved the final manuscript. 14. Boko M, Niang I, Nyong A, Vogel C, Githeko A, Medany M, et al.
Contribution of Working Group II to the Fourth Assessment Report of
Acknowledgements the Intergovernmental Panel on Climate Change. Cambridge UK:
We thank the governments of Cameroon and Nigeria for permission to Cambridge University Press; 2007.
conduct this research. We thank the Zoological Society of San Diego, the 15. Beaumont LJ, Pitman A, Perkins S, Zimmermann NE, Yoccoz NG, Thuiller W.
Ebo Forest Research Project, Wildlife Conservation Society, and the World Impacts of climate change on the world’s most exceptional ecoregions.
Wildlife Fund for help with the facilitation of this research. We thank Jeremy Proc Natl Acad Sci U S A. 2011;108(6):2306–11.
Kirchman and George Robinson for helpful comments on early drafts of this 16. Oates JF, Bergl R, Linder J. Africa’s Gulf of Guinea Forests: Biodiversity
manuscript. National Science Foundation awards 0755823 and 1243524 Patterns and Conservation Priorities. Adv Appl Biodivers Sci. 2004;6:1–95.
(to MKG), funding from National Geographic (to AN), the Offield Family 17. Lehner B, Verdin K, Jarvis A. New global hydrography derived from
Foundation (to BJM), the USFWS Great Apes Conservation Fund (to BJM), the spaceborne elevation data. Eos. 2008;89(10):93–4.
Arcus Foundation (to BJM), and the University at Albany – State University of 18. Grubb P, Butynski TM, Oates JF, Bearder SK, Disotell TR, Groves CP, et al.
New York (to MKG) supported this work. Assessment of the Diversity of African Primates. Int J Primatol.
2003;24(6):1301.
Author details 19. Kingdon J. The Kingdon Field Guide to African Mammals. Princeton:
1 Princeton University Press; 2003.
Department of Biology, Drexel University, Philadelphia, PA 19104, USA.
2
Department of Biological Sciences, University at Albany – State University of 20. White F. The Vegetation of Africa. Paris: UNESCO; 1983.
New York, Albany, NY 12222, USA. 3Institute for Conservation Research, 21. Maisels F, Ambahe R, Ambassa E, Fotso R. New Northwestern Range Limit
Zoological Society of San Diego, Escondido, CA 92027, USA. 4Ebo Forest of the Northern Talapoin, Mbam et Djerem National Park, Cameroon.
Research Project, BP 3055, Messa, Yaoundé, Cameroon. 5Wildlife Conservation Primate Conservation. 2006;21:89-91.
Society – Cameroon, Yaoundé, Cameroon. 6Department of Biological 22. Moritz C, Patton JL, Schneider CJ, Smith TB. Diversification of rainforest
Sciences, University of New Orleans, New Orleans, LA 70148, USA. 7Institut de fauna: An integrated molecular approach. Annu Rev Ecol Syst.
Recherche pour le Développement (IRD) and Université Montpellier 1 (UM1), 2000;31(1):533–63.
Montpellier 34394, France. 8School of Natural Sciences, University of Stirling, 23. Van Rensburg BJ, Levin N, Kark S. Spatial congruence between ecotones
Stirling FK9 4LA, UK. 9Wildlife Conservation Society, Bronx, New York 10460, and range-restricted species: implications for conservation biogeography at
USA. the sub-continental scale. Divers Distrib. 2009;15(3):379–89.
24. Gagneux P, Gonder MK, Goldberg TL, Morin PA. Gene flow in wild chimpanzee
Received: 9 September 2014 Accepted: 15 December 2014 populations: what genetic data tell us about chimpanzee movement over space
and time. Philos Trans R Soc B. 2001;356(1410):889–97.Sesink Clee et al. BMC Evolutionary Biology (2015) 15:2 Page 13 of 13
25. Ghobrial L, Lankester F, Kiyang J, Akih A, de Vries S, Fotso R, et al. Tracing the 50. Van Heuverswyn F, Li Y, Bailes E, Neel C, Lafay B, Keele BF, et al. Genetic
origins of rescued chimpanzees reveals widespread chimpanzee hunting in diversity and phylogeographic clustering of SIVcpzPtt in wild chimpanzees
Cameroon. BMC Ecology. 2010;10(1):2. in Cameroon. Virology. 2007;368(1):155–71.
26. Gonder MK, Disotell TR, Oates JF. New genetic evidence on the evolution of 51. Neel C, Etienne L, Li Y, Takehisa J, Rudicell RS, Bass IN, et al. Molecular
chimpanzee populations, and implications for taxonomy. Int J Primatol. epidemiology of simian immunodeficiency virus infection in wild-living
2006;27(4):1103–27. gorillas. J Virol. 2010;84(3):1464–76.
27. Mitchell MW, Locatelli S, Ghobrial L, Pokempner A, Sesink Clee PR, Abwe E, 52. ESRI: ArcMap 10. In. Redlands, California: ESRI (Environmental Systems
et al: The population genetics of wild chimpanzees in Cameroon and Resource Institute); 2013.
Nigeria suggests a positive role for selection in driving the evolution of 53. Phillips SJ, Anderson RP, Schapire RE. Maximum entropy modeling of
chimpanzee subspecies. BMC Evolutionary Biology. In review. species geographic distributions. Ecol Model. 2006;190(3):231–59.
28. Baldwin R. Use of maximum entropy modeling in wildlife research. 54. Austin MP, Smith TM. A new model for the continuum concept. Vegetatio.
Entropy. 2009;11(4):854–66. 1989;83(1-2)35-47.
29. Warren DL, Glor RE, Turelli M. ENMTools: A toolbox for comparative studies 55. Hijmans RJ, Cameron SE, Parra JL, Jones PG, Jarvis A. Very high resolution
of environmental niche models. Ecography. 2010;33(3):607–11. interpolated climate surfaces for global land areas. Int J Climatol. 2005;25
30. Warren DL, Glor RE, Turelli M. Environmental niche equivalency versus (15):1965–78.
conservatism: quantitative approaches to niche evolution. Evolution. 56. Farr TG, Rosen PA, Caro E, Crippen R, Duren R, Hensley S, et al. The shuttle
2008;62(11):2868–83. radar topography mission. Reviews of Geophysics. 2007;45(2).
31. Ramirez J, Jarvis A. High resolution statistically downscaled future climate 57. DiMiceli CM, Carroll ML, Sohlberg RA, Huang C, Hansen MC, Townshend JRG.
surfaces. In. Cali, Columbia: International Center for Tropical Agriculture Annual global automated MODIS vegetation continuous fields (MOD44B) at 250
(CIAT); CGIAR Research Program on Climate Change, Agriculture and Food m spatial resolution for data years beginning day 65, 2000 - 2010, collection 5
Security (CCAFS); 2008. percent tree cover. USA: University of Maryland, College Park, MD; 2011.
32. IPCC - Intergovernmental Panel on Climate Change. Fourth Assessment 58. Dobson JE, Bright EA, Coleman PR, Durfee RC, Worley BA. LandScan: A
Report: Climate Change 2007: The Physical Science Basis. Summary for global population database for estimating populations at risk. Photogramm
Policy-Makers. Paris: Online Resources; 2007. Eng Remote Sensing. 2000;66(7):849–57.
33. Mitchell MW, Locatelli S, Sesink Clee PR, Thomassen HA, Gonder MK. 59. Harvey F. A primer of GIS: Fundamental geographic and cartographic
Environmental variation and rivers govern the structure of chimpanzee genetic concepts: Guilford Press; 2008.
diversity in a biodiversity hotspot. BMC Evolutionary Biology. In review. 60. Elith J, Graham CH, Anderson RP, Dudík M, Ferrier S, Guisan A, et al. Novel
34. Wang IJ, Bradburd GS. Isolation by environment. Mol Ecol. methods improve prediction of species’ distributions from occurrence data.
2014;23(23):5649–5662. Ecography. 2006;29:129–51.
35. Hirota M, Holmgren M, Van Nes EH, Scheffer M. Global resilience of tropical 61. Pearson RG, Raxworthy CJ, Nakamura M, Townsend Peterson A. ORIGINAL
forest and savanna to critical transitions. Science. 2011;334(6053):232–5. ARTICLE: Predicting species distributions from small numbers of occurrence
36. Thomas CD, Cameron A, Green RE, Bakkenes M, Beaumont LJ, records: a test case using cryptic geckos in Madagascar. J Biogeogr.
Collingham YC, et al. Extinction risk from climate change. Nature. 2007;34(1):102–17.
2004;427(6970):145–8. 62. Rodríguez-Soto C, Monroy-Vilchis O, Maiorano L, Boitani L, Faller JC,
37. Thompson I, Mackey B, McNulty S, Mosseler A. Forest resilience, biodiversity, Briones MÁ, et al. Predicting potential distribution of the jaguar
and climate change. In: A synthesis of the biodiversity/resilience/stability (Panthera onca) in Mexico: identification of priority areas for
relationship in forest ecosystems Secretariat of the Convention on Biological conservation. Divers Distrib. 2011;17(2):350–61.
Diversity, Montreal Technical Series. 2009. 63. Lv W, Li Z, Wu X, Ni W, Qv W. Maximum entropy niche-based modeling
38. Carnaval AC, Hickerson MJ, Haddad CFB, Rodrigues MT, Moritz C. Stability (Maxent) of potential geographical distributions of Lobesia botrana
predicts genetic diversity in the Brazilian Atlantic forest hotspot. Science. (Lepidoptera: Tortricidae) in China. In: Computer and Computing
2009;323(5915):785–9. Technologies in Agriculture V. Edited by Li D, Chen Y, vol. 370: Springer
39. Sinervo B, Mendez-De-La-Cruz F, Miles DB, Heulin B, Bastiaans E, Villagrán- Berlin Heidelberg; 2012: 239-246.
Santa Cruz M, et al. Erosion of lizard diversity by climate change and altered 64. Blair ME, Sterling EJ, Dusch M, Raxworthy CJ, Pearson RG. Ecological
thermal niches. Science. 2010;328(5980):894–9. divergence and speciation between lemur (Eulemur) sister species in
40. Erasmus BFN, Van Jaarsveld AS, Chown SL, Kshatriya M, Wessels KJ. Madagascar. J Evol Biol. 2013;26(8):1790–801.
Vulnerability of South African animal taxa to climate change. Glob Chang 65. Fielding AH, Bell JF. A review of methods for the assessment of prediction
Biol. 2002;8(7):679–93. errors in conservation presence/absence models. Environ Conservat.
1997;24(1):38–49.
41. Morgan B, Adeleke A, Bassey T, Bergl R, Dunn A, Fotso R, et al. Regional Action
66. DeLong ER, DeLong DM, Clarke-Pearson DL. Comparing the areas under
Plan for the Conservation of the Nigeria-Cameroon Chimpanzee (Pan troglodytes
two or more correlated receiver operating characteristic curves: A
ellioti). Gland, Switzerland and San Diego, CA, USA: IUCN/SSC Primate Specialist
nonparametric approach. Biometrics. 1988;44(3):837–45.
Group and Zoological Society of San Diego, CA, USA; 2011.
67. R Development Core Team: R: A language and environment for
42. Holt RD. The microevolutionary consequences of climate change. Trends
statistical computing. In. Vienna, Austria: R Foundation for Statistical
Ecol Evol. 1990;5(9):311–5.
Computing; 2010.
43. Moritz C, Agudo R. The future of species under climate change: resilience or
68. Ramirez-Villegas J, Bueno-Cabrera A: Working with climate data and niche
decline? Science. 2013;341(6145):504–8.
modeling: Creation of bioclimatic variables. International Center for Tropical
44. Smith JB. Setting priorities for adapting to climate change. Global Environ
Agriculture (CIAT), Cali, Columbia 2009.
Change. 1997;7(3):251–64.
69. Loarie SR, Carter BE, Hayhoe K, McMahon S, Moe R, Knight CA, et al.
45. Anderson RP. A framework for using niche models to estimate
Climate change and the future of California’s endemic flora. PLoS ONE.
impacts of climate change on species distributions. Ann N Y Acad Sci.
2008;3(6):e2502.
2013;1297(1):8–28.
70. Tingley MW, Monahan WB, Beissinger SR, Moritz C. Birds track their
46. Wiens JJ, Graham CH. Niche conservatism: integrating evolution, ecology, Grinnellian niche through a century of climate change. Proc Natl Acad
and conservation biology. Annual Review of Ecology, Evolution, and Sci U S A, 2009;106:19637-43.
Systematics. 2005;36:519-539. 71. Hof C, Araujo MB, Jetz W, Rahbek C. Additive threats from pathogens,
47. Wiens JJ, Ackerly DD, Allen AP, Anacker BL, Buckley LB, Cornell HV, et al. climate and land-use change for global amphibian diversity. Nature.
Niche conservatism as an emerging principle in ecology and conservation 2011;480(7378):516–9.
biology. Ecol Lett. 2010;13(10):1310–24.
48. Oates JF. Is the chimpanzee, Pan troglodytes, an endangered species? It
depends on what “endangered” means. Primates. 2006;47(1):102–12.
49. Keele BF, Van Heuverswyn F, Li Y, Bailes E, Takehisa J, Santiago ML, et al.
Chimpanzee reservoirs of pandemic and nonpandemic HIV-1. Science.
2006;313(5786):523–6.You can also read