Suffolk Strategic Assessment of Risk 2018- 2021 - Follow us
←
→
Page content transcription
If your browser does not render page correctly, please read the page content below
Suffolk
                     Fire and Rescue Service

 Suffolk Strategic
 Assessment of Risk
 2018- 2021
 A corporate tool for measuring and assessing risk within the Suffolk Fire and Rescue
 Service

Follow us

http://www.suffolk.gov.uk/emergency-and-rescue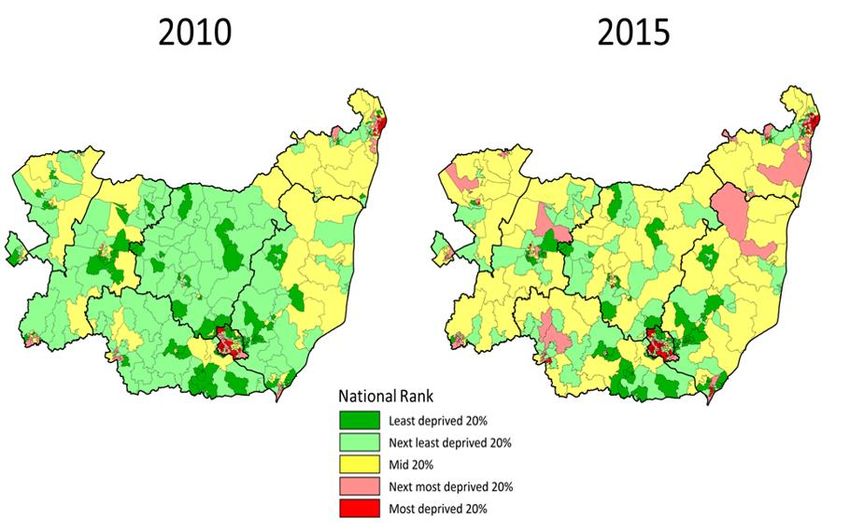
Contents
Introduction ...................................................................................................................................................... 1
Executive Summary ......................................................................................................................................... 2
Suffolk Fire and Rescue Service ..................................................................................................................... 3
Suffolk Resilience Forum (SRF) ........................................................................................................................ 7
Suffolk ................................................................................................................................................................ 7
Demographics ................................................................................................................................................. 8
   Ethnicity and Diversity ................................................................................................................................. 9
   Health .......................................................................................................................................................... 11
Housing............................................................................................................................................................ 14
   Overview of Housing in Suffolk ................................................................................................................. 14
   Listed Buildings............................................................................................................................................ 15
   Thatched Properties .................................................................................................................................. 15
   Blocks of Flats .............................................................................................................................................. 15
   Deprivation ................................................................................................................................................. 16
   Crime and Community Safety ................................................................................................................. 17
   Economy and Employment ..................................................................................................................... 18
   Daytime Population (Commuter Flows) and Visitors ............................................................................ 18
   Main Roads ................................................................................................................................................. 19
   Rail Networks .............................................................................................................................................. 20
   Airports, Air Bases and Military Presence ................................................................................................ 20
   The Port of Felixstowe ................................................................................................................................ 21
       Harwich International Port .................................................................................................................... 21
   Offshore Wind Farms.................................................................................................................................. 21
   Other Ports and Maritime.......................................................................................................................... 22
   Piers .............................................................................................................................................................. 22
   Other Key Tourism Areas ........................................................................................................................... 22
   Control of Major Accident Hazards (COMAH) Sites ............................................................................. 23
   Radiation (Emergency Preparedness and Public Information) (REPPIR) Sites .................................. 23
   Flooding and Severe Weather ................................................................................................................. 24
   Severe Summer weather .......................................................................................................................... 24
   Suffolk Lowland Search and Rescue....................................................................................................... 25
   Technology ................................................................................................................................................. 25
Changing Suffolk ........................................................................................................................................... 26
More Information ........................................................................................................................................... 28
References ..................................................................................................................................................... 29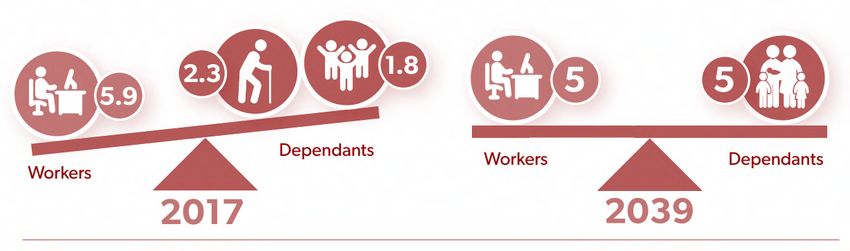
Introduction
The National Framework Document for the Fire and Rescue Service sets out the Government's
expectations for the Fire and Rescue Service; this Framework, together with the fire
service's statutory responsibilities, plays an important role in what our fire service does.
The National Framework notes new challenges that we need to be able to deal with. For
example: the continuing threat of terrorism, the impact of climate change, and the impacts of an
ageing population, against the need to cut the national deficit1.

The document notes the crucial role that fire and rescue services play in making our communities
safer, whether it be preventing and protecting people from fire and other risks, or responding
swiftly and effectively to the incidents and emergencies that occur2.

The report also notes the significant decreases in the number of fires over the last decade, an
indication that as a society we are becoming safer than ever from the risk and consequences of
fire2. However, at the same time the fire and rescue services have been responding to a growing
number of non-fire incidents. This is why collaboration should be at the heart of how services
operate. Services can work with, or on behalf of, local providers, to deliver a range of public
safety activity, to protect their local communities where it is in the interests of efficiency and
effectiveness for them to do so2.

In 2016 The Home Office outlined an ambitious programme of reform which is being delivered by
the fire and rescue sector to support continuous improvement, enable more accountability, and
continue to build of the successes achieved in prevention and collaboration.

The National Fire Chiefs’ Council (NFCC) is the leading professional and technical voice of UK fire
and rescue services and is committed to supporting their development to ensure the best possible
outcomes for their communities. NFCC have developed and published their strategy for 2017-
2020.

One element of the strategy is to develop a toolkit of best practice to support fire and rescue
services to assess community risk. This risk may impact directly or indirectly on services and informs
the development of Integrated Risk Management Plans (IRMP). This work with fire and rescue
services is to ensure that community risk assessments:

   •   Align to a national definition of risk
   •   Support the development of risk assessment methodology that allows a consistent risk-
       based approach to community risk management planning
   •   Enable UK fire and rescue services to focus resources on activities where they will have the
       greatest impact on reducing risk and vulnerability within their communities

                                                                                                         1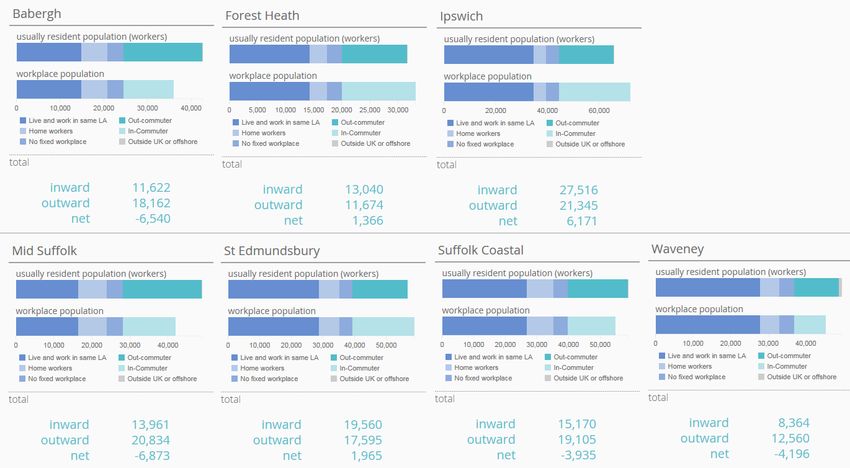
Executive Summary
“Every fire and rescue authority must assess all foreseeable fire and rescue related
risks that could affect their communities, whether they are local, cross-border,
multi-authority and/or national in nature from fires to terrorist attacks. Regard must
be had to Community Risk Registers produced by Local Resilience Forums and
any other local risk analyses as appropriate” 2.
“Fire and rescue authorities must put in place arrangements to prevent and
mitigate these risks, either through adjusting existing provision, effective
collaboration and partnership working, or building new capability. Fire and rescue
authorities should work through the Strategic Resilience Board where appropriate
when determining what arrangements to put in place” 2.
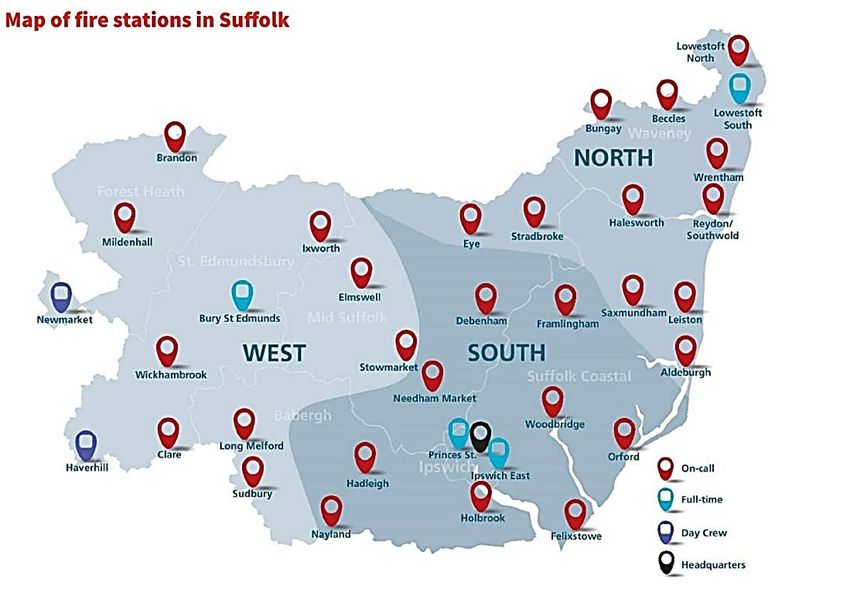
• We run 35 fire stations made up of 4 wholetime stations, 29 on-call stations and 2 day-
crewed stations. Together these serve the population of Suffolk, which is estimated to
number approximately 757,000 people. There were 4,917 emergency service incidents in
2017/18.
• Suffolk is a large county covering approximately 1,466 square miles, mainly comprised of
low-lying arable land with the wetlands of the Broads in the North East, the Suffolk Coast
and Heaths Area of Outstanding Natural Beauty in the East, and the sandy heathlands of
Breckland in the North West.
• Suffolk has a mix of vibrant market towns and includes Britain’s biggest and busiest seaport
in Felixstowe. It is served by two international airports located outside the county, and has
many road and rail network links.
• Suffolk is made up of seven districts and boroughs; Ipswich has the highest population with
138,500 residents, Forest Heath has the lowest population (65,500 residents). Suffolk has a
higher percentage of adults in the older age groups compared to national figures.
• The Suffolk Resilience Forum (SRF) is a multi-agency group that provides strategic / tactical
and operational guidance and support on the planning for the multi-agency response to a
major incident. A number of different agencies and organisations come together to create
the Suffolk Resilience Forum, which has the common aim of ensuring that Suffolk is
prepared for emergencies. This includes Suffolk Fire and Rescue Service, as a category 1
responder3.
• Life expectancy at birth in Suffolk for both males and females is significantly higher
compared to England. There is, however, variation within the districts and boroughs in
Suffolk.
• 2017 Annual Population Survey (APS) data indicates that 13.9% of the adult population in
Suffolk smoke, a similar proportion to both the East of England (14.2) and England (14.9%).
However, for those in routine and manual occupations the smoking prevalence rises to
23.6% in Suffolk, compared to 24.0% for the East of England and 25.7% for England.
• During 2014-2016, 756 Suffolk residents were killed or seriously injured (KSI) on the County’s
roads. No districts or boroughs in Suffolk had statistically significantly worse rates compared
to national data.
Specific risks:
• Some properties such as thatched and heritage properties in Suffolk have a higher risk of
fire and vulnerability compared to others.
• The highest occupied block of flats in the county is Ipswich Central (Formally St Francis
Court) in Ipswich, the only Suffolk high-rise block outside Ipswich is St Peter’s Court in
Lowestoft4.
2• The Suffolk road network totals approximately 4,360 miles, of which 200 miles is managed by
Highways England, the rest is Suffolk County Council’s responsibility. 70,000 vehicles cross
the Orwell bridge daily, it is the busiest route in Suffolk.
• The Port of Felixstowe is the biggest and busiest container port in Great Britain, as well as
one of the largest in Europe.
• There are four Control of Major Accident Hazards (COMAH) sites in Suffolk (in Haverhill,
Stowmarket, Risby and Bury St Edmunds), and one Radiation Emergency Preparedness and
Public Information (REPPIR) site, (the Sizewell B Nuclear Power Station near Leiston).
• Suffolk is subject to flooding from the sea, rivers, rain and ground water. Coastal, surface
water and fluvial flooding are assessed as a MEDIUM risk in Suffolk on the Community Risk
Register. The National Risk Assessment for East Coast Flooding still shows the risk to be Very
High but after the recent tidal flooding events of 2007 and 2013, the Suffolk Resilience
Forum partners have reduced the risk in Suffolk to reflect the actual flooding experienced.
Future demand:
• The population of Suffolk is expected to increase to 785,000 by 2025 and 831,500 by 2041.
• Over the next twenty years there is likely to be a large change in the population of Suffolk,
specifically the age of the resident population.
• Suffolk is expected to see a shift from approximately 1 in 5 residents age 65+ to 1 in 3.
• Proposals for another nuclear power station in Suffolk have been published. The Service will
continue to review the impact and potential increased risk associated with a major
development, associated vehicle movements and increase in the number of workers.
• The county has experienced an increase in the number and frequency of extreme weather
events. Our future response plans must ensure we are able to respond to such incidents,
develop new technologies and maintain operational cover arrangements.
Suffolk Fire and Rescue Service
The primary role of Suffolk Fire and Rescue Service (SFRS) is to deliver effective prevention,
protection and emergency response services. We provide emergency services to the
communities of Suffolk and its visitors 24 hours a day, 7 days a week. We have an established
reputation locally, regionally and nationally for being a low-cost, well-performing service. We
have remained one of the most cost-efficient services in the country through continuously
reviewing what is done and how it is done.
The Suffolk Fire and Rescue Service Plan 2018-2021 summarises progress made during the past
year and sets out priorities for forthcoming years. Although risks in our community will continue to
change and evolve, this document provides an evidence based overview of Suffolk. This
document will be a key document for SFRS, informing the SFRS Service Plan and Integrated Risk
Management Plan (IRMP).
Our plans for 2018-2021 build on this reputation by delivering a range of work against each of our
priorities which support our ambition of Suffolk being 'a place where people live safe and fulfilling
lives'. The Suffolk County Council Priorities and Business Plan were agreed through the
administration in 2017/18, and set out 3 priorities for Suffolk for the next 4 years:
1. Inclusive growth – Suffolk needs to improve its economic productivity, level of educational
attainment, and build more homes- ensuring that everyone benefits, including people who are
vulnerable and facing disadvantage.
2. Health, care and wellbeing – Caring for Suffolk’s vulnerable residents, enabling everyone to live
long, healthy and fulfilling lives. Thriving families and communities and thriving economies support
each other.
33. Efficient and effective public services – At a time of diminishing resources, increasing demand
and changing customer expectations, we need to change the way we operate to meet our
customers’ needs and balance our budget.
These priorities and business plan have informed our Service Plan and all three form part of the
golden thread that runs through our Service and supports the outcomes we want to achieve.
WE RUN 35 FIRE STATIONS MADE UP OF 4 WHOLETIME STATIONS , 29
ON-CALL STATIONS AND 2 DAY-CREWED STATIONS
Source: 5
As at October 2018:
Source: 6, 7
4Types of Emergency, Service Incidents as at Oct 2018: Average (Avg) Time for First Fire
Engine to Arrive, Suffolk:
There are no nationally specified
standards for fire services to respond
to emergencies. Suffolk endeavours
to meet our locally agreed
standards on 80% of occasions.
Response Standards (RS):
Fire Fatalities and Casualties:
Did you know?
You can view live incidents fire and rescue
incidents for Suffolk here:
https://frsincidents.suffolk.gov.uk
Source: 6
5Fire statistics table 0102: Incidents attended by Suffolk fire and rescue services, by incident type8:
Primary fires are defined as fires that
meet at least one of the following
conditions:
(a) any fire that occurred in a (non-
derelict) building, vehicle or outdoor
structure,
(b) any fire involving fatalities,
(c) any fire attended by five or more
pumping appliances.
Non-fire incidents can also be known
as Special Service incidents.
Fire statistics table 0901: Non-fire incidents attended, by type of incident, Suffolk fire and rescue
authority8:
6Suffolk Resilience Forum (SRF)
A lot of the information in the rest of this document links to pages from the Suffolk Resilience Forum
(SRF). The SRF is a multi-agency group that provides strategic / tactical and operational guidance
and support on the planning for the multi-agency response to a major incident. The SRF is
the principal mechanism for multi-agency cooperation under the Civil Contingencies Act, 2004
and its boundaries are based on local policing boundaries3.
A number of different agencies and organisations come together to create the Suffolk Resilience
Forum, which has the common aim of ensuring that Suffolk is prepared for emergencies. This
includes SFRS, as a category 1 responder3.
The Suffolk Resilience Forum has produced a number of emergency plans to assist in the response
to incidents within the county of Suffolk. These plans correspond to risk areas that can be found on
the Suffolk Community Risk Register. For further information on the risks in Suffolk visit their website:
www.suffolkresilience.com/community-risk-register/ 3.
Suffolk
Suffolk is a large county covering approximately 1,466 square miles, mainly comprised of low-lying
arable land with the wetlands of the Broads in the North East, the Suffolk Coast and Heaths Area
of Outstanding Natural Beauty in the East, and the sandy heathlands of Breckland in the North
West. Suffolk has a mix of vibrant market towns and includes Britain’s biggest and busiest seaport
in Felixstowe. It is served by two international airports located outside the county, and has many
road and rail network links9.
Over 36% of Suffolk is either nationally or locally protected for its wildlife or landscape value. The
Dedham Vale and Suffolk Coast and Heaths Areas of Outstanding Natural Beauty (AONBs) and
the Norfolk and Suffolk Broads, are places in which the quality of landscape is formally recognised
and given special statutory status to conserve and enhance natural beauty, and in the case of
The Broads, an additional duty to promote open-air recreation9.
Suffolk is made up of 7 District and Borough Councils:
• Babergh District Council
• Forest Heath District Council
• Ipswich Borough Council
• Mid Suffolk District Council
• St Edmundsbury Borough Council
• Suffolk Coastal District Council
• Waveney District Council
Please note from April 2019, Forest Health and St Edmundsbury will formally merge to become
West Suffolk Council, and Suffolk Coastal and Waveney will formally merge to become East Suffolk
Council.
7Demographics
The 2017 mid-year estimate Suffolk population was 756,97810. The population has increased by
3.7% since 2011. Population forecasts indicate that between 2017 and 2039 the population is
expected to increase 9.3%, to 828,80011. In 2017 there were 7,674 live births in Suffolk12.
Suffolk is made up of seven districts and boroughs; Ipswich has the highest population with 138,500
residents, Forest Heath has the lowest population (65,500 residents). Suffolk has a higher
percentage of adults in the older age groups compared to national figures.
Local authority population estimates, 201710:
Males Females Total
Babergh 44,258 46,536 90,794
Forest Heath 33,149 32,374 65,523
Ipswich 69,431 69,049 138,480
Mid Suffolk 50,284 51,259 101,543
St Edmundsbury 57,010 56,715 113,725
Suffolk Coastal 63,017 65,999 129,016
Waveney 57,154 60,743 117,897
Suffolk population by age group, 201710:
90+
85 to 89
80 to 84
75 to 79
70 to 74
65 to 69
60 to 64
55 to 59
50 to 54
45 to 49
40 to 44
35 to 39
30 to 34
25 to 29
20 to 24
15 to 19
10 to 14
5 to 9
0 to 4
5% 4% 3% 2% 1% 0% 1% 2% 3% 4%
England and Wales Females England and Wales Males Suffolk Females Suffolk Males
82017 population estimates indicate approximately 168,100 Suffolk residents are aged between 0
and 19 years, making up 22.2% of the total population, slightly below the figure for England and
Wales (23.6%). 22.9% of Suffolk residents are aged 65 and over. Population forecasts suggest that
this proportion is set to increase to 26.9% by 2028 and 31.2% by 2040. In addition, the proportion of
the population over the age of 85 is set to rise in the same period from 3.2% to 4.2%, then 6.4%.
There is a great deal of variation around the county in terms of age, with some local authorities
having higher or lower proportions of each age group, compared to figures for the county overall.
Those aged over 65 years comprise over 20% of the total population in five of the local authorities,
but less than 20% in Forest Heath (17.8%) and Ipswich (16.2%). These authorities have higher
proportions of their populations in the 0 -15 age group.
Residents by age band for local authorities in Suffolk, 2017:
Age 0-14 Age 15-29 Age 30 -44 Age 45 -64 Age 65+ Total
Babergh 14,468 12,987 13,770 26,288 23,281 90,794
Forest Heath 13,015 13,745 12,501 14,588 11,674 65,523
Ipswich 26,397 26,712 29,434 33,517 22,420 138,480
Mid Suffolk 16,229 15,048 16,315 29,555 24,396 101,543
St
19,385 18,356 20,794 29,969 25,221 113,725
Edmundsbury
Suffolk
20,088 17,775 18,808 37,504 34,841 129,016
Coastal
Waveney 19,014 18,162 17,900 31,488 31,333 117,897
Suffolk 128,596 122,785 129,522 202,909 173,166 756,978
Proportion of total local authority population by age band in Suffolk, 2017:
Age 45
Age 0-14 Age 15-29 Age 30 -44 Age 65+
-64
Babergh 15.9% 14.3% 15.2% 29.0% 25.6%
Forest Heath 19.9% 21.0% 19.1% 22.3% 17.8%
Ipswich 19.1% 19.3% 21.3% 24.2% 16.2%
Mid Suffolk 16.0% 14.8% 16.1% 29.1% 24.0%
St
17.0% 16.1% 18.3% 26.4% 22.2%
Edmundsbury
Suffolk Coastal 15.6% 13.8% 14.6% 29.1% 27.0%
Waveney 16.1% 15.4% 15.2% 26.7% 26.6%
Suffolk 17.0% 16.2% 17.1% 26.8% 22.9%
Ethnicity and Diversity
Ethnicity
At the time of the last Census in 2011, 95.2% of the resident population in Suffolk identified
themselves as White, around 5% above the rate for England and 10% higher than the East of
England. Suffolk has lower percentages of the other ethnic groups compared to national figures.
All local authorities within Suffolk have higher percentages of White residents compared to the
county overall, except Forest Heath and Ipswich. Forest Heath is more ethnically diverse, largely
due to the presence of American airbases at Mildenhall and Lakenheath.
9Ethnicity by area in Suffolk, 201113:
% Usual residents
White Mixed Asian ethnic Black ethnic Other
ethnicity ethnicity groups groups ethnicities
Babergh 97.8% 0.9% 0.8% 0.3% 0.2%
Forest Heath 91.9% 2.9% 2.1% 2.2% 0.9%
Ipswich 88.9% 3.6% 4.3% 2.3% 0.9%
Mid Suffolk 97.9% 1.0% 0.7% 0.4% 0.1%
St Edmundsbury 96.0% 1.3% 1.6% 0.8% 0.2%
Suffolk Coastal 96.5% 1.2% 1.6% 0.5% 0.2%
Waveney 97.7% 1.1% 0.8% 0.3% 0.1%
Suffolk 95.2% 1.7% 1.8% 0.9% 0.3%
East of England 90.8% 1.9% 4.8% 2.0% 0.5%
England 85.4% 2.3% 7.8% 3.5% 1.0%
Migration:
ONS figures for mid-2016 to mid-2017 show a decline in international migration to Suffolk
compared to previous years (numbers of individuals). International migration in to Suffolk was
3,326, and international migration out of Suffolk was 2,473. Since 2011, there have been 19,399
international in-migrants and 13,463 international out-migrants; making net international migration
since 2011 5,936 people14.
International migration rates remain below the rates for both the East of England and England.
Data for the same period shows that the rate of non-British nationals in Suffolk was 72.2 per 1,000
population, lower than the figure for England (101.5 per 1,000 population)15.
Data from the Local Area Migration Indicators tool shows that the proportion of live births in Suffolk
to mothers born outside the United Kingdom increased from 13.9% in 2005 to 20.3% in 2016/1715.
The number of non-UK born residents in Suffolk increased from 44,000 (6.4% of the total population)
in 2005, to 74,000 (9.0% of the population) in 2016. However, in 2017 there was a decrease in
number compared to 2016 (66,00 in 2017).
Gypsy and Traveller populations:
Gypsy and Traveller populations were counted at the 2011 Census for Suffolk. They numbered 604
(0.1%) people in Suffolk, however, this figure is likely to be too low. Estimates suggest there are
about 1,500 Gypsies and Travellers living in Suffolk in either trailers or houses based on an average
of four persons per unit16. Across Suffolk there are a number of council and privately-owned Gypsy
and Traveller sites.
The Roma community come from Central and Eastern Europe and recently arrived in the UK,
mostly after 2004. An estimate from the Roma community suggests there are about 1,000
Romanian Roma and 100 Bulgarian Roma living in Ipswich16.
Department for Education data for January 2017 indicates 0.4% of all school pupils in Suffolk are of
Gypsy/ Roma or Traveller of Irish Heritage, however this is still a relatively small number (352 pupils).
The proportions are similar to England levels.
10Health
Life expectancy
Life expectancy at birth in Suffolk for both males and females is significantly higher compared to
England. There is, however, variation within the districts and boroughs in Suffolk.
Life expectancy at birth in years for 2014-201617:
Males Females
Babergh 81.5 84.2
Forest Heath 80.6 83.5
Ipswich 79.4 83.2
Mid Suffolk 81.9 85.3
St Edmundsbury 81.6 84.7
Suffolk Coastal 81.8 84.7
Waveney 79.0 83.3
Suffolk 80.8 84.2
England 79.5 83.1
Benchmark = England
Smoking
2017 Annual Population Survey (APS) data indicates that 13.9% of the adult population in Suffolk
smoke, a similar proportion to both the East of England (14.2%) and England (14.9%)17. However,
for those in routine and manual occupations the smoking prevalence rises to 23.6% in Suffolk,
compared to 24.0% for the East of England and 25.7% for England.
11Smoking prevalence in local authorities in Suffolk (APS), 201717:
45
40
35
30
25
%
20
15
10
5
0
Babergh Forest Heath Ipswich Mid Suffolk St Suffolk Coastal Waveney
Edmundsbury
Smoking Prevalence
Smoking Prevalence in Routine and Manual Occupations
Suffolk Smoking Prevalence
Suffolk Smoking Prevalence in Routine and Manual Occupations
Between 2015-17, 3,405 deaths were attributable to smoking, equating to approximately 3 deaths
every day. In 2016/17 there were 7,652 smoking attributable hospital admissions18. 2014/15 data
indicates that 8.6% of 15 year olds in Suffolk were current smokers, and 17.6% of 15 year olds used
or had tried e-cigarettes18.
Mental health
One in four Suffolk residents experience some form of mental ill health across a spectrum of
severity levels in any given year19.
Depression is a common and debilitating condition. Figures for 2017/18 indicate that around 10.5%
people aged 18 and over in Suffolk have been recognised by their GP as having depression
(nearly 65,800 people).
Approximately 1% of the population will be affected by severe mental ill health. 2017/18 data
indicates that 6,858 people registered at a Suffolk GP and were diagnosed with schizophrenia,
bipolar disorder or other psychoses (approximately 0.9% prevalence rate)20.
Suicide
There were 174 deaths from suicide between 2015-2017 in Suffolk, the majority being men (136),
although the age standardised suicide rate per 100,000 people is not significantly different from
regional and national averages20.
Killed or seriously injured on the roads
During 2014-2016, 756 Suffolk residents were killed or seriously injured (KSI) on the County’s roads.
No districts or boroughs in Suffolk had statistically significantly worse rates compared to national
data. Longer term trend data indicates that less people are getting killed or seriously injured on
Suffolk roads, with a fall in rate from 45.5 per 100,000 population in 2009-2011 to 34.0 per 100,000
population in 2014-2016.
12Rate of people killed or seriously injured on the roads, all ages, per 100,000 resident population,
2014-201617:
50
45
Rate per 100,000 resident
40
35
population
30
25
20
15
10
5
0
Babergh Forest Heath Ipswich Mid Suffolk St. Edmundsbury Suffolk Coastal Waveney
Suffolk England
Benchmark = England
Falls
As people become older, they become increasingly likely to fall. About 1 in 3 people aged over
65, and 1 in 2 people aged over 80 will fall at least once a year21. Women are more likely to fall
than men. Falls can cause serious physical injury, for example, a fractured hip, and they can also
make people fearful and anxious, resulting in activity restriction and loss of their independence21.
In 2016/17 in Suffolk there were 3,063 emergency hospital admissions for injuries due to falls in
persons aged 65+, this equates to 8 admissions per day. 71% of these admissions were for people
aged 80+. Suffolk has a lower rate of falls compared to the East of England and England overall.
None of the local authorities in Suffolk had a significantly higher rate of emergency admissions
due to falls (aged 65+) compared to England.
Drug and alcohol misuse
Prevalence estimates for 2014/15 (latest available) suggest there are 2,851 opiate and/or crack
cocaine users resident in Suffolk, giving an estimated prevalence rate of 6.3 per 1,000
population22. Not all of these individuals will be in substance misuse treatment services, and many
will be unknown to treatment services19.
Alcohol and related disease
Although many people consume alcohol without damaging their health21, excessive consumption
can cause severe physical and mental health conditions. 2014/15 data estimates that there are
6,571 alcohol dependent adults in Suffolk22.
Rates of hospital admissions for alcohol and other substance misuse are lower in Suffolk than
regionally or nationally. However 2016/17 data indicates that 14,527 people in Suffolk had an
alcohol related hospital admission (broad definition)23. These are admissions to hospital where the
primary diagnosis or any of the secondary diagnoses are an alcohol-attributable code.
Suffolk has a significantly similar rate to England for Years of Life Lost (YLL) due to alcohol-related
conditions - 537 per 100,000 of population compared to the average in England of 626 per
100,000. Suffolk rates of admissions related to alcohol are generally lower than the East of England
and England24.
13Housing
Some properties in Suffolk have a higher risk of fire and vulnerability compared to others. The
following section provides an overview of buildings that may exhibit higher risk in relation to fire.
Overview of Housing in Suffolk
There were an estimated 339,690 dwellings in Suffolk
in 201725, 85% privately owned, 9% owned by
Housing Associations and 6% owned by local
authorities.
The current housing stock in Suffolk is predominantly
old and inefficient to heat. Mains gas is the primary
fuel in 65% of homes, electricity in 16% and oil in
15%26.
The most common heating system (61%) is a gas
fired boiler and radiator system; 13% of properties
are heated using an oil boiler and radiators; 11% are
heated using electric storage heaters26.
The level of fuel poverty in Suffolk dropped from
11.4% to 9.1% in the last five years. However, most
recent data (2016) indicates an increase in the
proportion of households in fuel poverty (to 10.4%).
This equates to nearly 34,000 households in Suffolk
who experience fuel poverty and therefore are at
risk of the (potentially severe) health impacts of living
in a cold home. There are an estimated 10,687
properties in Suffolk which do not meet the Decent
Home Standard under the ‘Housing, Health and
Safety’ rating because they are excessively cold.
An estimated 6,000 over 75’s who need specialist
housing (defined as sheltered, extra care, residential
care, or nursing care) have difficulties accessing that
housing provision in Suffolk currently. As Suffolk’s
population ages, these needs are likely to increase.
14Listed Buildings
Services relating to conservation areas and the conservation of historic buildings are provided
by district and borough councils in Suffolk. Please log on to the Planning Portal for more
information.
The Suffolk Register of Buildings at Risk provides details of listed buildings known to be at
risk through neglect and decay, or vulnerable to becoming so. View the following website for
more information: https://www.suffolk.gov.uk/planning-waste-and-environment/buildings-in-
suffolk/buildings-at-risk-in-suffolk/
Thatched Properties
Due to the history and heritage of Suffolk, there are many thatched properties in the county.
Thatched properties have their own special fire safety issues. A thatched roof is always at risk from
fire, and once a fire has taken hold it will spread rapidly. The commonest cause of a thatched
roof fire is heat transfer from a chimney. SFRS offers fire safety advice regarding thatched
properties.
Need more information?
https://preview.tinyurl.com/SuffolkThatched
https://www.suffolk.gov.uk/assets/suffolk.gov.uk/Emergency%20and%20Safety/Fire%20and%2
0Rescue/Community%20Safety/2012_04_16%20Thatched%20Property%20Guide%20A5%20Boo
klet%20LowRes.pdf
Blocks of Flats
2011 Census data for unshared dwellings indicates that there were 28,658 households in Suffolk in
blocks of flats or tenements, representing 9% of total unshared dwellings, a much lower proportion
than for England as a whole. 16% of households England resided in unshared purpose-built blocks
of flats or tenements (as a proportion of all unshared dwellings).
Data from the Home Office Incident Recording System indicates that there were 2 dwelling fires, in
high rise buildings, attended by SFRS in 2017/18, trend data indicates this number has remained
very low (between 1-3 attendances per year from 2009/10-2017/18)27.
The highest occupied block of flats in the county is St Francis Court in Ipswich, it was built in 1962
and was extensively refurbished 12 years ago4. Ipswich has several high-rise flats, but the tallest
block, The Mill on the Waterfront, has never been completed or occupied. The only Suffolk high-
rise block outside Ipswich is St Peter’s Court in Lowestoft4.
Information for residents about evacuating in the event of a flat fire can be found below:
https://www.suffolk.gov.uk/suffolk-fire-and-rescue-service/suffolk-fire-and-rescue-faqs/
15Deprivation
The English Indices of Deprivation measure relative levels of deprivation in 32,844 small
geographical neighbourhoods, called Lower-layer Super Output Areas (LSOAs), in England. It is
important to note that these statistics are a measure of relative deprivation, not affluence, and to
recognise that not every person in a highly deprived area will themselves be deprived. Likewise,
there will be some deprived people living in the least deprived areas28.
Suffolk has become relatively more deprived compared to other local authority areas in England
since 2010. Only three counties/unitary authorities worsened by more places (in terms of rankings)
than Suffolk. However, Suffolk continues to experience below average levels of deprivation.
Deprivation by LSOAs in Suffolk Comparative IMD distribution in 2010 and 201528.:
The impact of rurality and deprivation29:
Despite these relatively low levels of overall rural deprivation in Suffolk, small distinct pockets of
rural deprivation exist; these can be hidden by the Indices of Multiple Deprivation being
calculated at LSOA level.
Suffolk’s rural population is older than its urban population, and the proportion of older people in
Suffolk’s rural population is increasing faster than the proportion of older people in urban areas.
This trend, combined with the higher cost of providing services in rural areas, housing stock which
is often difficult to heat and maintain, poor transport, and more limited social networks, is likely to
lead to high and increasing needs and costs for Suffolk’s rural population now and in the future.
Child poverty
In 2015, child poverty in Suffolk affected 13.6% of children under the age of 16 - nearly 17,000
children. This is significantly lower than the figure for England (16.8%). Recent trend data indicates
that the proportion of children in poverty in Suffolk has fallen (2009-2015 data). At local authority
level, Ipswich has a significantly higher proportion of children in poverty (17.8%), as does Waveney
(19.9%), when compared to the England percentage.
16Crime and Community Safety
Crime rates in Suffolk are generally lower compared to regional and national averages. However,
54,204 crime cases were recorded from November 2017-October 201830. The most commonly
reported crimes were violence and sexual offences, and antisocial behaviour. This mirrors regional
and national statistics. Over the same period the three wards with the highest crime rate per
1,000 population were: Alexandra ward in central Ipswich (386.8), Harbour ward in Lowestoft
(228.0) and Abbeygate ward in St Edmundsbury (191.9) 30.
Total crime rate (per 1,000 population) December 2015-November 201730:
Safer Neighbourhood Teams work closely with partner agencies to address issues identified as
priorities by the local community. Safer Neighbourhood Teams deliver a truly local policing style –
local people working with local police and partners, to identify and deal with issues of concern in
their neighbourhood.
The Suffolk Police and Crime Commissioner's Police and Crime Plan 2017-2021 sets out strategic
priorities for policing and how local resources will be managed to deliver the best possible policing
service to our communities in Suffolk.
Need more information?
Crime data is available on the Suffolk Observatory:
www.suffolkobservatory.info/crime-and-community-safety
https://www.suffolk.gov.uk/community-and-safety/crime-and-public-safety/
https://www.suffolk.police.uk/
17Economy and Employment
A very high proportion of Suffolk’s working age residents work. Suffolk has a history of high levels of
employment, and has maintained this even through the economic downturn since 2008/931. Data
from July 2017-June 2018 indicates that 81.6% of Suffolk residents aged 16-64 were economically
active, compared to 81.1% in the East of England, and 78.4% in Great Britain32.
For a proportion of Suffolk residents the outlook is more challenging. 2017 data indicates that there
are 32,700 workless households in Suffolk32. Rising house prices, a paucity of high paid
employment, rural isolation and deprivation, and unemployment, all contribute to a challenging
living environment. In-work poverty is also a key issue in Suffolk31.
As shown below, Suffolk residents earn roughly £53 less per week compared to their East of
England counterparts32. 2017 data indicates that the proportion of Suffolk residents with ‘no
qualifications’ is 7.5% higher than the East of England 7.2%, but lower than Great Britain 7.7%.
Suffolk has a lower proportion of residents qualified to degree level and above -32.2% compared
to 34.7% in the East of England and 38.6% for Great Britain32.
Earnings by residence32:
Need more information?
www.nomisweb.co.uk
www.suffolkobservatory.info/economy-employment
Daytime Population (Commuter Flows) and Visitors
2011 Census data for Suffolk local authorities indicates that Ipswich has the highest net commuter
inflow, increasing the overall population size during the working hours. Mid Suffolk has the highest
net commuter outflow, resulting in a decreased working hours population.
As well as workday movement, research by Visit England and Office of National Statistics
estimated that in 2011 there were a total number of 31,228,000 day visitors to Suffolk. In 2010, there
were 1,787,000 staying visitors in Suffolk, staying a total of 6,525,000 nights. The total number of day
visitors was 24,808,37533.
18Local authority commuter flow data, Suffolk, 2011
Source: 34
Main Roads
The Suffolk road network totals approximately 4,360 miles, of which 200 miles is
managed by Highways England, the rest is Suffolk County Council’s responsibility.
This includes the A14, that links the port of Felixstowe, to the Midlands. As the Port
of Felixstowe is the largest container port in Great Britain, this link is of strategic
importance. The other strategically import link is the A12 linking Great Yarmouth
to London. Both of these links bypass Ipswich, via the south. The Orwell bridge is
a key link - with 70,000 vehicles crossing the bridge daily, it is the busiest route in
Suffolk.
The strategic lorry network gives the preferred links for lorries for haulage and distribution. It
identifies not only the preferred routes within the county, but those same routes also interconnect
to adjacent counties. Interconnecting with Cambridgeshire we have the A14 (Newmarket) and
A11 (Red lodge). Interconnecting to Essex is the A12 (Stratford St Mary), A137 (Brantham), A131
(Sudbury) and A134 (Nayland). With Norfolk we have A11 (Elveden), A146 (Beccles), A140
(Stuston), A134 (Barnham), A1065 (Brandon) and the A1101 (Beck Row).
Over 80% of households own at least one car, with 35% owning two or more. Our roads are
relatively safe; between 2001 and 2008 there was a 13.5% reduction in road casualties, from 3,250
to 2,810, and a 20% reduction in fatal and seriously injured cases. From 2015 to 2016 we saw a
reduction in fatalities of 12% from 33 to 29.
Need more information?
More information about Suffolk’s policy, strategy and plans for maintaining highways
assets in Suffolk can be found here:
https://www.suffolk.gov.uk/roads-and-transport/highway-maintenance/highway-asset-
management/
19Rail Networks
Although major railway incidents in the UK are rare, they place significant
demands on local fire and rescue services and often require resources and
support from other fire and rescue services and emergency responders.
Additionally, smaller scale incidents involving railways are more prevalent35.
The Fire and Rescue Service Operational Guidance – Railway Incidents
provides guidance that can be adapted to the nature, scale and
requirements of the incident.
Passenger Train Services in Suffolk are provided by Greater Anglia. These passenger services run
along the Great Eastern Main Line (GEML) between London Liverpool Street and Norwich, in
addition to the East Suffolk Line (Ipswich to Lowestoft and Felixstowe), and the West Suffolk Line
(Ipswich to Cambridge/ Ely via Bury St Edmunds). The GEML is electrified (25Kva overhead Line),
with services being provided by a mixture of electric and diesel traction. The East and West Suffolk
Lines are not electrified and are operated by diesel traction only. All railway operations in Suffolk
are controlled from the Anglia Route Rail Operations Centre (ROC) at Romford, operated by
Network Rail, where Greater Anglia Control is also located36.
There are 25 rail stations in Suffolk, with the largest numbers of passengers using Ipswich,
Stowmarket and Bury St Edmunds stations respectively37. Statistics on station usage can be found
here. Route specification information is available here. The busiest stations in the County are
Ipswich (3,351,902) entries and exits in (2017/2018), followed by Stowmarket (935,244), and Bury St
Edmunds (652,084)38.
In addition to passenger services, the County’s railway carries a significant amount of rail freight
which is primarily container traffic to and from the Port of Felixstowe. However there are a smaller
number of trains carrying aggregates from a number of sites and natural gas condensate from
North Walsham. These freight services use the GEML to and from London and the West Suffolk Line
towards Ely/Peterborough, and are operated by several rail freight companies36.
Need more information?
www.greateranglia.co.uk/travel-information/journey-planning/network-map
www.gov.uk/government/uploads/system/uploads/attachment_data/file/5916/2112404.pdf
https://www.networkrail.co.uk/running-the-railway/our-routes/anglia/
Airports, Air Bases and Military Presence
There are no public airports in Suffolk, however there are several in neighbouring counties:
London Stansted (Essex)
Norwich Airport (Norfolk)
Cambridge International Airport (Cambridgeshire)
The Imperial War Museum Duxford is also near to the Suffolk boarder.
There is a significant military air force presence in terms of two large US Air Force bases in Forest
Heath in Suffolk (Lakenheath and Mildenhall). In early 2015 the United States Airforce announced
their withdrawal from Mildenhall. However, this withdrawal will occur no earlier than 202439. There
are UK armed forces bases at Honington, Wattisham and Woodbridge.
20The Suffolk Community Risk Register identifies an aviation incident as a LOW risk. However, multi-
agency partners have agreed that due to the high profile of such an incident should it occur, this
plan must be retained.
The Aviation Incident Plan is available here: https://www.suffolkresilience.com/uploads/2016-11-
28_SRF_Aviation_plan_Issue_4.pdf (review due November 2019).
Need more information?
A list of all UK units in Suffolk and their location can be found here:
http://www.suffolkmilitarycovenant.org.uk/uk-armed-forces-in-suffolk/
The Port of Felixstowe
There is significant maritime, coastal and river traffic. Over 50 miles of coastline and several
navigable estuaries support recreational and commercial water use40.
The Port of Felixstowe is the biggest and busiest container port in
Great Britain, as well as one of the largest in Europe. An
estimated 3,000 ships use the Port every year, including the largest
container vessels afloat, and the Port handles over 4 million
containers (TEUs – twenty-foot equivalent units)41.
The Port of Felixstowe provides some of the deepest water close to the open sea of any European
port, with an estimated 30 shipping lines operating from it, that offer 90 services to and from 400
global ports41. Additionally, 70% of the containers that come through the port are delivered to the
‘Golden Triangle’. This is a region in the middle of Britain where a vast number of main high street
and online retailers have their national distribution centres41.
Harwich International Port
Although located in North East Essex, Harwich International Port is very close to the Suffolk border,
and is one of the UK’s leading multi-purpose freight and passenger ports. There is a (currently
unpublished at December 2018) Harwich Combined Accident Plan, that provides an overview of
the multi agency, cross border response to a combined marine and shore based incident. There
is currently no local or national risk assessment for a collision of vessels at sea.
Need more information?
www.portoffelixstowe.co.uk
http://www.harwich.co.uk/corporate.asp
Offshore Wind Farms
There are 3 large wind farms proposed or being constructed off the coast
of Suffolk:
The Greater Gabbard Wind Farm, 14 miles off the Suffolk coast: It is
proposed that Greater Gabbard be extended, with another 140 wind turbines sited around 17
miles off our coast, in what is known as the Galloper Wind Farm. The East Anglia Offshore Wind
Farm, is the second largest proposed offshore wind farm in the UK, at 6,000km2.
Need more information?
https://www.suffolk.gov.uk/planning-waste-and-environment/major-infrastructure-
projects/offshore-wind-energy/
21Other Ports and Maritime
The Port of Ipswich is the UK’s biggest grain export port and handles approximately 2 million tonnes
worth of goods each year.
The Port of Lowestoft is the home of the Operation and Maintenance Base for Greater Gabbard
Offshore wind farm, and handles around 100,000 tonnes each year.
Due to Suffolk’s coastal nature there are many sea fishing locations such as Aldeburgh and
Southwold.
Need more information?
http://www.abports.co.uk/Our_Locations/Short_Sea_Ports/Ipswich/
http://www.abports.co.uk/Our_Locations/Short_Sea_Ports/Lowestoft/
Piers
Piers in Suffolk are key to tourism and part of Suffolk’s heritage.
However, due to the exposed nature of the piers, they can be at risk
of fire, storm damage and maritime incidents42.
There are four piers in Suffolk, one in Felixstowe, one in Southwold and
two in Lowestoft (Claremont and South Pier).
Need more information?
http://felixstowe-pier.co.uk/
http://www.southwoldpier.co.uk/
http://thesouthpier.co.uk/
http://www.claremontpier.co.uk/
Other Key Tourism Areas
Locations where large groups of people congregate for business, leisure or other reasons, have
the potential to pose a variety of risks and hazards that SFRS may have to attend to. Key sites in
Suffolk include:
Ipswich Town Football Club – Portman Road in central Ipswich is home to the Ipswich Town
football team. On matchdays, the stadium can accommodate just over 30,000 supporters
seated in four separate stands43.
Center Parcs Elveden – The popular holiday village resort is located in 400 acres of Suffolk
woodland, approximately 450,000 guests visit Elveden Forest every year.
Foxhall Stadium – Situated in Kesgrave, the Foxhall International Raceway hosts events such
as the National Banger World Final and the National Hot Rod World Championship44.
Latitude Music Festival- 40,000 people attend the weekend music and cultural event near
Southwold in July each year.
Suffolk Show- Ipswich East of England showground accommodating over 90,000 people
during the 2 day event in June each year.
22Go Ape – This popular tree top zip wire and high rope activity course is situated in Thetford
Forest.
Control of Major Accident Hazards (COMAH) Sites
The Control of Major Accident Hazards (COMAH) Regulations ensure that businesses: "Take all
necessary measures to prevent major accidents involving dangerous substances. Limit the
consequences to people and the environment of any major accidents which do occur"45.
Need more information?
Public COMAH 2015 information (searchable by postcode) can be found here:
http://www.hse.gov.uk/comah/
COMAH sites in Suffolk are as follows:
• International Flavours & Fragrances (GB) Limited - Duddery Hill, Haverhill CB9 8LG
The COMAH External Emergency Plan for this is available here (due for review June 2018).
• PPG Industries (UK) Limited - Needham Road, Stowmarket, IP14 2AD
The COMAH External Emergency Plan for this is available here (due for review November
2019).
• Calor Gas - Saxham Operations Centre, Newmarket Road, Risby, IP28 6QY
The COMAH External Emergency Plan for this is available here (due for review November
2018).
• Treatt PLC - Northern Way, Bury St Edmunds, Suffolk, IP32 6NL
The COMAH External Emergency Plan for this is available here (due for review August 2018).
There are a number of lower tier COMAH sites in Suffolk, SFRS have access to this information.
Radiation (Emergency Preparedness and Public Information) (REPPIR) Sites
“REPPIR establishes a framework of emergency preparedness measures to ensure that members
of the public are properly informed and prepared, in advance, about what to do in the unlikely
event of a radiation emergency occurring, and provided with information if a radiation
emergency actually occurs”46.
There is one REPPIR site in Suffolk, the Sizewell B Nuclear Power Station, near Leiston in Suffolk.
Sizewell B is the UK’s only Pressurised Water Reactor.
The Sizewell Offsite Plan is available here: https://www.suffolkresilience.com/uploads/NPM_-
_Sizewell_Off_Site_Plan_-_Issue_3.6_dated_Oct_18.pdf.
This document sets out the multi-agency strategic and tactical management arrangements for
dealing with a Nuclear Emergency.
Need more information?
https://magnoxsites.com/site/sizewell-a
https://www.edfenergy.com/energy/power-stations/sizewell-b
23Flooding and Severe Weather
Suffolk is subject to flooding from the sea, rivers, rain and ground water. The Suffolk Resilience
Forum note that flooding in Suffolk can come from several sources, the main type of flooding is
coastal flooding, usually associated with a storm surge47:
“Coastal, surface water and fluvial flooding are assessed as a MEDIUM risk in
Suffolk on the Community Risk Register. The National Risk Assessment for East
Coast Flooding still shows the risk to be Very High but after the recent tidal
flooding events of 2007 and 2013, the Suffolk Resilience Forum partners have
reduced the risk in Suffolk to reflect the actual flooding experienced”.
A large-scale flood risk exists from coastal inundation and the rivers Orwell, Gipping, Stour, Deben,
Alde, Blyth and Waveney. The effects of coastal flooding were shown in the catastrophic East
Coast Floods of 1953. More recently, Suffolk experienced tidal flooding in 2007 and in December
2013. Localised pluvial flash-flooding is an occasional occurrence40.
The Suffolk Flood Risk Management Partnership (SFRMP) is responsible for co-ordinating the
implementation of any actions required as a result of the Floods and Water Management Act
2010, and the Flood Risk Regulations 200948.
Local authorities in Suffolk won’t provide sandbags to protect individual properties, but instead
use these limited resources in bulk to raise and repair defences, or divert water away from groups
of properties. Suffolk has a Joint Emergency Planning Unit which coordinates with other services to
arrange temporary accommodation, and evacuation of houses due to serious flooding. It helps
people and businesses to recover from a devastating event.
The Suffolk Flood Plan is available here:
https://www.suffolkresilience.com/uploads/20180426_SRF_Flood_Plan_Issue_7.pdf
Severe winter weather information and services can be found on the Suffolk County Council
website here: https://www.suffolkresilience.com/uploads/20180426_SRF_Flood_Plan_Issue_7.pdf
Need more information?
The Environment Agency's interactive maps showing flood risks, coastal erosion,
flood and coastal schemes, etc. Click on the topic of interest then locate and
zoom into the area of interest.
https://www.suffolk.gov.uk/suffolk-fire-and-rescue-service/fire-safety-in-the-community/
Severe Summer weather
The increase in the frequency and duration of periods of high temperatures and limited rainfall
during the summer has increased. The change has resulted in a greater demand being placed on
emergency services across the country,
Suffolk Fire and Rescue will continue to ensure fire cover is maintained during these periods. The
Service will explore advancements in technology to ensure effective firefighting equipment is
available to minimise the impact on the county and Service.
24Suffolk Lowland Search and Rescue
Suffolk Lowland Search and Rescue (SULSAR) is a member unit of the UK’s Lowland Rescue
service. It is a voluntary specialist search team which helps the emergency services find missing
vulnerable adults and children. They are normally called out by Suffolk Constabulary, but also
respond to calls from the Fire service and other search teams in neighbouring counties49.
Technology
Small Unmanned Surveillance Aircraft
In 2017, Suffolk Fire and Rescue Service and multi-agency partners (through the Suffolk Resilience
Forum), developed a Small Unmanned Surveillance Aircraft (SUSA) capability as part of a multi-
agency Air Support Unit (ASU). The drone will provide a range of aerial surveillance options,
to support emergency services and voluntary organisations across a wide range of incidents.
Suffolk Fire and Rescue Service Appliance Overview of recent acquisitions:
Eight “new concept” appliances: Based upon a 15 tonne Volvo chassis, this vehicle has had
equipment added without any compromise to the “type B” (standard) inventory. The additional
equipment has been added to enhance firefighter and public safety and includes:
• An ultra-high pressure lance (UHPL), this provides a means of improving the fire
conditions within a compartment without the need to enter.
• Positive pressure ventilation fan (PPV), to assist in a number of fire scenarios and to
supplement the use of UHPL to clear the products of combustion from premises.
• An additional thermal image camera (TIC), SFRS appliances all carry one thermal
imaging camera predominantly for breathing apparatus crews, but the addition is
to allow the officer in charge to externally monitor conditions from outside. It also
supplements the safe system of work when UHPL is deployed.
• Battery rescue equipment (BRE), migration to BRE provides firefighters with significant
flexibility in operating rescue equipment when compared to petrol driven pump,
hydraulic oil operated tools. Tool efficiency has been proven over an extensive
evaluation period. Significant improvements in firefighter safety result and the
removal of hydraulic hoses and the petrol driven pump, provide the capacity to
allow the UHPL and PPV to be fitted. With the UHPL included, this appliance cost
around £239k.
Light Rescue Pump: Based upon a 10 tonne Iveco chassis this bespoke vehicle is designed to allow
a crew of less than 4 personnel to operate safely. The provided equipment is chosen and
assessed to be appropriate to the reduced personnel available. It will carry UHPL, PPV, BRE and
the additional TIC as above. The BRE type is specifically one-person operation. The cost of this
appliance is around £172k + the UHPL option at £45k.
Unimogs (a type of all terrain vehicle): SFRS has 3 Unimogs equipped with an on board crane,
fulfilling a range of specialist roles. These include but are not limited to: animal rescue, rural
firefighting and water rescue.
The rural firefighting and water rescue roles have bespoke and interchangeable pods carried. For
the water rescue role, they also tow the boat. The Unimogs provide a significant off-road
capability and their multi functionality results from a need to provide a wide range of response
options whilst limiting the fleet. These vehicles cost approximately £200k each.
25You can also read