2020 DISTRICT 3 HUNTING PROSPECTS Asotin, Garfield, Columbia, and Walla Walla counties - WDFW
←
→
Page content transcription
If your browser does not render page correctly, please read the page content below
2020
PAUL WIK, District Wildlife Biologist
MARK VEKASY, Assistant District Wildlife
Biologist

 DISTRICT 3 HUNTING
 PROSPECTS
 Asotin, Garfield, Columbia, and Walla Walla counties

38 | P a g e
TABLE OF CONTENTS
BE AWARE OF FIRE CONDITIONS .........................................................................................................................5

DISTRICT 3 GENERAL OVERVIEW ........................................................................................................................5

ELK ...............................................................................................................................................................................8

        General Information, Management Goals, and Population Status ........................................................................8

        Which GMU Should Elk Hunters Hunt? ............................................................................................................ 11

        A Brief Description of Each GMU ..................................................................................................................... 11

        What to Expect During the 2019 Season ............................................................................................................ 15

        How to Find Elk .................................................................................................................................................. 15

        Elk Areas ............................................................................................................................................................ 16

        Notable Issues and Hunting Changes .................................................................................................................. 17

DEER........................................................................................................................................................................... 18

        General Information, Management Goals, and Population Status ...................................................................... 18

        Which GMU Should Deer Hunters Hunt? .......................................................................................................... 19

        What to Expect During the 2019 Season ............................................................................................................ 22

        Deer Areas .......................................................................................................................................................... 26

        Notable Hunting Alerts ....................................................................................................................................... 27

BEAR .......................................................................................................................................................................... 27

        General Information, Management Goals, and Population Status ...................................................................... 27

        What to Expect During the 2019 Season ............................................................................................................ 27

        How to Locate and Harvest a Black Bear ........................................................................................................... 29

        Notable Hunting Alerts ....................................................................................................................................... 29

COUGAR .................................................................................................................................................................... 30

        General Information, Management Goals, and Population Status ...................................................................... 30

        What to Expect During the 2019 Season ............................................................................................................ 31

        Notable Hunting Alerts ....................................................................................................................................... 32

DUCKS........................................................................................................................................................................ 32

2|P a g e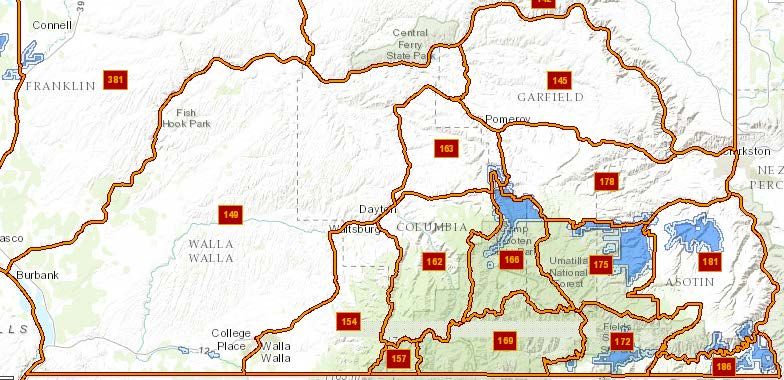
Common Species ................................................................................................................................................ 32
Migration Chronology ........................................................................................................................................ 33
Concentration Areas............................................................................................................................................ 33
Population Status ................................................................................................................................................ 33
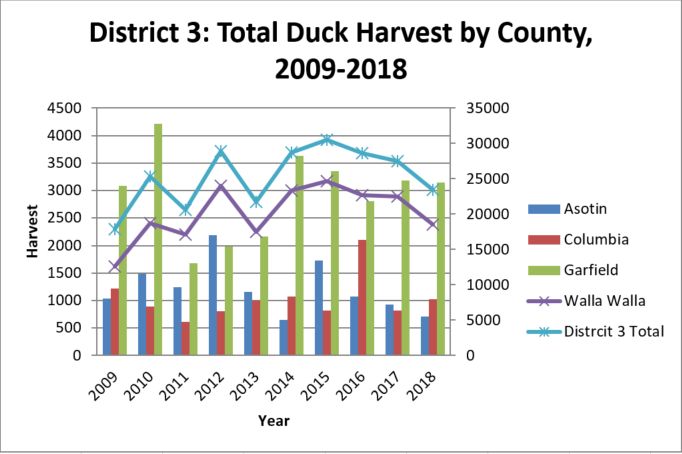
Harvest Trends and 2019 Prospects .................................................................................................................... 34
Hunting Techniques ............................................................................................................................................ 35
Public Land Opportunities .................................................................................................................................. 35
GEESE......................................................................................................................................................................... 36
Common Species ................................................................................................................................................ 36
Migration Chronology and Concentration Areas ................................................................................................ 36
Population Status ................................................................................................................................................ 36
Harvest Trends and 2019 Prospects .................................................................................................................... 36
Hunting Techniques ............................................................................................................................................ 38
Special Regulations ............................................................................................................................................. 38
FOREST GROUSE ..................................................................................................................................................... 38
Species and General Habitat Characteristics....................................................................................................... 38
Population Status ................................................................................................................................................ 38
Harvest Trends and 2019 Prospects .................................................................................................................... 31
Hunting Techniques and Where to Hunt ............................................................................................................. 31
PHEASANTS .............................................................................................................................................................. 31
Species and General Habitat Characteristics....................................................................................................... 31
Population Status ................................................................................................................................................ 32
Harvest Trends and 2019 Prospects .................................................................................................................... 33
Hunting Techniques and Where to Hunt ............................................................................................................. 33
QUAIL......................................................................................................................................................................... 34
Species and General Habitat Characteristics....................................................................................................... 34
Population Status ................................................................................................................................................ 34
Harvest Trends and 2019 Prospects .................................................................................................................... 34
3|P a g e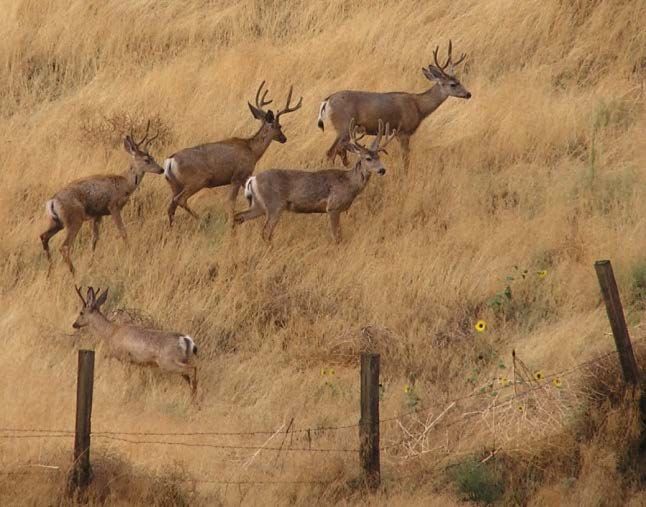
Hunting Techniques and Where To Hunt ........................................................................................................... 34

TURKEYS ................................................................................................................................................................... 34

        Population Status ................................................................................................................................................ 35

        Harvest Trends and 2019 Prospects .................................................................................................................... 36

        Hunting Techniques and Where to Hunt ............................................................................................................. 36

OTHER SMALL GAME SPECIES ............................................................................................................................ 37

MAJOR PUBLIC LANDS .......................................................................................................................................... 37

GENERAL OVERVIEW OF HUNTER ACCESS IN EACH GMU .......................................................................... 38

PRIVATE LANDS ACCESS PROGRAM ................................................................................................................. 41

ONLINE TOOLS AND MAPS ................................................................................................................................... 41

        Department of Natural Resources Public Lands Quadrangle (PLQ) Maps ......................................................... 42

        Online Parcel Databases ..................................................................................................................................... 42

        WDFW’s Mapping Tool ..................................................................................................................................... 42

4|P a g e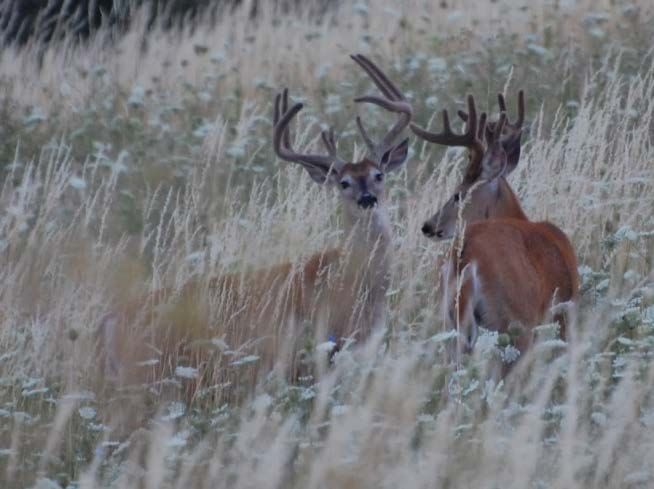
BE AWARE OF FIRE CONDITIONS

Wherever you choose to hunt, be sure to check on fire conditions, access restrictions, and
other emergency rules before you head out. In addition to potential wildfires, the U.S. Forest
Service (USFS) and Washington Department of Fish and Wildlife (WDFW) may be
conducting prescribed burns and/or forest-thinning projects in your hunt area. For more
information, see:

   •   Wildfire status updates (InciWeb – Incident Information System)
   •   Northwest Interagency Coordination Center
   •   WDFW Wildlife Areas

                       BE AWARE OF ROAD CLOSURES

Due to severe flood damage along the Tucannon River Road, multiple roads are closed within
the Umatilla National Forest (https://www.fs.usda.gov/detail/umatilla/alerts-
notices/?cid=fseprd701752). Check back to the USFS website for updates, but due to the
washout of the bridge over the Little Tucannon River and lack of funding, the road beyond the
bridge with access to Panjab, Meadow Creek, and the Upper Tucannon is expected to be closed
through the fall hunting season.

                      DISTRICT 3 GENERAL OVERVIEW
WDFW’s District 3 is located in southeast Washington and consists of 13 game management
units (GMU). GMUs in District 3 include 145 (Mayview), 149 (Prescott), 154 (Blue Creek), 157
(Watershed- Closed entry except elk hunting by permit), 162 (Dayton), 163 (Marengo), 166
(Tucannon), 169 (Wenaha), 172 (Mountain View), 175 (Lick Creek), 178 (Peola), 181 (Couse),
and 186 (Grande Ronde). Administratively, District 3 includes Walla Walla, Columbia, Garfield,
and Asotin counties, and is one of three management districts (1, 2, and 3) comprising WDFW’s
Region 1. The northern part of District 3 (north of Highway 12) includes the southeastern portion
of the Palouse Prairie ecoregion, while the southern part of the district is in the Blue Mountains
ecoregion.

5|P a g e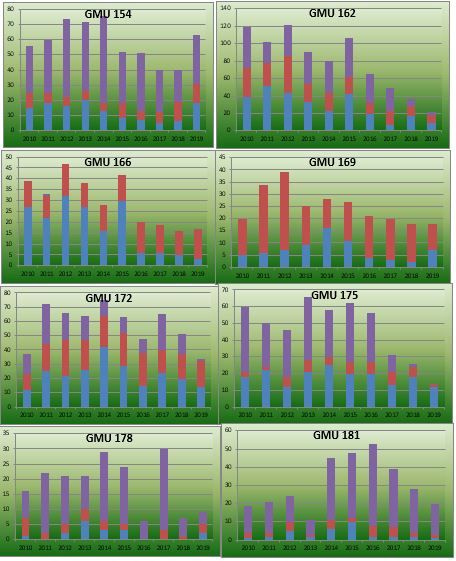
Figure 1. GMU map (from GoHunt) depicting District 3 GMU boundaries, west and south of the Snake
River, east of the Columbia River, and north of the Oregon border. Green areas are U.S. Forest Service
land and blue areas are WDFW Wildlife Areas.

The landscape in District 3 is dominated by agricultural land in the prairie and foothill regions,
with interspersed grassland areas and brushy draws. In the mountains, the most common habitat
is characterized by second-growth forests consisting primarily of Ponderosa pine, Douglas fir,
grand fir, and subalpine fir. The Blue Mountains have been characterized as a high plateau
dissected by steep draws and canyons carved by numerous creeks and rivers. The Tucannon and
Touchet rivers flow north out of the mountains, while major tributaries of the Wenaha and
Grande Ronde Rivers generally flow south. Numerous creeks drain the western edge of the
foothills, including Mill Creek, with its drainage located in the Walla Walla Watershed. Asotin
Creek is a major watershed on the eastern side of the Blue Mountains that flows east into the
Snake River.

6|P a g e
Image 1. Blue Creek in the western foothills of the Blue Mountains.

District 3 is best known for its elk hunting opportunities in the Blue Mountains and mule deer
hunting opportunities in grassland/agricultural GMUs. However, hunting opportunities also exist
for other game species, including white-tailed deer, black bear, chukar, turkey, and pheasant.
Table 1 presents estimates of harvest and harvest-per-unit effort (HPUE) for most game species
in District 3 during the 2019 hunting season, and how those estimates compare to the 2018
season and the five-year average. Small game and waterfowl harvest updates were not
available at the time of writing, therefore values shown are for 2017 and 2018 seasons. For
more specific information on harvest trends, please refer to the appropriate section in this
document.

7|P a g e
Harvest                                       HPUE

                                                   %        %                             %           %
                       5-yr                      change   change   5-yr                 change      change
         Species       avg.     2018     2019     (5yr)   (2018)   avg.   2018   2019    (5yr)      (2018)

 Elk (General)         137       82        89    -46%      2%      126    147    131        4%       -11%

 Elk (Bull Permit)     102       90        81    -21%     -10%     55%    54%    60%    (Permit success)

 Deer                 2,564    2,422    2,150    -16%     -11%     14.0   14.8   14.6       4%       -2%

 Bear                   82      104        92     13%     -12%     107    76     94         -12%     23%

 Cougar                 20       30        12    -40%     -60%       Not estimated           **       **

 Wild Turkey           821     1,053    1,048     28%      0%      0.10   0.10   0.10       -3%      -5%

 Canada Goose         3,475    3,462    3,860     11%      11%     1.21   1.33   1.22       1%       -8%

 Chukar Partridge     1,536    1,297    3,045     98%     135%     1.13   0.42   1.31       24%     213%

 Cottontail Rabbit     420      451     1,101    162%     144%     0.53   0.49   1.92       263%    296%

 Duck                27,422   27,423   23,412    -15%     -15%     2.81   2.80   2.65       -6%      -5%

 Forest Grouse        1,738    2,143    1,735     0%      -19%     0.40   0.41   0.36       -10%     -11%

 Gray Partridge        747      721     1,052     41%      46%     0.48   0.37   0.62       29%      66%

 Mourning Dove        2,940    4,156    2,480    -16%     -40%     3.21   3.66   3.65       14%       0%

 Pheasant             8,213    9,177    8,408     2%       -8%     0.69   0.73   0.73       6%        0%

 Quail                5,630    3,537    3,587    -36%      1%      1.06   0.64   0.62       -42%     -4%

 Snowshoe Hare          63       11        20    -68%      82%     0.48   0.06   0.05       -89%     -15%
Table 1. General season harvest and HPUE estimates for most game species found in District 3 during
the 2018 and 2019 hunting seasons. Also included are the five-year averages and a comparison of 5-
year estimates and 2018 to 2019 estimates. HPUE is expressed as #hunter days/harvest for elk, deer,
and bear (lower is better), and as #harvested/hunter day for all other species (higher is better).

                                                 ELK

GENERAL INFORMATION, MANAGEMENT GOALS, AND POPULATION
STATUS
In Washington, elk are managed at the herd level, while harvest regulations are set at the GMU
level. Population objectives are set at the herd level, and survey data is summarized at that level
as well. District 3 is comprised of the single Blue Mountains elk herd (GMUs 145, 149, 154,
157, 162, 163, 166, 169, 172, 175, 178, 181, and 186).

8|P a g e
Only the GMUs within the forested portion of District 3 are managed for elk population stability
or growth (GMUs 154, 157, 162, 166, 169, 172, 175, and 186). GMUs 145, 149, 163, 178, and
most of 181 are managed to limit elk numbers, although some recreational opportunity is
provided as determined through surveys and damage complaints. In all GMUs, minimizing elk
depredation to agricultural crops on private agricultural lands is a priority. An additional
management objective is to maintain a minimum of 22 bulls: 100 cows in the post-season
population, with a range of 22 – 28 bulls:100 cows as the management target.
Biologists in District 3 conduct an annual helicopter survey within the core elk areas to estimate
the post-winter population size. In the spring of 2020, survey efforts resulted in a population
estimate of 4,614 (90% Confidence Interval of +/- 422) elk. Surveys are conducted along the
state line of Oregon (and within Oregon), resulting in approximately 500-600 elk being classified
that likely are not available for harvest in Washington during the fall. The average five-year
population estimate prior to 2020 was 5,062 elk, which is 9 percent higher than the 2020
estimate. The 2020 surveys documented a calf ratio of 22.0 calves per 100 cows and a bull ratio
of 22.1 bulls per 100 cows.
Total Abundance
6500
6000
5500
5000
4500
4000
3500
3000
2006
2007
2008
2009
2010
2011
2012
2013
2014
2015
2016
2017
2018
2019
2020
Abundance estimates for the Blue Mountains elk population. Vertical bars represent 90% confidence intervals.
Calf ratios in 2020 declined from 2019 and are lower than the 5-year average of 27.4. The low
calf recruitment is attributed to the lingering effects of the severe winters of 2016/2017 and
2018/2019, predation on calves, and other factors. Biologists were expecting higher recruitment
numbers in 2020 due to mild summer conditions in 2019 and a normal winter in 2019/2020. The
effects of climate on elk productivity are difficult to quantify in years following a severe winter
or summer drought. Poor body condition can result in calves with low birth weight and lower
survival, or effects can carry-over into the breeding season (summer drought) decreasing
pregnancy rates and resulting in fewer pregnancies, all of which may have influenced depressed
cow/calf ratios over the past few seasons.
9|P a g eCalf Ratio
45.0
40.0
35.0
30.0
25.0
20.0
15.0
10.0
5.0
0.0
2011
2012
2013
2014
2015
2016
2017
2018
2019
2020
Calf ratios for the Blue Mountains elk herd, generated from helicopter surveys conducted in March. Vertical lines
represent 90% confidence intervals in the estimate.
Bull ratios and total bull numbers remained lower than the 5-year average (30.6 bulls per 100
cows), which will be reflected in lower permit opportunity in 2020. The recent decline in the
number of elk in the Blue Mountains is likely a result of multiple factors; such as the hard
winters observed in 2016/2017 and 2018/2019, summer droughts, and similar levels of predation
over the past 5 to10 years which cumulatively reduced survival of adults and negatively
impacted recruitment. The low number of calves being recruited into the population in 2020 will
result in a low number of yearling bulls (spikes) available for harvest this fall. This fall will be
another below-average year for yearling bull harvest.
Bull Ratio
40.0
35.0
30.0
25.0
20.0
15.0
10.0
5.0
0.0
2006 2008 2010 2012 2014 2016 2018 2020
Estimated bull ratio (bulls per 100 cows) from helicopter-based surveys. Vertical lines represent 90% confidence
intervals.
10 | P a g eFor more detailed information related to the status of Washington’s elk herds, hunters should read through the most recent version of the Game Status and Trend Report, which is available for download on the department’s website. WHICH GMU SHOULD ELK HUNTERS HUNT? Most general season hunters in the Blue Mountains have been hunting here for many years, with the exception of branched-antlered-bull tag holders and archery hunters in GMU 175. New hunters to this area will have to consider several options, such as weapon type, private land access versus public land, the difficulty of hunt desired (wilderness versus landscapes with roads), and, as archery hunters, whether the availability of antlerless opportunity is important. Throughout District 3, the harvest of branched-bulls is regulated through the permit system. All GMUs in District 3 are managed for quality hunting, except GMUs 145, 186, and some hunts in 149. The drawing of these tags can be difficult, and many hunters invest years before successfully obtaining a permit. Once a permit is obtained, district biologists are available to provide information on where to hunt within a GMU. A BRIEF DESCRIPTION OF EACH GMU GMU 145 This is a private land unit managed for zero elk. Very few elk reside in this unit. Their movements are unpredictable and make them difficult to locate, and knowledge of their locations is often not readily available. GMU 149 This large GMU is predominantly private land managed to minimize elk numbers because of conflicts with agricultural activities. A relatively large number of bulls inhabit the southwest corner of the GMU and cross back and forth between Oregon and Washington. Most harvest in recent years has occurred in the area of the Boise Cascade poplar tree farm. The poplar tree farm has been converted to row crops and access to this area for elk hunting has changed considerably in the last 2 years. Another herd of elk exists in the northern portion of the unit on the breaks of the Snake River. This is a very difficult herd to hunt without access to numerous private lands, as the elk are highly mobile in this area and can be difficult to locate. GMU 154 This GMU is 99 percent private land but does include numerous landowners in the WDFW access program. The elk are heavily hunted in this GMU due to conflicts with agricultural activities. Access has historically been available to branched-bull tag holders and general season hunters. GMU 157 This GMU is 99 percent public land but closed to the public to any entry other than branched- bull permit holders. The Mill Creek Watershed is the source of drinking water for the City of Walla Walla, and access is highly regulated. Successful permit applicants will be contacted by the U.S. Forest Service (USFS) with an information packet containing rules for hunting the 11 | P a g e
watershed. This unit is very steep and rugged, contains few maintained trails, and is physically
challenging to hunt. No scouting or overnight camping inside the watershed boundaries is
permitted. Only the perimeter roads and trails can be accessed for scouting.

GMU 162

The Dayton GMU is a mix of private and public lands and has historically supported about 1,000
elk. Currently, the number of elk in the Dayton GMU is about 60% percent below the historic
numbers. This unit has the highest density of general season hunters in District 3. Access to the
northern portion of the GMU can be difficult, as it is predominantly private. The southern
portion of the unit is predominantly USFS and lands owned by the Confederated Tribes of the
Umatilla Indian Reservation (CTUIR). Both of these lands are open to the public, with motorized
vehicle restrictions throughout.

GMU 163
This GMU is not managed for elk and only occasionally supports enough elk to hunt. The GMU
is predominantly private land.

GMU 166
This GMU has recently had the highest success rate for general season hunters but also has one
of the higher densities of hunters. The unit is mostly USFS and WDFW-owned lands. A portion
of the Wenaha-Tucannon Wilderness extends into this GMU and offers backcountry hunting
opportunities.

GMU 169
Most of this GMU is located within the Wenaha-Tucannon Wilderness. Numerous road access
points occur along the edge of this GMU, but a majority of the unit requires backpacking or
horse packing to access. This can be a physically challenging unit to hunt. Elk densities have
remained low in this unit for the past 30 years and do not show indications of improving.
However, a large wildfire burned in this unit in 2015, which is expected to have a positive effect
on elk numbers and habitat quality for years to come.

GMU 172
Elk numbers have declined slightly in the past couple of years in this GMU with low recruitment
observed in the spring of 2020. Calf ratios of 12:100 were observed on the Oregon elk feedlot on
Bartlett Bench. Calf ratios throughout the rest of the unit were better. Approximately 60 percent
of this GMU is private and access can be challenging. The USFS lands within this GMU are
physically challenging to hunt. WDFW has been acquiring land within this GMU recently (4-0
Ranch Wildlife Area), but deer and elk hunting there is managed by permit only access.

GMU 175
This GMU is predominantly public land owned by WDFW, USFS, and Washington DNR.
Access is good throughout the unit. One major change as the result of declining elk numbers
observed in this unit is the restriction of archery hunters to spike-only, with no antlerless
opportunity available for any weapon type without an antlerless permit.

12 | P a g e
GMU 178
This private land unit is managed to minimize elk numbers due to conflict with agricultural
activities. Access can be challenging to obtain. Elk numbers are highly variable in the unit and
do not offer a reliable recreational opportunity during the general season without knowledge of
landowners and herd behavior.

GMU 181
This private land unit is managed to minimize elk numbers due to conflict with agricultural
activities. Access can be challenging to obtain. Elk numbers are highly variable in the unit and
do not offer a reliable recreational opportunity during the general season without knowledge of
landowners and herd behavior.

GMU 186
This unit is split equally between private and public lands, with very limited private land access
available. This GMU is predominantly winter range for elk in Oregon, although approximately
100 elk reside in the unit throughout the year. The individual elk may reside on private land
throughout the season where access is not available, although some years have proven highly
successful for the few hunters that know the unit.

Summary of GMU Harvest Attributes

The information provided in Table 2 provides a quick and general assessment of how District 3
GMUs compare with regard to harvest, hunter numbers, and hunter success during general
modern firearm, archery, and muzzleloader seasons. The values presented are from the 2017
harvest reports. Total harvest and hunter numbers were further summarized by the number of elk
harvested and hunters per square mile.

Each GMU was ranked from one to 10 for elk harvested/mi2 (bulls only for modern firearm and
cows included with bulls for archery), hunters/mi2, and hunter success rates. The three ranking
values were then summed to produce a final rank sum, with Public Access ranking excluded. The
modern firearm comparisons are the most straightforward because bag limits and seasons are the
same in each GMU.

13 | P a g e
MODERN FIREARM
                                                                                                 Public
                            Harvest                  Hunter Density          Hunter Success
                                                                                                 Access
            Size            Harvest                      Hunters                                     Rank
 GMU                Total             Rank    Hunters                 Rank   Success   Rank   Rank
           (mi2)            per mi2                      per mi2                                     Sum
  149      1409      2       0.00      9        37         0.03        1      5.4%      4      3     14
  154      216       18      0.08      6       222         1.03        6      8.1%      6      3     18
  162      210       4       0.02      4       459         2.19        10     0.9%      8      2     22
  166      131       1       0.01      4       232         1.77        8      0.4%      6      1     18
  169      161       7       0.04      7       151         0.94        5      4.6%      8      1     20
  172      108       11      0.10      1       214         1.98        7      5.1%      2      2     10
  175      158       6       0.04      3       397         2.51        9      1.5%      3      1     15
  178      275       2       0.01      9        80         0.29        3      2.5%      10     3     22
  181      262       1       0.00      7        93         0.35        2      1.1%      5      3     14
  186          53    8       0.15      1        55         1.04        4     14.5%      1      2      6
                                             ARCHERY
                                                                                                 Public
                            Harvest                  Hunter Density          Hunter Success
                                                                                                 Access
            Size            Harvest                      Hunters                                     Rank
 GMU                Total             Rank    Hunters                 Rank   Success   Rank   Rank
           (mi2)            per mi2                      per mi2                                     Sum
  149      1409      2         0       8        12         0.01        2     16.7%      6      3     16
  154      216       5       0.03      3        85         0.63        8      5.9%      3      3     14
  162      210       2       0.02      4        84         0.78        9      2.4%      2      2     15
  166      131       0         0       8        28         0.37        6      0.0%      6      1     20
  169      161       0       0.01      5        22         0.25        5      0.0%      6      1     16
  172      108       2       0.06      2        39         0.43        7      5.1%      1      2     10
  175      158       1       0.15      1        75         1.68        10     1.3%      6      1     17
  178      275       0       0.01      5        24         0.18        4      0.0%      6      3     15
  181      262       2         0       8        26         0.08        3      7.7%      6      3     17
  186          53    0         0       8        3           0          1      0.0%      6      2     15
                                           MUZZLELOADER
                                                                                                 Public
                            Harvest                  Hunter Density          Hunter Success
                                                                                                 Access
            Size            Harvest                      Hunters                                     Rank
 GMU                Total             Rank    Hunters                 Rank   Success   Rank   Rank
           (mi2)            per mi2                      per mi2                                     Sum
  149      1409      0         0       5        10         0.01        1      0.0%      7      3     13
  154      216       0        0.0      5        11         0.05        3      0.0%      7      3     15
  162      210       3        0.0      2        29         0.14        5     10.3%      1      2      8
  166      131       2        0.0      5        29         0.22        6     6.9%       7      1     18
  172      108       1        0.0      1        54         0.50        8     1.9%       2      2     11
  175      158       5        0.0      3        67         0.42        7     7.5%       3      1     13
  178      275       0         0       5        4          0.01        4     0.0%       7      3     16
  181      262       0         0       5        23         0.09        1     0.0%       7      3     13

14 | P a g e
Table 2. Rank sum analysis that provides a quick and general comparison of how total harvest, hunter numbers, and hunter success rates compare among GMUs during general modern firearm, archery, and muzzleloader seasons. GMUs are generally limited to spike bull harvest, but some may have an antlerless opportunity as well (see hunting regulations for specific restrictions). Data presented are based on 2019 harvest reports. WHAT TO EXPECT DURING THE 2020 SEASON It has been uncommon for elk populations to fluctuate dramatically from year to year, especially in District 3 where severe winter weather conditions seldom occur. Unfortunately, the winters of 2016/2017 and 2018/2019 were uncommonly severe, resulting in a significant decline in elk numbers. Calf recruitment since 2016 has remained below average, consequently, populations available for harvest are expected to remain lower than years prior to the 16/17 winter. The 2020 general season is expected to be similar to the average during the past 4 years. Harvest since 2016 has been the lowest in the past 20 years. Hunter numbers also typically do not change substantially from one year to the next, but a slow decline has been observed with the declining population. The weather during hunting season does change from year to year, which will influence success rates. HOW TO FIND ELK When hunting elk in District 3, hunters need to do their homework and spend plenty of time scouting before the season opener because it is often difficult to predict where the elk are going to be, especially after hunting pressure increases. The majority of hunters spend most of their time focusing on open ridge tops where they can glass animals from a considerable distance. During the general season, past research on bulls has indicated that a majority of the elk will move to north aspect, mid-slope timbered hillsides within one day of the opener. With only nine days to hunt the general season, there is a lot of pressure in the first few days. Pressure declines as the season progresses and may allow the elk to return to normal behaviors if they are not close to major roads. Later in the season, it is a good idea to consult a topographic map and find “benches” located in steep terrain and thick cover because elk often use these areas to bed down during the day. Lastly, on public land, hunters should not let a road closed to motorized vehicles keep them from walking into an area to search for elk. More often than not, these areas hold elk that have not received as much hunting pressure. 15 | P a g e
Figure 2. Trends in total number of yearling bulls (blue), branched bulls (red), and antlerless (purple)
elk harvested during general and permit seasons combined, 2010-2019. Harvest does not include tribal
harvest.

ELK AREAS
There are nine elk areas in District 3: Elk Area 1008 and 1009 (Wenaha Wilderness West and
East), Elk Area 1010 (Dayton private lands), Elk Area 1013 (Mountain View Private), Elk Area
1016 (GMU 162 excluding the Rainwater WLA), Elk Area 1040 (4-0 Wildlife Area), Elk Area
1075 (Lick Creek Private Lands), and Elk Area 1081(GMU 181 + extreme west side of
GMU172).

The intent of Elk Areas 1008 and 1009 was to distribute the hunting pressure within the Wenaha-
Tucannon Wilderness. In the past, most permit hunters focused in the western corner of the unit
where the road density was highest. By spreading out the hunting pressure, additional hunting
opportunity was created.

16 | P a g e
Elk Area 1010 is used to focus antlerless and branched-bull elk hunting on private land in the
Dayton Unit. In the past, branched bull tag holders focused on public lands where access was
guaranteed, but also increased pressure on that segment of the population. This elk area is also
used to focus antlerless harvest on the private lands where depredation complaints have
historically been high but limits antlerless harvest on public lands where higher elk densities are
desired. For the 2020 hunting season, no antlerless opportunity exists in any portion of the
Dayton GMU.

Elk Areas 1013 and 1040 are used to manage hunters within GMU 172. Elk Area 1013 limits
antlerless hunting to private lands where damage can occur on agricultural areas while
maximizing elk numbers and recruitment on public lands. Elk Area 1040 is the 4-0 Ranch
Wildlife Area, which is managed for quality hunting opportunity as part of the sale agreement
from the previous landowner. All deer and elk hunting on this wildlife area will be managed for
quality opportunity, whereas all other species may be hunted by general seasons as listed in the
pamphlet.

Elk Area 1075 has recently been created to try to use hunters to alter the behavior of elk that
leave the Asotin Creek Wildlife Area for private agricultural grounds during early winter. To
minimize crop damage, hunters are being used to move elk off of private lands in the Lick Creek
GMU. The same is true for Elk Area 1081.

NOTABLE ISSUES AND HUNTING CHANGES
    1. Elk Area 1040 (4-0 Ranch Wildlife Area) is closed to general season deer and elk
       hunting. Elk hunting will only be allowed through the permit system on these lands.

    2. Antlerless elk opportunity has decreased in GMU 181 due to declining herd size and
       depredation complaints. Boundary changes were made to hunts in this area in 2018 to
       include Elk Area 1075 and 1082 to continue refining our efforts to address problematic
       elk distributions. Elk in this unit primarily inhabit private lands during hunting seasons
       and acquiring access prior to applying for permits is highly recommended.

    3. During the summer of 2015, a large wildfire burned through a large portion of the
       Wenaha-Tucannon Wilderness, extending slightly into GMU 172 on Grouse Flats. A
       large portion of the fire that occurred in Washington burned later into September,
       creating desirable habitat conditions for elk with low intensity burning.

    4. Severe winters occurred during 2016/2017 and 2018/2019, resulting in high mortality
       rates of elk. Antlerless opportunity throughout the Blue Mountains has been severely
       reduced on public lands as a result. Calf recruitment has yet to rebound and harvest will
       remain below average.

17 | P a g e
DEER GENERAL INFORMATION, MANAGEMENT GOALS, AND POPULATION STATUS Both mule deer and white-tailed deer occur throughout District 3. Deer hunting opportunities in District 3 vary from marginal to quite good, depending on the GMU. The GMUs with the highest success (GMUs 145, 178, 181, and 186) also have the highest amount of private land, and access can be limited. GMUs where access to public land is highest (GMUs 166, 169, and 175) have the lowest success, probably due to a combination of high hunter numbers, a high percentage of legal bucks harvested, and lower quality deer habitat. While overall harvest is one indicator of GMU hunting quality, harvest/unit effort (HPUE) and harvest/unit area (HPUA) equalize GMUs based on hunter numbers, number of days hunting, and GMU size. However, both HPUE and HPUA can be misleading, as HPUE is complicated by private land access limitations and HPUA is complicated by the amount of habitat in the GMU that supports deer. In general, HPUE seems to be a better indicator of hunting success. Hunter success and HPUE of either white-tailed or mule deer in District 3 is highest in GMUs 145 (Mayview), 178 (Peola), 181 (Couse), and 186 (Grande Ronde) while total general season harvest is highest in GMUs 149 (Prescott), 154 (Blue Creek), and 162 (Dayton). Currently, WDFW does not use formal estimates or indices of population size to monitor deer populations in District 3. Instead, trends in harvest, hunter success, and HPUE (harvest/hunter day) are used to monitor population status. WDFW recognizes the limitations of using harvest data to monitor trends in population size and are conducting annual road surveys to determine herd composition and periodic aerial sightability surveys to monitor deer populations that are independent of harvest data, in addition to exploring the use of integrated population models. All available harvest data indicates deer populations are variable within a relatively narrow range in District 3. Although hunter numbers were down in 2019, overall success (25%) was similar to last year (26%) and not far below the 5-year average (27%). For more detailed information related to the status of mule deer and white-tailed deer in Washington, hunters should read the 18 | P a g e
most recent version of the Game Status and Trend Report, which is available for download on
the department’s website.

WHICH GMU SHOULD DEER HUNTERS HUNT?
Probably the most frequent question from hunters is, “What GMU should I hunt?” This is not
always easy to answer because it depends on the hunting method and the type of hunting
experience desired. Some hunters are looking for a quality opportunity to harvest a mature buck,
while others just want to harvest any legal deer, and still, others prefer to hunt an area with few
other hunters.

The ideal GMU for most hunters would have high deer densities, low hunter densities, and high
hunter success rates. Unfortunately, this scenario does not exist in any GMU that is open during
the general modern firearm, archery, or muzzleloader seasons in District 3. Instead, because of
general season opportunities, the GMUs with the highest deer densities tend to have the highest
hunter densities as well. For many hunters, high hunter densities are not enough to persuade
them not to hunt in a GMU where they see lots of deer. Some hunters prefer to hunt in areas with
moderate to low numbers of deer if that means there are also very few hunters and provide a
backcountry experience.

The information provided in Table 3 provides a quick and general assessment of how GMUs
compare with regard to harvest, hunter numbers, and hunter success during general modern
firearm, archery, and muzzleloader deer seasons. The values presented are the five-year averages
for each statistic. Total harvest and hunter numbers were further summarized by the number of
deer harvested per hunter and the number of hunters per square mile. This approach was taken
because comparing total harvest or hunter numbers is not always a fair comparison since GMUs
vary in size. For example, the average number of deer harvested over the past five years during
the modern firearm general season in GMUs 149 (Prescott) and 154 (Blue Creek) has been 439
and 265 deer, respectively. Just looking at total harvest suggests deer densities are much higher
in GMU 149 than 154. However, when harvest is expressed as deer harvested/mi2, the result is
an estimate of 0.31 in GMU 149 and 1.23 in GMU 154, which suggests deer densities are
probably much higher in GMU 154 than they are in GMU 149. This is further complicated by the
amount of actual deer habitat in each GMU. For example, GMU 149 is the largest but is
comprised primarily of tilled croplands, and deer are concentrated in CRP fields and along the
breaks of the Snake River, so densities in a portion of the GMU are probably higher than the
harvest/mi2 indicates.

Each GMU was ranked from one to 12 (except for ties) for deer harvested/mi2, hunters/mi2,
hunter success rates, and public land access. The ranking values were then summed (public land
access excluded) to produce a final rank sum. GMUs are listed by GMU number, not by rank.
Comparisons are straightforward because bag limits and seasons are the same for most GMUs.
Differences that should be considered include:
         1     Some private land GMUs have extensive acreage in WDFW Access programs, such
               as Feel Free to Hunt, Hunt by Written Permission, Hunt by Registration, or Hunt by
               Reservation, and may offer similar access to some GMUs with public land. See the
               Access section of this document for private land acreage available for public hunting
               in each GMU.

19 | P a g e
2 Some private land GMUs have extensive acreage in tilled croplands, and actual
suitable hunting area may be much smaller, leading to higher than expected hunter
densities.
MODERN FIREARM
Public
Harvest Hunter Density Hunter Success Access
Rank
Size Harvest Hunters
Sum
GMU (mi2) Total per mi2 Rank Hunters per mi2 Rank Success Rank Score
145 355 223 0.63 5 597 1.68 4 37% 2 3 11(2)
149 1409 439 0.31 10 1486 1.05 1 30% 5 3 16(4)
154 216 265 1.23 2 980 4.54 11 27% 6 3 19(6)
162 210 326 1.55 1 1435 6.83 12 23% 7 2 20(7)
163 149 82 0.55 7 373 2.51 9 22% 8 3 24(9)
166 131 51 0.39 8 481 3.67 10 11% 11 1 29(11)
169 161 22 0.14 12 184 1.15 2 12% 10 1 24(10)
172 108 42 0.39 8 192 1.78 5 22% 8 2 21(8)
175 158 32 0.20 11 333 2.11 7 10% 12 1 30(12)
178 275 216 0.79 3 538 1.96 6 40% 1 3 10(1)
181 262 147 0.56 6 394 1.50 3 37% 2 3 11(2)
186 53 37 0.70 4 120 2.27 8 31% 4 2 16(4)
20 | P a g eARCHERY
Public
Harvest Hunter Density Hunter Success Access
Size Harvest Hunters Rank
GMU (mi2) Total per mi2 Rank Hunters per mi2 Rank Success Rank Rank Sum
145 355 13 0.04 8 46 0.13 3 28% 5 3 16(4)
149 1409 49 0.03 9 188 0.13 3 26% 6 3 18(6)
154 216 64 0.30 1 225 1.04 11 30% 4 3 16(4)
162 210 41 0.20 2 209 0.99 10 19% 8 2 20(8)
163 149 21 0.14 3 163 1.09 12 13% 10 3 25(11)
166 131 13 0.10 5 85 0.65 9 15% 9 1 23(9)
169 161 1 0.01 12 14 0.09 1 7% 11 1 24(10)
172 108 10 0.09 6 29 0.27 6 35% 2 2 14(2)
175 158 4 0.03 9 81 0.52 8 5% 12 1 29(12)
178 275 36 0.13 4 112 0.41 7 32% 3 3 14(2)
181 262 8 0.03 9 34 0.13 3 24% 7 3 19(7)
186 53 5 0.09 6 7 0.12 2 76% 1 2 9(1)
21 | P a g eMUZZLELOADER
Public
Harvest Hunter Density Hunter Success Access
Harvest Hunters Rank
GMU Size (mi2) Total per mi2 Rank Hunters per mi2 Rank Success Rank Rank Sum
145 355 17 0.05 4 41 0.12 1 41% 1 3 6(1)
149 1409 61 0.04 5 203 0.14 2 30% 5 3 12(5)
154 216 N/A . . . . . . . .
162 210 N/A . . . . . . . . .
163 149 N/A . . . . . . . . .
166 131 N/A . . . . . . . . .
169 161 N/A . . . . . . . . .
172 108 24 0.22 1 59 0.55 5 41% 1 2 7(2)
175 158 6 0.04 5 50 0.32 4 12% 6 1 15(6)
178 275 N/A . . . . . . . . .
181 262 54 0.21 2 143 0.55 5 38% 3 3 10(3)
186 53 5 0.09 3 13 0.25 3 37% 4 2 10(3)
Table 3. Rank sum analysis that provides a quick and general comparison of how total general harvest,
hunter numbers, hunter success rates, and access to public land compare among GMUs during general
modern, archery, and muzzleloader deer seasons. GMUs in bold type are open during early and late
seasons for the respective weapon type. Data presented are based on a five-year average (2015-2019).
WHAT TO EXPECT DURING THE 2020 SEASON
Wildfires are always a possibility that may affect hunter access to some hunting areas. Hunters
should check the status of wildfires and access restrictions online. In addition, USFS and WDFW
have been conducting prescribed burns and forest thinning projects to reduce wildfire risk. Check
with the local USFS offices and WDFW district offices for current status on forest treatment
projects.
It is typically uncommon for deer populations to fluctuate dramatically from year to year,
especially in District 3 where deer move out of the mountains in winter and weather conditions
are generally mild and do not result in large winter die-offs. However, we had very late and
heavy snow cover across the district during the winter of 2018/2019, with snow cover persisting
well into the usual spring green-up period. Although the deer went through January in
presumably good condition, we observed significant winter-kill across the district, with many
ranchers along the Snake and Grande Ronde rivers reporting emaciated and dying deer. A
22 | P a g esubstantial number of the dead deer investigated were yearlings and, with deer herds still recovering from the harsh winter in 2016/2017, the combined effects were seen in the low 2019 harvest and are expected to carry-over into the 2020 hunting season. With an average to mild winter over 2019-2020 and the lag time for bucks to become legal 3-points, we wouldn’t expect white-tailed deer harvest to significantly improve until the 2021 season, and mule deer harvest by 2022. Periodic die-offs have occurred due to epizootic hemorrhagic disease (EHD) and bluetongue, both viral conditions transmitted by a biting midge, which mainly affect white-tailed deer. While WDFW only received a few reports of deer dying during the summer, particularly in portions of GMU 149 and 154, biologists in Oregon reported significant deer die-offs adjacent to WA, with survey declines of up to 70%. We may see some effects of this large die-off in GMUs that border OR. While disease outbreaks are monitored annually, there is nothing feasible to be done to prevent outbreaks of hemorrhagic diseases. Mule deer populations have experienced long-term declines across much of the west with no definitive cause identified. Habitat loss is suspected to be one possible cause, particularly the loss of winter range. The Conservation Reserve Program (CRP) has probably helped maintain winter range in District 3, and mule deer populations outside of the mountains appear to be stable to increasing. However, decreases in available CRP contracts over the last few years have resulted in more land going into agricultural production and will likely have long-term negative impacts on mule deer populations in the district. One reference WDFW currently has for future potential harvest during general seasons are recent trends in hunter harvest success and harvest/unit effort. Figure 3 provides trend data for each of these statistics by GMU and is intended to provide hunters with the best information possible to make an informed decision on where they want to hunt in District 3 and what they can expect to encounter with regard to hunter success and deer numbers. 23 | P a g e
24 | P a g e
25 | P a g e
Figure 3. Left column: Ten-year trends in total numbers of mule deer bucks (blue) and antlerless deer
(green), and white-tailed bucks (red) and antlerless deer (purple) during all general seasons combined
from 2010-2019. Totals do not include permit harvest (note the different scales, from maximums of
80, 140, 450, and 1,000). Right column: Ten-year trends in percentage harvest success for each GMU
in District 3 for modern firearm (blue diamonds), archery (red squares), and muzzleloader (green
triangles) general season hunters for 2010-2019.

DEER AREAS
There are five deer areas in District 3 that were created for several purposes. Deer Area 1010 is
located within the private land area of GMU 162 and was created to help manage deer damage
while limiting antlerless harvest on public land in the GMU. Deer Areas 1008 and 1009 divide
GMU 169 and help to manage deer by distributing harvest opportunity across the wilderness
area. Deer Area 1021 is in and around the town of Clarkston in GMU 178 and is used to help
manage deer in and around the urban area. Deer Area 1040 is located in GMU 172 and consists
of the newly purchased 4-0 Ranch Wildlife Area. Deer and elk hunting in this area is by permit

26 | P a g e
only, which helps maintain some quality opportunity in the GMU and also helps keep deer and
elk on the wildlife area to limit crop damage on private lands.

NOTABLE HUNTING ALERTS
    1. GMU 166 General Season Archery limited to 3 pt. min. white-tailed and mule deer, no
       antlerless harvest allowed.
    2. Deer Area 1040 (4-0 Ranch Wildlife Area) is closed to general season deer and elk
       hunting. Deer and elk hunting is only allowed by 1040 Deer or Elk Area permit holders.
    3. Added Any Deer permits for youth in selected GMUs.

                                       BLACK BEAR

GENERAL INFORMATION, MANAGEMENT GOALS, AND POPULATION
STATUS
Black bears occur mainly in the foothills and forested areas of District 3, but population densities
vary among GMUs. The highest densities of bears occur in GMUs 154 (Blue Creek) and 162
(Dayton).

District 3 consists of GMUs that are part of the Blue Mountains Black Bear Management Unit 8
(BBMU 8), which is one of nine BBMUs defined by WDFW. Currently, allowing for a general
bear season during the fall and controlled permit numbers during the spring has maintained
harvest metrics within parameters identified by WDFW as reflective of a healthy bear
population. The metrics used to direct black bear harvest include the proportion of harvested
female bears (no more than 35-39 percent of harvest), the median age of harvested females
(range no younger than 5-6 years), and the median age of harvested males (range no younger
than 2-4 years).

WDFW does not conduct surveys to monitor trends in black bear population size. Instead, we
use trends in harvest data as surrogates to formal population estimates or indices. Currently,
black bear populations are believed to be stable in District 3. Because we use the age of harvest
as a management metric, we want to remind hunters that it is required that a premolar tooth
be submitted. Tooth envelopes can be obtained by calling a regional office or stopping in at one
of the district offices (best to call ahead as these offices aren’t staffed full-time), which may be
available to help with tooth extraction as well.

WHAT TO EXPECT DURING THE 2020 SEASON
Although there are hunters who specifically target black bears, most bears are harvested
opportunistically during general deer and elk seasons. Consequently, annual harvest can vary
quite a bit from one year to the next and overall hunter success is quite low. Since 2001, hunter
success in District 3 has averaged just 6 percent and has never been higher than 9 percent.
However, hunter success is likely higher for those hunters who specifically hunt bears versus
those who buy a bear tag in case they see one while they are deer or elk hunting.

27 | P a g e
Overall, there has been no trend in annual bear harvest during the general bear season in District 3, with harvest generally fluctuating between 75 and 100 bears, excluding a few outliers. 2011 was a relatively poor year, with 66 bears harvested, but harvest rebounded during the 2012 and 2013 seasons before dropping off again in 2014 to 62 bears (Figure 8). With annual fluctuations in hunter numbers, some index of harvest per unit effort is generally a better indicator of harvest trends. Figure 4 shows the number of hunter days per bear harvested, which also does not show any consistent trend. At the GMU level, most bears will be harvested in GMUs 154 (Blue Creek) and 162 (Dayton) (Figure 5). Harvest numbers during 2010, 2014, and 2017 seasons compared to long-term (10- year) and short-term (5-year) averages were lower in both GMUs 154 and 162, but the yearly District harvest does not show any identifiable trends (Figure 4) other than there have been very few low harvest years back-to-back. This was again highlighted by the rebound in 2012 after the low 2011 harvest, in both the 2015 and 2016 harvests after the low 2014 harvest, and again in 2018 after the low 2017 harvest. Based on general long-term stability in District 3 bear harvest, hunters should expect similar harvest and success rates during the 2020 season. We may see some change in the harvest dynamic over time with the new regulation of a 2-bear limit and the increase in spring permits in several GMUs. Figure 4. Trends in the number of male and female black bears and total number of bears harvested during the general bear season, and an index of hunter effort (hunter days/bear harvested) in District 3, 2010–2019 (the sex of harvested bears is not available for 2011). 28 | P a g e
HOW TO LOCATE AND HARVEST A BLACK BEAR
Scouting is an important factor that hunters should consider when specifically hunting for black
bears in District 3. Although black bears are extremely common and occur in some areas at very
high densities, they are seen infrequently because they generally limit their time in the open to
cooler times of the day and move into thick vegetation in draws and creek bottoms.

Black bears can occur in a variety of habitat types so it can be difficult to narrow down where to
search for them. Hunters should focus their efforts early and late in the day in more open terrain
(e.g. south-facing slopes). In September, bears can spend a considerable amount of time in the
lower elevations of the Blue Mountain foothills in search of fruit that has ripened in the riparian
areas and around old homesteads.

Bears can often be located along riparian corridors that contain a large number of berry-
producing shrubs, including creeping blackberries and elderberries, or along north-facing slopes
with salmonberries, huckleberries, and blackberries. Spring permit holders should look below the
snow-line on south-facing slopes that get early green-up of wild onions and other vegetation and
near springs or wet areas with green aquatic vegetation. During the fall, hunters will generally
find bears foraging across open slopes dissected by shrubby draws early in the day. Also, hunters
should check riparian areas that may still have berries or rose hips, and hike through them to see
if there is any bear sign. If fresh sign is found, odds are a bear is frequenting that area. If hunters
are patient and sit for extended periods of time watching open areas in these riparian patches and
corridors, they may get a chance to harvest a bear. Patience is the key.

NOTABLE HUNTING ALERTS
Beginning in 2019, bear hunting season dates in District 3 were standardized to an August 1
opener running until November 15 to conform to new statewide standard opening and closing
dates. In addition, the 2-bear harvest limit was extended statewide. Hunters are still only allowed
one bear on their spring bear permit but can harvest an additional bear during the fall season, or 2
bears in the fall if unsuccessful during a spring hunt.

29 | P a g e
Figure 5. The number of bears harvested in each GMU during the 2010-2019 general black bear season
in District 3.

                                          COUGAR

GENERAL INFORMATION, MANAGEMENT GOALS, AND POPULATION
STATUS
Cougars occur throughout District 3, but densities likely vary among GMUs, with higher
densities where shrub and forest cover make up a larger portion of the unit. Cougar populations
in District 3 are managed with the primary objective of maintaining stable adult territories and
population by limiting the harvest of adult cougars to approximately 12-16 percent of the cougar
population. Beginning in 2012, WDFW has continually adjusted the way it manages cougar
harvest in Washington. The biggest change was shifting away from using season length or permit
seasons to manage the number of cougars harvested, and instead using a standard liberal season
coupled with harvest guidelines. The intent was to have a longer season, without any weapon
restrictions, and only close cougar seasons in specific areas if harvest reached or exceeded a
harvest guideline.

To accomplish harvest goals, WDFW established a series of hunt areas, each with its own
harvest guidelines and with standard season dates of Sept. 1 through April 30. Harvest
guidelines do not affect cougar hunting seasons until harvest numbers are evaluated
starting January 1. At that point, any hunt area that meets or exceeds the harvest guideline may
be closed, depending on the age and sex composition of the harvest. If hunters plan on hunting
cougar after January 1, they must confirm that the cougar season is open in the area they plan to
hunt. Harvest guidelines for each hunt area located in District 3 are provided in Table 4.

30 | P a g e
In April 2020, the Fish and Wildlife Commission adopted higher harvest guidelines for cougars
based on local harvest data instead of a Statewide average density estimate to calculate available
opportunity, while still meeting the Game Management Plan (GMP) goals. Social stability is one
goal stated in the GMP, which is maintained by adult territorial cougars. Based on this, only
adult cougars (greater than 24 months of age) will count towards the harvest guideline in the
coming years. It is unclear at this time if the harvest will change significantly under these new
guidelines. Most harvest occurs during the fall big game seasons during the open season, which
was not changed in 2020. The expectation of this change is that the winter season (Jan 1-Apr 30)
should remain open in 4 out of every 5 years, allowing for good snow tracking conditions for
hunters specifically targeting late-season cougars and potentially resulting in a higher harvest
than observed in past years.
For more information related to the new harvest guidelines management approach, please visit
WDFW’s website.
Table 4. Harvest guidelines and 2019-2020 harvest for the three cougar hunt areas located in District 3.
Harvest from 2019-2020 was managed under a lower harvest guideline than will apply in 2020-2021.
Under the new guideline, units in the Blue Mountains would not have closed during the late season with
the 2019-2020 level of harvest.
2020-2021 2019-2020
Hunt Area Harvest Guideline Harvest
145, 166, 175, 178 6-7 5 (closed Jan 1)
149, 154, 162, 163
7-9 6 (closed Jan 17)
169, 172, 181, 186 1 (Did Not
5-6
Close)
WHAT TO EXPECT DURING THE 2020 SEASON
Cougar harvest in District 3 has been variable over the years, with the average since 1990 of 16
cougars and a range between a low of seven and a high of 33. However, in 17 out of the last 25
years, the range has been between 12 and 20 cougars harvested. Since 2001, the number of
cougars harvested in District 3 has averaged 14 cougars, and sub-adults typically dominate the
harvest. With the yearly variation, it is hard to predict future harvest, but cougar sightings in the
District continue to be fairly common and there is no reason to suspect much change in the
harvest. Under the new harvest management guidelines, it is much less likely for all hunt areas to
close by the January 1 evaluation period, but hunters interested in a cougar harvest in any of
these GMUs should still plan on taking advantage of good cougar tracking conditions prior to
January.
31 | P a g eYou can also read