Response of benthic invertebrate assemblages to seasonal and habitat condition in the Wewe River, Ashanti region (Ghana)
←
→
Page content transcription
If your browser does not render page correctly, please read the page content below
Open Life Sciences 2021; 16: 336–353
Research Article
Samuel K. Oppong, Collins Ayine Nsor*, Gabriel Kwabena Buabeng
Response of benthic invertebrate assemblages to
seasonal and habitat condition in the Wewe
River, Ashanti region (Ghana)
https://doi.org/10.1515/biol-2021-0040 functional state of the Wewe River, with the need to con-
received December 14, 2020; accepted February 11, 2021 sider the proposed conservation interventions indicated in
Abstract: Aquatic macro-invertebrates play a vital role in this study.
the food chain of river ecosystem at several trophic guilds Keywords: benthic invertebrates, stream condition, geo-
and consumer levels, and are used as biomonitoring tools metric series, rarefaction, Hill numbers, canonical corre-
for aquatic ecosystem health. However, hydrologic con- spondence analysis, Wewe River
ditions of these ecosystems have been severely altered
because of the increase in urban development and agri-
cultural expansion. This study examined benthic inverte-
brate response to processes that structure their community 1 Introduction
in the Wewe River, segmented into intact, medium, and
severe condition zones. We sampled in 100 stations in a Aquatic macro-invertebrates play an important role in
period of 4 months in the wet (June–September, 2019) the food chain of an ecosystem at several trophic guilds
and 3 months in the dry (January–March, 2020) seasons. and consumer levels, and thus reflect ecosystem health
Geometric series, rarefaction, and Hill numbers models [1]. Within the aquatic environment, macro-invertebrates
were used to quantify invertebrate assemblages, while range across a diverse range of microhabitats, with their
ordination technique, canonical correspondence ana- diversity increasing in areas that provide abundant and
lysis, was used to evaluate the influence of predictive diverse resources [2]. Their diversity and abundance are
factors on their assemblages. A total of 2,075 individuals significant community attributes that are controlled by a
belonging to 20 family taxa were registered. There was variety of mechanisms at different spatial scales [3].
no significant difference in benthic assemblages between These environmental variables, which tend to influence
the dry and wet seasons. Predictive factors accounted their distribution and abundance, have been documented
for 47.04 and 50.84% variances, respectively. Taxa dis- by a number of studies [3,4]. A good association among
tribution patterns differed significantly only in the severely macro-invertebrate assemblages [3], which include che-
disturbed zone during the wet season. Neptidae, Libellulidae, mical variables [5,6], organic energy base [7], and habitat-
and Chironomidae were the most abundant taxa, indi- related physical factors such as substrate composition
cating their broad range habitat preference and their ability [8], elevation and stream size [9,10], vegetation, geology,
to adapt to seasonal changes. Asellidae and Perlidae were and human land use [11,12], and temperature [10,13,14],
the least detected, suggesting their sensitivity to elevated has been documented as the factors influencing macro-
levels of some water quality parameters. The findings high- invertebrate community assemblages. Other studies point
light the threats to the benthic community and overall to hydrologic conditions as the key driving forces affect-
ing distribution and abundance patterns of benthic inver-
tebrates [15–17]. For instance, studies on the hydro-climatic
* Corresponding author: Collins Ayine Nsor, Department Forest, trends and variability over the Black Volta in Ghana suggest
Resources, Kwame Nkrumah University of Science and Technology, an increase in warming trends [18], and this phenomenon
Kumasi, Ghana, e-mail: ayineus@yahoo.com, equally has the potential to impact on benthic invertebrate
cansor.canr@knust.edu.gh
assemblages.
Samuel K. Oppong, Gabriel Kwabena Buabeng: Department of
Wildlife and Range Management, Faculty of Renewable Natural
Changes in benthic invertebrate distributions caused
Resources, Kwame University of Science and Technology, by river regulation may occur because of altered habitat,
Kumasi, Ghana flow patterns, sediment input, water quality, and thermal
Open Access. © 2021 Samuel K. Oppong et al., published by De Gruyter. This work is licensed under the Creative Commons Attribution 4.0
International License.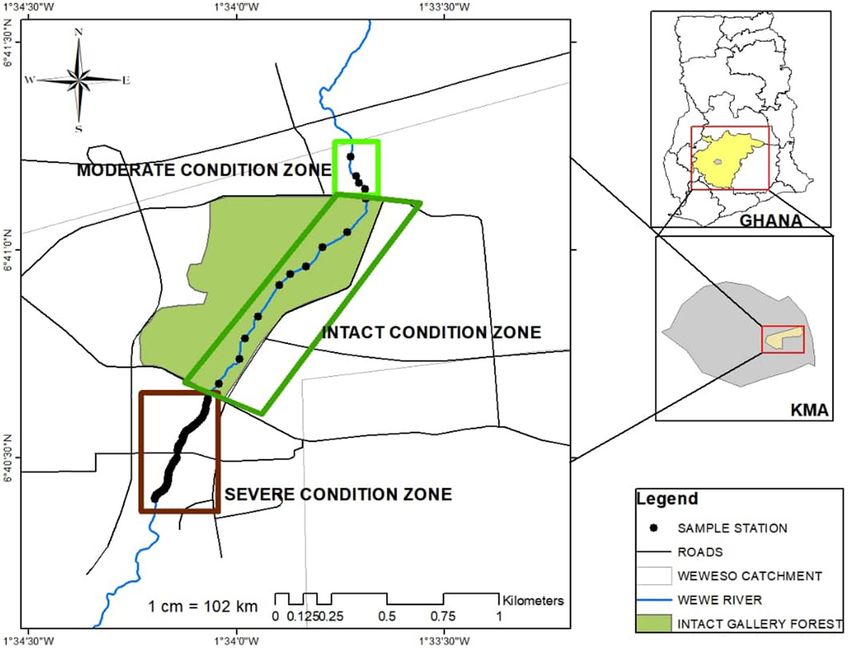
Benthic invertebrate assemblages’ response to seasonal and habitat condition 337
regimes [2,6]. Apart from these aforementioned drivers, differences in benthic diversity among the three condi-
yearly variations in seasons can be a factor that signifi- tion zones of the Wewe River? (3) What processes struc-
cantly affect the hydrologic regime and geomorphology tured benthic assemblages among the three condition
in stream environments, by determining the distribution zones of the Wewe River? We hypothesized that (a)
and abundance [12]. For example, a wet season low and a benthic invertebrate assemblages will differ between sea-
dry season high are expected for periodic seasonal pat- sons, in terms of both taxonomic diversity and number of
terns in abundance, depending on the frequency and individuals, because benthic invertebrates have the capa-
intensity of summer monsoon rainfall [3]. city to recover rapidly from extreme drought periods [31];
Streams and rivers in urban centres worldwide have (b) physicochemical drivers like dissolved oxygen (DO),
been severely polluted because of increase in urban total dissolved solids (TDS), electrical conductivity (EC),
development [19,20]. In Ghana, rivers draining through surface water temperature, salinity, mercury content,
urban centres have underwent a significant transforma- water depth, stream flow (slow, medium, and fast), and
tion because of agricultural expansion and infrastructural substrate composition that structure benthic invertebrate
development [21–24]. These threats could potentially communities will vary in the wet and dry seasons,
impact on benthic invertebrate habitat quality, with a because seasonality tends to directly influence physico-
probable effect on their abundance, diversity, and spatial chemical drivers.
distribution. Scientific studies on macrobenthic inverte-
brates among urban rivers of Ghana remain poor, com-
pared with extensive studies in similar areas in North
Africa [25–27] and South Africa [28,29]. The few studies 2 Materials and methods
in Ghana’s freshwater systems have focused on hydrocli-
matic trends [18] and safe use of ground water [30]. The
2.1 Study area
Wewe River is one of the few urban systems that drains
through patches of the urban forest reserve in the Kumasi
The study area is a suburban forest reserve in the Kumasi
Metropolitan Area of Ghana. However, there have been
Metropolis of Ghana and surrounded by communities
concerns in recent times on the increasing level of human-
like Ayigya, Weweso, Bomso, Gyenyasi, Kentikrono, and
led disturbances, namely farming activities, sewage dis-
Ahinsan. Farming along the fringes of the river occurs
posal, tree felling, and bushfire [24].
year round. Waste water from nearby settlements and
Given the lack of scientific information about benthic
farm waste equally drains into the river course through
invertebrates’ status in the Kumasi Metropolitan Area, it
direct channel connectivity. Wewe River is a typical unre-
is not clear how these disturbance-related drivers have
gulated system and takes its source from mountains near
directly influenced physicochemical parameters and the
Aboabo Nkwanta and flows for about 8.125 km southwest
consequent effect on benthic invertebrates. Furthermore,
towards Abirem and Weweso [32]. The river is located
because of their sensitivity to aquatic environments, benthic
between N 06°41′30.1″, W 001°33′74.4″ and N 06°40′
invertebrates are widely considered as good indicators of
32.9″, W 001°34′20.9″ (Figures 1 and 2). Soil is typically
water quality [14], by aiding in the identification of anthro-
heavy clay to loamy, characterized by cobbles and boulders.
pogenic disturbances [1]. Thus, understanding how current
The rock type is igneous and metamorphic rocks, with undu-
water physicochemical parameters impact on benthic inver-
lating topography. The average temperature is 24–34°C p.a.
tebrate assemblages is critical in choosing the appropriate
and generally humid. Rainfall pattern is typically bimodal,
conservation measures that will help restore the ecological
with annual average of 2,000 mm p.a. [33]. The study was
integrity of Wewe River health. Secondly, the study on diver-
conducted in a period of 4 months in the wet (June–Sep-
sity and distribution patterns of benthic invertebrates and
tember, 2019) and 3 months in the dry (January–March,
how they are influenced by physicochemical drivers are
2020) seasons, spanning a total of 7 months.
vital, because these organisms are used to track changes
in the biological integrity of ecosystems [2].
In this paper, we assessed seasonal response of
benthic invertebrate to physicochemical parameters in 2.2 Classification of the sampling sites on
the Wewe River. To achieve this broad aim, we sought the riparian zone
to answer the following objectives: (1) Are there varia-
tions in the abundance and distribution patterns along We initially demarcated the upstream, midstream, and
the three condition zones of the Wewe River? (2) Are there downstream of the Wewe River into three condition zones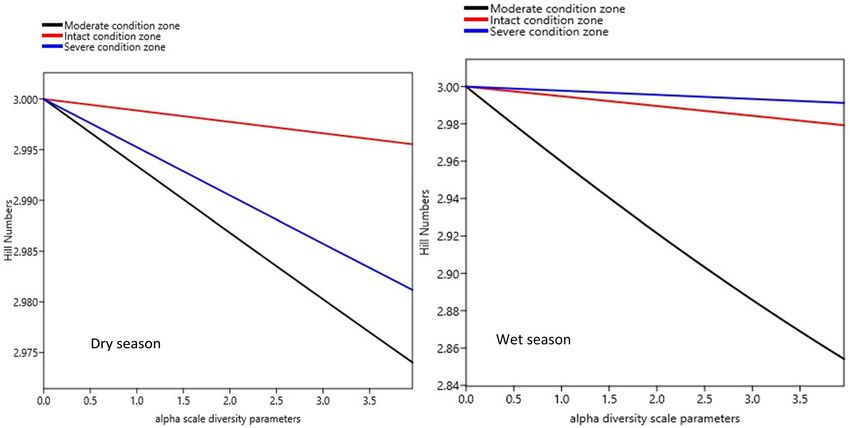
338 Samuel K. Oppong et al.
Figure 1: Map of Ghana, showing the study area in the Kumasi Metropolitan Area (Ashanti Region).
(i.e. intact, moderate, and severe condition zones, fol- and 15. Thus, intact condition class (10–15): areas domi-
lowing the Riparian Quality Index (RQI) methods). The nated by different vegetation strata that cover the full
river course was classified into three condition zones, length of the segment, which is linked to natural fluvial
because it is surrounded by a forest reserve, with some forms and slightly fragmented; moderately disturbed con-
disturbance along the riparian zone, which could have a dition class (7–9): areas with vegetation cover nearly half
direct influence on the water quality and consequently on of the study zone being disturbed; 1–3 m active channel
benthic community structure. The index ranges from 1 width and about 10–30% exotic and ruderal species
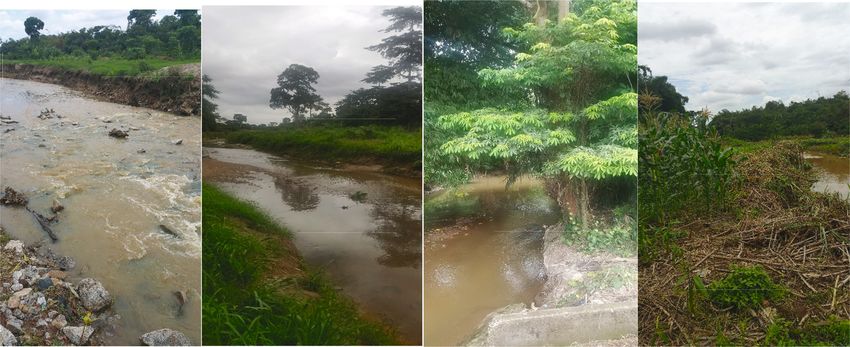
Severely disturbed zone (Downstream) Intact zone (Midstream) Moderately disturbed zone
(Upstream)
a1 a2 b c
Figure 2: Photographs of some segments of the unregulated Wewe River, where the study was conducted during the wet (June–September,
2019) and dry (January–March, 2020) seasons. a1 & a2 represent the severely disturbed zone (downstream of the river), b = intact zone
(river midstream) and c = moderately disturbed zone (river upstream).Benthic invertebrate assemblages’ response to seasonal and habitat condition 339 present; severely disturbed condition class (1–6): areas keys provided by Guide to Freshwater invertebrates [36] where 60% of the riparian corridor is reduced by human- and Asian stream guide for identification [37]. Voucher led activities; vegetation covering
340 Samuel K. Oppong et al.
Objective 2: Are there differences in benthic richness significant difference in invertebrate assemblages (abun-
and diversity among the three condition zones of the dance, richness, and diversity) across the three condition
Wewe River? zones and the physicochemical drivers. Student’s t-test
was performed to determine seasonal variability among
invertebrates’ families and physicochemical drivers. Where
2.5.2 Analyses of benthic richness and diversity significant difference was detected, we further used Tukey’s
HSD post hoc test to determine the habitats that differed.
Individual-based rarefaction model [43] was performed Spearman’s rank correlation test was performed to eval-
to determine invertebrate richness. The rarefaction curve uate the significant relationship among physicochemical
( fn ) is defined as follows: drivers. All the analyses were performed using PAST
−1 k
ver. 3.18 Package [57].
fn = E[Xn] = K − N
n ( ) ∑ ( N −n Ni) …,
i=1
(1)
where Xn = the number of groups still present in the
subsample of “n” less than K whenever one group is 3 Results
missing from this subsample, N = total number of items,
K = total number of groups, and Ni = total number of 3.1 Seasonal trends in benthic invertebrate
items in group i (i = 1,…, k ) [42]. Rarefaction methods
composition and individual abundance
(both sample and individual-based) allow for a suitable
standardization and comparison of datasets with dif-
across the three condition zones
ferent sampling effort [44] and have been used on inver-
A total of 2,075 individuals belonging to 20 benthic inver-
tebrate richness analyses [45–47].
tebrate families were registered in the dry (n = 693) and
Finally, invertebrate diversity was quantified using
wet (n = 1,382) seasons and among the habitat condition
Hill numbers [48–52]. We used Hill numbers because
zones (Figure 3). Variations among mean individuals
they incorporate relative abundance and species richness
were substantial in the dry (F2,33 = 63.56, P < 0.0007)
in diversity analysis [49] and defined as follows:
and wet (F2,48 = 73.86, P < 0.0001) seasons (Figure 4a
1 /(1 − q)
S and b). Considerable variations among mean number of
q
D = ∑ piq , (2)
individuals in the dry season were observed between the
i=1
moderate and severe (P < 0.0003, Tukey’s post hoc test)
where S is the number of species in the assemblage, and and intact and severe condition zones (P < 0.0001),
the ith species has relative abundance pi, i = 1, 2,..., S. whereas during the wet season, it was between the mode-
rate and severe condition zones (P < 0.0007) and intact
Objective 3: What processes structured benthic and severe condition zones (P < 0.0006). Although we
assemblages among the three condition zones of the detected more family taxa in the wet season (n = 17) than
Wewe River? the dry season (n = 12), mean seasonal variations were
not substantially significant (Student’s t-test = −0.329,
P = 0.75) (Figure 5). From individual condition zones,
2.5.3 Analysis of benthic taxa-physicochemical driver
1200
Taxa abundance per condion zone
relationship
1000
Canonical correspondence analysis (CCA) was used to 800
evaluate the influence of predictive factors on benthic 600
assemblages [53]. CCA is a direct ordination method, 400
with the resulting product being the variability of the
200
physicochemical drivers and benthic invertebrate data
[54]. A ridge regression was performed to remove multi- 0
Moderate condion zone Intact condion zone Severe condion zone
collinearity (i.e. perfect correlation with other predictive
Dry season Wet season
factors, which tend to inflate variances of the parameter
estimates) [55,56]. Mixed ANOVA test (a parametric tech- Figure 3: Comparison of seasonal abundance among the three
nique) or split-plot ANOVA was used to test for a conditions in Wewe River.Benthic invertebrate assemblages’ response to seasonal and habitat condition 341
(a)
Benthic Dry season
df = 2, F2,33 = 63.56, P < 0.0007
Mean no. of benthic families per
4.5
4
3.5
condion zone
3
2.5
2
1.5
1
0.5
0
Moderate condion zone Intact condion zone Severe condion zone
(b)
5
Benthic Wet season
Mean no. of benthic families per
4
df = 2, F73.86 = 3.512, P< 0.0001
condion zone
3
2
1
0
-1
Moderate condion zone Intact condion zone
Severe condion zone
Figure 4: (a and b) Variations in mean composition of benthic families in the Wewe River in the dry and wet seasons. Notice that
Chironomidae was the most dominant family across the three habitat condition zones of the river in the wet season.
the upstream of the river which constitutes the moderate
Mean no. of benthic families per site
80
condition zone recorded the highest mean number of indi- 70
Student t-test = -0.33, P = 0.75
viduals per family taxa in the dry (3.25 ± S.E. 0.85) and wet 60
seasons (2.25 ± S.E. 1.3), while the lowest number was 50
registered in the severe condition zone (downstream) dur- 40
ing the dry season (0.25 ± S.E. 0.05) and intact condition 30
zone in the wet season (0.22 ± S.E. 0.22) (Figure 4a and b). 20
10
0
Moderate condion zone Intact condion zone Severe condion zone
3.2 Benthic family distribution patterns in Dry season Wet season
the three condition zones Figure 5: Variations in the seasonal composition of benthic inverte-
brate along the riverine continuum. Notice that benthic inverte-
We found in all cases that invertebrate family abundance brates were generally higher in the wet season than the dry season.
distribution among the three habitat condition zones Means are not significantly different.342 Samuel K. Oppong et al.
fitted well in the GS model (Figure 6). However, compar- Table 1: χ2p goodness of fit for the GS model for the abundance rank
ison between the dry (C.V. = 52.38%) and wet (C.V. = distribution of benthic invertebrate, calculated for all three segments
35.84%) seasons revealed that invertebrates were not sig- of the Wewe River in the dry and wet seasons. The variable α deter-
mines the shape of the distribution
nificantly distributed (Z = −0.517, P = 0.61, Fligner Kileen
test for equal C.V.) (Figure 5). Individual segments of the
River segments α χ²P-value for GS P-level
Wewe River showed that taxa abundance distribution
along the curves was not significantly different in the Dry season
Moderate 0.084 2.69 0.98
moderate (χ²P = 2.69, P < 0.98), intact (χ²P = 2.49, P <
Intact 0.112 2.49 0.99
0.99), and severely disturbed (χ²P = 5.15, P < 0.88) con- Severe 0.098 5.15 0.88
dition zones in the dry season (Figure 6, Table 1). Simi- Wet season
larly, in the wet season, there was no substantial difference Moderate 0.114 0.43 0.90
in the moderate (P < 0.901) and intact (P < 0.99), with the Intact 0.096 4.76 0.99
exception of the severely disturbed condition zone (χ²P = Severe 0.105 75.81 0.0004***
75.81, P < 0.0004) (Figure 6, Table 1). Significance of P-values: *P < 0.05, **P < 0.01, ***P < 0.0001.
Of the 20 benthic families registered, Libellulidae
(n = 78), Odontopygidae (n = 73), and Baetidae (n = 72)
were the highest ranked on the abundance distribution In the wet season, Neptidae (n = 130, 9.4%), Libellulidae
curve and were widely distributed across the three con- (n = 112, 8.1%), and Chironomidae (n = 109, 7.9%) were
dition zones, during the dry season (Figure 6, Table 2). the highest ranked invertebrate families in all three
Rarer orders such as Notonemouridae (n = 37, 5.3%), condition zones, while Asellidae (n = 17) and termitidae
Dytiscidae (n = 40, 5.7%), and Perlidae (n = 42, 6.0%) (n = 45) were the least ranked and infrequent taxa, whose
were the least ranked in the moderate and intact condi- distribution occurred in narrow ranges in the three con-
tion zone, reflecting their sensitivity to habitat perturbation. dition zones (Figure 6). These benthic families consti-
Overall, the severely disturbed condition zone supported tuted 1.2 and 3.2%, respectively, of the total number of
the most abundant family taxa. invertebrates sampled.
Figure 6: GS model for benthic families rank abundance distribution across the three condition zones in the dry and wet seasons, on the
Wewe River. Abundance is based on cumulative count values per sample zone. Notice that benthic families are ordered in decreasing
magnitude and plotted against their corresponding rank.Benthic invertebrate assemblages’ response to seasonal and habitat condition 343
Table 2: Summary of individual benthic invertebrates recorded in the 3.3 Benthic invertebrate richness and
dry and wet seasons, along the three condition zones, in the Wewe diversity along the Wewe Riverine
River. N = 100 sample plots
system
Macro- Total number of individuals Total
invertebrate Seasonal variations in taxa richness were not significant
Moderate Intact Severe
families (Student’s t-test = 4.335, P < 0.62), although the number
condition condition condition
zone zone zone
of benthic families appeared more in the wet season
(n = 17) than in the dry season (n = 12) (Figure 7). Gen-
Dry season
erally, the severe condition zone was the richest in family
Baetidae 7 10 55 72
Chironomidae 4 7 53 64
taxa, while the moderate condition zone was the poorest.
Corydalidae 4 12 23 39 Libellulidae was more dominant in the intact (mid-
Dytiscidae 5 6 29 40 stream) and severe (downstream) condition zones during
Gerridae 4 6 47 57 the dry season, while Neptidae was dominant in all three
Hydropsychidae 4 6 60 70 condition zones in the wet season (Figure 7). Observed
Libellulidae 6 14 58 78
variability in taxa richness and abundance distribution
Notonemouridae 6 9 22 37
Odontopygidae 7 2 64 73 patterns across the three segments of the Wewe River
Perlidae 4 9 29 42 reflected in their diversity profile and ranked from higher
Protoneuridae 5 9 49 63 to lower diversity indices along the alpha (a) scale values
Termitidae 13 8 37 58 (Figure 7). Condition zone with shallow curve is the most
Total 69 98 526 693
diverse and highest ranked, while those with steep curves
Wet season
Asellidae 4 6 7 17
are the least diverse and found at the bottom of the Hill
Baetidae 5 13 76 94 number diversity profile.
Belostomatidae 2 12 78 92 Diversity generally did not differ significantly between
Calopterydae 2 6 78 86 the dry (F2,6 = 0.0461, P = 0.65) and wet (F2,6 = 1.06, P =
Carabidae 2 8 85 95 0.40) seasons, and ranged as qD = 2.974–2.996 in the dry
Chironomidae 10 5 94 109
and wet seasons (Figure 8, Table 3). However, from indi-
Dytiscidae 6 13 59 78
Ephemeridae 3 14 65 82 vidual condition zones, we found the intact condition
Gerridae 2 2 70 74 zone (midstream of the river in red colour) (qD = 2.996)
Gomphidae 2 16 80 98 and the severe condition zone (downstream of the river,
Hydropsychidae 5 5 80 90 in blue colour) (qD = 2.991) to be the most diverse in the
Lestidae 9 12 58 79
dry and wet seasons, respectively (Figure 8, Table 3).
Libellulidae 4 8 100 112
Neptidae 12 13 105 130
Invertebrate diversity appeared similar in the different
Perlidae 7 16 28 51 condition zones, suggesting similar patterns in spatial
Platycnemididae 7 8 35 50 evenness distribution. The moderate condition zone
Termitidae 3 15 27 45 (upstream of the river) was consistently least diverse in
Total 85 172 1,125 1,382 the dry (qD = 2.974) and wet (qD = 2.854) seasons. The low
diversity in the moderate condition zone appears to
reflect in its lowest abundance of individuals in both
seasons as well (Figure 8, Table 2).
Observation from individual condition zones revealed
that the abundance and widespread distribution of benthic
taxa occurred in the severely disturbed condition zone
during the dry and wet seasons, thus reflecting their broad 3.4 Seasonal environmental influence on
range tolerance to varying physicochemical concentrated benthic community structure across the
levels. Comparison of invertebrate abundant distribution three condition zones in the Wewe River
for the three condition zones distinguishes them in rela-
tion to the influence of predictive factors. Thus, the shape The matrices of the invertebrate-site biplot generated by
of the rank abundance curves generally showed differ- CCA showed DO (r = 0.54, P < 0.01) and surface water
ences in invertebrate relative dominance and spatial dis- temperature (r = 0.31, P < 0.05) on Axis I, and total dis-
tribution from individual sample stations. solved solids (r = 0.32, P < 0.05) and EC (r = 0.32, P < 0.05)344 Samuel K. Oppong et al. Figure 7: Standardized comparison of benthic invertebrate richness for individual-based rarefaction curves. The data represent summary counts of benthic invertebrates that were recorded from the three condition zones of the Wewe River. The rarefaction curves were calculated from equation (3) (Gotelli and Colwell, 2001), with a 95% confidence interval. The dotted vertical lines illustrate family richness comparison standardized to 69 (dry season) and 85 (wet season) individuals, which was the observed abundance in the upstream of the three segments benthic data set. The average of these individual curves represents the statistical expectation of the species accumulation curve for that particular sample drawn on re-orderings, and the variability among the different orderings is reflected in the specific variance (conditional) in the number of families recorded for any given number of individuals. on Axis II, as the major physicochemical drivers of variability in physicochemical drivers was equally not sig- benthic invertebrate assemblages among the three con- nificant (Student’s t-test = −0.033, P < 0.97). dition zones in the dry season (Figure 9a and b; Tables 4 In the dry season, Hydropsychidae and Chironomidae and 5). Whereas in the wet season, EC (r = −0.63, P < correlated positively with optimal levels of surface water 0.01)), TDS (r = 0.43, P < 0.05), and SS (r = 0.31, P < temperature (r = 0.31, P < 0.05) and EC (r = 0.32, P < 0.05) 0.05) on Axis I and Mercury (r = 0.42, P < 0.05) and pH in the severe condition zone (DOW = downstream), along (r = 0.38, P < 0.05) on Axis II were found to influence the Axes I and II (upper left of the CCA diagram). On the community structure of benthic invertebrate (Figure 10; lower left of the ordination diagram, Libellulidae, Tables 4 and 5). The first two axes in the dry season (Axes Odontopygidae, and Gerridae were negatively associated I = 31.28%, II = 19.56%) accounted for 50.84%, while the with total dissolved solids (r = −0.32, P < 0.05) and DO wet season totaled 47.04% (Axes I = 38.63%, II = 15.41%) (r = 0.54, P < 0.05) on Axes I and II (Figure 9a and b, of variations in the weighted averages of the 14 inverte- Table 5). These sections of the river bed were character- brate families in relation to six physicochemical drivers ized by cobble-gravel, boulders, and a high flow rate. (Table 5). Physicochemical drivers did not differ among Intercorrelation between DO and suspended solids (SS) the three condition zones of the Wewe River in the dry (rs = 0.76, P < 0.01) may be an effect of the high flow rate, (F2,18 = 0.0026, P < 0.99) and wet (F2,18 = 0.044, P < 0.95, causing oxygen to dissolve in the water, and simulta- one-way ANOVA test) seasons. Furthermore, seasonal neously carrying floating debris (Figure 9a and b, Table 6).
Benthic invertebrate assemblages’ response to seasonal and habitat condition 345
Figure 8: Seasonal trends in benthic invertebrate diversity among the three condition zones, in the Wewe River. Shallower curves reflect
high diversity (top of the curves), while steeper curves indicate less diversity (bottom of the curves). Notice that the midstream (intact zone
and top red curve) is the most diverse in the dry season, while the downstream (severe condition zone and top blue curve) is the most
diverse during the wet season.
Table 3: Summary of Hill’s number diversity order (at q = 0, 1, and 2), moderate (MID – midstream) and severely disturbed (DOW –
along the three condition zones, in the Wewe River. The order q is downstream) condition zones. The least abundance of Noto-
mathematically unified family of diversity indices differing among nemouridae (n = 9) and Corydalidae (n = 9) in these two
themselves only by an exponent q and indicates their likelihood to
zones was largely linked to the influence of EC on Axis II
include or ignore the relatively rarer species (Hill, 1973). Thus, q = 0
represents the number of species in the sample (richness index), (Figure 9a and b). Taxa found at the middle of the CCA
q = 1 the exponential of the Shannon–Weiner index, and q = 2 diagram (i.e. Baetidae and Dytiscidae) appeared to exhibit
the reciprocal of the Simpson’s index (i.e. equivalent number of broad tolerance to average levels of all physicochemical dri-
species) vers assessed in the three condition zones of the Wewe River.
In the wet season, we observed that increased level of
Alpha values Moderate Intact Severe
mercury (r = −0.42, P < 0.05) and EC (r = −0.63, P < 0.01)
condition condition condition
on Axes I and II contributed to the low abundance
zone zone zone
of Asellidae, Perlidae, and Platycnemididae, located
Dry season in the upper right hand of the ordination diagram.
0 (Number of sp.) 12 12 12
Similarly, the influence of weak to near-neutral pH
1 (exp[Shannon]) 10.082 10.627 10.169
2 (Inv.[Gini_Simpson]) 9.352 10.286 9.591 levels (r = −0.38, P < 0.05) partly contributed to high
Shannon_Evenness 0.916 0.966 0.924 abundance of Dytiscidae, Ephemeridae, and Lestidae.
Hill diversity numbers 2.974 2.2996 2.981 However, abundance of Termitidae (n = 3) was affected
Wet season by the near-neutral levels of pH, especially in the mod-
Alpha values
erately disturbed MID – midstream, condition zones
0 (Number of sp.) 17 17 17
1 (exp[Shannon]) 11.608 12.771 13.249
(Figure 10a and b, Table 5). The use of organophosphate
2 (Inv.[Gini_Simpson) 9.325 12.159 12.775 pesticides to control pest invasion on the nearby vege-
Shannon_Evenness 0.829 0.912 0.946 table farms and liquid waste discharge from human set-
Hill diversity numbers 2.854 2.979 2.991 tlement may have contributed to a decrease in DO con-
centration (lower left of CCA diagram), and this impacted
on Carabidae dominance. This was evidenced in the
On the lower right of the CCA diagram, we found that weak strong intercorrelation between mercury and DO (rs =
acidic pH levels appeared to affect the abundance of Per- 0.85, P < 0.01) (Figure 10a and b, Table 6). Widespread
lidae (n = 4, 5.7%) and Termitidae (n = 8, 11.6%) in the distribution of Libellulidae (n = 112) and Chironomidae346 Samuel K. Oppong et al. Figure 9: (a and b) CCA diagram showing the influence of physicochemical drivers on benthic invertebrate assemblages in the dry season. The first two axes (Axes I = 31.28 and II = 19.56) explained 50.9% of variations across the three condition zones in the dry season. The arrows represent each of the physicochemical drivers plotted pointing in the direction of maximum change of explanatory variables among the three habitats. Sample plot codes represent each of the three condition zones along the river course (i.e. DOW = downstream of the severe condition zone, MID = midstream of the intact condition zone, and UPS = upstream of the moderate condition zone). (n = 109) was found to strongly correlate with total dis- Hydropsychidae, on the upper left of the CCA diagram, solved solids (r = 0.43, P < 0.05) and SS (r = 0.31, P < 0.05), were within the tolerable range of surface water tempera- on Axis 1. Other taxa, namely Gerridae, Gomphidae, and ture in the severe condition zone (downstream).
Benthic invertebrate assemblages’ response to seasonal and habitat condition 347
Table 4: Summary of water quality parameters of the 100 sample stations, across the three condition zones of the Wewe River, in the dry
and wet seasons
Moderate condition zone Intact condition zone Severe condition zone
Dry season
Dissolved oxygen (mg/L) 4.6 ± 0.3 3.0 ± 0.2 5.0 ± 0.1
Total dissolved solids (ppm) 88.8 ± 0.6 90 ± 0.5 99 ± 1.2
Electrical conductivity (μS/cm) 329.5 ± 3.8 397.6 ± 4.8 357.6 ± 1.9
Water temperature (°C) 26.4 ± 0.7 27.9 ± 0.3 28.1 ± 0.1
Mercury (mm Hg) 738.1 ± 0.0 738.3 ± 3.3 738.7 ± 0.1
Suspended solids (mg/L) 177.8 ± 1.3 179.7 ± 0.9 185.5 ± 1.04
pH 6.2 ± 0.6 6.0 ± 0.4 5.9 ± 0.1
Wet season
Dissolved oxygen (mg/L) 4.5 ± 0.3 4.9 ± 0.3 5.0 ± 0.1
Total dissolved solids (ppm) 71.3 ± 2.2 57.7 ± 6.4 84.5 ± 1.1
Electrical conductivity (μS/cm) 499.4 ± 17.9 483.4 ± 44.9 169 ± 2.2
Water temperature (°C) 25.9 ± 0.4 26.2 ± 0.2 26 ± 0.1
Mercury (mm Hg) 739.6 ± 0.1 738.8 ± 1.4 739.4 ± 0.1
Suspended solids (mg/L) 199.5 ± 25.6 205.8 ± 8.9 238.3 ± 3.5
pH 6.6 ± 0.3 6.2 ± 0.4 5.3 ± 0.1
Table 5: Summary of CCA axis lengths for ground cover, showing term temporal variations in invertebrates among a
the levels of correlation between axes and physicochemical driver number of large rivers [62]. The findings in this study
gradients, percentage variance of benthic taxa and benthic taxa– showed that spatiotemporal changes in water quality in
physicochemical driver relationship
the severe condition might have contributed to highest
invertebrate diversity in the severe and intact condition
Dry season Wet season
zones, during the wet and dry seasons, respectively,
Axis I II I II and intact zone during the dry season. For instance, the
Canonical eigenvalue 0.184 0.041 0.109 0.035 high amount of DO concentration (4.9–5.0 mg/L) and the
% variance explained 31.28 19.56 38.63 15.41 optimal water temperature (26.1–28.1°C) in these two
No. of variables = 6 zones appeared to favour invertebrate abundance, rich-
Correlations ness, and evenness distribution (Table 4). Secondly, the
DO 0.538* −0.053 0.033 −0.013
presence of rarer taxa (e.g. Chironomidae, Dytiscidae,
TDS 0.071 −0.317* 0.425* −0.173
EC −0.026 0.324* −0.631** 0.031 Gerrida, and Odontopygidae), particularly in the intact
Temp. 0.314* 0.145 0.026 0.176 zone, probably contributed to highest diversity during
mm Hg 0.013 −0.004 0.133 −0.417* the dry season (Table 2). Diversity is considered as a
SS 0.082 −0.109 0.313* −0.003 composite index that combines proportional number of
pH 0.162 0.076 −0.075 0.377*
individuals, richness, and evenness distribution [49,63]
and have been widely used to measure the ecological
integrity of ecosystems worldwide. Apart from this com-
posite index for measuring diversity, the concept of spe-
4 Discussion cies rarity has widely been used to determine a species’
contribution to the diversity (represented by species’
number, abundance, and range area) [64].
4.1 Seasonal trends in benthic invertebrate Studies in an intermittent river in North Africa found
composition and abundance distribution similar variability in diversity of benthic invertebrate
pattern in the Wewe River community during the dry and wet seasons [25]. How-
ever, the high taxa richness in the wet season compared
Studies of seasonal dynamics in benthic invertebrate to the dry season contrast the findings of Grohs [61], who
communities among smaller lotic systems have been reported of higher total richness in macro-invertebrate in
reported by a number of ecologists [58–61]. Recently, summer and fall, compared with winter and spring in the
attempts have been made to examine seasonal or short- Missouri River. These differences may be because of348 Samuel K. Oppong et al.
Figure 10: (a and b) CCA diagram showing the influence of physicochemical drivers on benthic invertebrate assemblages in the wet season.
The first two axes (Axes I = 31.63 and II = 15.41) explained 47.04% of variations across the three condition zones in the dry season. The
arrows represent each of the physicochemical drivers plotted pointing in the direction of maximum change of explanatory variables among
the three habitats. Sample plot codes represent each of the three condition zones along the river course (i.e. DOW = downstream of the
severe condition zone, MID = midstream of the intact condition zone, and UPS = upstream of the moderate condition zone).
variations in seasonal habitat conditions in the two bio- benthic invertebrate communities are inextricably linked
geographical zones. to biotic and abiotic stream characteristics. However,
Higher taxa abundance in the wet season was thought Ramírez et al. [60] found increase in insect abundance
to coincide with the larval developmental stages and dif- in the dry season compared to the wet season, in tropical
fering responses of taxa to changes in water quality in the low land streams. The authors attributed this to annual
dry and wet seasons’ shift, which is largely driven by temporal changes in stream physicochemistry related to
seasonal-specific disturbances (i.e. intensity of farming rainfall, with subsequent changes in discharge.
practices mostly in the wet season) and changes in the Low abundance of taxa, especially in the moderate
physical environment of the Wewe River. Norris and and intact condition zones during the dry season, may
Thoms [65] argued that some points of the life cycle of occur due to the low levels of concentrated DO, related toBenthic invertebrate assemblages’ response to seasonal and habitat condition 349
Table 6: Summary of Spearman rank (rs) correlation matrix between the physicochemical drivers across the three habitats on the riparian
zone. A correlation above/below ±0.61 is significant at *** P = 0.001; ±0.45 at ** P = 0.01, and ±0.33 at * P = 0.05
Total dissolved solids Electrical conductivity Temperature Mercury Suspended solids pH
Dry season
Dissolved oxygen 0.04 0.135 0.232 0.723*** 0.765*** 0.854***
Total dissolved solids 0.011 0.595** 0.585** 0.051 0.486**
Electrical conductivity 0.061 0.034 0.746*** 0.679**
Temperature 0.026 0.094 0.146
Mercury 0.012 0.006
Suspended solids 0.738***
pH
Wet season
Dissolved oxygen 0.0003 0.031 0.033 0.848*** 0.001 0.090
Total dissolved solids 0.0004 0.005 0.056 0.014 0.344*
Electrical conductivity 0.003 0.087 0.255 0.038
Temperature 0.706*** 0.057 0.073
Mercury 0.430* 0.735***
Suspended solids 0.660**
pH
low water volume and flow rate (Figure 2, Tables 2 and 4). their broad range habitat preferences (i.e. ditches, muddy
Extreme dryness is a common phenomenon observed in sections of streams, and water area with dead leaves and
Ghana, during the peak of the dry season (i.e. January– twigs) (Figure 10a and b). Finally, the presence of the second
March). This seasonal phenomenon tends to increase most dominant taxa like Chironomidae and Libellulidae
evapotranspiration in many rivers and streams including equally suggests their ability to inhabit or adapt to different
the Wewe River where this study was conducted. Studies hydrologic conditions. Chironomidae and Libellulidae are
in North Africa have found low benthic taxa abundance known to exist in all freshwater wetland types and, are
to be common in many intermittent streams [25,66,67]. microhabitat selective and play a vital role in food webs
These streams are largely characterized by frequent absence [72]. Thus, their large populations are facilitated by the
of flow and insufficient water levels during peak flows high productivity of freshwater wetlands [72]. Other studies
[25,66,67]. These unstable environmental conditions have also revealed that Chironomids are also known to be tolerant
the tendency to influence water temperature variability and to disturbances [70,71]. In coastal rivers of southeast Ivory
which may in turn affect smaller instars of insects, ionic Coast (a neighbouring country on the western border of
concentration, and pH [25]. With air temperature projected Ghana), Edia et al. [73] found Chironomidae among the
to increase (2.5°C) over most parts of Africa by the end of the richest taxon diversity in slightly disturbed environment.
twenty-first century [68], water temperature is likely to Thus, Chironomids could be used as an indicator of severe
increase. This condition could further affect DO levels in freshwater habitat transformation, giving its resilience to
most African freshwater systems, including the Wewe River, disturbances.
where this study was conducted. Thus, benthic taxa noted
for drought tolerance condition (e.g. Chironomidae and
Libellulidae) [69–71] may go extinct.
Changes in stream conditions as a result of season- 4.2 Seasonal physicochemical influence on
ality and other direct anthropogenic drivers such as farm- benthic invertebrate across the three
ing, dumping of solid waste in streams, and burning can condition zones
affect some benthic community structure that are sensitive
extreme habitat perturbation, and this probably explained Benthic habitats are complex, and a variety of environ-
why Corydalidae, Notonemouridae, and Protoneuridae were mental variables acting at multiple spatial scales regulate
only found during the dry season, whereas Belostomatidae, the composition and distribution patterns of stream
Gomphidae, and Neptidae thrived only in wet season macro-invertebrate assemblages in a synergistic fashion
(Figures 9a and b and 10a and b). The dominance of Nepidae [74,75]. For example, latitude, longitude, pH, and stream
(water scorpion) in the wet season was probably because of characteristics like water velocity, width and depth,350 Samuel K. Oppong et al.
substrate composition, and concentrations of nutrients humid highlands of Ethiopia was found to have an impact
and dissolved organic carbon are often important deter- on ecosystem like freshwater systems [86]. This suggests
minants of macro-invertebrate community structure and that aquatic life along these agroecological zones may as
may also drive patterns in benthic community composi- well be at risk of extinction as a result of these human-led
tion [63,76–79]. In this study, DO concentration, surface disturbances.
water temperature, TDS, SS, EC, and pH were the physi-
cochemical drivers that influenced higher abundance of
benthic invertebrates in the wet season than in the dry
season (Figures 9a and b and 10a and b). These physico- 5 Conclusion
chemical drivers were probably at optimal levels and
within tolerable limit for benthic invertebrates. This study assessed the seasonal response of benthic
In a similar study on seasonal variations in benthic invertebrate to physicochemical drivers in the Wewe
invertebrates, Dudgeon [12] found hydrologic regime and River. Our findings showed that benthic invertebrate
geomorphology in stream environments, as the key deter- assemblages did not differ in the dry and wet seasons.
minants of their distribution and abundance. Using mul- Nonetheless, there was a slight increase among indivi-
tivariate approach, CCA, Jonsson et al. [80] listed pH, duals, taxa richness, and diversity in the wet season com-
water velocity, organic matter, and low canopy openness pared with the dry season. The most severely disturbed
as the principal predictors of benthic invertebrate com- segment (downstream) of the Wewe River registered
munity structure in boreal streams. The impact of these the highest number of individuals, suggesting the role
predictive factors that cause changes in aquatic environ- of habitat perturbation and sample size in influenc-
mental conditions may lead to the loss of species, altered ing macro-invertebrate heterogeneity and abundance.
community composition, and homogenization of commu- Dominance of Chironomidae in the dry and wet seasons
nities [81]. The aftermath of these effects according to was attributed to their broad range habitat preferences
Meyer et al. [81] may result in reduced biodiversity and their ability to adapt to seasonal changes in physi-
and consequently impair the functioning of these habi- cochemical driver conditions, while the lowest abun-
tats [82]. dance of Asellidae and Perlidae was probably due to their
Impact of higher levels of mercury concentration and sensitivity to elevated levels of some water quality para-
SS on the low abundance and distribution of Asellidae meters, namely mercury and low dissolve oxygen con-
and Perlidae especially in the moderate condition zone centration, which were characteristics of the moderately
was probably a result of intensive use of agrochemicals disturbed zone (upstream) of the Wewe River. Thus, for
on nearby farmlands, deposition of solid waste on the effective management of the Wewe River, we recommend
riparian zone, and the flow of liquid waste from sur- that Asellidae and Perlidae be considered as a suit of
rounding human settlements, during the wet season. indicator benthic orders to monitor the water quality
An increase in mercury concentration might have con- health. Other conservation measures that should be con-
tributed to oxygen depletion, which consequently reduced sidered in protecting the overall ecosystem of the Wewe
Asellidae population. Such negative impacts on the func- River include the following:
tional role of invertebrates as litter decomposers could be (a) farming activities within the riparian zone should be
impaired and consequently have long-term effects on the banned and farmers relocated in places further away
ecosystem health of the Wewe River, leading to loss of from the riparian zones;
biodiversity. Hellawell [83] revealed that Perlidae and (b) diversion of liquid sewage spillway emptying into the
Ephemeridae are among the intolerant groups, and this river course; and
tends to reflect in their low numbers usually in the agri- (c) dumping of solid refuse along the riparian zone must
cultural streams. Getwongsa et al. [84] also found Per- be banned by authorities and managers of the Wewe
lidae to decrease in agricultural streams. Thus, with the River.
current rate of farming expansion along the fringes of the In terms of the setbacks that arose from this study,
Wewe River, there is the likelihood of increase in mercury we noted the difficulty in sampling with less than four
concentration in the water column (Table 4), through persons per segment of the river per day. The extreme
surface run-off during the wet season. Thus, sensitive stress or tiredness observed among the researchers may
benthic taxa such as Assellidae and Perlidae [85] could have resulted in the lack of detection or loss of some
be threatened by this disturbance-related driver. Expan- benthic invertebrate samples, as we could not sample
sion of cultivated lands along agroecological zones in the every section of the different condition zones of theBenthic invertebrate assemblages’ response to seasonal and habitat condition 351
riverine continuum. We suggest that future studies should [6] Al-Shami SA, Rawi CSM, Ahmad AH, Hamid SA, Nor SAM.
involve not less than seven persons, sampling in each Influence of agricultural, industrial, and anthropogenic
segment of a riverine continuum. stresses on the distribution and diversity of macroinverte-
brates in Juru River Basin, Penang, Malaysia. Ecotoxicol
Environ Saf. 2011;74(5):1195–202.
Acknowledgements: The authors wish to thank Madam [7] Bott TL, Brock JT, Dunn CS, Naiman RJ, Ovink RW, Petersen RC.
Gloria (Lab Technician in the Faculty of Renewable Natural Benthic community metabolism in four temperate stream
Resources) for permitting the research team to use the labora- systems: an inter-biome comparison and evaluation of the
tory for invertebrate identification. river continuum concept. Hydrobiol. 1985;123(1):3–45.
[8] Merz JE, Chan LKO. Effects of gravel augmentation on macro-
invertebrate assemblages in a regulated California river. River
Funding information: This research was funded by the Res Appl. 2005;21(1):61–74. doi: 10.1002/rra.819.
KreF Fund of Kwame Nkrumah University of Science & [9] Covich AP, Crowl TA, Heartsill-Scalley T. Effects of drought and
Technology. hurricane disturbances on headwater distributions of palae-
monid river shrimp (Macrobrachium spp.) in the Luquillo
Mountains, Puerto Rico. North Amer Benthol Soc.
Author contributions: C.A.N. and S.K.O. conceived the
2006;25(1):99–107.
ideas and designed the methodology; C.A.N., S.K.O.,
[10] Henriques-Oliveira AL, Nessimian JL. Aquatic macroinverte-
and G.K.B. carried out field data collection, identification brate diversity and composition in streams along an altitudinal
of benthic taxa, and data entry in excel sheet; C.A.N. and gradient in Southeastern Brazil. Biota Neotrop.
G.K.B. analysed the data and led the writing of the manu- 2010;10(3):115–28.
script. S.K.O. undertook in-house review of the drafts and [11] Haro RR, Johnson L, Host G. Catchment and reach-scale
properties as indicators of macroinvertebrate species traits.
gave final approval for submission.
Freshw Biol. 1997;37(1):219–30.
[12] Dudgeon D. The ecology of tropical Asian rivers and streams in
Conflict of interest: The authors state no conflict of relation to biodiversity conservation. Ann Rev Ecol Syst.
interest. 2000;31(1):239–63.
[13] Graça MA, Pinto P, Cortes R, Coimbra N, Oliveira S, Morais M,
Data availability statement: The datasets generated during et al. Factors affecting macroinvertebrate richness and diver-
sity in Portuguese streams: a two-scale analysis. Int Rev
and/or analysed during the current study are available
Hydrobiol. 2004;89(2):151–64.
from the corresponding author on reasonable request. [14] Sharma RC, Rawat JS. Monitoring of aquatic macroinverte-
brates as bioindicator for assessing the health of wetlands:
a case study in the central Himalayas, India. Ecol Indic.
2009;9(1):118–28.
[15] Gore JA, Layzer JB, Mead JIM. Mead, Macroinvertebrate
References instream flow studies after 20 years: a role in stream man-
agement and restoration. Reg Rivers Res Manag Int J Devot
[1] Balachandran C, Ramachandra T. Aquatic macroinvertebrate River Res Manag. 2001;17(4–5):527–42.
diversity and water quality of Bangalore lakes. Wetlands: [16] Brown LE, Céréghino R, Compin A. Endemic freshwater inver-
Biodiversity and Climate Change. Bangalore: Energy and tebrates from southern France: diversity, distribution and
Wetland Research Group; 2010. conservation implications. Biol Conserv.
[2] Andersen AN, Fisher A, Hoffmann BD, Read JL, Richards R. Use 2009;142(11):2613–9.
of terrestrial invertebrates for biodiversity monitoring in [17] Mabidi A, Mathews SB, Perissinotto R. Distribution and
Australian rangelands, with particular reference to ants. J Aust diversity of aquatic macroinvertebrate assemblages in a semi-
Ecol. 2004;20429(1):87–92. arid region earmarked for shale gas exploration (Eastern
[3] Jun Y-C, Kim N-Y, Kim S-H, Park Y-S, Kong D-S, Hwang S-J. Cape Karoo, South Africa). PLoS One 2012.
Spatial distribution of Benthic macroinvertebrate assem- 2017;12(6):e0178559.
blages in relation to environmental variables in Korean [18] Abungba JA, Khare D, Pingale SM, Adjei KA, Gyamfi C, Odai SN.
nationwide streams. Water. 2016;8(1):27. http://www.mdpi. Assessment of hydro-climatic trends and variability over the
com/2073-4441/8/1/27 Black Volta Basin in Ghana. J Earth Syst Environ.
[4] Mereta ST, Boets P, Bayih A, Malu A, Ephrem Z, Sisay A, et al. 2020;4:739–55. doi: 10.1007/s41748-020-00171-9.
Analysis of environmental factors determining the abundance [19] Fu BJ, Zhuang XL, Jiang GB, Shi JB, Lü YH. Environmental pro-
and diversity of macroinvertebrate taxa in natural wetlands of blems and challenges in China. Environ Sci Technol.
Southwest Ethiopia. Ecol Inform. 2012;7(1):52–61. 2007;41:7597–602.
doi: 10.1016/j.ecoinf.2011.11.005. [20] Qin B, Xu P, Wu Q, Luo L, Zhang Y. Environmental issues of
[5] Buss DF, Baptista DF, Silveira MP, Nessimian JL, Dorvillé LF. Lake Taihu. China Hydrobiol. 2007;581(1):3–14. doi: 10.1007/
Influence of water chemistry and environmental degradation 978-1-4020-6158-5_2.
on macroinvertebrate assemblages in a river basin in south- [21] Mensah-Bonsu IF, Owusu-Ansah JK. State of the environment
east Brazil. Hydrobiol. 2002;481(1–3):125–36. in Kumasi. In: Adarkwa KK, editor. The future of the tree:352 Samuel K. Oppong et al.
towards growth and development of Kumasi. Upk, Kumasi; [38] Hair JF, Black WC, Babin BJ, Anderson RE, Tatham RL. Análise
2011. p. 174–94. multivariada de dados. Bookman Editora; 2009.
[22] Forkuor D, Callistus M, Kyei PK, Forkuor G. Changes in land use [39] Magurran AE. Measuring biological diversity. Oxford:
in the Kumasi metropolis of Ghana – whose fault? Local Gov Blackwell Science; 2004.
Stud. 2012;4(1):58–77. [40] Fattorini S. A simple method to fit geometric series and broken
[23] Agyapong EB, Ashiagbor G, Nsor CA, van Leeuwen LM. Urban stick models in community ecology and island biogeography.
land transformations and its implication on tree abundance Acta Oecol. 2005;28(3):199–205.
distribution and richness in Kumasi. Ghana Urban Ecol. [41] Fattorini S. Species ecological preferences predict extinction
2018;4(1):1–11. doi: 10.1093/jue/juy019. risk in urban tenebrionid beetle guilds. Anim Biol.
[24] Forkuor D, Otieku E. Environmental consciousness and prac- 2013;63:93–106. doi: 10.1163/15707563-00002396.
tices of land users along urban water bodies in Ghana: the [42] Fattorini S, Rigal F, Cardoso P, Borges PAV. Using species
case of Kumasi Metropolis. Ethiopian Environ Stud Manag. abundance distribution models and diversity indices for bio-
2015;8(Suppl. 2):966–75. doi: 10.4314/ejesm.v8i2.10S. geographical analyses. Acta Oecol. 2016;70:21–8.
[25] Arab A, Lec S, Lounaci A, Park YS. Spatial and temporal pat- doi: 10.1016/j.actao.2015.11.003.
terns of benthic invertebrate communities in an intermittent [43] Colwell RK, Gotelli NJ. Quantifying biodiversity: procedures
river (North Africa). Int J Limnol. 2004;40(4):317–27. and pitfalls in the measurement and comparison of species
[26] Lounaci A, Brosse S, Thomas A, Lek S. Abundance, diversity richness. Ecol Lett. 2001;4(4):379–91.
and community structure of macroinvertebrates in an Algerian [44] Gray JS, Mirza FBA. Possible method for the detection of pol-
stream: the Sébaou wadi. Ann Limnol Int J Limnol. lution-induced disturbance on marine benthic communities.
2000;36:123–33. Mar Pollut Bull. 1979;10:142–6.
[27] Gasith A, Resh VH. Streams in Mediterranean climate regions: [45] Colwell RK, Coddington JA. Estimating terrestrial biodiversity
abiotic influences and biotic responses to predictable sea- through extrapolation. Philos Trans R Soc Lond B Biol Sci.
sonal events. Ann Rev Ecol Syst. 1999;30:51–81. 1994;345:101–18. doi: 10.1098/rstb.1994.0091.
[28] Kalejta B, Hockey PAR. Distribution, abundance and produc- [46] Colwell RK. EstimateS: statistical estimation of species rich-
tivity of benthic invertebrates at the Berg River estuary, South ness and shared species from samples. Version 60; 2000.
Africa. Estuar Coast Shelf Sci. 1991;33(2):175–91. doi: 10.1016/ http://viceroy.eeb.uconn.edu/estimates
0272-7714(91)90005-V. [47] King JR, Porter S. Evaluation of sampling methods and species
[29] Niba A, Sakwe S. Turnover of benthic macroinvertebrates richness estimators for ants in upland ecosystems in Florida.
along the Mthatha River, Eastern Cape, South Africa: implica- Environ Entomol. 2005;34(6):1566–78. doi: 10.1603/0046-
tions for water quality bio-monitoring using indicator species. 225X-34.6.1566.
Freshw Ecol. 2018;33(1):157–1717. doi: 10.1080/ [48] McArthur RH. Patterns of species diversity. Biol Rev.
02705060.2018.14319692018. 1965;40(4):510–33. doi: 10.1111/j.1469185X.1965.tb00815.x
[30] Nwankwo CB, Hoque MA, Islam MA, Dewan A. Groundwater [49] Hill MO. Diversity and evenness: a unifying notation and its
constituents and trace elements in the basement aquifers of consequences. Ecol. 1973;54:427–32. doi: 10.2307/1934352
Africa and sedimentary aquifers of Asia: medical hydrogeology [50] Jost L. Entropy and diversity. Oikos. 2006;113:363–75.
of drinking water minerals and toxicants. J Earth Syst Env. [51] Jost L. Partitioning diversity into independent alpha and beta
2020;4(2):369–84. doi: 10.1007/s41748-020-00151-z. components. Ecol. 2007;88:2427–39.
[31] Pires AM, Cowx IG, Coelho MM. Benthic macroinvertebrate [52] Chao A, Gotelli NJ, Hsieh TC, Sande EL, Ma KH, Colwell RK,
communities of intermittent streams in the middle reaches of et al. Rarefaction and extrapolation with Hill numbers: a
the Guadiana Basin (Portugal). Hydrobiol. framework for sampling and estimation in species diversity
2000;435(1–3):167–75. studies. J Ecol Monogr. 2014;84(1):45–67.
[32] Tay SC, Kye-Duodu G, Gbedema SY. River Wiwi: a source of [53] Ter Braak CJF. Canonical correspondence analysis: a new
Schistosoma haematobium infection in school children in eigenvector technique for multivariate direct gradient ana-
Kumasi, an urban African setting. African. J Macrobiol Res. lysis. Ecol. 1986;67(5):1167–79.
2013;7(20):2213–20. [54] Kent M, Coker P. Vegetation description and analysis: a
[33] Ghana Meteorological Agency (GMet). The head Office, practical approach. New York, NY, USA: John Wiley and Sons
P. O. Box LG 87, Legon, Accra, GR, Ghana; 2008. Ltd; 2002.
[34] Stein ED, White BP, Mazor RD, Miller PE, Erik M, Pilgrim EM. [55] Dorugade AV, Kashid DN. Alternative method for choosing
Evaluating ethanol-based sample preservation to facilitate use ridge parameter for regression. Appl Math Sci.
of DNA barcoding in routine freshwater biomonitoring pro- 2010;4(9):447–56.
grams using benthic macroinvertebrates. PLoS One. [56] Schreiber-Gregory DN, Jackson HM. Multicollinearity: what is
2013;8(1):e51273. doi: 10.1371/journal.pone.0051273. it, why should we care, and how can it be controlled?. Env’tal
[35] Brinkman MA, Duffy WG. Evaluation of four wetland aquatic Sc. 2017. p. 1–12.
invertebrate samplers and four sample sorting methods. [57] Hammer Ø, Harper DAT, Ryan PD. PAST: paleontological sta-
Freshw Ecol. 1996;11:193–200. tistics software package for education and data analysis.
[36] Bobson M, Pawley S, Fletcher M, Powell A. Guide to freshwater Palaeontol Electron. 2001;4(1):9.
invertebrates. Cumbria, UK: Freshwater Biological Association [58] Modde TC, Schmulbach JC. Seasonal changes in the drift and
Scientific Publication; 2012. benthic macroinvertebrates in the unchannelized Missouri
[37] Dudgeon D. Tropical Asian streams: zoobenthos, ecology and River in South Dakota. Proc South Dak Acad Sci.
conservation. Hong Kong: Hong Kong University Press; 1999. 1973;52:118–26.You can also read