Seasonal flow dynamics exacerbate overlap between artisanal fisheries and imperiled Ganges River dolphins - Nature
←
→
Page content transcription
If your browser does not render page correctly, please read the page content below
www.nature.com/scientificreports
OPEN Seasonal flow dynamics exacerbate
overlap between artisanal fisheries
and imperiled Ganges River
dolphins
Shambhu Paudel1,2*, John L. Koprowski1,3 & Michael V. Cove4
Here we quantify the effects of artisanal fisheries on the ecology of a small cetacean, the Ganges
River dolphin (Platanista gangetica gangetica, GRD), in a large river system of Nepal. We examine
the size-classes of fisheries’ catches, behavioural changes in GRD in response to fishing activities,
and diel overlap between GRD and fishing activity. We observed high human exploitation rates
(> 60% of the total catch per effort) of GRD-preferred prey sizes, indicating risks of high resource
competition and dietary overlap, especially during the low water season when resource availability is
reduced. Competitive interactions in the feeding niches during the low water season, plus temporal
overlap between the peak exploitation and critical life-history events (e.g., reproduction), likely have
ecological consequences. Furthermore, we detected 48% (95% CI 43–52%) increase in the chance of
behavioural changes among dolphins exposed to anthropopressure (fishing activity), risking social
behaviour impairment in exposed dolphins. The higher diel overlap and increased diel coefficient
as the surveys progressed towards the monsoon season suggest temporal shifts in GRD socio-
behavioural states and seasonal effects on resource partitioning, respectively. This work identifies
drivers of small cetaceans-fisheries interactions and their consequences, and can be used to help
reduce biologically significant fishing impacts on small cetaceans. Mitigation strategies, together
with river sanctuary and distanced-based approaches, should be urgently included in a framework of
ecosystem-based management.
Freshwater ecosystems provide vital resources for humans and are a habitat for a plethora of endemic and sen-
sitive fauna and flora1. However, human pressures on freshwater ecosystems have risen sharply over the past
century, leading to substantial and growing threats to global b iodiversity1. Freshwater fisheries around the world
are increasingly overexploited by h umans1,2. Humans have caused rapid and significant declines in abundance
and distribution of freshwater fauna that could reduce future viability of various taxa2. Freshwater river systems—
exhibiting some of the richest fish biodiversity resources in the world—are no exception to these global trends3.
Fisheries in the cold-water systems of the Hindu Kush region of the Himalayas are considered vital sources of
nutrition and food security, where large human populations living downstream rely on these natural resources
for their daily survival4. Large artisanal fishing communities predominantly depend on subsistence and semi-
intensive fisheries for their livelihoods. For many Nepalese, fishing is a way of l ife5. Nearly three million fisher-
men from India and Bangladesh rely on fishing in Himalayan Rivers for income, food security, and n utrition6.
For example, the Koshi River in Nepal, a major tributary of the Ganges River, harbours 103 fish species and
contributes about half of Nepal’s total fish production of 33,000 metric tons per year; with more than 30,000
people depending on fishing in the Koshi and other rivers in Nepal for their livelihoods6. Consequently, local
dependence on river systems, documenting losses of biodiversity, diagnosing their causes, and finding mitiga-
tion have become significant issues.
The first human-caused extinction of a Yangtze River dolphin (Lipotes vexillifer) from China has led to grow-
ing concern that similar extinctions of other river dolphins are likely unless human needs and river ecology are
better understood, and conflicts m itigated7. Particularly at risk are other river dolphins with distributions that are
1
School of Natural Resources and the Environment, University of Arizona, 1064 East Lowell Street, Tucson,
AZ 85721, USA. 2Tribhuvan University, Institute of Forestry, Post Box:43, Pokhara, Nepal. 3Haub School of
Environment and Natural Resources, University of Wyoming, Bim Kendall House, 804 E Fremont St, Laramie,
WY 82072, USA. 4Department of Applied Ecology, North Carolina State University, Raleigh, NC 27695,
USA. *email: spaudel@email.arizona.edu
Scientific Reports | (2020) 10:18798 | https://doi.org/10.1038/s41598-020-75997-4 1
Vol.:(0123456789)
www.nature.com/scientificreports/
mostly restricted to human-dominated river systems under the immense pressure of river-dependent communi-
ties. Conflicts between small cetaceans and artisanal fishing have increased globally in recent y ears8–12. Despite
available studies on interactions between small cetaceans and fisheries, competition between small cetaceans
and subsistence fisheries poses a severe and growing problem, and meaningful management thus requires an
effective and appropriate assessment of the factors driving the interaction.
The conflict between small cetaceans and artisanal fisheries is mainly through ecological niche overlap, for
example, food and habitats12–17. Such interactions have resulted in small GRD population sizes of questionable
viability in two major river systems of Nepal, the Karnali and Sapta Koshi17. At least 95 Indus River dolphins
(Platanista gangetica minor) were killed between 1993 and 2012 in fishing gear in the main sections of the rivers of
Pakistan18. Similarly, the majority of Irrawaddy dolphin (Orcaella brevirostiris) deaths were attributed to entangle-
ment in gillnets in the Mekong River of Cambodia and L aos8. Furthermore, the survival of South American river
dolphins is threatened by fi sheries15, and the vaquita (Phocoena sinus) in Mexico is in severe danger of extinc-
tion due to non-target capture in n ets19. Globally, human activities leading to intense small cetaceans-fisheries
interactions must be examined to manage and promote the co-existence between fisheries and small cetaceans.
Previous research has quantified the strength of the interaction between cetaceans and fisheries. However,
no studies have examined potential ecological niche overlap, for example, overlap in the dimension of prey
size (focusing preferred prey size), diel activity (the distribution of activity throughout the daily cycle), and
behavioural distraction (change from one behavioural state to other). Most studies have used fisheries datasets
(biological catch) to measure such interactions. For example, by-catch (number of entangled dolphins), harvest
details (catch per unit effort), and social d imensions20–24 while ignoring the potential relationship between niche
25
overlap and competition .
Globally, a sharp decline in population status (~ 50%) and distribution of GRD is attributed to anthropogenic
activities26. In Nepal, out of four rivers of distribution, currently only two river systems are occupied by GRD
with questionably viable population size (< 50)17. Here, we assessed aspects of the interaction between artisanal
fisheries and cetaceans in Nepalese waterways not previously studied by examining (1) niche overlap between
GRD and fisheries in the dimension of prey size; (2) overlap in diel activity by fisheries and GDR; and (3) effects
of fisheries on GDR behaviour. To characterize the interactions, we collected fishery data at wider temporal
scale, visually observed GRD response to fishing events, and estimated overlap coefficients to compare activity
patterns of fishers and GRD. We analysed the fishery data using generalized linear models within a Bayesian
hierarchical framework to obtain exploitation rates of GRD preferred prey sizes and their contributing factors.
Results
Preferred prey size exploitation over space and time. The top deviance information criterion (DIC)
supported model included gear and season as predictive covariates (Model 1, Table 1). On average, gear and
season contribute with β coefficients of 2.438 (95% Credible interval: 2.122–2.743) and 0.193 (95% Credible
interval: − 0.121 to 0.502), respectively. The proportion of exploitation (β coefficient) was higher in the Sapta
Koshi river [Gill = 0.623 (95% CI 0.45–0.807), Cast = 0.877 (95% CI 0.719–0.955)] than in the Karnali [(Karnali:
Gill = 0.521 (95% CI 0.338–0.73), Cast = 0.677 (95% CI 0.518–0.797). Contrary to our a priori predictions, cast
nets were associated with higher average exploitation of the proportion of preferred fish size caught during
the dry season (October–March), whereas, most of the time (April–November), gill nets were associated with
stronger effects.
In both river systems, the dry season (October–March) had a higher mean proportion of preferred fish sizes
caught compared to other seasons (except February through March in the Karnali River), which were the most
common months for the highest percentage of preferred fish size captured (Fig. 1). We detected minimal varia-
tion of mean proportional rates during dry seasons, which had the largest mean proportion values compared to
other seasons (Fig. 1). The mean annual exploitation proportion rates were 0.6 (95% CI 0.297–0.952) and 0.78
(95% CI 0.732–0.952) in the Karnali and Sapta Koshi rivers (Fig. 1), respectively.
Fisheries over space and time. Average total catch per effort exhibits distinct seasonal patterns in both
river systems, lowest in summer (April–November: mean = 1.454 kg, SD = 1.719), and higher during the dry sea-
son (October–March: mean = 3.063 kg, SD = 3.236). Across the seasons, June-July (mean = 5.062 kg, SD = 4.620)
in the Sapta Koshi and December–January (mean = 2.145 kg, SD = 0.906) in the Karnali attained the highest
peaks of fish biomass captured, which then declined to the onset of the summer season. Average total catches
varied more widely within a season in the Sapta Koshi River, whereas in the Karnali catches tended to remain
constant (Fig. 2). The lowest average catch records were observed through August to November in both river
systems, which were less than or equal to 2 kg (Fig. 3). Average catch per effort across gear type [(Cast: Kar-
nali-mean = 0.932 kg, SD = 0.845; Sapta Koshi-mean = 4.470 kg, SD = 4.404), (Gill: Karnali-mean = 1.420 kg,
SD = 1.104; Sapta Koshi-mean = 3.141 kg, SD = 2.428)] varied, which considerably contributed to the average
seasonal biomass catches observed (Fig. 3).
Behavioural changes to the artisanal fishing boat. Time of the day (GLM, estimate = 0.685, 95% CI
0.526–0.887, Z = − 2.843, P = 0.004) associated with a higher probability of dolphins being subjected to anthropo-
pressure. Compared to the afternoon (estimate = 1.1875, 95% CI 0.7427–1.910), risk of behavioural change in
the morning and evening increased by 1.753 (95% CI 1.070–2.879) and 2.470 (95% CI 1.438–4.276) respectively.
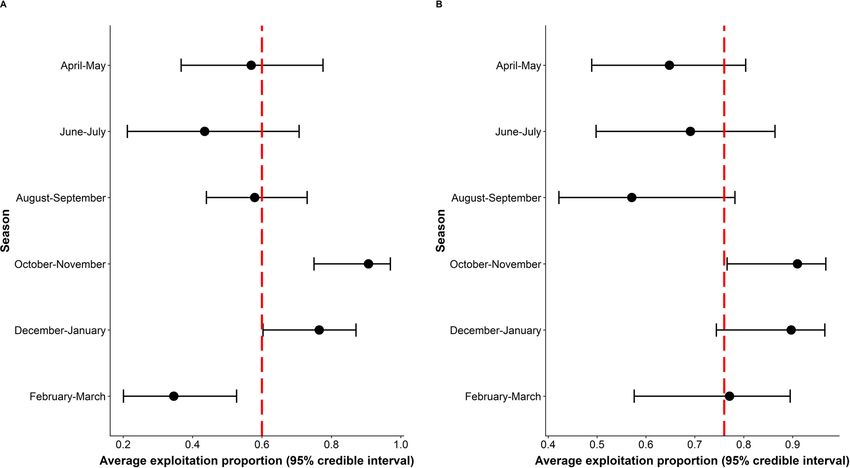
The propensity scores varied from 0.328 to 0.746 (mean = 0.48), with high overlap of scores between two treat-
ment groups. Behavioural change rates (with 95% confidence intervals) by treatment groups in each propensity
quintile group revealed that behavioural change rates were higher in dolphins exposed to anthropopressure than
those in the control group (Fig. 4). Overall, we noticed an average 48% (95% CI 43–52%) increase in chance of
Scientific Reports | (2020) 10:18798 | https://doi.org/10.1038/s41598-020-75997-4 2
Vol:.(1234567890)www.nature.com/scientificreports/
ID Model (xi,t) DIC pD Bayesian P-value
1 Gear + season 1203.789 217.033 0.479
2 Gear + season + gear * season 1203.939 215.142 0.488
3 Gear * season + river 1210.288 215.074 0.515
4 Gear + season + river 1211.893 216.385 0.484
5 Season + time + effort 1214.754 222.301 0.491
6 Season * time 1217.129 222.483 0.5
7 Season + time 1219.104 223.016 0.504
8 Season 1219.676 222.91 0.504
9 Time + effort + distance 1220.401 225.234 0.503
10 Season + time + effort + river 1221.328 221.329 0.51
11 Weight + season 1221.518 222.514 0.5
12 Effort 1222.943 226.32 0.502
13 Null 1223.651 225.923 0.509
14 Weight + season + weight * season 1224.025 222.837 0.516
15 Season * time + river 1225.449 222.444 0.515
16 Weight + season + river 1226.818 222.617 0.508
17 Season + river + time 1227.149 222.9 0.512
18 Time + effort + time * effort 1227.832 226.035 0.516
19 Season + river 1228.121 223.183 0.51
20 Season + river + season * river 1228.513 222.499 0.511
21 Time + effort + river 1228.983 226.851 0.517
22 Season * river 1229.077 223.013 0.513
Table 1. Proposed covariates for the model described in Eq. (1), model comparison via Deviance Information
Criterion (DIC), effective number of parameters (pD), and Bayesian P-values used to assess model fit for
the fishing data. Models that contained interactions also contained the additive covariate. Among the tested
models, model 1 performed best. Bold values indicate the top deviance information criterion (DIC) supported
model.
Figure 1. Mean exploited proportion over season, where the red vertical line represents the annual average
(A Karnali; B Sapta Koshi). For both river systems, October–January received a higher amount of exploited
proportion, which is greater than the yearly average. The black dot in each error bar represents the mean
exploited value for the respective season.
Scientific Reports | (2020) 10:18798 | https://doi.org/10.1038/s41598-020-75997-4 3
Vol.:(0123456789)www.nature.com/scientificreports/
Figure 2. Seasonal average total catches per effort (with 95% CI level) in the Karnali and Sapta Koshi River
systems. The Sapta Koshi River shows a twofold higher level of harvest compared to the Karnali River,
suggesting a high rate of resource exploitation in the Sapta Koshi river of Nepal. The rate of exploitation is
higher from December through July, which is the temporal range with most top fisheries-dolphin conflicts
recorded.
Figure 3. Average catch per effort in terms of gear types (Gill and Cast nets). During the low water season
(December–July), the effect of the Cast net is higher compared to the Gillnet, suggesting the significance of the
regulation of the cast nets to minimize the resource competition and potential risk of animal depredation.
behavioural change rates (or risks) in dolphins exposed to anthropopressure compared to control group dol-
phins (Fig. 4). Under a human presence, we noticed substantial change in behaviour state from surface feeding
to long (44%, n = 180) and travel dive (33%, n = 135) respectively.
Temporal activity/diel overlap. We detected GRDs and artisanal fishing boats in all months surveyed,
with substantial variation in GRD detections, ranging from 45 and 51 detections in the winter surveys (Novem-
ber–February) to 127 detections during March–April as the monsoon season approached. Artisanal fishing boat
detections were fairly constant, ranging from 187 to 195 detections across the same survey periods. Dolphin
Scientific Reports | (2020) 10:18798 | https://doi.org/10.1038/s41598-020-75997-4 4
Vol:.(1234567890)www.nature.com/scientificreports/
Figure 4. The average behavioural change (overall) percentage by group (treatment and control) within an
equal size propensity matching score strata with 95% confidence intervals. Blue and red bars represent treatment
(boat presence) and control effects (without fishing boat), respectively. In each pair, the average treatment effect
is higher than in the control effect.
Figure 5. Black lines indicate activities of dolphins, and the humans are blue dotted lines. The overlap increases
during each period and from one period to the next (shaded grey), showing a clear trend that there are inverse
peaks of activity between dolphins and humans.
activity in the dry season (November–February) exhibited trimodal activity curves with a peak in early morn-
ing activity around 0700 h, followed by a peak in mid-day (1200 h), and a less pronounced peak towards the
end of daylight 1800 h (Fig. 5). Dolphin activity in March–April exhibited similar activity peaks in the early
morning (0700 h), but with a distribution of activity that plateaued throughout the rest of the day. Artisanal fish-
ing boat activity across all seasons approached uniformity throughout the day, with minor declines in activity
around mid-day. These observations led to moderate diel overlap between the artisanal fishing boats and GRDs
in November–December with the coefficient of overlap estimates Δ = 0.604 (95% CI 0.478–0.726, Table 2). Over-
Scientific Reports | (2020) 10:18798 | https://doi.org/10.1038/s41598-020-75997-4 5
Vol.:(0123456789)www.nature.com/scientificreports/
Number of
detections
Period GRD Humans Coefficient of overlap (∆) Lower CI Upper CI
November–December 51 189 0.604 0.478 0.726
January–February 45 187 0.725 0.615 0.850
March–April 127 195 0.832 0.756 0.912
Table 2. Coefficient of overlap (∆) estimates and 95% confidence intervals of the diel activity patterns of
Ganges River dolphins (GRD) and humans during three sampling periods: November–December, January–
February, and March–April in the Sapta Koshi River, Nepal.
lap coefficients increased across the next two survey seasons: Δ = 0.725 (95% CI 0.615–0.850) and Δ = 0.832 (95%
CI 0.756–0.912) in January–February and March–April, respectively (Table 2).
Discussion
Globally, interactions between artisanal fisheries and small cetaceans are one of the most significant conserva-
tion issues leading to endangerment and e xtinction27. The recent extinction of the Yangtze River dolphin and
the critically small size of the vaquita population showcase how such interactions can contribute to dramatic
declines of small cetaceans18. Our study reveals that interactive and cumulative effects of artisanal fishing with
seasonal resource variations—the high dietary overlap of preferred prey exploitation, substantial risk of impair-
ment of ecological and social behaviour, and significant diel activity overlaps—is putting the small cetaceans
under acute pressure that could affect dolphin persistence. These factors might have contributed to the decline
in dolphin populations in Nepal over the past two decades12 and will continue to affect river dolphin population
growth in the future.
We observed high human exploitation rates of GRD-preferred prey sizes in the major river systems of Nepal,
where an already small number of the dolphins (28–52 individuals) persist12. Greater than 60% of the total catch
per effort in each river was within the preferred prey size range. Fishing gear and seasons were identified as sig-
nificantly contributing to the higher proportion of GRD-preferred fish size-classes captured in fisheries. Among
these contributing factors, the contribution of gear was twofold stronger than that of season. Specifically, we saw
a higher proportion of GRD-preferred fish caught by cast nets relative to gill nets, particularly during the dry
season. Because of non-selective behaviours of the cast net, impacts of cast nets could be significant relative to
gill net during dry seasons when resource availability is reduced. Medirose et al.28 reported similar effects of cast
nets in aquatic systems of Brazil and urged fishing gear specific fisheries management schema. As the variation
on fish stock and size distribution is likely regulated by fishing and temperature (regulated by season), seasonal
variation in resource overlap highlights seasonal gear-specific regulations as the appropriate and effective mitiga-
tion effort to sustain resources and minimize potential conflict between small cetaceans and artisanal fisheries
in highly exploited river system.
Also, these high exploitation rates peaked during the dry season when habitat was reduced, which suggests
that there is typically more significant overlap in the feeding “niches” of river dolphins and fishermen during this
time of year. Narrow habitat breadth coupled with limited availability of habitat and overlap in prey resources
likely increases competition between GRD and fisheries in that both GRD and artisanal fisheries overlap in high
productivity foraging sites, such as deep pools and confluence h abitats29. The direct effects of these interactions
have likely increased by-catch of small cetaceans. For example, we recorded by-catch leading to the death of three
young calves in the Sapta Koshi River and one adult in the Karnali River during 2015–2018, especially between
December–February. Such mortality could be attributed to either small cetaceans increasing their foraging time
in the area with high overlapped, which forces small cetaceans to forage further in areas with higher depreda-
tion risks30. Although fish availability or stock data is not available for the study site, the high exploitation of
small cetacean’s preferred prey by fisheries during the resource-limitation period suggests there is high overlap
between the diets of small cetaceans and the catch of artisanal fisheries, which might play an indirect role in
compromising the health of these c etaceans31. We did not find any species that are devalued by the fisheries, but
we noticed fisheries opting for a few species in terms of taste. Fishers directly sell these captured fishes in a local
market, where fishes are consumed in multiple ways.
Furthermore, we noticed GRD reproduction predominantly occurs during the low water season when fishery
exploitation is highest. Limited habitat availability, along with the risk of phenological mismatch between preda-
tor and prey in the changing Anthropocene, further exacerbate the risk of population decline or extirpation in
small cetacean (such as GRD) by adversely affecting r eproduction32. For instance, the loss of four small cetaceans
in the Mediterranean and Black Seas has been attributed to overfishing or prey depletion33.
It would be difficult to establish a clear link between fisheries and the decline of dolphins. Nevertheless, under
the lack of the most preferred food or prey size could play a significant role to reduce potential reproduction,
and is considered as the most important population size r egulator33. Thus, small cetaceans are highly vulnerable
to such competition effects, which likely affects their survival, fecundity, and overall fi tness34.
We observed a difference in the behavioural change rate of GRDs between anthropopressure and control
zones. A chance of higher dolphin behavioural change rates (40–60%) were observed in artisanal fishing boat
areas compared to control areas. Although there is no direct evidence of the adverse impact of such behavioural
changes on small cetaceans’ ecology, we suspect that artisanal fishing activities might threaten individual social
or behavioural roles that are essential to maintain a cohesive functioning society18. Chilvers et al.35 also noticed
Scientific Reports | (2020) 10:18798 | https://doi.org/10.1038/s41598-020-75997-4 6
Vol:.(1234567890)www.nature.com/scientificreports/
the change in the behaviours of the bottlenose dolphin communities (Tursiaps truncaría) as a function of fishing
activity. Disruption of the behaviours and social life of Indo-Pacific humpback dolphins (Sousa chinensis) by
fishers is argued to be a form of short-term stress that leads to a permanent impairment of behavioural func-
tioning and social life36. Thus, among small cetaceans, changes in behaviours, direction and speed of travel, and
diving styles (short, long) were all common consequences of such i nteractions37, possibly reducing survival and
reproductive success of individuals and declining populations size over t ime38.
Furthermore, distraction in surfacing ecology might reduce energy reserve, which also accelerates physi-
ological stress39. While the influences of human-made noise and other human actions on cetacean behaviour
have been widely highlighted, cases of increased sensitivity following harassment are emerging in the field of
small cetacean conservation40. Additional work is needed to determine if the observed behavioural changes we
noted in GDR due to fishing activities result in reduced survival. Increasing human-related activities like fishing
pressure and changing environment could potentially reduce the space by eliminating access to suitable forag-
ing sites and further fuel physiological harassment. Therefore, possible regulations, including buffer zones or
a river sanctuary covering small cetacean hot spots, could reduce both chronic and acute interactions between
artisanal fisheries and small cetaceans.
Globally, a lack of information exists on the “area of influence” within which human activities might displace
small cetaceans. In line with the findings of Richman et al.41, we suggest that 400–500 m can be considered as the
maximum GRD observable distance. Furthermore, our maximum response distance (200 m) could be a guide to
determine whether small cetaceans experience stress from human activities, and inform co-existence manage-
ment plans and buffer zones for critical hotspots or observed individual dolphins. The National Oceanic and
Atmospheric Administrations of the United States (NOAA-Fisheries) prohibit approaching or remaining 460 m
of an endangered Atlantic right whale (Eubalaena glacialis), and the distance is considered as a safe distance to
enhance their self-sustaining population. Thus, our proposed distances support a strategy to identify specific
areas that are important to the survival of small cetacean populations and restricting human a ccess42. A recent
study24 suggests a spatial approach as a cost-effective tool for reducing all fishery-cetacean interactions. In light
of this evidence, our response distance might be cost-effective and allow managers to prioritize locations and
apply different management strategies, offering potential beneficial outcomes for small cetaceans and fisheries.
Given that many biological activities are under photoperiodic control, allowing very narrow periods for
critical life-history events within the annual cycle43, shifts in the timing of the essential ecological and social
states caused by the diel overlap or human disturbances might have significant fitness consequences in small
cetaceans44. We noticed a high diel overlap between fisheries and GRD behavioural events, and as a conse-
quence, GRD are displaced from their active surfacing time window. As a result, the optimal timing of critical
life history activities that are based on environmental cues, for example, the timing of reproduction, the timing
of hibernation or resting, and accumulation of body reserve could be severely affected and thus, reduce the fit-
ness by failing to respond optimally to time-sensitive b ehaviours45. Specific biological effects of timing shifts in
small cetaceans have not yet been explored, but broadly deleterious effects have been noted that might influence
reproduction success, health, ranging patterns, and availability of preferred habitats, and potentially trigger a
decline in abundance46. Given the recent human-caused extinction of Yangtze River dolphin7 and Mediterranean
striped dolphins in 1990–199231, it is likely that small and isolated sub-populations of cetaceans will be severely
affected by temporal activity displacement, leading to adverse impacts on the processes that retain demographic
dynamics. These might include river dolphins in South and East Asia (e.g., Indus River dolphin, GRD, Irrawaddy
dolphin) and some species [e.g., Bolivian River dolphin (Inia geoffrensis boliviensis), Chilean dolphin (Cephalo-
rhynchus eutropia)] in South America.
Knowledge of temporal activity patterns should improve understanding of surfacing or foraging strategies of
small cetaceans and further help to minimize potential conflicts between cetaceans and fisheries47. Our temporal
activity overlap analysis between GRD and artisanal fisheries revealed relatively high diurnal overlap during the
dry seasons (particularly between November to April). The overlap coefficients show an increasing rate as the
season gets closer to the onset of the monsoon, suggesting more competition (including spatial overlap) dur-
ing the post dry season (or pre-monsoon period: February–May). There appear to be inverse peaks in activity
between GRDs and artisanal fishing, suggesting that small cetaceans might be temporally avoiding peaks in
artisanal fishing activity. We visually observed three distinct temporal fishing patterns adopted by the fishermen:
early morning (0530 h), early afternoon (1300 h), and late evening (1600 h). Thus, dolphins exhibit clear peaks
in the early morning (0600–0900 h), around noon (1100–1300 h), and late evening (1700–1800 h), suggesting
that management plans implementing active time windows might help to minimize long-term effects on small
cetaceans. In the past, most small cetacean management efforts have focused on the number of individuals (or
by-catch) and have not considered behavioural ecology in management schemes. Our study shows that regulat-
ing fishing activity using small cetaceans surfacing ecology as a basis further helps to reduce the adverse effects
of human activities. For example, in our case, restricting fishing activity in the early morning (0300–0900 h)
and later afternoon (1500–1900 h) could reduce dolphin and artisanal fisheries temporal conflict by ~ 40% and
promote co-existence of GRD and fisheries in highly fragmented waterways. However, further understand-
ing of underwater behaviours or feeding strategies of small cetaceans in relation to fishing48, body nutritional
condition49, and examining temporal dynamics of catches50 will help to more precisely understand the extent
and level of interaction.
Globally, a major threat to small cetaceans (and their subspecies) is their interactions with fisheries, either
directly or indirectly, which put them in danger of e xtinction51. Careful monitoring and regulation of the arti-
sanal fisheries, including the development of river sanctuaries, are generally essential for providing sustainable
benefits to both small population cetaceans and communities52. Given the global demise of small cetaceans,
existing conservation policies and structure of protected areas still do not afford sufficient protection for small
cetaceans from disturbances. For example, in Nepal, conservation policies and establishment of protected areas
Scientific Reports | (2020) 10:18798 | https://doi.org/10.1038/s41598-020-75997-4 7
Vol.:(0123456789)www.nature.com/scientificreports/
are entirely based on terrestrial species, and there have been no river sanctuaries established to date to address
the issue of aquatic species and safeguard their migratory pattern. The Vikramshila Gangetic dolphin sanctuary
in India is one promising conservation effort to recover the GRD population along the continuum of the Ganges
River. If the establishment of protected areas is not feasible, using the GRD’s maximum observable or response
distance supports to establish the distance-based regulations between the boats and the dolphins for no interac-
tions. Thus, recovering viable populations of small cetaceans into their natural habitat is potentially costly due
to overlap with human economies in the changing environments. Improving and managing fisheries activities
is a feasible and cost-effective approach to minimize conflict; however, incorporating river ecology and cetacean
behaviour when formulating a management plan is critical. Thus, further understanding of GDR and other small
cetacean diel activity patterns (e.g., via noninvasive surveys throughout the 24-h clock) is required to understand
life-history strategies and their requirements, thus supporting efforts to maintain co-existence of fishers and
small cetaceans. Managing fisheries should not be limited to satisfying consumers, and should incorporate a
wide array of ecological and social b enefits53. Unregulated fisheries practices threaten not only small cetaceans
but also the ecology of the rivers and the biotic communities that rely on them. Thus, setting up the appropriate
institutional structure and practical legal framework that allows stakeholders to participate in resource manage-
ment activities is essential for the successful implementation of artisanal fisheries management. Such approaches
have demonstrated some success in fisheries management in Brazil54 and China55. Similarly, Dewhurst-Richman
et al.56 highlighted the importance of institutional regulations to minimize by-catch of GRD in Bangladesh. Given
the burden that freshwater systems are experiencing, peer-based off-farm group activities (e.g., aquaculture in
ponds), combined with economic incentives using locally available resources and creating cetacean-based market
(eco-tourism), should be included within a framework of integrated river basin management.
Methods
Study sites. We conducted this study in two river systems (Sapta Koshi and Karnali) of Nepal ( see5,12 for
geographic distribution, and socio-economic and ecological description of study sites), where the last GRD
populations remain12. Both river systems represent the upstream range for the GRD distribution in the Ganges
River basin26. The high dependency of local fishers (78.5%)5 on these river systems corresponds with heightened
fishing intensity and as a result, deep pools which are most preferred by dolphins occupied by fisheries that
reduce habitat availability to dolphins, particularly during the dry seasons (October–March) when flow reduced.
Though systematic data on the total number of local fishers depending on river systems is not available, a high
proportion of the people living close to river systems derive income primarily from the fishing. Greater than
70% of fishers fish more than 4 days per week in these two river systems using a wooden boat comprised of two
boat passengers5. The Karnali and Sapta Koshi Rivers provide 55 km and 35 km of potential dolphin habitat,
respectively. However, this habitat shrinks considerably during the dry season when available space is reduced,
and pressure from fishers escalates5.
Data collection. Dolphin preferred prey size exploitation. Since niche overlap (either diet or space) is
considered as a prerequisite of competition, interactions should be understood in connection with the niche
concept25. Diet overlap (in terms of fish size class) could serve as an effective indicator of current interaction
levels57. We examined the abundance of dolphins’ preferred prey size in the total catch per effort to predict the
current direct competitive interactions between GDR and fisheries and the pressure of fisheries on the feeding
habits of river dolphins. A catching effort to each net type was defined as an average duration of effective fishing
activity of a single trip, excluding travel time (Cast: n = 203, average fishing duration = 3.95 h, SD = 2.04; Gill:
n = 198, average fishing duration = 6.68 h, SD = 3.90). Mean catch per effort for each gear type, and average total
catch per trip (combined data) by season and river were estimated.
Specific fish sizes have been previously reported as GRD-preferred prey regardless of s pecies10,52,58. We con-
sidered fish in the range of 3–15 cm total length as preferred fish size regardless of species. We sampled across
six 2-month temporal sampling periods between April and March in 2017–2018. We collected 30 landing obser-
vations (equal sample size across seasons and between rivers) representing catches per trip for each sampling
period. These temporal periods were differentiated to account for potential seasonal variations in fishing stocks.
We approached fishers randomly at landing sites immediately before they sold their daily catch of fish. Fish were
caught using cast and gill nets during the morning and late afternoon, which are the dominant fishing strategies
in both the Karnali and Sapta Koshi rivers. To improve the precision of the estimate, we further stratified land-
ings based on gear types (cast or gill net) and time of the day [morning (0500–1100) or evening (1500–1900)
shift] they fished. From the total fish caught, we placed fish greater than 2 cm in total length in a temporary
holding tank and then randomly selected ~ 20–100% of the fish to be measured. We recorded fisheries biological
information with fishers at landing sites per event [fish total length or size (cm), total fish caught (kg), distance
travelled while fishing (km), gear type, and time of the day they fished their gear]. All fishers survey procedures
were carried out in accordance with the ethical standards of the Human Subjects Protection Program at the
University of Arizona. Informed consent was obtained from all fishers for being included in the study. All the
experiment protocols involving humans were approved by the University of Arizona, Institutional Review Board
committee charged with the protection of human research subjects. All methods involving fish and dolphin
observations were carried out in accordance with the Department of National Parks and Wildlife Conservation,
Government of Nepal, guidelines and regulations. Fish measurement protocols, including dolphin observation
methods, were approved by the Department of National Parks and Wildlife Conservation, Government of Nepal
(No 1129; 12 December 2016).
Scientific Reports | (2020) 10:18798 | https://doi.org/10.1038/s41598-020-75997-4 8
Vol:.(1234567890)www.nature.com/scientificreports/
Behavioural responses to fishing events. We examined behavioural responses of river dolphins to artisanal fish-
ing boats as an index of disturbance. Here we defined “behavioural response” as any alteration of behavioural
state (from one to another state) as a putative consequence of interacting with a fishing boat. Because of immense
threats from fisheries to GRD survival (i.e. entanglement) in the Sapta Koshi12, we observed behavioural states
from November through May during 2017–2018 only in the Sapta Koshi River of Nepal. This temporal win-
dow represents the dry season, in which conflicts between dolphins and fisheries is heightened as a function
of reduced deep pool h abitats17. As artisanal fisheries in Nepal primarily use only unpowered wooden boats
(absence of engine boat or any other heavy commercial traffic vessels) and adopt spatial partitioning of fishing
activities (isolated from other fishers) among fishers to avoid potential fishing competition, this assisted us to
record behavioural response to each fishing activity. If multiple fishing boats were present or travelling through
the area, we excluded such observations from the study. Assuming < 500 m as the maximum observation dis-
tance of G RD41, we divided the river into shore-based transects of 400 m, with one elevated fixed observation
station (3 m from the river bank to avoid possible disturbances) in the centre of each transect (at 200 m). This
allowed us to classify the dolphin-fisheries interaction points into pressure (treatment) or control zones. We clas-
sified the dolphin presence area into control (without boats, control group) or pressure (presence of fishing boat,
treatment group) zones using the maximum dolphin response distance to a fishing boat. To classify the zones,
we defined maximum dolphin response distance as 200 m (SD 25 m, n = 156); this decision was based on the
findings of a pilot study. We conducted a shore-based pilot survey to estimate the approximate response distance,
with a distance < 200 m from the fishing boat considered as anthropopressure treatment, and > 200 m classified
as the control zone. We classified dolphin behaviour into five states that we could distinguish at a distance from
these observation stations: [Dive (D), steep dives with long dive interval showing tails out at the surface before
the dive; Travel (T), persistent and directional movement with constant speed and relatively short dive intervals
(< 60 s); Surface-Feeding (SF), chase fish with rapid circular dives, rapid directional changes, and circle swim-
ming; Socializing (S), engage in diverse interactions with some physical contact with other dolphins; and Resting
(R), low swimming speed with short dive intervals and no group activity].
We applied focal animal scan-sampling surveys as the strategy to record sequential behaviours, but if dolphins
were observed together, we considered these groups as a single analysis unit. When a dolphin was first sighted,
we classified the initial behavioural state and the behaviour exhibited at the end of a 3-min time interval fol-
lowing the initial sighting. Any individual that disappeared before the 3 min period expired was excluded from
analyses. When dolphin was sighted in a group, we recorded the predominant behaviours observed in the group
(usually each member engaged in similar behaviour patterns). We recorded a total 406 behavioural observations
(n) throughout the season, representing evenly distributed (n = 67–68) observations across the months. Out of
the total observations, 208 observations were in the control zone, and 198 were in the pressure zone.
Data analysis. Preferred prey size exploitation by fisheries. We used generalized linear mixed models with-
in a Bayesian hierarchical framework to quantify the proportion of catch by fishers that fell within the preferred
prey size of dolphins (i.e., the proportion of all fish caught that were within 3–15 cm). The model structure fol-
lowed:
(1)
Yi,t,j ∼ Binomial ni,t,j , pi,t
′
logit pi,t , ∼ Normal X i,t β, σ 2
β, ∼ Normal 0, σβ2
σ 2 ∼ IG(a, b),
σ 2β ∼ IG(c, d),
where yi,t,j is the number of fish caught that were between 3 and 15 cm at site i = 1,…n, during time period
t = 1,…T, for boat j = 1,…J. We represent the total number of fish caught at site i by boat j during time t with n i,t,j.
We were interested in estimating the expected proportion of total fish caught that were between 3 and 15 cm,
pi,t, given the characteristics of the site described by covariates in the vector x i,t. The β coefficients characterize
the direction and strength of the relationship between the covariates x i,t, and the logit of the proportion of fish
between 3 and 15 cm. We developed a suite of a priori predictive models to describe differences in proportions
pi,t among sites and times (e.g., different combinations of covariates in the vector xi,t, Table 1). We assessed the
relative strength of these hypotheses by fitting Eq. (1) to our data for each xi,t in Table 1, and calculating the
Deviance Information Criterion (DIC) for each m odel59. We used vague priors for all parameter distributions.
Specifically, we used inverse gamma (IG) priors for σ2 and σ2β and set a = b = c = d = 0.0001. We fit each model to
our data using a custom Markov chain Monte Carlo algorithm written in R statistical software60. For each model
fit, we obtained two chains of 50,000 iterations after a suitable burn-in period. We assessed chains visually and
also used the Gelman-Rubin convergence diagnostic. All chains appeared to converge and had Gelman-Rubin
diagnostic values < 1.01. We further assessed model fit using Bayesian P-values61,62. We used a random effect for
each location and time (i.e., line 2 in Eq. 1) because preliminary analyses suggested that a generalized linear
model without a random effect had extreme lack of model fit (i.e., Bayesian P-value = 1). After incorporating the
Scientific Reports | (2020) 10:18798 | https://doi.org/10.1038/s41598-020-75997-4 9
Vol.:(0123456789)www.nature.com/scientificreports/
random effect, we found no evidence for lack of model fit for any model we considered (Table 1). Furthermore,
we estimated the posterior distributions for each of these covariates using a Beta posterior distribution function,
with the binomial distribution as a sampling distribution type. We simulated 10,000 random samples from this
posterior distribution taking a uniform Beta before summarizing results for each gear type and season.
Behavioural changes to artisanal fishing boats. We applied propensity matching score analysis (PMS, con-
ditional probability) to estimate the causal effects of treatment (presence of fishing boat) on GRD behaviour
change63. As our observations were non-random, we used PMS to mimic the conditions of a randomized con-
trolled trial using all the information (covariates) sufficient to predict the probability of receiving the treatment
effect. Thus, in PMS, the likelihood that each observation gets a particular treatment effect is the same for all
observations (either control or treated), such that they depend only on the known explanatory variables of
an observation. Targeting fishing activity as the primary factor, other than natural processes, for behavioural
distraction, we included seasons (month) and time of the day [morning (400-11:59), afternoon (1200-14:59),
evening (1500-1900)] as additional explanatory variables. As we are concerned only with the fishing activity,
we assumed that these covariates are sufficient to predict the effect of the treatment. To estimate the propensity
score, we used a Generalized Linear Model (GLM) using logit link function in which treatment status (treat-
ment vs. control environment) regressed on the baseline characteristics of seasons (month) and time of the day.
We compared four a priori models with the explanatory variables [model1: time of the day, model2: seasons,
model3: time of day + seasons, model4: time of day * seasons] and used the model with the lowest AIC value
(Akaike information criterion) to predict the effect of the treatment. The model with the covariate time of the
day (model1-AIC 549.640; model2- AIC 555.585; model3 AIC-550.024, model4-AIC 549.996) was best fitted
to estimate the effects of explanatory variable on the probability of receiving treatment (e.g., anthropopressure-
fishing boat). We forwarded this model to estimate the propensity scores. To ensure that our observations were
randomly assigned, we visually checked propensity scores overlap between two treatments and found a good
degree of overlap (between 0.32 and 0.78). Furthermore, to ensure that our covariate (time of day) provides suf-
ficient information to tell the dolphin’s probability of receiving the treatment, we visually checked the balance of
covariate across treatment groups by stratifying propensity matching scores into equal-sized quintile strata (Q1,
Q2, Q3, Q4, and Q5)64. We examined the distribution of covariate within the quintiles of the propensity scores
and observed that the distribution of propensity scores closely aligned (no major differences) between treatment
groups for explanatory variable. The balanced covariate within quintiles of the propensity score gives an oppor-
tunity to estimate unbiased treatment effect (fishing boat presence) within each propensity score stratum65.
Thus, we estimated the average treatment and control effects in each propensity score quintile and also derive
the overall probability of receiving the treatment. All statistical analysis was done in R and PMS estimated using
package ‘matching’.
Activity overlap analyses. We used the behavioural response (time of dolphin first detection) and fishing (time
of fishing activity lasting ≥ 10 min) event observational datasets to analyze the diel activity overlap between
fisheries and river dolphins. We treated the times of dolphin behavioural observations and the times of actively
engaged fishing with cast or gillnet observations as random samples from the continuous distribution of the 24-h
clock. However, our inferences were limited to the diurnal portion of the day (0600–1900 h), because we did not
make observations at night and fishing activity was mostly absent during night hours. We used the kernel density
overlap approach to fit a von Mises kernel density to each activity distribution for dolphins and h umans66. We
calculated the coefficient of overlap (Δ) as the proportion of diel overlap between activity patterns of dolphins
and humans, which bounded between 0 (no overlap) and 1 (complete overlap)66. We estimated the overlap coef-
ficients for bimonthly periods to account for seasonal variation in these activity patterns and to ensure robust
sample sizes for inferences67. We performed 10,000 iterative bootstraps to determine the 95% confidence inter-
vals within the ‘overlap’ package in R to account for uncertainty in our e stimates68,69.
Data availability
All data supporting the conclusions of this article are within the paper.
Received: 2 June 2020; Accepted: 22 October 2020
References
1. Dudgeon, D. et al. Freshwater biodiversity: Importance, threats, status and conservation challenges. Biol. Rev. 81, 163–182 (2006).
2. Strayer, D. L. Challenges for freshwater invertebrate conservation. J. N. Am. Benthol. Soc. 25, 271–287 (2006).
3. Dudgeon, D. The ecology of tropical Asian rivers and streams in relation to biodiversity conservation. Annu. Rev. Ecol. Syst. 31,
239–263 (2000).
4. Rasul, G. Food, water, and energy security in South Asia: A nexus perspective from the Hindu Kush Himalayan region. Environ.
Sci. Policy 39, 35–48 (2014).
5. Paudel, S., Levesque, J. C., Saavedra, C., Pita, C. & Pal, P. Characterization of the artisanal fishing communities in Nepal and
potential implications for the conservation and management of Ganges River Dolphin (Platanista gangetica gangetica). PeerJ 4,
e1563 (2016).
6. Sharma, C. M. Freshwater fishes, fisheries, and habitat prospects of Nepal. Aquat. Ecosyst. Health Manage. 11, 289–297 (2008).
7. Turvey, S. T. et al. First human-caused extinction of a cetacean species?. Biol. Lett. 3, 537–540 (2007).
8. Kreb, D., Budiono, X. & Syachraini, X. Status and conservation of Irrawaddy dolphins Orcaella brevirostris in the Mahakam River
of Indonesia. Status and conservation of freshwater populations of Irrawaddy dolphins. Wildlife Conserv. Soc. 2007, 53–64 (2007).
9. Loch, C., Marmontel, M. & Simoes-Lopes, P. C. Conflicts with fisheries and intentional killing of freshwater dolphins (Cetacea:
Odontoceti) in the Western Brazilian Amazon. Biodivers. Conserv. 14, 3979–3988 (2009).
Scientific Reports | (2020) 10:18798 | https://doi.org/10.1038/s41598-020-75997-4 10
Vol:.(1234567890)www.nature.com/scientificreports/
10. Kelkar, N. et al. Foraging and feeding ecology of Platanista: An integrative review. Mamm. Rev. 48, 194–208 (2018).
11. Turvey, S. T. et al. Rapidly shifting baselines in Yangtze fishing communities and local memory of extinct species. Conserv. Biol.
3, 778–787 (2010).
12. Paudel, S. et al. The Endangered Ganges River dolphin Platanista gangetica gangetica in Nepal: Abundance, habitat and conserva-
tion threats. Endanger. Species Res. 29, 59–68 (2015).
13. Zhang, X. et al. The Yangtze River dolphin or baiji (Lipotes vexillifer): Population status and conservation issues in the Yangtze
River, China. Aquat. Conserv. Mar. Freshw. Ecosyst. 13, 51–64 (2003).
14. Smith, B. Irrawaddy Dolphin: Orcaella brevirostris. In Encyclopedia of Marine Mammals 2nd edn (eds Würsig, B. & Thewissen, J.
G. M.) 638–642 (Academic Press, London, 2009).
15. Gomez-Salazar, C., Trujillo, F., Portocarrero-Aya, M. & Whitehead, H. Population, density estimates, and conservation of river
dolphins (Inia and Sotalia) in the Amazon and Orinoco river basins. Mar. Mamm. Sci. 28, 124–153 (2012).
16. Iriarte, V. & Marmontel, M. River dolphin (Inia geoffrensis, Sotalia fluviatilis) mortality events attributed to artisanal fisheries in
the Western Brazilian Amazon. Aquat. Mamm. 39, 116–124 (2013).
17. Paudel, S., Timilsina, Y. P., Lewis, J., Ingersoll, T. & Jnawali, S. R. Population status and habitat occupancy of endangered river
dolphins in the Karnali River system of Nepal during low water season. Mar. Mamm. Sci. 31, 707–719 (2015).
18. Jefferson, T.A. Endangered odontocetes and the social connection: Selected examples of species at risk. In Ethology and Behavioral
Ecology of Odontocetes, 465–481. (Springer, Cham, 2019).
19. Rojas-Bracho, L. et al. A field effort to capture critically endangered vaquitas Phocoena sinus for protection from entanglement in
illegal gillnets. Endanger. Species Res. 38, 11–27 (2019).
20. Simões-Lopes, P. C., Fabián, M. E. & Menegheti, J. O. Dolphin interactions with the mullet artisanal fishing on southern Brazil: A
qualitative and quantitative approach. Revista Brasileira de Zoologia 15, 709–726 (1998).
21. Brotons, J. M., Grau, A. M. & Rendell, L. Estimating the impact of interactions between bottlenose dolphins and artisanal fisheries
around the Balearic Islands. Mar. Mamm. Sci. 24, 112–127 (2008).
22. Kelkar, N., Krishnaswamy, J., Choudhary, S. & Sutaria, D. Co-existence of fisheries with river dolphin conservation. Conserv. Biol.
24, 1130–1140 (2010).
23. Mangel, J. C. et al. Small cetacean captures in Peruvian artisanal fisheries: High despite protective legislation. Biol. Conserv. 143,
136–143 (2010).
24. Tulloch, V., Grech, A., Jonsen, I., Pirotta, V. & Harcourt, R. Cost-effective mitigation strategies to reduce bycatch threats to cetaceans
identified using return-on-investment analysis. Conserv. Biol. 34, 168–179 (2019).
25. Alley, T. R. Competition theory, evolution, and the concept of an ecological niche. Acta. Biotheor. 31, 165–179 (1982).
26. Sinha, R. K. & Kannan, K. Ganges River dolphin: An overview of biology, ecology, and conservation status in India. Ambio 43,
1029–1046 (2014).
27. Read, A. J. The looming crisis: Interactions between marine mammals and fisheries. J. Mammal. 89, 541–548 (2008).
28. Medeiros, E. S., Silva, M. J., Figueiredo, B. R., Ramos, T. P. & Ramos, R. T. Effects of fishing technique on assessing species com-
position in aquatic systems in semi-arid Brazil. Braz. J. Biol. 70, 255–262 (2010).
29. Bashir, T., Khan, A., Gautam, P. & Behera, S. K. Abundance and prey availability assessment of Ganges river dolphin (Platanista
gangetica gangetica) in a stretch of upper Ganges River, India. Aquat. Mamm. 36, 19–26 (2010).
30. Plaganyi, E. E. & Butterworth, D. S. Competition with fisheries. In Encyclopedia of Marine Mammals 2nd edn (eds Perrin, W. F. et
al.) 269–275 (Academic Press, London, 2009).
31. Aguilar, A. Population biology, conservation threats and status of Mediterranean striped dolphins (Stenella coeruleoalba). J. Ceta-
cean Res. Manag. 2, 17–26 (2000).
32. Bearzi, G. et al. Overfishing and the disappearance of short-beaked common dolphins from western Greece. Endanger. Species
Res. 5, 1–12 (2008).
33. Bearzi, G. et al. Ecology, status and conservation of short-beaked common dolphins Delphinus delphis in the Mediterranean Sea.
Mamm. Rev. 33, 224–252 (2003).
34. Amarasekare, P. Interference competition and species co-existence. Proc. R. Soc. B Biol. Sci. 269, 25–41 (2002).
35. Chilvers, B. L. & Corkeron, P. J. Abundance of indo-pacific bottlenose dolphins, Tursiops aduncus, off point lookout, Queensland,
Australia. Mar. Mamm. Sci. 19, 85–095 (2003).
36. Ng, S. L. & Leung, S. Behavioral response of Indo-Pacific humpback dolphin (Sousa chinensis) to vessel traffic. Mar. Environ. Res.
56, 555–567 (2003).
37. Frohoff, T. G. & Packard, J. M. Human interactions with free-ranging and captive bottlenose dolphins. Anthrozoös 8, 44–53 (1995).
38. Lusseau, D. The short-term behavioral reactions of bottlenose dolphins to interactions with boats in Doubtful Sound, New Zealand.
Mar. Mamm. Sci. 22, 802–818 (2006).
39. Markowitz, T. M., Dans, S. L., Crespo, E. A., Lundquist, D. J. & Duprey, N. M. Human interactions with dusky dolphins: Harvest,
fisheries, habitat alteration, and tourism. In The Dusky Dolphin (eds Würsig, B. & Würsig, M.) 211–244 (Academic Press, London,
2010).
40. Würsig, B. & Richardson, J. W. Noise, effects of. In Encyclopedia of Marine Mammals 2nd edn (eds Perrin, W. F. et al.) 765–773
(Academic Press, London, 2009).
41. Richman, N. I. et al. To see or not to see: Investigating detectability of Ganges River dolphins using a combined visual-acoustic
survey. PLoS ONE https://doi.org/10.1371/journal.pone.0096811 (2014).
42. Tyne, J. A., Johnston, D. W., Rankin, R., Loneragan, N. R. & Bejder, L. The importance of spinner dolphin (Stenella longirostris)
resting habitat: Implications for management. J. Appl. Ecol. 52, 621–630 (2015).
43. Goldman, B. et al. Circannual rhythms and photoperiodism. In Chronobiology: Biological Timekeeping (eds Dunlap, J. C. et al.)
107–142 (Sinauer Associates, Sunderland, 2003).
44. Miller-Rushing, A. J., Høye, T. T., Inouye, D. W. & Post, E. The effects of phenological mismatches on demography. Philos. Trans.
R. Soc. B Biol. Sci. 365, 3177–3186 (2010).
45. McNamara, J. M., Trimmer, P. C., Eriksson, A., Marshall, J. A. & Houston, A. I. Environmental variability can select for optimism
or pessimism. Ecol. Lett. 14, 58–62 (2011).
46. Constantine, R., Bejder, L. Managing the whale-and dolphin-watching industry: time for a paradigm shift. Marine wildlife and
tourism management: Insights from the natural and social sciences. 321–333 (CABI, 2008).
47. Pryor, K. & Norris, K. S. Dolphin Societies: Discoveries and Puzzles (Univ of California Press, Berkeley, 1998).
48. Methion, S., Díaz López, B. Aquatic Conservation: Marine and Freshwater Ecosystems. Natural and anthropogenic drivers of
foraging behaviour in bottlenose dolphins: Influence of shellfish aquaculture. https://onlinelibrary.wiley.com/doi/abs/. https://
doi.org/10.1002/aqc.3116 (Accessed Dec 2019).
49. Zhang, X. et al. Stable isotope analyses reveal anthropogenically driven spatial and trophic changes to Indo-Pacific humpback
dolphins in the Pearl River Estuary. China. Sci. Total Environ. 651, 1029–1037 (2019).
50. Lewison, R. L., Crowder, L. B., Read, A. J. & Freeman, S. A. Understanding impacts of fisheries by-catch on marine megafauna.
Trends Ecol. Evol. 11, 598–604 (2004).
51. Northridge, S. Fisheries interactions. In Encyclopedia of Marine Mammals 3rd edn (eds Würsig, B. et al.) 375–383 (Academic Press,
London, 2018).
Scientific Reports | (2020) 10:18798 | https://doi.org/10.1038/s41598-020-75997-4 11
Vol.:(0123456789)You can also read