LONG TERM FORECASTS OF WATER USAGE FOR ELECTRICITY GENERATION: SOUTH AFRICA 2030
←
→
Page content transcription
If your browser does not render page correctly, please read the page content below
LONG TERM FORECASTS OF WATER USAGE FOR
       ELECTRICITY GENERATION: SOUTH AFRICA 2030

                                     Report to the
                              WATER RESEARCH COMMISSION

                                             by

                         ANASTASSIOS POURIS1, GEORGE ALEX THOPIL2
                 1
                   Institute for Technological Innovation, University of Pretoria
        2
          Department of Engineering and Technology Management, University of Pretoria

Report No. 2383/1/14
ISBN 978-1-4312-0646-9

                                        March 2015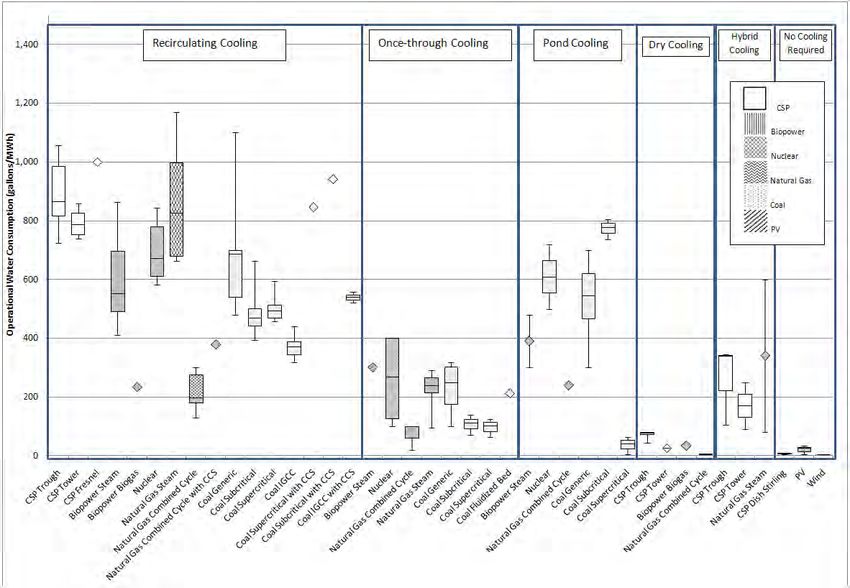
Obtainable from

Water Research Commission
Private Bag X03
GEZINA, 0031

                                              DISCLAIMER
 This report has been reviewed by the Water Research Commission (WRC) and approved for publication.
Approval does not signify that the contents necessarily reflect the views and policies of the WRC, nor does
  mention of trade names or commercial products constitute endorsement or recommendation for use.

© Water Research Commission
Executive Summary
Background:
South Africa’s energy sector, particularly the electricity sector, is currently in a state of flux as a result of
social, economic and environmental pressures. The need for more energy while sustaining the society,
economy and environment simultaneously calls for an unprecedented call for efficient management of
resources. Water being one of the basic yet constrained resources is a vital component in electricity
generation. The nexus between water and energy is a topic that will require increased and improved focus
because of a variety of factors such as increasing energy needs, increasing populations, rural-urban
dynamics and changing rainfall patterns. South Africa’s electricity generation industry is dominated by coal
based electricity generation. This technology accounts for approximately 90% of the electricity generated
by Eskom. South Africa is expected to have a deficit of 234 gigalitres by 2025, (based on conservative
estimates) as projected within national accounts published by Statistics, South Africa.
South African water resources are divided into 19 water management areas out of which 6 face moderate
shortage while 9 encounter severe shortages. Though South Africa’s electricity generation activities and
large industries only account for 6% to 8% of total water resources, these activities are located mostly
within moderately and severely constrained water management areas. Therefore water resource
management and allocation are necessary to avoid severe water scarcity in water intensive sectors and
areas.
At present Eskom’s coal based power plant fleet consists of 10 base load power plants (used during normal
demand) and 3 return to service (RTS) power plants (used during peak demand). These power plants have
diverse technical parameters and use a combination of cooling technologies which is bound to provide
different water usage profiles. Within the context of the current Integrated Resources Plan, South Africa’s
energy mix is bound to change in order to provide sufficient energy security. However the abundance of
local reserves of coal is likely to keep coal a dominant fuel source.
Aims:
The study aimed to:
Forecast water usage patterns associated with coal based electricity generation. Forecasting of water
consumption factors (in l/kWh) and total water consumption (in megalitres) is done.
Assess scenarios of water usage patterns based on cooling technology and power plant type.
Assessment of water usage patterns for wet cooled and dry cooled power plants. Assessment is also
performed based on load type for base load and non-base load power plants.
Propose projected water saving measures within distressed water management areas.
Methodology:
The methodology used in the study relies on work done by the National Energy Technology Laboratory,
USA, as a guideline. The guideline study estimates water usage based on water withdrawal and
consumption factors. The mathematical technique used to forecast total water consumption and water
consumption factors is based on a long-term moving average approach. This approach relies on historical
data of water consumption factors and generation output. The methodology also takes into consideration
the percentage change in system thermal efficiency which is a variable that has an influence on the water
consumption factor of a power plant. Historical data of South African power plants was supplied by Eskom
from archival records.
i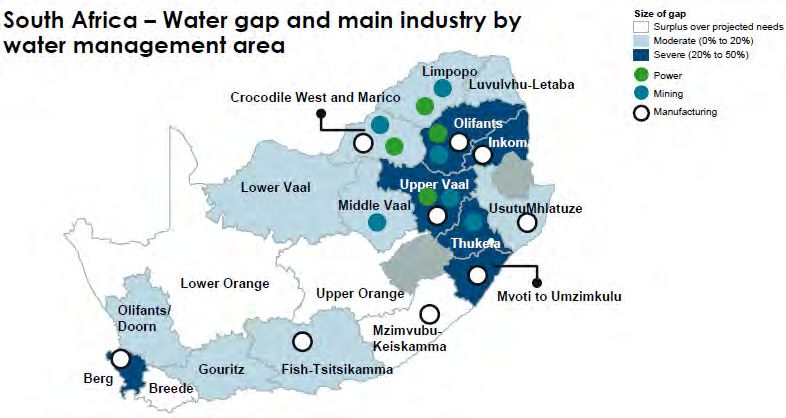
Results and conclusions:
The investigation derived the following findings:
Water consumption factor forecasts of dry cooled power plants (ranging from 0.1 l/kWh to 0.15 l/kWh)
are expected to be one order of a magnitude lower than wet cooled power plants (ranging from 2.2
l/kWh to 2.4 l/kWh).
Water consumption factor for the RTS fleet is expected to reach 3 l/kWh by the year 2020.
Water requirements are expected to increase from roughly 360 gigalitres on current levels to just
above 370 gigalitres in 2021.
Depending on the retirement of the RTS fleet, total water requirements could be reduced (by 12% to
15%) to 320 gigalitres.
RTS power plants are located within water constrained water management areas Olifants and Inkomati.
Based on the projection the total base load water consumption will increase from 332 gigalitres in 2013
to roughly 370.5 gigalitres during 2035.
The above findings are based on the forecasted electricity output from the coal power plant fleet could
reach 260 TWh by the year 2035. These forecasts are based on an expected installed capacity of 36900 MW
being operated at a capacity factor of 80%.
The results show that management of water resources in the electricity generation sector can result in
informed water allocations within water management areas. Proposed gradual retirement of the RTS fleet
could result in a savings of 15% of the forecasted shortfall of 234 gigalitres by the year 2025. The deficit in
electricity generation output caused by the retirement of the RTS fleet will have to be compensated by the
simultaneous commissioning and operation of new build power plants.
Recommendations:
Recommendations are listed as two separate groups, one for future research and one for future planning
and decision-making.
Based on the work completed, a number of areas for future research and investigation can be listed:
Credible and verifiable assessment of water usage patterns for new coal technologies.
Mapping of water usage of coal power plants with water inventories in water deficient WMAs.
Impact of emission mitigating technologies on water usage.
Estimation of water usage patterns in renewable energy technologies.
These results from these investigations are bound to add to the body of knowledge and decision-making in
the field of water resource management and energy-water nexus.
Based on the results of the study a number of observations can be made for water resource planning and
decision-making:
Eskom’s RTS power plants namely Camden, Komati and Grootvlei which are water intensive are
located in the severely constrained WMAs namely, Olifants and Inkomati. While they satisfy energy
requirements they adversely affect water needs.
The savings of roughly 35 gigalitres associated with the decommissioning of the RTS fleet and
operation of the new build power plants Medupi and Kusile, could account for almost 15% of the
forecasted deficit of 234 gigalitres by 2025.
ii
While Medupi is located in the moderately constrained WMA of Limpopo, Kusile is located in the
severely constrained Olifants WMA. Therefore Kusile will have a larger water saving impact within
the respective WMA.
The role of coal in electricity generation will be a dominant factor up until locally available
resources start to diminish. However, technologies that utilise water efficiently will have to play a
more dominant role in order to preserve national water security.
iii
Acknowledgements

The project team wishes to thank the following people for their contributions to the project.

                Reference Group Affiliation
                    Dr Jo Burgess Water Research Commission
             Dr Sibbele Hietkamp SANEDI
         Prof John Ouma Mugabe University of Pretoria
             Dr Roula Inglezi-Lotz University of Pretoria
              Ms Mpetjane Kgole Eskom
                  Prof Bok Marais University of Pretoria

                           Others
                           Eskom This study would not have been possible without ESKOM’s
                                 support through the provision of relevant data.

                                                                                                iv
Contents

Executive Summary ............................................................................................................................................ ii
Acknowledgements ........................................................................................................................................... iv
Contents ............................................................................................................................................................. v
List of Tables ...................................................................................................................................................... vi
List of Figures ..................................................................................................................................................... vi
List of acronyms and units ................................................................................................................................ vii
Glossary ........................................................................................................................................................... viii

Chapter 1: Introduction .......................................................................................................................... 1
  1.1 Background .............................................................................................................................................. 1
  1.2 Water usage in South Africa .................................................................................................................... 2
  1.3 Project aims ............................................................................................................................................. 4
Chapter 2: Literature review ................................................................................................................... 5
  2.1 Water usage technologies ....................................................................................................................... 5
       2.1.1 Once-Through (Open-Loop) Cooling ................................................................................................ 5
       2.1.2 Closed-Loop (Wet) Cooling ............................................................................................................... 6
       2.1.3 Dry (Air) Cooling ............................................................................................................................... 6
       2.1.4 Hybrid Cooling .................................................................................................................................. 8
   2.2 Water consumption in power plant cooling systems .............................................................................. 8
   2.3 Water demand forecasting .................................................................................................................... 12
   2.4 Coal based electricity production in South Africa ................................................................................. 13
Chapter 3: Methodology ...................................................................................................................... 16
  3.1 Assumption list ...................................................................................................................................... 16
  3.2 Mathematical model ............................................................................................................................. 18
Chapter 4: Results ................................................................................................................................ 21
  4.1 Base load analysis .................................................................................................................................. 21
       4.1.1 Wet cooled base load analysis ....................................................................................................... 23
       4.1.2 Dry cooled base load analysis ......................................................................................................... 24
   4.2 Return to Service analysis...................................................................................................................... 25
   4.3 New build analysis ................................................................................................................................. 26
   4.4 Combined cases ..................................................................................................................................... 27
   4.5 Findings .................................................................................................................................................. 28
Chapter 5: Conclusions and Recommendations ..................................................................................... 31
  5.1 Conclusions ............................................................................................................................................ 31
  5.1 Recommendations for future work ....................................................................................................... 31
  5.2 Recommendations for planning ............................................................................................................ 32
References ........................................................................................................................................... 34

                                                                                                                                                                       v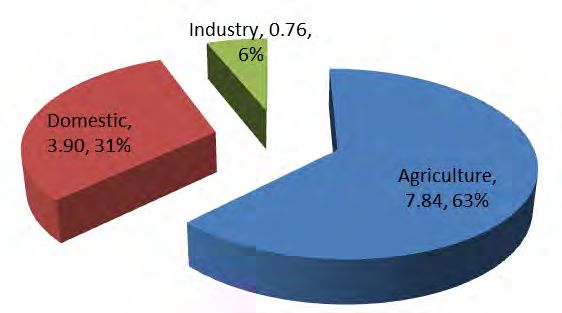
List of Tables

Table 1: Technology innovations to reduce water usage .................................................................................. 9
Table 2: Power plant cooling technologies used in the USA ........................................................................... 10
Table 3: Cooling technologies in Eskom coal power stations (current and future) ........................................ 13
Table 4: Assumption differentiation between current study and BCS5 scenario ........................................... 16
Table 5: Indicative water consumption factor for new coal technologies ...................................................... 32

List of Figures

Figure 1: South Africa water management area gaps ....................................................................................... 2
Figure 2: Water withdrawal in South Africa (2011 billion cubic meters) .......................................................... 3
Figure 3: Open loop cooling system .................................................................................................................. 6
Figure 4: Wet-recirculating closed loop cooling system.................................................................................... 7
Figure 5: Dry cooling system ............................................................................................................................. 7
Figure 6: Hybrid cooling system ........................................................................................................................ 8
Figure 7: Operational water consumption factors for electricity generating technologies ............................ 11
Figure 8: Eskom power plants ......................................................................................................................... 14
Figure 9: Base load power plant water consumption factor projection ......................................................... 21
Figure 10: Base load power plant generation output projection .................................................................... 22
Figure 11: Base load total power plant total water consumption projection ................................................. 22
Figure 12: Wet cooled base load water consumption factor projection ........................................................ 23
Figure 13: Wet cooled power plant total water consumption projection ...................................................... 23
Figure 14: Dry cooled base load water consumption factor projection.......................................................... 24
Figure 15: Dry cooled power plant total water consumption projection ....................................................... 24
Figure 16: RTS power plant water consumption factor projection ................................................................. 25
Figure 17: RTS total power plant total water consumption projection .......................................................... 25
Figure 18: New build power plant water consumption factor projection ...................................................... 26
Figure 19: New build power plant total water consumption projection ........................................................ 27
Figure 20: Combined water consumption factor projection ........................................................................... 27
Figure 21: Combined coal power plant water consumption projection ......................................................... 28
Figure 22: Coal fleet average consumption forecast (weighted vs average) .................................................. 29
Figure 23: Electricity output per technology fleet forecast ............................................................................ 29
Figure 24: Combined coal fleet generation forecast ....................................................................................... 30

                                                                                                                                                         vi
List of acronyms and units
CSP Concentrating solar power
DoE Department of Energy
EIA Energy Information Administration
EPRI Electric Power Research Institute
FBC Fluidised Bed Combustion
FGD Flue gas desulfurization
GDP Gross Domestic Product
Gigalitre 1000000 m3
GWh Gigawatt-hour
kWh kilowatt-hour
Megalitre 1000 m3
Mm / yr millimetre per year
Mm / annum millimetre per annum
NETL National Energy Technology Laboratory
PF Pulverised Fuel
RTS Return to service
TWh Terawatt-hour
UGC Underground Coal Gasification
USGS United States Geological Survey
WMA Water management area
viiGlossary
Base load Power plants that provide base load electricity demand are called base load plants.
Capacity factor Indicates how much electricity a power plant produces relative to the maximum it
could produce at continuous full power operation during a period and is expressed in
percentage terms.
Generation output Is the amount of electricity generated based on the nominal capacity usually
calculated on an annual basis and expressed in MWh.
Installed capacity Also known as rated capacity is the capacity that a power plant is designed to deliver
and is expressed in MW.
New build Power plants that are currently under construction and are expected to deliver base
load electricity demand upon completion. These power plants are called “new build”
to distinguish from existing base load power plants.
Nominal capacity Also known as plant capacity is the capacity that a power plant can deliver in reality
because of constraints such as aging and technical deteriorations and is expressed in
MW.
Return to service Power plants that were decommissioned but had to be brought back to service
because of increasing electricity demand.
viiiChapter 1: Introduction
1.1 Background
Scarcity of water is a broad issue that is a concern for national governments and policy making bodies the
world over. More than 1 billion people currently lack access to safe drinking water, and 2.4 billion people
lack access to improved sanitation (The Atlantic Council, 2005). It is estimated that by 2025, more than 60%
of the world’s population will live in countries with significant imbalances between water requirements and
supplies, largely in Asia, Africa, and Latin America (Feeley et al., 2008).
South Africa is located in a semi-arid region and considered among one of the 30 driest countries in the
world. South Africa could face a situation of extensive water scarcity unless current reserves and usage
patterns are managed properly (De Wet, 2010). These assessments are given further weight when
considering the fact that South Africa’s mean annual precipitation is 497 mm/yr, which is well below the
global average of 860 mm/annum (Turton, 2008). Putting things further into perspective, Botswana and
Namibia have an annual rainfall of 400 mm/yr and 254 mm/yr respectively, but have populations of only
2,00 and 2,28 million, while South Africa has a population of 50 million people (World Bank, 2010). To add
to this, South Africa’s relatively low rainfall rate and large population size place a skewed level of stress on
the limited water resources. South Africa has no extensive or navigable rivers, with the Zambezi River being
the closest fitting these characteristics. The rivers in South Africa, namely the Limpopo, Inkomati, Pongola
and Orange, have a combined annual flow of 49 000 cubic metres per year (m3/a), which is less than half of
the Zambezi’s, which highlights South Africa’s limited water availability when compared to neighbouring
regions (NWRS, 2004). The hard rock nature of the country’s geology allows only about 20% of the
groundwater resources’ major aquifer systems to be available for utilisation on a large scale.
As a result of the presence of minerals and resources in areas devoid of major water sources, urban
populations in regions (such as Gauteng and Mpumalanga Highveld) have increased and led to a skewed
supply-demand scenario.
To facilitate water management the country has been divided into 19 catchment-based water management
areas (WMA). The inter-linking of these areas plays a major role in catering to country’s needs and
preventing disparity of water supply. Of the 19 WMAs, water requirements exceeded availability in 15
catchment areas (NWRS, 2004). The province of Gauteng in particular is expected to suffer shortages in the
future. However, cooperation with the Lesotho government through the Lesotho Highlands Project is
expected to ease shortages in the Province (South African Water Research Commission, 2009).
The South African situation is not unique in the world. A similar situation of natural misallocation of water
resources has also been observed in China, with the north of the country facing severe shortages compared
to the south. China’s economy is similar to South Africa’s from the perspective of the agricultural sector’s
water usage to GDP contribution. China’s agricultural sector uses 65% of water resources, while
contributing to less than 15% of the GDP (Wong, 2009). South Africa, similarly, utilises 66% of the water
resources to generate 3% of the GDP (DWA, 2013). While restructuring of the economy may alleviate some
of the water challenges another possible major cause of scarcity of water may be related to climate change.
From a sub-Saharan and South African perspective, the projections portray a negative picture, with rainfall
expected to decrease by 50% (De Wit and Stankiewicz, 2006).
11.2 Water usage in South Africa
The majority of water resources (62%) in South Africa is used for agriculture and irrigation. Rural
and urban use accounts for 18% and usage by large industries and power generation accounts for
8% (CSIR, 2010). Similar patterns can be observed in the sectoral water usage breakdown provided
in the second National Water Resource Strategy (DWA, 2013). Of the 19 WMAs, 9 encounter
moderate shortages whereas 6 WMAs face severe shortage (as shown in Figure 1). Though water
usage in power generation and large industries is approximately only 8%, the regions where these
industries are located in moderately to severely water constrained WMAs (Mckinsey & Company,
2009). The national accounts database related to WMAs published by Statistics South Africa,
anticipate a base case water deficit of 234 gigalitres by the year 2025 (Stats SA, 2010). Therefore,
informed water usage within the power generation sector could ease the water burden in the
severely and moderately constrained WMAs.
Figure 1: South Africa water management area gaps Source: (Mckinsey & Company, 2009)
The World Bank databank provides data for South African sectoral water withdrawal for the year 2011
(shown in Figure 2). The focus of this study is to analyse the usage of water for electric power
generation. The field of integrated water-energy studies was established in 1994 by Peter Gleick
with his Annual Review of Energy and the Environment article. Gleick (1994) employed a life cycle
analysis of water and energy resources to explain and quantify the water intensity of energy
resource development from extraction through power generation, as well as the energy intensity
of the water sector from extraction through conveyance, treatment, distribution and end use.
Despite the importance of the field for policy and planning “the depth of Gleick’s call for
regulatory and operational innovation, and for more interdisciplinary research to capture the full
benefits of integrated water-energy resource management, largely remains unmet” (Water in the
West, 2013; p1).
2Figure 2: Water withdrawal in South Africa (2011 billion cubic metres) (Source: World Bank, 2014)
Water for electricity is of particular importance as thermoelectric power plants are among the most
voracious users of water. In the United States the Geological Survey estimated that in 2005 the
thermoelectric power plants were responsible for nearly 52% of surface freshwater withdrawals and 43% of
total water withdrawals (Kenny et al., 2009). Power plants only consume 7% in once-through cooling
technology while consuming 70% in closed loop (wet) cooling respectively (and returning the rest to the
environment). 43% of the generating capacity is associated with once-through cooling while 42% uses wet
closed loop cooling (Feeley et al., 2008). To put it into perspective thermoelectric withdrawals were 200
billion gallons1 a day or 670 gallons per U.S. inhabitant (Water in the West, 2013).
According to Kenny et al. (2009, p47) of the U.S. Geological Survey “withdrawal” is defined as the amount
of water removed from the ground or diverted from a water source for use, while “consumption” refers to
the amount of water that is evaporated, transpired, incorporated into products or crops or otherwise
removed from the immediate water environment.
In other words water withdrawn is distinguished from water consumption under the logic that water that is
withdrawn from a source can be returned to that source. However, if the water withdrawn from a source is
not returned to the source, the water usage is categorised as consumption. Different sectors have
dissimilar water withdrawal and consumption rates. The technologies used in different sectors also affect
the withdrawal and consumption rates. The focus in this investigation is water usage patterns of the
multiple power coal (thermal) power plants in South Africa. Depending on the cooling technologies in use,
power plants tend to have different water withdrawal and consumption rates
The following chapter constitutes the literature review which describes certain key technologies in the field
of energy- water nexus, provides a review of relevant literature and refers to efforts to forecast water
demand for electricity generation. Chapter 3 outlines the methodology followed in this effort and Chapter 4
provides the results of the investigation. The final chapter provides conclusions and recommendations for
further research.
1
Please note billion in this report refers to short billion. 1 US gallon = 3.785 litres
31.3 Project aims
The following were the aims of the project:
1. To forecast water usage patterns associated with coal based electricity generation.
Forecasting of water consumption factors (in l/kWh) and total water consumption (in
megalitres) is performed.
2. To assess scenarios of water usage patterns based on cooling technology and power plant type.
Assessment of water usage patterns for wet cooled and dry cooled power plants.
Assessment is also performed based on load type for base load and non-base load power plants
3. To propose projected water savings measures within distressed water management areas.
4Chapter 2: Literature review
Over the past few decades the evolution of technologies has resulted in countries employing a combination
of mechanisms to operate thermal power plants (Barroso et al., 2010). The first part of this chapter will
introduce a number of cooling technologies that are used internationally. The second section provides a
discussion of the consumption of water occurring within diverse electricity generation technologies. The
combination of cooling technology and fuel technology tends to alter the water demand in electricity
generation drastically. Therefore water demand forecasting is essential in determining the contribution of
electricity generation within the overall water usage profile of a country or region. Having discussed the
relevant topics in chronological order the South African electricity generation profile and thermal power
plant cooling technologies are introduced and discussed.
2.1 Water usage technologies
This section elaborates on the concepts often referred in investigating water use at power plants. The
concepts of water withdrawal, water consumption and the various types of cooling systems are part of
these issues. It should be emphasised that water is also used for non-cooling plant processes such as for
operation of flue gas desulfurization (FGD) devices, ash handling, wastewater treatment, and wash water.
However, cooling water usage is by at least one order of magnitude larger than the other uses (Rutberg,
2012).
Water use for cooling of thermoelectric power plants is affecting the overall water supply and the
ecological health of surface water bodies (Rutberg, 2012). In a number of occasions permits for proposed
plants have been denied because of water availability concerns and potentially adverse effects on aquatic
life in various locations internationally (Anderson, 2006). Similarly during droughts there have been
occasions that generation plants have been shut down because if operated they would not be compliant
with water use regulations (Martin, 2012). Hence, water use for electricity generation affects regional
ecology and security of supply of both water and electricity.
There are different technologies used for cooling which possesses advantages and disadvantages. The
most used technologies are: once-through (open-loop) cooling, closed-loop (wet) cooling, dry (air) cooling
and hybrid cooling (GAO, 2009).
2.1.1 Once-Through (Open-Loop) Cooling
Once-through cooling uses an ample supply of water (from an ocean, river, lake, cooling pond or canal) to
run through the system’s heat exchanger to condense the low-pressure steam at the exhaust of the
turbines (Figure 3). Although these plants do not consume much water (i.e., they return about 99% of the
water to the source), the availability of water is critical to plant operation because of the substantial
demand (Water in the West, 2013). This makes these plants vulnerable to droughts, high-temperature
events and competition for water resources. Moreover, the large intake of water is extremely disruptive for
aquatic life, and the discharge temperatures alter aquatic ecosystems considerably. The intake structures
may kill fish and other aquatic organisms and the discharge of heated water can be particularly lethal to
native aquatic species (Sierra Club, 2011).
5Figure 3: Open loop cooling system (Source: GAO, 2009)
2.1.2 Closed-Loop (Wet) Cooling
While once-through cooling relies on the high thermal capacity of water, closed-loop cooling relies on the
high-energy requirements of water evaporation (Water in the West, 2013). Cooling water circulates
between the condenser and a cooling tower (Figure 4). These cooling systems have much lower water
requirements but consume much more of the withdrawn water. The water source can be from the ocean, a
lake, a river, a cooling pond or a canal. Due to stringent regulations concerning open-loop cooling, closed-
loop cooling has become the technology used since the 1970s (U.S. DOE, 2008).
2.1.3 Dry (Air) Cooling
Dry cooling systems are very similar to closed-loop systems, but air replaces water to cool the circulating
cooling fluid, thus eliminating water withdrawal and consumption (Figure 5). However, this greatly impacts
plant efficiency due to a lower thermodynamic theoretical maximum (Carnot cycle) and high electricity use
for powering the massive fans used in cooling (Water in the West, 2013). Dry cooling is heavily impacted by
ambient temperatures and humidity and will perform less well than wet cooling, particularly in hot and dry
climates where the use of such technologies is most desirable. The average loss of output is about 2%
annually (Mielke et al., 2010), but can be as high as 25% at the peak of summer when demand is at its
highest (U.S. DOE, 2006). Moreover, the capital cost of such a system is about 10 times more than that of
an open-loop system (about $180/kW, EPRI, 2007), which makes it very unattractive to utilities without
massive subsidies and grants. Dry cooling systems are more expensive than conventional wet cooling
techniques when considering the infrastructural investments required (EPRI, 2008).
6Figure 4: Wet-recirculating closed loop cooling system (Source: GAO, 2009)
Figure 5: Dry cooling system (Source: GAO, 2009)
72.1.4 Hybrid Cooling
Hybrid cooling technology uses a combination of wet and dry cooling systems, where wet and dry cooling
components can be used either separately or simultaneously (Figure 6) . This way, the system can operate
both the wet and dry components together or rely only on dry cooling to avoid water use, economically
reducing water requirements of the wet systems by up to 80%. Hybrid cooling uses bundles of cooling
elements arranged in concentric rings inside the cooling tower. Heat is conducted from the warm water by
these cooling elements, which have cool water flowing through them. Cooling water that flows through the
elements is then cooled down by cold air passing over and then returned to the condenser. This system is
referred to as a closed system since there is no loss of water due to evaporation. Dry cooling techniques
differ in the respect that heat exchange occurs between hot steam leaving the turbine blades and a heat
exchanger. Air passing through the exchanger is supplied by multiple electrical fans. The heat forms steam
that is removed by the air within the exchanger thereby condensing the steam back into water. Capital
costs usually fall midway between wet and dry cooling systems (EPRI, 2007).
Figure 6: Hybrid cooling system (Source: GAO, 2009)
The adoption of various technologies determines the water consumption in the electricity generation
mechanisms in a country.
2.2 Water consumption in power plant cooling systems
Water is a critical resource in the operations of all thermoelectric power generation. ‘Thermoelectric power
generation’ is a broad category of power plants consisting of coal, nuclear, oil, natural gas, and the steam
portion of gas-fired combined cycles. Thermoelectric generation represents the largest segment of
electricity production in a number of countries including South Africa (Feeley et al., 2008).
Water consumption is recognized internationally as an important factor driving decisions on where to build,
retrofit or retire cooling stations and even entire power plants (Barker 2007; U.S.DOE 2006). However,
limited studies investigating water cooling needs exist mainly because of the lack of detailed data. Field
data are sparse and of poor quality internationally (Mittal et al., 2009). Mittal et al. (2009) identified
8significant limitations in the USA data. They state “respondents may use different methods to measure or
estimate data, and instructions may be limited or unclear. Respondents may make mistakes or have
nontechnical staffs fill out surveys” (p, 69).
Rutberg (2012) while discussing the issue states that, “outside the US, available data is generally even
sparser. One notable exception, however, is South Africa. Eskom the main public utility maintains detailed
accounts of water use at each of their power plants.”
Research on the technical aspects of water use minimization is widespread. For example, the US
Department of Energy’s (DOE) National Energy Technology Laboratory (NETL) is engaged in a research and
development (R&D) program to reduce freshwater withdrawal and consumption from existing and future
thermoelectric power generating facilities. The NETL program can be classified in five categories as
described in Table 1.
Table 1: Technology innovations to reduce water usage
Category Description (Adapted from Feeley et al., 2008)
A) Provide alternate source of cooling water make-up
Use of produced water in re-circulated cooling systems at power generation facilities and
development of an impaired water cooling system
Development and demonstration of a modelling framework for Assessing the Efficacy of using mine
water for thermoelectric power generation
Reuse of treated internal or external wastewaters in the cooling systems of coal-based
thermoelectric power plants
B) Increase cycles of concentration for wet re-circulating systems, thereby decreasing wet cooling
tower blow-down requirements
A synergistic combination of advanced separation and chemical scale inhibitor technologies for
efficient use of impaired water as cooling water in coal-based power plants
Application of pulsed electrical fields for advanced cooling in coal-fired power plants
C) Advanced cooling technology
Use of Air2AirTM technology to recover fresh-water from the normal evaporative cooling loss at
coal-based thermoelectric power plants
D) Reclaim water from combustion flue gas for use as cooling water make-up
Water extraction from coal-fired power plant flue gas
Recovery of water from boiler flue gas
Reduction of water use in wet FGD system
E) Reduce cooling tower evaporative losses via coal drying
Use of coal drying to reduce water consumed in pulverized coal power plants
Macknick et al. (2011) investigated the water requirements for a number of energy technologies. The
technologies addressed consist of configurations of concentrating solar power (CSP), solar photovoltaic
(PV), wind, bio-power, geothermal, hydroelectric, nuclear, natural gas and coal technologies. Cooling
system technologies considered include wet re-circulating technologies (evaporative cooling towers), once-
through cooling systems (open loop cooling), air-cooled condensing (dry cooling), hybrid wet and dry
cooling systems (hybrid cooling), and pond cooling systems.
Figure 7 shows the operational water consumption factors for different electricity generating technologies.
The figure is in the form of box and whisker plots. Whisker ends represent maxima and minima of
operation consumption. Upper and lower ends of boxes represent 75th and 25th percentile, respectively.
Horizontal lines in boxes represent medians (50% of observations).
9Water in the West (2013) among others summarised the technologies used for cooling in the USA. Their
findings appear in Table 2.
Table 2: Power plant cooling technologies used in the USA
NETL (2009) Based on Platts (2005) EIA Forms 860 & 923 (2012)
Wet Wet Once Through
Generation Once- Cooling
Recirc- Dry Recirc- Cooling Dry Hybrid
Type through Ponds Freshwater Seawater
ulation ulation
33.5% 2.8%
Coal 48.0% 39.1% 12.7% 0.2% 46.3% 17.0% 0.4% 0.0%
36.3%
Fossil Non- 28.1% 25.5%
23.8% 59.2% 17.1% 0.0% 30.2% 16.2% 0.0% 0.0%
Coal 53.6%
Combined 7.4% 6.1%
30.8% 8.6% 1.7% 59.0% 71.3% 2.9% 11.7% 0.6%
Cycle 13.5%
31.1% 20.2%
Nuclear 43.6% 38.1% 18.3% 0.0% 36.0% 12.7% 0.0% 0.0%
51.3%
Total 41.9% 42.7% 14.5% 0.9% 49.1% 26.7% 8.5% 12.7% 2.9% 0.1%
Source: Adapted from Water in the West, 2013.
The authors further concluded that their analysis shows that water intensities exhibit strong variability
within fuel types and cooling types. Yang and Driegielewski (2007) investigated the major determinants of
water withdrawal and consumption in terms of types, cooling system types; operation conditions; and
water sources. Klett et al. (2007) used detailed process models of state of the art fossil fuel power plants to
benchmark water use plant performance.
Chandel et al. (2011) investigated how climate change policy involving a price on carbon would change the
mix of power plants and the amount of water they withdraw and consume to generate electricity. The
authors find that under all the climate-policy scenarios, fresh water withdrawals decline between 2% and
14% relative to a business-as-usual scenario of no U.S. climate policy. Furthermore, water used decreases
as the price on CO2 under the climate policies increases. At relatively high carbon prices (>$50/tonne CO2),
however, retrofitting coal plants to capture CO2 increases freshwater consumption compared to business as
usual in 2030. The analysis suggests that climate policies and a carbon price will reduce both electricity
generation and freshwater withdrawals compared to business as usual unless a substantial number of coal
plants are retrofitted to capture CO2.
Zemlick et al. (2013) explored the suitability of using non-traditional sources of water, namely wastewater
and brackish ground water for future thermoelectric cooling in 22 continental Electricity Market Module
Regions and linked them to electricity demand to 2013. They argued that while neither resource can meet
all future demand by thermoelectric generation, when added to the existing water supply and management
portfolio, they provide significant augmentation to existing traditional water supplies.
A number of studies investigated the effects of climate change on the European power sector (van Vliet,
2013; Rübbelke et al., 2011). Hydropower and thermoelectric (nuclear and fossil-fuelled) power plants
currently contribute more than 91% of total electricity production in Europe. The investigations show that
the combination of increased water temperatures and reduced summer river flow under climate change is
likely to affect both hydropower and thermoelectric power generating capacity in Europe, with distinct
impacts on electricity prices.
10Figure 7: Operational water consumption factors for electricity generating technologies
IGCC: Integrated gasification combined cycle; CCS:Carbon capture and sequestration; CSP: Concentrating solar power; 1 US gallon = 3.785 litres.
(Source: Macknick et al., 2011)
112.3 Water demand forecasting
There are a limited number of investigations in the open literature forecasting water demand for electricity
generation. As already discussed lack of detailed data contributes to that scarcity. Examples of relevant
investigations include the following:
Feeley et al. (2008) developed 25 year forecasts of thermoelectric water use in the USA. The authors used a
set of model plant profiles essential categories broken out by plant and cooling system configuration. For
each profile, associated water withdrawal and consumption factors were calculated with EIA survey data.
Water use was projected using different scenarios specifying electricity demand, generation mix (model
plants) and penetration of water use reduction technologies.
King et al. (2008) projected power plant water use in the state of Texas over a 10 year time frame. The
study focused on individual plants and when data were not available default withdrawal and consumption
factors were used.
The National Energy Technology Laboratory (2009) estimated future freshwater withdrawal and
consumption from domestic thermoelectric generation sources for five cases, using regional projections for
capacity additions and retirements. The results suggest that carbon capture technologies could increase the
water demand of thermoelectric power plants and indicate that consumption is expected to increase in all
cases.
NETL (2013) updated the previous reports. The broad methodology is as follows:
Step 0: Estimate future capacity and generation: Annual Energy Outlook 2013 projections of capacity and
generation to 2035 are used in the analysis to calculate future thermoelectric generation water withdrawal
and consumption.
Step 1: Develop model plants: The existing thermoelectric fleet was segregated into numerous
configurations, called “model plants”.
Step 2: Calculate water withdrawal and consumption factors: For each model plant defined in Step 1,
water withdrawal and consumption factors were calculated
Step 3: Quality Control and Model Validation Step 3 represents efforts designed to ensure quality control
for the analysis. The water withdrawal and consumption factors that were used in the model were obtained
through a rigorous statistical evaluation. Box-plots of data were used to identify outliers.
Step 4: Develop Future Cases Future water withdrawal and consumption for the U.S. thermoelectric
generation sector are estimated for five cases – one reflecting status quo conditions, two reflecting varying
levels of regulations regarding cooling water source, one incorporating dry cooling and one reflecting
regulatory pressures to convert existing once-through capacity to re-circulating capacity.
Step 5: Calculate regional withdrawal and consumption to 2035
Step 5 integrates the water withdrawal and consumption factors calculated in Step 2 with the various cases
defined in Step 4 to assess the regional and national impacts on water withdrawal and consumption out to
2035.
12A few studies have attempted to analyse water usage patterns in different sectors in South Africa (e.g.
Jansen et al. 2006; Rousseau et al. 2001).
However, the forecasting of water usage in power generation is an aspect that requires further attention
and is analysed further in this report. At this juncture the introduction of the South African coal based
electricity generation is warranted before delving into water forecasting.
2.4 Coal based electricity production in South Africa
South Africa has 13 coal power plants of which ten are base load power plants while three are return to
service power plants used for peak demand times (Eskom, 2014). Base load power stations are those that
operate to deliver base (or normal) demand. Peak load power stations are operated or switched on in
conjunction with base load plants to supply power during periods of peak demand. The current fleet of coal
power plants use a combination of technologies for cooling. Figure 8 and Table 3 provides a summary of
the location of the coal power plants in South Africa and the cooling technologies used in each power plant
respectively.
Table 3 shows the cooling technologies being used in Eskom’s current and future coal-fired plants; their
geographic location and the year of their completion. As discussed, the wet recirculation cooling
technology, uses cooling water through condenser tubes with steam on the outside. The temperature
variation between the water and steam causes condensation. The warm water in the condenser is collected
in the cooling tower where an upward draft of air removes the heat. The cooled water is then recirculated
to the condenser. A major drawback of this technique is that water is lost through evaporation when the
warm cooling water comes in contact directly with air (Eskom, 2010).
Table 3: Cooling technologies in Eskom coal power stations (current and future)
Category Name Cooling technique Location Year of completion
Arnot Wet recirculating Mpumalanga 1975
Duvha Wet recirculating Mpumalanga 1984
Hendrina Wet recirculating Mpumalanga 1970
Kendal Indirect dry Mpumalanga 1993
Kriel Wet recirculating Mpumalanga 1979
Base load
Lethabo Wet recirculating Limpopo 1991
Majuba Wet recirculating and dry Mpumalanga 2000
Matimba Direct dry Mpumalanga 1991
Matla Wet recirculating Mpumalanga 1983
Tutuka Wet recirculating Mpumalanga 1990
Camden Wet recirculating Mpumalanga 1967
Return-to-
Grootvlei Wet recirculating and dry Mpumalanga 1973
service
Komati Wet recirculating Mpumalanga 1966
Medupi Direct dry Limpopo On-going
New build
Kusile Direct dry Mpumalanga On-going
Source: Adapted from Wassung, 2010.
13Figure 8: Eskom power plants
Of the 10 existing base load coal power plants, eight use wet recirculation cooling technologies while two
(Kendal and Majuba) use dry cooling approaches. The dry cooling technology uses air instead of water in
the heat exchange mechanism to cool down high temperature steam.
14In summary, the need for water use forecasting in the topic of energy-water nexus, is essential in South
Africa. The literature review identifies that European researchers place particular emphasis on the effects
of environmental changes on the demand for water. Furthermore the review shows that total water usage
and water usage consumption factors are primarily dependent on the type of cooling technology used.
However other factors such as physical location of power plant, efficiency of power plant, type of boiler
used, type of coal used, etc., are also important factors when estimating water usage patterns. Therefore
accurate accounting of water consumption has to be attributed based on the priority of the factors listed
above. The more important quantifiable technical factors for South African coal power plants are discussed
in the following chapter along with the assumptions used within the methodology.
15Chapter 3: Methodology
In this chapter the baseline assumptions and methodology are presented. The first section provides the
criteria on which the baseline assumptions have been derived, while the second section explains the
methodology and the mathematical model.
3.1 Assumption list
The assumptions used within this study are based on the foundations of the revised Integrated Resources
Plan (IRP) baseline case step 5 (BCS5) (IRP 2013, p75). The revised IRP takes into account the ministerial
determinations made post 2010, by taking into consideration the allocation of renewable programmes in
2011 and 2012. However, the current study has taken the liberty of making certain realistic assumptions
based on the current state of the South African economy and the electricity industry.
The assumptions are structured to provide four sets of information on varied, but related topics, namely;
Assumption differentiation between current study and BCS5 scenario.
Electricity capacity demand analysis
Technical assumptions
Scenario analysis
The assumptions are listed in tabular form (Table 4) and are contrasted with the revised IRP BCS5
assumptions.
Table 4: Assumption differentiation between current study and BCS5 scenario
Criteria Current study BCS5 scenario
The BCS5 scenario decommissioning
The water forecasting study assumes that the
schedule (IRP 2013, p60) assumes that
Return to RTS fleet will be decommissioned by the year
the RTS fleet will be operational until
Service (RTS) 2020. This assumption is in order to prevent
the year 2030. The phase out is
fleet increasing water usage per unit of electricity
scheduled over a 10 year period
generated.
starting from 2020.
The current study assumes that the life of older
The BCS5 scenario assumes power
power plants such as Hendrina, Arnot and Kriel
plants Hendrina, Arnot and Kriel (total
Existing fleet will be extended to operate fully or partially as
of 7200 MW) to be fully
an alternative to the RTS fleet which has poorer
decommissioned before the year 2030.
water efficiency factors.
The new build power stations of Medupi and
Medupi and Kusile are categorised as
Kusile are expected to come online the national
part of the existing fleet. The timelines
New build grid between the years on 2015 & 2020. This is
set for the first units of these power
in conjunction with the decommissioning of the
plants are 2014 and 2015 respectively.
RTS fleet.
The current study acknowledges the presence
The BCS5 scenario allocates 2450 MW
of new coal technologies in the future of the
of capacity associated with new coal
coal road map in South Africa but refrains from
New coal technologies such as underground coal
estimating water usage patterns in these
technologies gasification (UCG), advanced pulverised
technologies because of the ambiguity
fuel (PF) and fluidised bed combustion
associated with these technologies on a
(FBC) technologies.
commercial scale locally.
Total capacity 36900 MW 36230 MW
16 Electricity capacity demand analysis
Electricity supply and demand are in a critical stage in South Africa. At this point in time the installed
capacity, taking into account the base load power plants (35000 MW) and RTS fleet (3000MW) is a total of
approximately 38000MW while the nominal capacity is estimated to be 35700MW (Eskom, 2014a).1 Based
on the IRP BCS5 the estimated installed capacity for existing coal technologies2 (which includes Medupi and
Kusile at 9600MW) for the year 2030 is 36900 MW (IRP 2010, p20 and p75). Therefore installed capacity in
2030 for currently operating base load plants would be 27300 MW which is after the decommissioning of
the RTS fleet (IRP 2010, p60).
At current levels of generation (213 TWh), existing power plants are operating at a capacity factor of 77.8 %
which is typically high and unsustainable for current fleet of older power plants. The presence of the new
build power plants (Medupi and Kusile) with a capacity of 9600 MW is bound to reduce the load on the
existing fleet. The decommissioning of the RTS fleet would bring total available coal power installed
capacity to 36900 MW (with existing base load contributing 27300 MW and new build at 9600 MW).
However it is critical to note that even if the new build power plants are operated at a capacity factor of
80% which is realistic for the type of technology, the strain on the existing base load plants and the national
grid will not ease unless other newer power plants (nuclear, renewable, gas, etc) are available.
The current study projects that based on current demand trends, taking into account availability of the new
build power plants and decommission of the RTS fleet in combination with the current base load power
plants, total demand could reach 255 MWh by the year 2030, which can be supplied at 78.4% capacity
factor. These assumptions are in line with Eskom’s capacity factor assumptions of 80:10:10 for the coal
power plant fleet, which means that 80% of the total capacity is available any time, while 10% is scheduled
for planned outages and the remaining 10% scheduled for unplanned outages.
Technical factors:
The current study takes into account primary power plant operational parameters in the forecasting model,
which are;
Deduced capacity factor
Boiler technology
Cooling type technology
Thermal efficiency
The aforementioned factors are the major technical determinants that affect the performance of a coal
power plant and thereby directly and indirectly altering the water usage and consumption trends.
Scenario analysis:
The generation study provides analysis based on multiple scenarios categorised on technology type and
load type; those being:
1
These figures do not take into account the decrease in nominal capacity due to unplanned maintenance which has
led to the 2014-2015 load shedding scenario.
2
Existing coal technologies according to the IRP include current base load power plants and Medupi and Kusile. These
power plants are categorised separate from new coal technologies.
17 Base load
wet cooled base load
dry cooled base load
RTS analysis
New build analysis
Combined cases
The analyses of these scenarios are necessary and relevant when taking into account the current fleet of
South African coal power plants. The scenario analysis also takes into account projections for new build
power plants Medupi and Kusile, which are expected to be part of the national grid within the next two
years.
3.2 Mathematical model
The pathway used to estimate (or forecast) the water usage consumption is based on the development of a
model which forms a combination of steps uniquely developed for this study and from those mentioned
within the NETL methodology (in section 2.3). Since long term generation output forecasts or water usage
factors are not available for individual South African coal-fired power plants, a mathematical forecasting
model had to be developed to estimate generation output. The forecasting model relies on historical water
consumption and electricity generation data, for each power plant, from the year 1989 to 2012, obtained
from Eskom’s data archives. The forecasting technique is based on a moving average forecast in order to
accommodate average yearly values of water usage and generation output estimates (Box et. al., 2013).
The method uses the estimation steps used in the NETL (2013) methodology. However the forecasting
technique used during the estimation steps varies from the NETL methodology. The primary steps involved
in the devised methodology are as follows:
1) Estimate future long-term generation output of each coal fired power plant
2) Estimate future water consumption factor for each power plant based on future generation output and
average system thermal efficiency
3) Estimate total water usage from steps 1 and 2
4) Scenario building based on technology and time-period
Step 1
The estimation of long-term generation output is based on historical generation patterns obtained from the
electricity utility Eskom’s, data archives.1 Since generation output can be highly irregular from year to year,
a mathematical model had to be developed which took into account historical data patterns. A variant of
the basic extrapolation formula had to be developed to take into historical data averages.
The basic linear extrapolation formula can be indicated as:
1
In this study demand forecasting was not considered because of the variable (or external) conditions affecting
electricity demand, such as economic growth, commodity prices, union strikes, maintenance outages, etc. The
methodology used in this study does not model external shocks.
18You can also read