Maturation of Heterogeneity in Afferent Synapse Ultrastructure in the Mouse Cochlea
←
→
Page content transcription
If your browser does not render page correctly, please read the page content below
ORIGINAL RESEARCH
                                                                                                                                              published: 17 June 2021
                                                                                                                                      doi: 10.3389/fnsyn.2021.678575

                                            Maturation of Heterogeneity in
                                            Afferent Synapse Ultrastructure in
                                            the Mouse Cochlea
                                            Shelby A. Payne 1* , Matthew S. Joens 2,3 , Heather Chung 1,4† , Natalie Skigen 4† ,
                                            Adam Frank 4† , Sonali Gattani 4 , Kya Vaughn 4 , Allison Schwed 5 , Matt Nester 4 ,
                                            Atri Bhattacharyya 1,4 , Guhan Iyer 4 , Bethany Davis 5 , Jason Carlquist 1,4 , Honey Patel 4 ,
                                            James A. J. Fitzpatrick 2,6,7,8 and Mark A. Rutherford 1*
                                            1
                                              Department of Otolaryngology, Washington University School of Medicine, St. Louis, MO, United States, 2 Center for
                                            Cellular Imaging, Washington University in St. Louis, St. Louis, MO, United States, 3 TESCAN USA, Inc., Warrendale, PA,
                                            United States, 4 Department of Biology, Washington University in St. Louis, St. Louis, MO, United States, 5 Graduate
                                            Program in Audiology and Communications Sciences, Washington University School of Medicine, St. Louis, MO,
                                            United States, 6 Department of Neuroscience, Washington University School of Medicine, St. Louis, MO, United States,
                                            7
                                              Department of Cell Biology and Physiology, Washington University School of Medicine, St. Louis, MO, United States,
                                            8
                                              Department of Biomedical Engineering, Washington University School of Medicine, St. Louis, MO, United States
                         Edited by:
                    Thomas Coate,
Georgetown University, United States        Auditory nerve fibers (ANFs) innervating the same inner hair cell (IHC) may have identical
                       Reviewed by:         frequency tuning but different sound response properties. In cat and guinea pig,
                      Takeshi Sakaba,       ANF response properties correlate with afferent synapse morphology and position on
  Max Planck Institute for Biophysical
                 Chemistry, Germany         the IHC, suggesting a causal structure-function relationship. In mice, this relationship
                       Joshua Singer,       has not been fully characterized. Here we measured the emergence of synaptic
 University of Maryland, College Park,
                                            morphological heterogeneities during maturation of the C57BL/6J mouse cochlea by
                         United States
                                            comparing postnatal day 17 (p17, ∼3 days after hearing onset) with p34, when the
                   *Correspondence:
                    Mark A. Rutherford      mouse cochlea is mature. Using serial block face scanning electron microscopy and
            rutherfordmark@wustl.edu        three-dimensional reconstruction we measured the size, shape, vesicle content, and
                      Shelby A. Payne
              shelby.payne@wustl.edu        position of 70 ribbon synapses from the mid-cochlea. Several features matured over
     † These   authors have contributed     late postnatal development. From p17 to p34, presynaptic densities (PDs) and post-
                    equally to this work    synaptic densities (PSDs) became smaller on average (PDs: 0.75 to 0.33; PSDs: 0.58 to
                                            0.31 µm2 ) and less round as their short axes shortened predominantly on the modiolar
           Received: 09 March 2021
            Accepted: 11 May 2021           side, from 770 to 360 nm. Membrane-associated synaptic vesicles decreased in number
           Published: 17 June 2021          from 53 to 30 per synapse from p17 to p34. Anatomical coupling, measured as PSD
                              Citation:     to ribbon distance, tightened predominantly on the pillar side. Ribbons became less
      Payne SA, Joens MS, Chung H,
         Skigen N, Frank A, Gattani S,
                                            spherical as long-axes lengthened only on the modiolar side of the IHC, from 372 to
      Vaughn K, Schwed A, Nester M,         541 nm. A decreasing gradient of synaptic ribbon size along the modiolar-pillar axis was
     Bhattacharyya A, Iyer G, Davis B,
                                            detected only at p34 after aligning synapses of adjacent IHCs to a common reference
   Carlquist J, Patel H, Fitzpatrick JAJ
and Rutherford MA (2021) Maturation         frame (median volumes in nm3 × 106 : modiolar 4.87; pillar 2.38). The number of ribbon-
 of Heterogeneity in Afferent Synapse       associated synaptic vesicles scaled with ribbon size (range 67 to 346 per synapse at
 Ultrastructure in the Mouse Cochlea.
Front. Synaptic Neurosci. 13:678575.
                                            p34), thus acquiring a modiolar-pillar gradient at p34, but overall medians were similar
     doi: 10.3389/fnsyn.2021.678575         at p17 (120) and p34 (127), like ribbon surface area (0.36 vs. 0.34 µm2 ). PD and PSD

Frontiers in Synaptic Neuroscience | www.frontiersin.org                          1                                            June 2021 | Volume 13 | Article 678575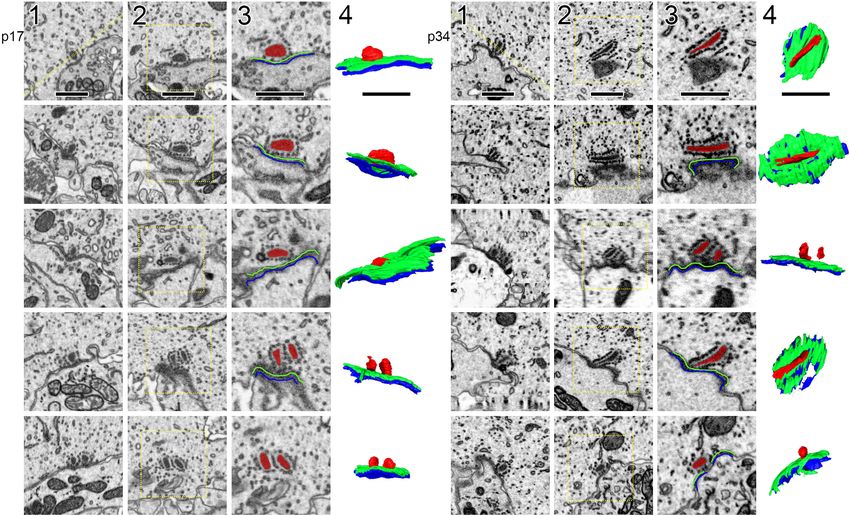
Payne et al.                                                                                                      Maturation of Afferent Synapse Heterogeneity

                                            morphologies were tightly correlated to each other at individual synapses, more so at
                                            p34 than p17, but not to ribbon morphology. These observations suggest that PDs and
                                            PSDs mature according to different cues than ribbons, and that ribbon size may be
                                            more influenced by cues from the IHC than the surrounding tissue.
                                            Keywords: ribbon synapse ultrastructure, postsynaptic density, synaptic vesicles, modiolar, pillar, presynaptic
                                            density, FIB-SEM, developmental maturation

INTRODUCTION                                                                       greater than 3 – 4 kHz are plotted, separately, the low-
                                                                                   frequency SR distributions are clearly bimodal and the hi-
Auditory nerve fibers (ANFs) connect the ear to the brain.                         frequency distributions are not (Ohlemiller and Echteler, 1990;
They are anatomically and functionally heterogeneous, but the                      Temchin et al., 2008). Differences between high- and low-
relationships between anatomical and functional diversity are not                  frequency hearing may be correlated with structural differences
completely understood. Each ANF is excited by a single ribbon                      between high- and low-frequency tonotopic regions, or between
synapse on an inner hair cell (IHC). Each IHC is frequency-                        cochleae from animals that specialize in high- vs. low-
tuned to a characteristic frequency (CF) and presynaptic to                        frequency hearing.
several ANFs (Liberman, 1980). Fibers with very similar or                            Some observations of auditory nerve physiology and cochlear
identical CF, likely excited by the same IHC or adjacent                           anatomy may transcend cochlear location or species, for example,
IHCs, can have very different spontaneous and evoked spike                         the inverse relationship between SR and threshold (Liberman,
rates (Sachs and Abbas, 1974; Liberman, 1978; Jean et al.,                         1978; Borg et al., 1988; Ohlemiller and Echteler, 1990; Taberner
2020). Each IHC is a sensory receptor driving synaptic release                     and Liberman, 2005; Temchin et al., 2008; Furman et al.,
by a transmembrane potential that is graded over time and                          2013) and the modiolar-pillar gradient in synaptic ribbon size
thought to be iso-potential due to the approximately cylindrical                   (Kantardzhieva et al., 2013; Michanski et al., 2019). Studies in
shape and relatively compact morphology of the IHC synaptic                        cat and subsequently in many mammalian species established
compartment (∼10 × 10 × 20 µm). Spontaneous (i.e., in silence)                     that ANFs fire action potentials at different SRs, and can be
and sound-evoked spikes in ANFs rely on Ca2+ -dependent                            classified as low-SR (≤ 1 spike s−1 ) or hi-SR (> 1 spike s−1 ;
exocytosis of glutamate from IHCs, evoking one spike per                           summarized in Taberner and Liberman, 2005, their Figure 13).
release event (Sewell, 1984; Robertson and Paki, 2002; Rutherford                  The SR, or rate of firing in the absence of an applied sound, is
et al., 2012). Thus, IHC-afferent synaptic heterogeneities are                     correlated with sound-response threshold: hi-SR fibers respond
posited to underlie the functional diversity of ANFs observed                      already to very soft sounds; low-SR fibers respond only to
in one tonotopic location, at CF (Frank et al., 2009; Grant                        relatively loud sounds (Liberman, 1978). It was also established
et al., 2010; Liberman et al., 2011; Wichmann and Moser,                           in cat that hi-SR fibers are thicker in caliber, have smaller
2015; Rutherford and Moser, 2016). Synaptic sources of ANF                         presynaptic ribbons, and tend to be positioned on the pillar-
diversity may arise from differences in the shapes and sizes                       or abneural-side of the IHC. Low-SR fibers are thinner, have
of cytoplasmic ribbons, the presynaptic pool of vesicles they                      larger presynaptic ribbons, and tend to be positioned on the
harbor, or the properties of the membrane densities containing                     modiolar- or neural-side of the IHC facing the spiral ganglion
presynaptic voltage gated Ca2+ channels and postsynaptic                           (Merchan-Perez and Liberman, 1996). The extent to which these
glutamate receptors.                                                               structure-function relationships observed in cat generalize across
    Current knowledge about the relationships between IHC-                         mammalian species is unclear. To better understand how ANF
afferent synaptic structure and ANF physiology come mainly                         diversity is achieved in a genetically tractable species widely used
from landmark studies in cat. There are interspecies similarities                  in auditory neuroscience, here we sought to better understand
and differences in auditory nerve physiology which may or                          the ultrastructural maturation of cochlear ribbon synapses in
may not be related to synaptic anatomy. Some interspecies                          C57BL/6J mice during late postnatal development with attention
differences may be related to mechanisms of high-frequency                         to position of innervation on the IHC.
vs. low-frequency hearing. In species with good low-frequency
hearing like cat, guinea pig, chinchilla, and rabbit most
ANFs have high spontaneous rate (SR) and low-threshold,                            METHODS
while a smaller group of fibers has low-SR and hi-threshold
(Liberman, 1978; Borg et al., 1988; Temchin et al., 2008;                          Animals
Furman et al., 2013). In contrast, animals like mice and                           Mice were studied in accordance with protocols approved by
rats that don’t hear well at low frequency (below 4 kHz,                           the Animal Studies Committee of Washington University in
where phase-locking occurs and where response synchrony may                        St. Louis. C57BL/6J background mice were obtained from The
encode stimulus strength) have compressed SR distributions                         Jackson Laboratory. In this study we reconstructed three (IHCs)
that are not clearly bimodal and are shifted to lower SR                           from one mouse aged p17, ∼3 days after the onset of hearing,
(El Barbary, 1991; Taberner and Liberman, 2005). In gerbil                         and three IHCs from one mouse aged p34 when the cochlea is
and chinchilla, when SR for ANFs with CF less than or                              considered functionally mature.

Frontiers in Synaptic Neuroscience | www.frontiersin.org                       2                                       June 2021 | Volume 13 | Article 678575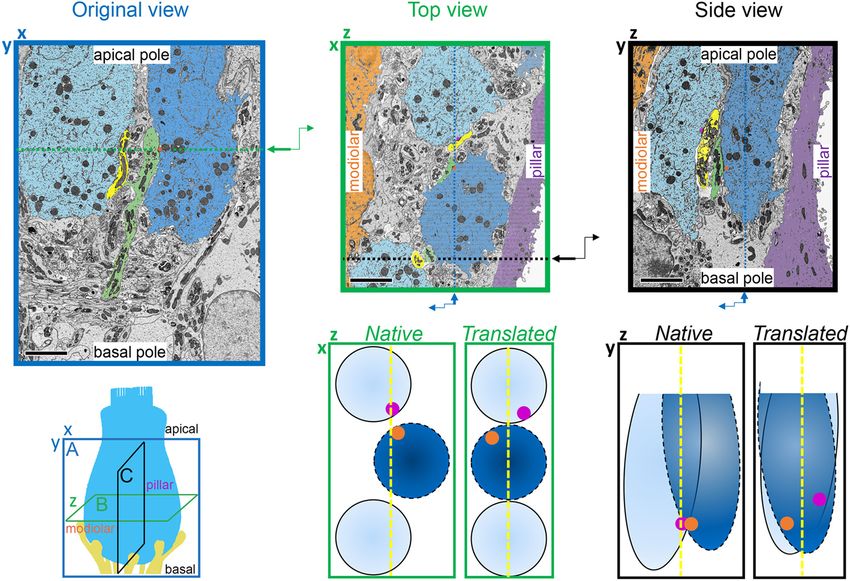
Payne et al.                                                                                                              Maturation of Afferent Synapse Heterogeneity

Tissue Processing and Embedding                                                        procedure, the samples were microwave irradiated (BioWave Pro,
Temporal bones were harvested, and cochleae were perfused                              Ted Pella) at 300 W with 20 inches of Hg for 5 min prior to
via the round window with 0.15 M cacodylate buffer (pH                                 each incubation step. The samples were placed in a series of
7.4) containing 2.5% glutaraldehyde, 2% paraformaldehyde, and                          Durcapan ACM resin and acetone solution starting with 25%
2 mM CaCl2 . The cochleae were left in the cacodylate buffer                           Durcapan:acetone for 2 h, 50% Durcapan:acetone for 2 h, and
fixative overnight at 4◦ C. The cochleae were then washed                              then 75% Durcapan:acetone for 2 h. Afterward, the cochleae were
in cold cacodylate buffer containing 2 mM CaCl2 . Without                              placed in 100% Durcapan for 2 h then embedded in fresh resin
decalcification, the sample was then dissected to isolate pieces                       and baked at 60◦ C for 48 h.
of the mid-cochlear organ of Corti from the surrounding bone
using forceps and a ceramic blade. The staining procedure was                          Focused Ion Beam Scanning Electron
modified from a previously described protocol (Deerinck et al.,                        Microscopy
2010). Briefly, the pieces were incubated in a solution containing                     After embedding, we targeted approximately the 18 kHz region
1.5% potassium ferrocyanide and 2% osmium tetroxide, 0.15 M                            of the cochlea by facing the resin block with a diamond knife in a
cacodylate buffer with 2 mM CaCl2 on ice for 1 h. After this                           mid-modiolar radial orientation, verified by visualizing the tissue
incubation, the sample was washed in double-distilled water                            with a thick section containing organ of Corti and osseous spiral
(ddH2 O), incubated in a filtered 0.1%thiocarbohydrazide (TCH)                         lamina. The sample was then loaded into a focused ion beam –
solution for 20 min at room temperature, washed in ddH2 O                              scanning electron microscope (FIB-SEM; Crossbeam 540, Carl
again, and then placed in 2% osmium tetroxide for 30 min at                            Zeiss; Figure 1) for 3D analysis as described previously (Narayan
room temperature. The samples were washed in ddH2 O and                                et al., 2014). In brief, the IHCs were located by imaging at 10 KeV
incubated in 1% aqueous uranyl acetate at 4◦ C overnight, then                         with secondary electron detection. The region of interest was
incubated in 30 mM L-aspartic acid, 20 mM lead nitrate solution                        protected with a 30 µm × 20 µm platinum and carbon pad
for 30 min in a 60◦ C oven, then washed again in ddH2 O and                            containing etched fiducial marks for focus and drift correction
dehydrated in dilutions (20, 50, 70, 90, 100, and 100%) of cold                        purposes. After capping, an approximately 50 µm deep trench
ethanol for 5 min each. After the dehydration step, the samples                        was milled into the inner border cell region, along the tonotopic
were left in ice-cold acetone for 10 min. For the embedding                            axis immediately to the modiolar side of the synaptic neuropil of

  FIGURE 1 | Block face imaging with Focused Ion Beam Scanning Electron Microscopy (FIB-SEM). Schematic of the dual beam method for serial block face imaging
  of inner hair cell (IHC) ribbon synapses. The milling beam and the imaging beam are offset by 52◦ . A protective pad made of carbon and platinum (C, Pt) was built
  over the IHCs by plasma-enhanced chemical vapor deposition using the gallium (Ga) FIB. The FIB was then used to bulk-trench the tissue in front of the IHCs,
  exposing these cells to the SEM. Images were acquired of this face at a resolution of 7 nm/pixel using backscatter detection. After collecting an image of the block
  face, the milling beam removed 7 nm of the sample from the surface before collecting the next image. This process was repeated until the sample was milled
  through the IHCs to the tunnel of Corti.

Frontiers in Synaptic Neuroscience | www.frontiersin.org                           3                                            June 2021 | Volume 13 | Article 678575
Payne et al.                                                                                          Maturation of Afferent Synapse Heterogeneity

the inner spiral plexus, using a 30 KeV gallium beam at 30 nA,           used these ribbon-cleft proximity histograms as measurements of
followed by polishing at 7 nA at the same voltage. Images were           spatial coupling to compare sizes and shapes of synapses.
then acquired of the newly formed block at 1.75 KeV and 1.2 nA
using the Energy selective Backscattered (EsB) detector with a           Mapping Synapse Position
grid voltage of 1200 V, with 7 nm pixels, a dwell time of 3 µs and       The XY imaging plane was similar to the orientation typically
a line average of 3. Between each image acquisition, 7 nm of the         used when collecting optical sections in confocal microscopy
block face was removed with the FIB using a 30 KeV, 1.2 nA beam.         of ribbon synapses in the organ of Corti whole-mount surface
                                                                         preparation (Khimich et al., 2005). The tonotopic dimension
Image Processing and Segmentation                                        was oriented horizontally on the X axis. The habenular-cuticular
                                                                         (H-C) dimension of the IHC (from the basal synaptic pole to
The collected images were then grayscale inverted, cropped,
                                                                         apical hair-bundle pole) was oriented vertically on the Y axis.
and aligned using the integrated Fibics software on the FIB-
                                                                         The modiolar-pillar (M-P) dimension of the organ of Corti was
SEM. Images were collected with 7 nm isotropic voxels of the
                                                                         traversed with sequential image sections along the Z axis. Synapse
synaptic region from the bottom of the IHC nuclei to the
                                                                         positions on the M-P and H-C axes were determined in two ways:
habenula perforata, containing three IHCs from the modiolar-
                                                                         (1) Native view - The Cartesian coordinates relative to the full
side facing the ganglion to the pillar-side facing the tunnel
                                                                         range of positions in the tissue, with the most modiolar synapse
of Corti. The p17 raw data volume was cropped to a pixel
                                                                         and the most pillar synapse being equidistant from the origin
format of 3,114 × 3,794 × 2,287 corresponding to approximately
                                                                         at the center of the M-P axis, and the most habenular synapse
22 × 27 × 16 µm in X, Y, and Z. The p34 raw data volume
                                                                         defining the origin at the bottom of the H-C axis. In the native
was cropped to 2,883 × 4,335 × 2,658 pixels corresponding
                                                                         view, due to the relative positions of the cells within the tissue,
to approximately 20 × 30 × 19 µm in X, Y, and Z. Before
                                                                         synapses on the modiolar face of one IHC may reside in the
segmentation, the dataset was denoised using a non-local means
                                                                         same M-P position as synapses on the pillar face of an adjacent
filter with a sigma of 10 and a smoothing factor of 1 (Amira).
                                                                         IHC. (2) Translated view – For each IHC, separately, the synapses
Individuals familiar with ribbon synapse anatomy but blinded
                                                                         were translated together along the H-C axis such that the most
to mouse age and tissue orientation segmented all ribbons,
                                                                         habenular synapse of each IHC was at the origin, and along the
presynaptic densities, postsynaptic densities, and the plasma
                                                                         M-P axis such that the most modiolar synapse and the most pillar
membrane of the central IHC by hand using Amira software
                                                                         synapse of each IHC was equidistant from the origin at the center
(Thermo Fisher). The IHC plasma membrane was segmented
                                                                         of the M-P axis. In the translated view, the synapses of each IHC
every 5–10 sections using the interpolation function. The first
                                                                         were superimposed onto a common cell-centric reference frame,
layer of synaptic vesicles surrounding the ribbon were marked
                                                                         as illustrated in the text. In the native and the translated views,
manually in every 5th section (35 nm spacing) and counted using
                                                                         synapses were assigned as modiolar for coordinates < 0 or pillar
the Cell Counter Plugin in Image J. For movies of synaptic sub-
                                                                         for coordinates > 0 along the M-P (Z) axis.
volumes, image stacks were further aligned using the Linear Stack
Alignment plugin (SIFT) in Image J. For display, fully segmented
objects were smoothed for 20 iterations and a lamda (λ) = 0.6 to
                                                                         Statistical Analysis
                                                                         Data sets were exported into Excel. All statistical values
reduce the number of vertices, but maintain hard edges using the
                                                                         are presented as median ± standard deviation (SD) unless
Surface Simplification Editor.
                                                                         otherwise noted. All data sets were tested for normality
                                                                         using a Kolmogorov-Smirnov test with reference to a normal
Three-Dimensional Quantitative Analysis                                  distribution. Wilcoxon rank-sum test (two-tailed) was used for
of Synaptic Structures                                                   pairwise comparisons between groups. Exact p-values are given.
Segmented structures were analyzed in Amira using the Material           Effect size was calculated as Hedge’s g = difference between
Statistics module to obtain geometric measurements. We used              medians/pooled SD, where the pooled SD (s∗ ) is computed as
Ferret Measures to determine the longest and shortest axes                                   s
through the center of gravity of each synaptic ribbon. The                                      (n1 − 1) s21 + (n2 − 1) s22
                                                                                         ∗
                                                                                        s =                                 ,
long and short axes of the ribbons were not constrained to                                            n1 + n2 − 2
be orthogonal to each other. To measure the surface area of
                                                                         where n1 is the number of units in group 1, n2 for group 2, s1
the ribbons, we used the Voxel Face Area module. For PDs
                                                                         is the SD of group 1, and s2 for group 2. Spearman’s rho (ρ)
and PSDs, we used Ferret Measures to determine the long and
                                                                         was used to determine strength of association. Graphs labeled
short axes through the center of gravity without constraining the
                                                                         with rho has a significant p-value based on a two-tailed t-test.
measurements to be orthogonal. These measurements were then
                                                                         Graphs were plotted and statistics were performed in Igor Pro
used to estimate surface area of the 3D projection on a 2D plane
                                                                         7 (Wavemetrics).
by modeling each synapse as an ellipse. To measure anatomical
coupling between the PSD and the ribbons, we developed a
workflow in Amira to measure the shortest distance to the ribbon         RESULTS
surface from each vertex of each voxel comprising the ribbon-
facing surface of the PSD, in order to construct histograms              Previous reports of cochlear synaptic morphology at the level of
of proximity between the ribbon and the synaptic cleft. We               electron microscopy have focused mainly on embryonic and early

Frontiers in Synaptic Neuroscience | www.frontiersin.org             4                                     June 2021 | Volume 13 | Article 678575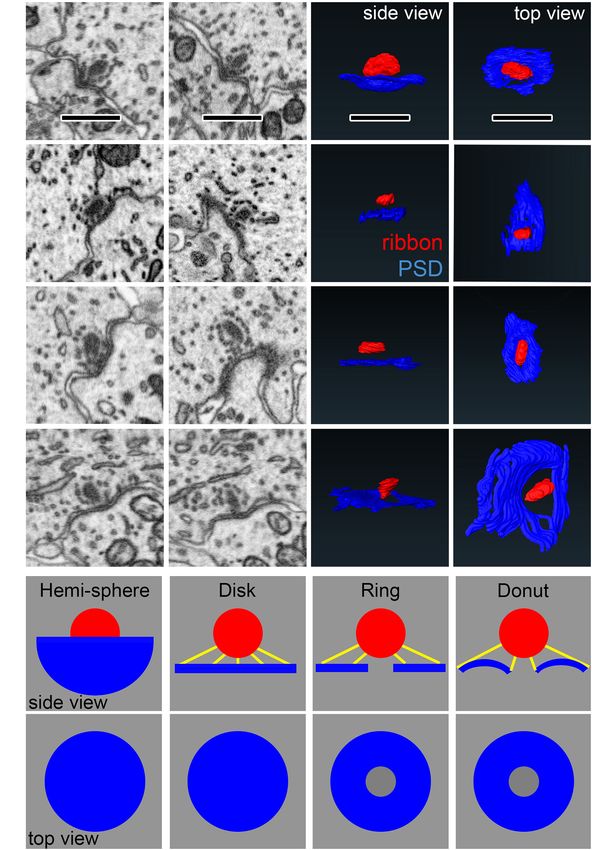
Payne et al. Maturation of Afferent Synapse Heterogeneity
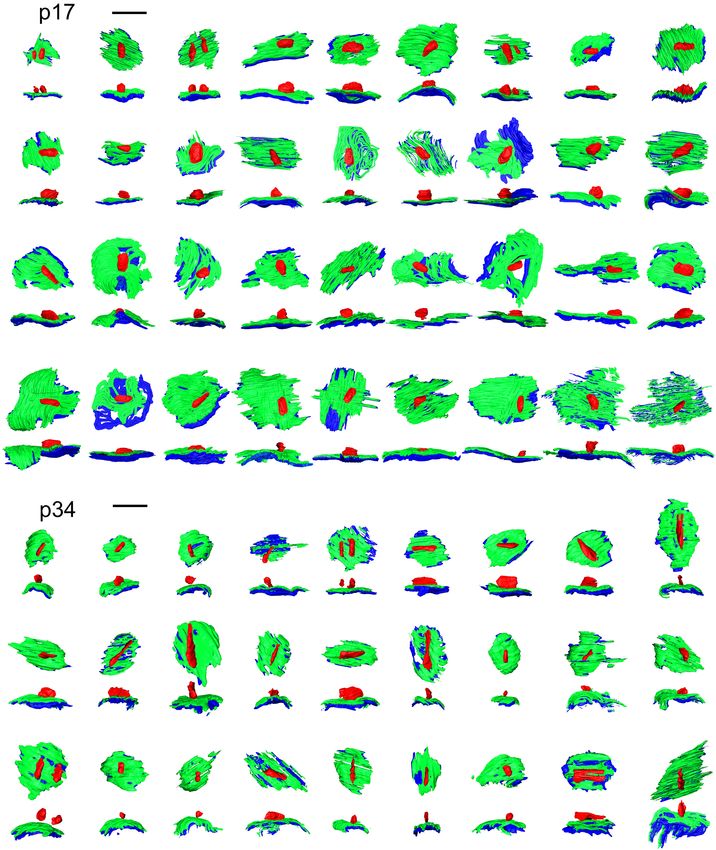
FIGURE 2 | Segmentation of ribbons and membrane densities to generate 3-dimensional models of cochlear ribbon synapses. (A) Each of the 5 rows of images
illustrates one ribbon synapse from the p17 sample. The volume of tissue surrounding each synapse was cropped in 3 dimensions. Column 1 shows images from
the center of the stack, oriented with the presynaptic IHC on top, the postsynaptic afferent bouton on bottom, and the ribbon synapse in the center. The faint yellow
dashed line in column 1 of row 1, passing through the center of the ribbon and parallel to the synaptic cleft, indicates the position of an orthogonal plane or section
shown in column 2. The area inside the faint yellow dashed box in column 2 is enlarged in column 3, where the segmentation of synaptic structures is demonstrated.
Column 4 contains a 2-dimensional representation of the 3-dimensional model generated from the series of segmented images. (B) Same as (A), for the p34
sample. Red, presynaptic ribbon; green, pre-synaptic density; blue, post-synaptic density. Scale bars are 1 µm.
postnatal development (Wong et al., 2014; Michanski et al., 2019), IHC, plus 16 and 6 synapses on the two adjacent IHCs. Three of
adult properties (Liberman, 1980; Merchan-Perez and Liberman, these synapses contained two ribbons each (i.e., double ribbons;
1996; Slepecky et al., 2000; Kantardzhieva et al., 2013; Bullen et al., Supplementary Movie 3). The p34 volume fully contained 32
2015), aging (Stamataki et al., 2006), or noise exposure (Bullen synapses including 16 on the central IHC, plus 8 synapses on
et al., 2019). Here, we focused on late postnatal development in each of the two adjacent IHCs. Two of these synapses contained
unexposed wild-type C57BL/6J mice, from just after the onset double ribbons. In our methodology the 7 nm pixel size in XY
of hearing function to maturation of cochlear function, which in was matched by 7 nm resolution in the Z dimension, enabling
mice happens from 2 – 4 weeks postnatal. visualization of the raw data in three orthogonal planes without
Ribbons, presynaptic densities (PDs), and post-synaptic anisotropic distortion (Supplementary Movies 4–6). In Figure 2,
densities (PSDs) were segmented (Figure 2) along with the the raw data of several ribbon synapses is shown in both the
cytoplasm of the central IHC. PDs and PSDs were identified original orientation, as the images were collected, as well as an
by a dark thickening of the membrane density on the surface orthogonal virtual section, demonstrating the benefit of isotropic
of the IHC or the afferent bouton terminal, respectively voxels for 3-dimensional reconstructions. The reconstructed
(Supplementary Movie 1, 2). At p17 and p34, each bouton synapses from p17 and p34 are shown in the en face orientation
terminal contacting an IHC had a PSD juxtaposed to a PD. Each and the side view in Figure 3.
synaptic ribbon was anchored to a PD juxtaposed to a PSD. We
did not observe any PD/PSDs without ribbons (i.e., no ribbonless
synapses) nor any lone ribbons either anchored to the membrane
Trans-Synaptic Coordination of
or floating in the cytoplasm (i.e., no orphaned ribbons). The Morphological Maturation in the
reconstructed volumes contained the basolateral compartment of Membrane Densities
one IHC in the center, plus parts of two adjacent IHCs. The p17 For each PD and PSD we measured its longest axis, shortest axis,
volume fully contained 38 synapses including 16 on the central and surface area. From p17 to p34, the surface area (SA) of the
Frontiers in Synaptic Neuroscience | www.frontiersin.org 5 June 2021 | Volume 13 | Article 678575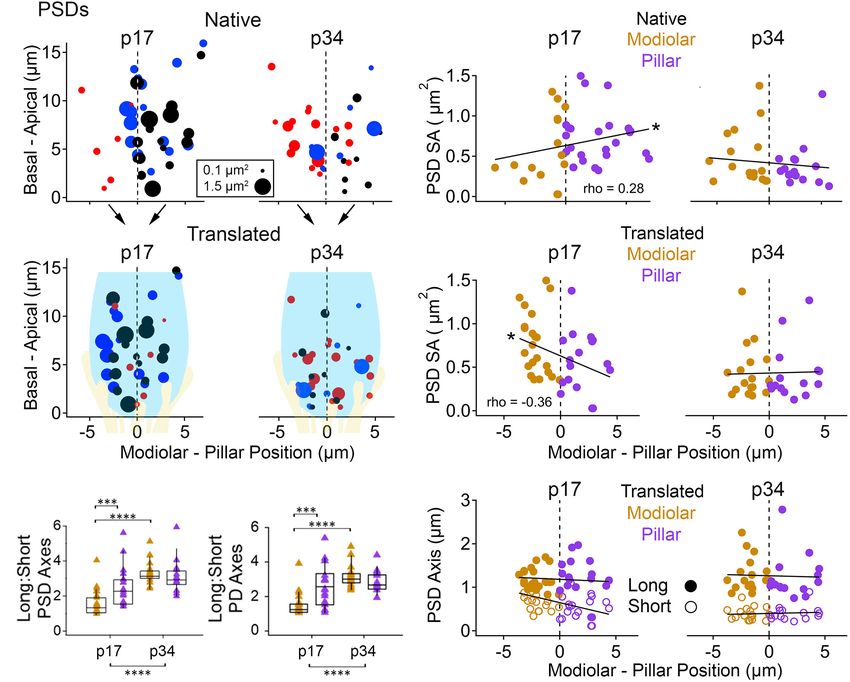
Payne et al.                                                                                                           Maturation of Afferent Synapse Heterogeneity

  FIGURE 3 | Ribbon synapse reconstructions from inner hair cells at p17 and p34. (A) 2-dimensional renderings of 3-dimensional reconstructions for p17 synapses.
  Each synapse is shown in, both, the en face or top-down view (upper) and a side view (lower). (B) Same as in (A), for p34. Red, presynaptic ribbon; green,
  pre-synaptic density; blue, post-synaptic density. Scale bars are 1 µm.

median PSD decreased significantly by ∼ 50% (0.58 ± 0.36 vs.                         suggesting a mirroring of morphologies between paired pre- and
0.31 ± 0.30 µm2 ), due to significant shortening of PSD short-                       post-synaptic membrane densities that was refined from p17 to
axis by ∼ 50% (0.66 ± 0.29 vs. 0.36 ± 0.14 µm) while PSD                             p34 (Figure 4D). Synapses with greater long: short (L:S) axis
long-axes were unchanged (1.12 ± 0.34 vs. 1.15 ± 0.42 µm2 ;                          ratios of the PD tended to have greater L:S axis ratios of the
Figures 4A–C). See Table 1 for group medians and ranges, as                          PSD, at both ages (Figure 4E). From p17 to p34, PDs and PSDs
well as p-values and effect sizes of group comparisons. These                        became less rounded. L:S axis ratios predominantly increased
differences in morphology of the PSD between p17 and p34                             on both sides of the synaptic cleft, approximately doubling on
were accompanied by even larger developmental reduction in SA                        average from p17 (median ratio: PD, 1.49; PSD, 1.69) to p34 (PD,
and short axis of the PD, on average (Table 1; SA effect sizes                       2.97; PSD, 3.19), again suggesting coordination of morphological
of 0.8 for PSD and 1.29 for PD). At p17, PDs were 29% larger                         maturation between pre- and post-synaptic membrane densities
than PSDs, while at p34 the SA of PDs and PSDs was nearly                            during late postnatal development.
identical (0.33 ± 0.24 vs. 0.31 ± 0.29 µm2 ). At individual paired                       Presynaptic ribbons are amorphous ellipsoid-like cytoplasmic
synapses, PD and PSD SA were positively correlated at both ages.                     dense-bodies anchored to the active zone and decorated with
The goodness of fit remained relatively stable from p17 to p34                       glutamate-filled synaptic vesicles. For each ribbon we measured
with correlations of 0.90 and 0.87 respectively (Spearman’s rho),                    its volume, surface area, and the lengths of the longest and

Frontiers in Synaptic Neuroscience | www.frontiersin.org                         6                                           June 2021 | Volume 13 | Article 678575
Payne et al.                                                                                                           Maturation of Afferent Synapse Heterogeneity

TABLE 1 | Median volume (nm3 × 106 ), surface area (SA, µm2 ), axis length (nm), PSD to ribbon distance (nm), and number of vesicles per synapse at p17 and p34 by
Modiolar-Pillar position in the translated view. For p17: N = 41 (23M/18P); p34: N = 34 (19M/15P).

                               Age                            ALL (range)            Modiolar (range)         Pillar (range)          Modiolar vs. Pillar Wilcoxon
                                                                                                                                         p-value (effect size)

Ribbon volume                  P17                          4.29 (0.80–10.93)        4.18 (0.80–10.93)       4.59 (2.29–7.50)                 8.1E-01 (0.22)
                               P34                          3.29 (0.75–10.22)        4.87 (1.77–10.22)       2.38 (0.75–7.36)                 9.3E-04 (1.13)
                               p17 vs. p34 Wilcoxon           7.6E-02 (0.45)          5.5E-01 (0.29)          1.3E-04 (1.59)
                               p-value (effect size)
Ribbon SA                      P17                           0.36 (0.19–0.71)        0.36 (0.19–0.71)        0.36 (0.24–0.54)                 2.8E-01 (0.01)
                               P34                           0.34 (0.20–1.07)        0.49 (0.24–1.07)        0.28 (0.20–0.62)                 4.5E-01 (0.96)
                               p17 vs. p34 Wilcoxon           5.9E-01 (0.20)          5.8E-01 (0.60)          3.1E-01 (0.98)
                               p-value (effect size)
Ribbon long axis               P17                           357 (263–480)            372 (263–480)           340 (278–407)                   1.7E-02 (0.70)
                               P34                           394 (271–813)            541 (321–813)           338 (271–606)                   1.0E-03 (1.39)
                               p17 vs. p34 Wilcoxon           6.9E-02 (0.30)          7.4E-03 (1.34)          9.2E-01 (0.03)
                               p-value (effect size)
Ribbon short axis              P17                           178 (114–269)            170 (114–269)           183 (157–240)                   1.4E-01 (0.44)
                               P34                           159 (102–241)            179 (115–241)           150 (102–199)                   1.2E-02 (0.96)
                               p17 vs. p34 Wilcoxon           2.3E-02 (0.61)          9.6E-01 (0.25)          2.3E-04 (1.38)
                               p-value (effect size)
Ribbon long:short              P17                            2.0 (1.6–3.0)            2.1 (1.7–3.0)           1.9 (1.6–2.4)                  2.5E-04 (0.86)
Ratio                          P34                            3.0 (1.5–4.5)            3.0 (2.0–4.5)           2.8 (1.5–3.9)                  2.1E-01 (0.26)
                               p17 vs. p34 Wilcoxon           5.3E-06 (1.6)           5.2E-05 (1.52)          2.7E-02 (1.80)
                               p-value (effect size)
PD SA                          P17                           0.75 (0.11–1.62)        0.87 (0.39–1.62)        0.61 (0.11–1.51)                 4.0E-02 (0.72)
                               P34                           0.33 (0.16–1.41)        0.34 (0.17–1.41)        0.31 (0.16–0.91)                 6.8E-01 (0.11)
                               p17 vs. p34 Wilcoxon           6.7E-06 (1.29)          2.8E-05 (1.66)          4.3E-02 (1.00)
                               p-value (effect size)
PD long axis                   P17                           1.12 (0.66–2.28)        1.19 (0.84–1.83)        1.18 (0.66–2.28)                 6.8E-01 (0.02)
                               P34                           1.13 (0.82–2.3)         1.18 (0.89–2.31)        1.06 (0.82–1.80)                 2.7E-01 (0.42)
                               p17 vs. p34 Wilcoxon           2.2E-01 (0.17)          9.6E-01 (0.01)          9.9E-02 (0.37)
                               p-value (effect size)
PD short axis                  P17                           0.75 (0.22–1.29)        0.84 (0.36–1.29)        0.55 (0.22–1.14)                 2.0E-03 (1.12)
                               P34                           0.38 (0.22–0.78)        0.39 (0.22–0.78)        0.37 (0.22–0.64)                 8.8E-01 (0.12)
                               p17 vs. p34 Wilcoxon           4.1E-07 (1.57)          6.2E-08 (2.28)          9.1E-02 (0.81)
                               p-value (effect size)
PD long:short ratio            P17                            1.6 (1.1–5.4)            1.3 (1.1–3.9)           2.7 (1.1–5.4)                  4.0E-04 (1.07)
                               P34                            3.0 (1.9–4.9)            3.1 (2.4–4.9)           2.8 (1.9–4.4)                  2.4E-01 (0.28)
                               p17 vs. p34 Wilcoxon           7.0E-07 (1.56)          3.8E-09 (2.78)          3.4E-01 (0.12)
                               p-value (effect size)
PSD SA                         P17                           0.58 (0.03–1.50)        0.66 (0.35–1.50)        0.53 (0.03–1.38)                 6.3E-02 (0.39)
                               P34                           0.31 (0.13–1.36)        0.34 (0.17–1.36)        0.30 (0.13–1.26)                 8.6E-01 (0.12)
                               p17 vs. p34 Wilcoxon           6.5E-04 (0.80)          8.2E-04 (0.99)          2.0E-01 (0.67)
                               p-value (effect size)
PSD long axis                  P17                           1.12 (0.31–1.97)        1.12 (0.83–1.70)        1.19 (0.31–1.97)                 6.4E-01 (0.23)
                               P34                           1.15 (0.75–2.78)        1.16 (0.86–2.26)        1.06 (0.75–2.78)                 3.3E-01 (0.24)
                               p17 vs. p34 Wilcoxon           9.7E-01 (0.06)          4.2E-01 (0.15)          4.8E-01 (0.29)
                               p-value (effect size)
PSD short axis                 P17                           0.66 (0.11–1.28)        0.77 (0.34–1.28)        0.54 (0.11–1.10)                 3.8E-03 (0.88)
                               P34                           0.36 (0.21–0.89)        0.36 (0.23–0.77)        0.36 (0.21–0.89)                 1.9E-01 (0.03)
                               p17 vs. p34 Wilcoxon           7.9E-06 (1.27)          1.5E-06 (1.85)          1.9E-01 (0.82)
                               p-value (effect size)
PSD long:short                 P17                            1.7 (1.0–5.6)            1.4 (1.0–4.0)           2.4 (1.4–5.6)                  3.1E-04 (1.07)
Ratio                          P34                            3.2 (2.0–5.9)            3.2 (2.0–5.9)           3.0 (2.0–5.9)                  2.4E-01 (0.28)
                               p17 vs. p34 Wilcoxon           8.8E-09 (1.63)          6.6E-09 (2.71)          3.9E-02 (0.65)
                               p-value (effect size)
PSD to ribbon                  P17                           259 (103–723)            225 (103–512)           278 (153–723)                   9.4E-02 (0.44)
Distance (Medians)             P34                            191 (42–466)            190 (133–466)            192 (41–398)                   7.0E-01 (0.03)

                                                                                                                                                         (Continued)

Frontiers in Synaptic Neuroscience | www.frontiersin.org                         7                                             June 2021 | Volume 13 | Article 678575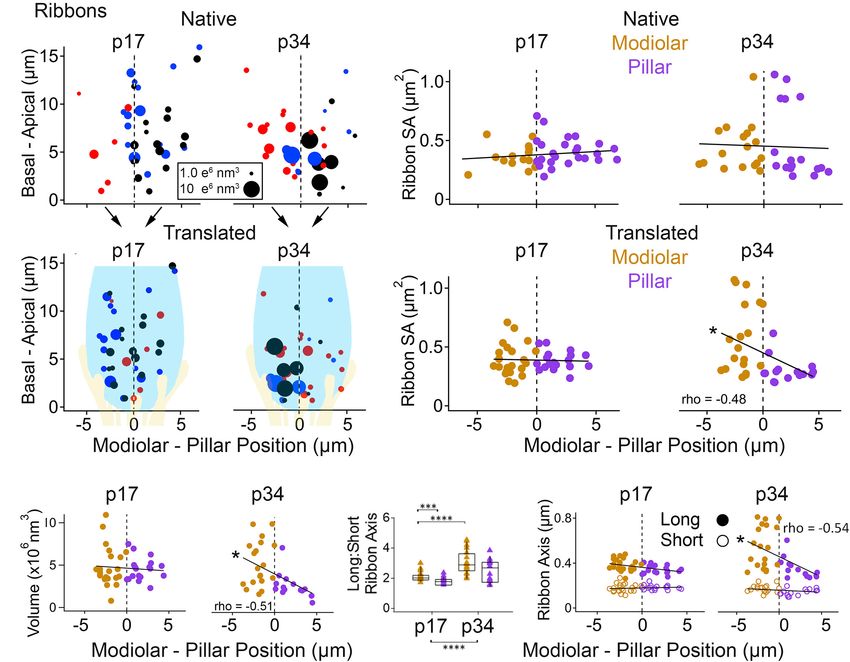
Payne et al.                                                                                                                     Maturation of Afferent Synapse Heterogeneity

TABLE 1 | Continued

                                 Age                                ALL (range)             Modiolar (range)            Pillar (range)           Modiolar vs. Pillar wilcoxon
                                                                                                                                                    p-value (effect size)

                                 p17 vs. p34 Wilcoxon              2.8E-03 (0.63)             2.1E-01 (0.42)            2.6E-03 (0.70)
                                 p-value (effect size)
PSD to ribbon                    P17                                109 (38–264)              107 (38–191)              127 (68–264)                    1.2E-01 (0.47)
Distance (15th                   P34                                102 (29–176)              104 (74–176)              101 (29–155)                    5.2E-01 (0.12)
Percentile)                      p17 vs. p34 Wilcoxon              9.3E-02 (0.19)             5.6E-01 (0.11)            4.7E-02 (0.65)
                                 p-value (effect size)
Ribbon associated                P17                                120 (90–260)              137 (90–260)              117 (100–231)                   6.7E-01 (0.51)
Vesicles                         P34                                127 (67–346)              171 (93–346)              102 (67–194)                    1.4E-03 (1.42)
                                 p17 vs. p34 Wilcoxon                 1.0 (0.15)              7.8E-02 (0.70)            4.8E-02 (0.44)
                                 p-value (effect size)
Membrane                         P17                                53 (21–128)                52 (21–128)               56 (35–106)                    4.2E-01 (0.15)
Associated vesicles              P34                                 30 (17–54)                30 (18–54)                28 (17–53)                     7.7E-01 (0.19)
                                 p17 vs. p34 Wilcoxon              2.1E-06 (1.06)             9.0E-03 (0.91)            1.9E-05 (1.66)
                                 p-value (effect size)

Red text indicates significant differences after Bonferroni correction of alpha to control the familywise error rate.

  FIGURE 4 | Morphological maturation of pre- and post-synaptic membrane densities and presynaptic ribbons. (A) Binned histogram of post-synaptic density
  surface areas (PSD SA) at p17 (filled gray bars) and p34 (hollow black bars). (B) Scatter plot of PSD SA vs. PSD short axis shows reduction in both metrics from p17
  to p34 (SA, p = 6.5e−4 ; short axis, p = 7.9e−6 ; Wilcoxon). (C) PSD SA vs. PSD long axis shows that long axes are relatively unchanged between p17 and p34
  (p = 0.97). (D) Pre-synaptic density (PD) SA vs. PSD SA for p17 and p34 (ρ = 0.90 and 0.87, respectively, Spearman’s Rho). (E) Long: short axis ratio of the PD vs.
  Long: Short axis ratio of the PSD shows positive correlation at both ages and an increase in both ratios from p17 to p34. (F) Binned histogram of synaptic ribbon
  volumes at p17 to p34, showing change in shape of distribution without significant difference of the mean (p = 0.07; Wilcoxon). (G) Scatter plot of ribbon volume vs.
  ribbon SA for p17 and p34. Neither changed significantly with maturation (p = 0.6). (H) PSD short axis vs. ribbon long axis. From p17 to p34, narrowing of the PSD
  short axis distribution and significant shortening (p = 7.9e−6 ) was accompanied by an increase in the upper range of ribbon long axes, although the increase in
  central tendency was not significant (p = 0.07). (I) Ribbon volume vs. PSD SA shows no clear relationship at p17 or p34. (J) Ribbon Long: Short axis ratio vs. PSD
  Long: Short axis ratio shows a developmental shift toward less spherical ribbons and less round PSDs from p17 to p34, but the degree of elongation on one side of
  the synapse is not well predicted by the degree of elongation on the other side.

shortest dimensions through the center of mass (Table 1). On                                to p34. While the difference in ribbon SA between p17 and
average, the p17 and p34 ribbon volumes were similar (4.3 ± 1.9                             p34 was not significant, the median and the mean changed in
vs. 3.3 ± 2.6 e6 nm3 ), with an apparent shift to a bimodal                                 opposite directions (median: 0.36 ± 0.11 vs. 0.32 ± 0.26 e6 nm2 ;
distribution at p34 (Figure 4F). The plot of ribbon volume vs.                              mean: 0.39 vs. 0.46), consistent with a maturational process in
SA deviated from the superlinear relationship defined by the                                which many ribbons become slightly smaller while a few ribbons
geometry of a sphere, particularly at p34 when ribbons with                                 become or remain larger. At p34, the ribbon long axes were
the greatest SA had smaller volumes than expected from a                                    broadly distributed relative to those at p17 (range: 263 – 480
linear trend (Figure 4G). This is consistent with a pattern of                              at p17 vs. 271 – 813 nm at p34), again suggesting that some
maturation in which some of the largest ribbons become less                                 ribbons elongated with maturation, while PSD short axes became
spherical as they elongate in one or two dimensions from p17                                shorter on average and more narrowly distributed (range: 0.11 –

Frontiers in Synaptic Neuroscience | www.frontiersin.org                                8                                                June 2021 | Volume 13 | Article 678575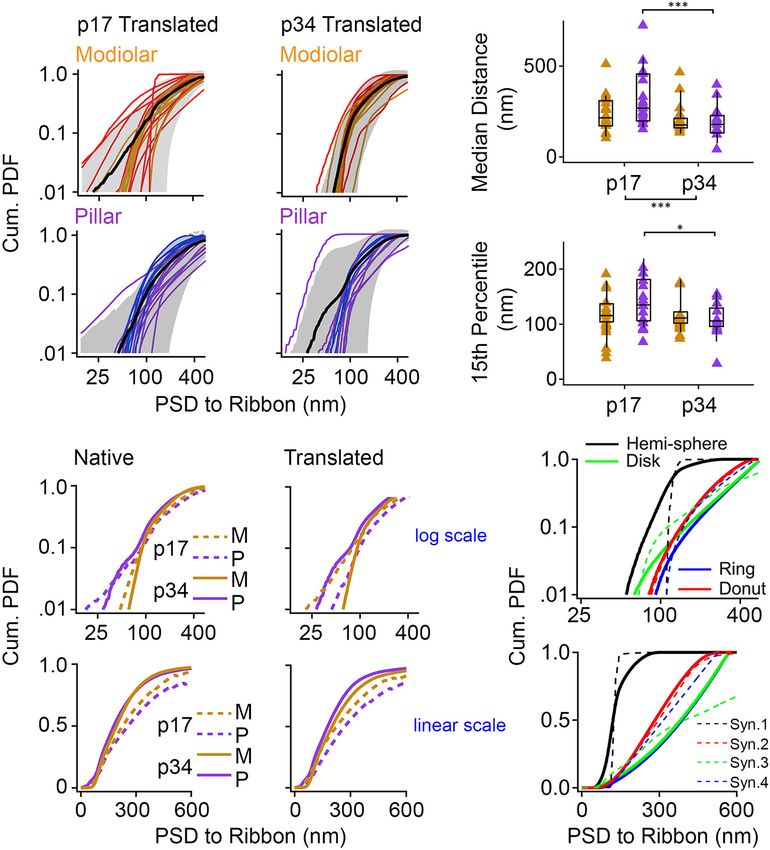
Payne et al. Maturation of Afferent Synapse Heterogeneity
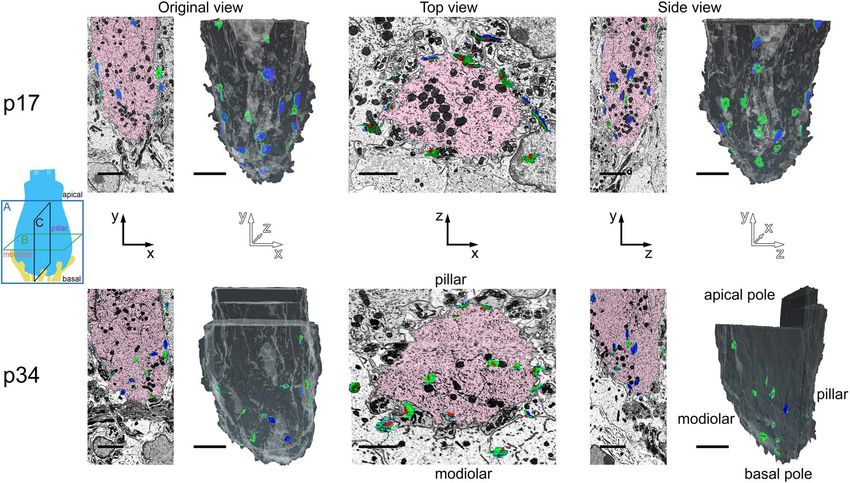
FIGURE 5 | Inner hair cell segmentation and 3-dimensional reconstruction of ribbon synapse position in the organ of Corti. The diagram on the left indicates three
orthogonal planes (A, B, and C) through the basolateral compartment of the IHC demonstrated in panels A, B, and C, respectively. The hair bundle is on the apical
side (top) and the synapses are on the basal side (bottom). The cochlear spiral extends to the left and right. The modiolar-pillar axis is perpendicular to the page.
(A) Original view–from the microscope perspective as the images were collected–for p17 (upper) and p34 (lower). On left, the central IHC (pink) is shown with
segmented synapses overlaid on the raw data in the XY plane. On right, the IHC is colored in gray in a 2-dimensional rendering of the 3-dimensional reconstruction,
oriented with the modiolar face in front. Red, presynaptic ribbon; green, pre-synaptic density (PD); blue, post-synaptic density (PSD). (B) The virtual XZ plane,
showing the top-down view of the image in panel (A). The modiolar side is on bottom and the pillar side is on top. (C) The virtual ZY plane, showing the side view of
the image in panel (A). Isotropic voxels enabled virtual sectioning in any orientation without distortion. Scale bars are approximately 3 µm.
1.28 at p17 vs. 0.21 – 0.89 at p34; Table 1 and Figure 4H). ribbon size from the modiolar-side to the pillar-side of the IHC
Whereas the SA of the PD and PSD were clearly positively has been well-described with electron microscopy in the adult cat
correlated (Figure 4D), there was no such correlation between and developing mouse organ of Corti (Liberman, 1980; Merchan-
ribbon volume and PSD SA (Figure 4I) or PD SA (not shown). Perez and Liberman, 1996; Kantardzhieva et al., 2013; Michanski
Similarly, whereas the L:S axis ratios of the PD and PSD were et al., 2019). This modiolar-pillar (M-P) spatial gradient, also
clearly positively correlated (Figure 4E), there was no such seen in confocal microscopy with antibodies to CtBP2/Ribeye,
correlation between the L:S axis ratios of the ribbon and the is typically quantified by splitting the synapses into two groups
PSD (Figure 4J). Thus, in contrast to the apparent transsynaptic by position on either side of a plane dividing the modiolar-
coordination between PDs and PSDs at p17 and p34, with side from the pillar-side (Liberman and Liberman, 2016, 2015;
maturation dominated by shortening of the short axes, ribbon Ohn et al., 2016). Although IHCs reside as a single row of
morphology had no clear relationship to the PD or PSD at either cells located between the inner border cells (to the modiolar
age. In common, ribbons and membrane densities became less side) and the inner pillar cells (to the pillar side), sometimes
rounded with maturation from p17 to p34. the basolateral membranes of IHCs are not perfectly aligned
along the M-P axis (Figure 6). Particularly in the mid-cochlea
of the mouse, the basolateral membranes of neighboring IHCs
Spatial Gradient of Ribbon Morphology tend to alternate relative positions along the M-P axis, which is
Emerges With Cochlear Maturation apparent in top and side views of the dataset (Figures 6B,C).
Next, we sought to measure spatial gradients in the sizes This IHC positioning in the tissue can cause some synapses
of ribbons, PDs, and PSDs, and to determine if the overall on the modiolar face of one IHC to occupy the same M-P
developmental changes tended to occur with a spatial preference. position in the tissue as synapses on the pillar face of a
Each IHC resides in a position within the organ of Corti, and each neighboring IHC. We therefore defined space in two ways (see
synapse resides in a position on the IHC surface (Figures 5, 6, section “METHODS”). In the “native” view, synapse position
Supplementary Movies 7–10). A spatial gradient of decreasing was calculated relative to the positions of all the other synapses
Frontiers in Synaptic Neuroscience | www.frontiersin.org 9 June 2021 | Volume 13 | Article 678575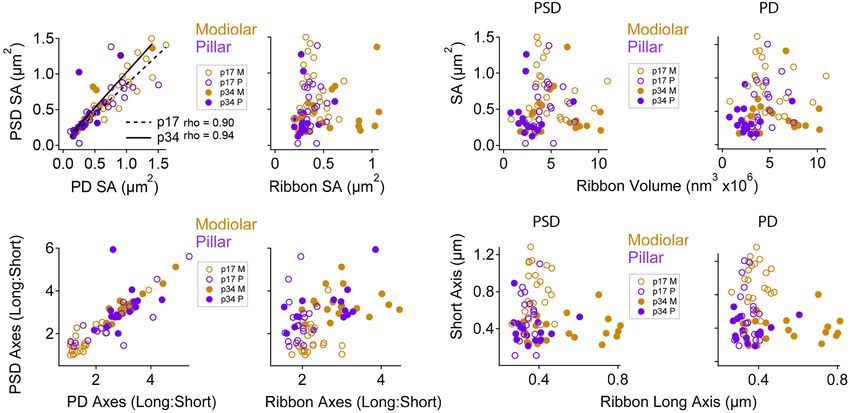
Payne et al.                                                                                                                      Maturation of Afferent Synapse Heterogeneity

  FIGURE 6 | Translation of synapse positions to a common IHC reference frame. (A) Lower: Schematic indicating the three orthogonal planes demonstrated in panels
  A, B, and C (as in Figure 5). X-axis is the cochlear spiral; Y-axis is apical-basal; Z-axis is modiolar-pillar. Upper: Image acquired in the XY plane (original view) from
  the p17 sample. Two IHCs are colored light blue and blue; two afferent fibers are colored yellow and green; one synaptic ribbon is colored orange. Green dashed line
  indicates plane of virtual section displayed in panel (B). (B) Upper: Virtual section indicated in panel A, showing top-down view in the ZX plane. Z-axis is the
  modiolar-pillar dimension. IHCs shifted to the modiolar side are light blue; IHCs shifted to the pillar side are darker blue; inner border cells are orange; inner pillar cells
  are violet. The terminal of the green fiber contacts the orange ribbon on the dark blue IHC. The terminal of the yellow fiber contacts a magenta ribbon on the light
  blue IHC. Black dashed line indicates plane of virtual section displayed in panel (C). Lower, left: Schematic of IHCs in the native positions from the top view. Right:
  Translated positions, after aligning IHCs in the modiolar-pillar dimension. (C) Virtual section indicated in panel B, showing side view in the ZY plane. Lower, left:
  Schematic of IHCs in the native positions from the side view. Right: Translated view, after aligning IHCs in the modiolar-pillar and apical-basal dimensions. Scale bars
  are approximately 5 µm.

in the region of imaging. In the “translated” view, synapse                                  right subpanels; significant linear trend, Spearman’s rho = -0.48).
positions from each IHC were transformed onto a common,                                      Comparisons of SA between modiolar and pillar ribbons did
virtual central axis. In both cases, the middle point along the                              not reach statistical significance even at p34 in the translated
M-P axis (corresponding to the center of the tissue in the native                            view, in which the median modiolar ribbon had nearly twice
view or the center of the IHC in the translated view) defined the                            the SA of the median pillar ribbon (Table 1; 0.49 ± 0.29 vs.
position of the orthogonal plane dividing the modiolar (M) and                               0.28 ± 0.1 µm2 ). Modiolar ribbon volume was significantly larger
pillar (P) groups.                                                                           than pillar ribbon volume only at p34 in the translated view
    In the native view, the M-P axis ranged over approximately                               (4.9 ± 2.6 vs. 2.4 ± 1.5 µm3 ), as pillar-side ribbons became
14 µm (Figures 7A,B, upper subpanels). In the translated view,                               significantly smaller from p17 to p34 (p = 1.3e−4 ) while modiolar-
the M-P axis ranged over the width of one IHC, approximately                                 side ribbon volumes were unchanged (p = 0.55; Table 1 and
8 µm (Figures 7A,B, lower subpanels). At p17 there was no                                    Figure 7C).
apparent gradient of ribbon SA along the M-P axis in either                                     The ribbon long-axis was significantly longer in the modiolar
the native or translated views (Figure 7B, left subpanels), and                              group than the pillar group at p17 (p = 1.7e−2 , effect size = 0.7),
there was no significant difference in SA between modiolar and                               and more so at p34 with larger effect size (p = 1.0e−3 , effect
pillar ribbons (Table 1, translated view; Supplementary Table 1,                             size = 1.39) due to lengthening of the long-axis specifically on
native view). At p34, a M-P gradient of ribbon SA was apparent                               the modiolar side from p17 to p34 (372 ± 52 vs. 541 ± 179 nm;
in the translated view but not in the native view (Figure 7B,                                Table 1, Figures 7D,E), with synapses in the translated view.

Frontiers in Synaptic Neuroscience | www.frontiersin.org                                10                                               June 2021 | Volume 13 | Article 678575
Payne et al. Maturation of Afferent Synapse Heterogeneity
FIGURE 7 | Ribbon morphology by modiolar-pillar position. (A) Synapse position along the basal – apical (or habenular – cuticular) axis of the IHC versus synapse
position along the modiolar – pillar (M-P) axis of the organ of Corti (native view, upper) or of the superimposed IHCs (translated view, lower) for p17 (left) and p34
(right). Marker diameter is proportional to ribbon volume; marker color identifies the ribbon with one of 3 IHCs in the imaging region. In the translated view, a
schematic of an IHC (light blue) and its afferents (light yellow) is overlaid to indicate the modiolar and pillar halves of the IHC. (B) Ribbon surface area versus M-P
position in the native view (upper) or the translated view (lower) for p17 (left) and p34 (right). Gold and purple markers correspond to modiolar and pillar groups,
respectively. Ribbon SA showed a significant M-P gradient in the translated view at p34 (p = 4.4E-03; rho = –0.48). (C) Ribbon volume versus M-P position in the
translated view at p17 (left) and p34 (right). Ribbon volume showed a significant M-P gradient at p34 (p34: p = 6.4E-11; rho = –0.51). (D) Ribbon Long axis: Short
axis ratios for modiolar (gold) or pillar (purple) ribbons in the translated view for p17 and p34. Within each box, horizontal line denotes the median; box extends the
interquartile range; vertical line denotes the 10-90 percentile range. Significant difference in ratios over development (p = 5.3E-06) came mainly from significant
changes on the modiolar side (p = 5.2E-05). (E) Ribbon long axis (filled circles) and short axis (open circles) versus M-P position in the translated view for p17 (left)
and p34 (right). The ribbon long axis showed a significant M-P gradient at p34 (p = 1.1E-03; rho = –0.54). *p < 0.05, ***p < 0.001, ****p < 0.0001.
In the native view, this comparison was significant only at p34 habenula perforata) to the apical pole of the IHC (near
(Supplementary Table 1 and Supplementary Figures 1A,B). The the cuticular surface of the organ of Corti), we plotted the
range of long axes increased 3-fold as the upper end was extended data as a function of habenular-cuticular position. There
from p17 (263 – 480 nm) to p34 (271 – 813 nm). Ribbon short- was no apparent spatial gradient of ribbon axes at p17
axis was significantly longer in the modiolar group than the in either the native or translated view (Supplementary
pillar group only at p34 in the translated view (p = 1.2e−2 , effect Figures 2A,C). However, an increasing habenular-cuticular
size = 0.96) after significant shortening of the short-axis on the gradient did emerge at p34 in the translated view for
pillar side from p17 to p34 (183 ± 20 vs. 150 ± 28 nm, p = 2.3e−4 , ribbon long axes (Supplementary Figure 2C), although it
effect size = 1.38). was not a significant correlation nor was there a significant
To determine if there were gradients in synapse size along difference between habenular and cuticular groups (p = 0.65).
the dimension from the basal pole of the IHC (near the In conclusion, ribbon long axes increase over development,
Frontiers in Synaptic Neuroscience | www.frontiersin.org 11 June 2021 | Volume 13 | Article 678575Payne et al. Maturation of Afferent Synapse Heterogeneity
FIGURE 8 | Post-synaptic density (PSD) morphology by modiolar-pillar position. (A) Synapse position along the basal – apical (or habenular – cuticular) axis of the
IHC versus synapse position along the modiolar – pillar (M-P) axis of the organ of Corti (native view, upper) or of the superimposed IHCs (translated view, lower) for
p17 (upper) and p34 (lower). Marker diameter is proportional to PSD surface area; marker color identifies the PSD with one of 3 IHCs in the imaging region. In the
translated view, a schematic of an IHC (light blue) and its afferents (light yellow) is overlaid. (B) PSD surface area versus M-P position in the native view (upper) or the
translated view (lower) for p17 (left) and p34 (right). Gold and purple markers correspond to modiolar and pillar groups, respectively. Significant gradients were
observed at p17 in native (p = 7.6E-02; rho = 0.28) and translated views (p = 1.9E-02; rho = –0.36). (C) PSD (left) and PD (right) Long axis: Short axis ratios for
modiolar (gold) or pillar (purple) ribbons in the translated view for p17 and p34. Significant difference in the PSD Long: Short axis ratio over development
(p = 8.8E-09) came from changes on the modiolar side (p = 6.6E-09). Significant difference in the PD Long: Short axis ratio over development (p = 7.0E-07) came
from changes on the modiolar side (p = 3.8E-09). (D) PSD long axis (filled circles) and short axis (open circles) versus M-P position in the translated view for p17 (left)
and p34 (right). *p < 0.05, ***p < 0.001, ****p < 0.0001.
predominantly on the modiolar side, while ribbon short axes of the PSD and the PD are significantly reduced from p17
became shorter on the pillar side. Orthogonal to the M-P to p34. In the native view, this reduction was significant
axis, the ribbons with the longest long-axes were located in on the pillar side only (Supplementary Table 1). In the
the cuticular half of the distribution of synapses, toward the translated view, this developmental reduction in SA was
apical part of the IHC, placing the longest ribbons in the predominantly on the modiolar side (Table 1) for the
modiolar/cuticular quadrant. PD (0.87 ± 0.36 vs. 0.34 ± 0.28 µm2 ) and the PSD
(0.66 ± 0.35 vs. 0.34 ± 0.29 µm2 ). At p17, a significant
spatial gradient in PSD SA in the native view (increasing
Spatial Gradient of PSD Morphology modiolar to pillar, Spearman’s rho = 0.28) was reversed in
Diminishes With Cochlear Maturation the translated view (decreasing modiolar to pillar, Spearman’s
In Figure 8, we treated PSDs the way we treated ribbons rho = −0.36, Figure 8B, left subpanels), but modiolar-side
in Figure 7. As seen in Figure 4 and Table 1, the SA PSDs were not significantly different from pillar-side PSDs
Frontiers in Synaptic Neuroscience | www.frontiersin.org 12 June 2021 | Volume 13 | Article 678575Payne et al. Maturation of Afferent Synapse Heterogeneity
FIGURE 9 | Maturation of pre- and post-synaptic morphological relationships by modiolar-pillar position. (A) PSD SA vs. PD SA (left) or Ribbon SA (right). The
correlations between PSD SA and PD SA were significant at p17 (p = 3.7E-03; rho = 0.9) and p34 (p = 3.3E-03; rho = 0.94). In all panels: open circles are p17, filled
circles are p34; gold circles are modiolar, purple circles are pillar. (B) PSD L:S axis ratio vs. PD L:S axis ratio (left) or Ribbon L:S axis ratio (right). (C) PSD SA (left) or
PD SA (right) vs. Ribbon volume. (D) PSD short axis (left) or PD short axis (right) vs. Ribbon long axis.
in either view. Differences were slightly larger for PDs than Spatial Dependence of Pre- and
PSDs, reaching marginal significance only at p17, and in Post-Synaptic Relationship
opposite directions in the native and translated views like the
Next, we examined the relationships between ribbons, PDs, and
PSDs (Table 1 and Supplementary Table 1; p = 0.045 and
PSDs at paired synapses with respect to modiolar and pillar
0.04, respectively).
groups. From herein, we refer to the translated view only,
At p34, modiolar side PDs and PSDs had very similar SA, on
unless otherwise noted. PD and PSD surface areas tended to be
average, as pillar side PDs and PSDs, in either view (Figure 8B,
very similar at individual synapses (Figure 9A, left; Spearman’s
right subpanels; overall range 0.16 – 1.4 µm2 ). For the 8
rho = 0.90 at p17, and 0.94 at p34 with the removal of one
groupings (PD or PSD, modiolar or pillar, native or translated)
outlier). The slopes of the linear fits were: p17 modiolar, 0.89;
the medians ranged 0.30 – 0.34 µm2 , p = 0.53 – 0.86. The
p17 pillar, 0.69; p34 modiolar, 0.97; and p34 pillar, 1.1. As the
overall reduction in SA of PDs and PSDs from p17 to p34
SA of PDs and PSDs became smaller with maturation, the long:
was associated with a significant shortening of the short-axes
short axis ratios became larger. These changes were largest for the
of the membrane densities, not the long axes (Figures 4B,C;
modiolar synapses between p17 and p34 because the modiolar
Table 1). This reduction in PD and PSD short axes occurred on
group at p17 had smaller long: short ratios than the pillar group
the pillar side in the native view (Supplementary Figure 1C)
(Figure 9B), suggesting the pillar-side synapses had a more
and on the modiolar side in the translated view (Figures 8C,D).
mature morphology at p17 than the modiolar-side synapses.
However, the modiolar vs. pillar difference in short axes at p17
Although the relationships between SA of PDs and PSDs were
was significant only in the translated view for the PD (0.84 ± 0.24
well-described by linear trends, the SA of the ribbon was not a
vs. 0.55 ± 0.28 µm, p = 2e−3 ) and the PSD (0.77 ± 0.26
good predictor of PSD SA (Figure 9A, right).
vs. 0.54 ± 0.26 µm, 3.8e−3 ). Unlike presynaptic ribbons in
We plotted the long: short PSD axis ratios vs. the long:
which the variance of long: short axis ratios increased with
short ribbon axis ratios and did not see any clear relationship
lengthening of the long axis on the modiolar side from p17 to
between ribbon shape and PSD shape for modiolar or pillar
p34 (Figures 7D,E), the variance of long: short axis ratios of
synapses at p17 (Figure 9B, right). For example, while the
PDs and PSDs decreased from p17 to p34 with shortening of
pillar-side PSDs had more mature-like morphologies than the
the short axis on the modiolar side (Figures 8C,D). Along the
modiolar-side PSDs at p17 (i.e., larger L:S ratios), the pillar-
habenular-cuticular dimension, there was no apparent spatial
side ribbons did not (Figure 9B, right), suggesting that PDs
gradient of axis length at p17 or p34 in either the native or may take maturational cues from the PSD (or vice versa)
translated view (Supplementary Figure 2B,D). In conclusion, rather than the ribbon. Similarly, there was no clear systematic
pre- and post-synaptic membrane densities grow narrower over variation in morphology of the PSD or the PD with ribbon
the course of development, predominantly on the modiolar volume (Figure 9C). The variation within or across the four
side of the IHC as seen in the translated view (Figure 8D groups of PDs or PSDs was not well described by linear
and Table 1). functions of ribbon size. To ask if there was coordination
Frontiers in Synaptic Neuroscience | www.frontiersin.org 13 June 2021 | Volume 13 | Article 678575Payne et al. Maturation of Afferent Synapse Heterogeneity FIGURE 10 | Comparing synapse morphology with models of synapse geometry. (A–D) Left: Observations of diversity in PSD shape in the raw data. Each row is one synapse shown from different perspectives. Right: Reconstructions in side views and top views. (E–F) Geometric models used for comparison with PSD shape, shown from the side (E) and top views (F). Yellow lines show measurements of shortest distance from points on the PSD to the ribbon. Scale bars are approximately 1 µm. between ribbon elongation and narrowing of the membrane and neuronal cues for maturation of synaptic heterogeneity over densities over postnatal maturation, seen particularly on the late postnatal development. modiolar side, we explored the relationship between PSD short axis and ribbon long axis (Figure 9D). Although the largest ribbons tended to be on the modiolar side of p34 IHCs, Pillar-Side Maturation in Spatial Coupling those ribbons were not paired with particularly large PDs or Between the Ribbon and PSD PSDs (Figure 9D). In conclusion, the apparent coordination of When viewing ribbon synapse ultrastructure, we observed a morphology between pre- and post-synaptic membrane densities variety of membrane curvatures at the PD/PSD apposition near did not appear to extend to the ribbon, suggesting separate IHC the ribbon. The membrane curvature is often concave around Frontiers in Synaptic Neuroscience | www.frontiersin.org 14 June 2021 | Volume 13 | Article 678575
Payne et al. Maturation of Afferent Synapse Heterogeneity
the ribbon, then becoming more convex with further distance pillar side, as is most clearly seen for the longest distances on the
from the ribbon. However, the shape of the curvature of the linear scale in the translated view (Figure 11E, lower).
synaptic cleft was complex, ranging from extremely convex or To model synapse shape with this approach, we made these
concave to relatively flat at the same synapse, depending on the PDF measurements also on the four virtual synapses created from
section and the orientation, making them difficult to classify geometric shapes in Figures 10E,F. These PDFs are displayed
(Figures 10A–D). We therefore created 4 virtual synapses to span alongside the group means on both the log scale and the
the range of shapes observed within and across synapses: the linear scale (Figure 11F, solid lines). Overlaid in dashed lines
hemi-sphere, the disk, the ring, and the donut (Figures 10E,F). are PDFs from four synapses resembling each of the four
In each of the 4 models, the ribbon was a sphere with diameter of models represented by different colors. The PDF of the hemi-
300 nm. The edge of the ribbon was positioned 84 nm (12 voxels) sphere has distances constrained to a very narrow range, but
away from the center of the PSD. The PSDs were constrained to not identical distances as would be the case if the ribbon
have the same diameter (diameter of 3D projection on the 2D and the hemi-sphere had identical centers (Figure 11F, black
plane = 1400 nm). The hemi-sphere model has extreme concave line). The PDFs of the disk and the ring are very similar,
curvature, in which the ribbon sits inside the “bowl” shape of particularly on a linear scale (Figure 11F, green and blue
the PSD. The disk model is flat, having no curvature. The ring lines). On a log scale, they are seen to diverge at the low
is the disk with a hole in the center of 250 nm diameter. The end because the ring is missing the shortest distances that are
donut includes the 250 nm diameter hole in the center, then has a present on the disk (Figure 11F, upper). The PDF of the donut
concave curvature near the ribbon, becoming convex with further begins near that of the ring, due to the hole, but then rises
distance. Below, we will compare the shapes of these models with more slowly like the hemi-sphere due to membrane curvature
the shapes of ribbon synapses. allowing for more short distances. The shapes of the PDFs
We developed a novel, objective measurement of synapse for the real synapses appeared to most closely resemble the
shape and size. For the ribbon-facing surface of each segmented models that included curvature – the hemi-sphere and the
PSD, we measured the shortest distance from each vertex of donut. The PDFs of the flat models (disk and ring) had a
the segmented model to the surface of the synaptic ribbon feature not seen in the data – an ever-increasing slope – most
(Figure 10E). From the list of distance measurements for each clearly visible when displayed on the linear scale (Figure 11F,
synapse, we generated a histogram. Displayed as normalized lower). Upon inspection of the pillar-side PDFs at p17 and
cumulative histograms or probability density functions (Cum. p34 (Figures 11A,B, lower) the most obvious difference is a
PDF) for each synapse, each curve shows the distances reduction in synapses with shapes that most closely resemble
measured from the PSD to the surface of the ribbon on the the disk and the ring models on the log scale (Figure 11F,
X-axis (Figure 11A: p17 modiolar (upper), p17 pillar (lower); upper, blue and green lines). This may reflect emergence of
Figure 11B: p34 modiolar (upper), p34 pillar (lower). For group membrane curvature and/or a shift toward more compact
comparisons, we extracted the median distance for each synapse synapses as they mature on the pillar side, possibly toward tighter
and the 15th percentile distance for each synapse (Figure 11C). spatial coupling.
From p17 to p34, the range of median distances per synapse
was significantly reduced from 103 – 723 nm to 42 – 466 nm Modiolar/Pillar Difference in
(Table 1, median of medians reduced from 259 to 191 nm, Ribbon-Associated Vesicles Emerges
p = 2.8e−3 ). In both the native and translated views, this
developmental reduction in median distance was significant only
With Ribbon Gradient as
on the pillar side (p = 1.1e−2 , native; p = 2.6e−3 , translated, Membrane-Associated Vesicles Are
Figure 11C). However, there was no significant modiolar-pillar Reduced
difference at either age in either view (Figure 11C, Table 1 The numbers of synaptic vesicles within 80 nm of the surface
and Supplementary Table 1). Unlike the medians, the 15th of the ribbon (i.e., the number of ribbon-associated vesicles)
percentile distances were not significantly changed overall from did not change significantly from p17 to p34, either overall
p17 to p34, however, like the medians, there was a developmental or on the modiolar or pillar sides in either view (Table 1
reduction specifically on the pillar side (Figure 11C, lower). and Supplementary Table 1, Supplementary Figures 3A,B).
Therefore, like the reduction in PSD SA and short axes, the Neither was there a significant habenular-cuticular gradient
distances between PSDs and ribbons is reduced from p17 to (Supplementary Figure 3C,D). However, in the translated view
p34. However, unlike the reduction in PSD SA and short axes at p34 only, we found significantly more ribbon-associated
on the modiolar side in the translated view, the maturational vesicles at synapses on the modiolar side than the pillar
reduction in PSD-ribbon distance was found on the pillar side, side (Figure 12A, 171 ± 59 vs. 102 ± 34 vesicles per
suggesting that these measurements captured a different aspect ribbon; p = 1.4e−3 ; Table 1), and a significant modiolar-pillar
of morphological maturation. For each of the four groups (p17 gradient (Supplementary Figure 3B, right side, Spearman’s
M, p17 P, p34 M, p34 P) we calculated the mean Cum. PDF for rho = −0.55, p = 1.3e−3 ). We found no such differences or spatial
the native view (Figure 11D) and translated view (Figure 11E) gradients along the habenular-cuticular axis (Supplementary
displayed on a log-log scale (upper) or linear-linear scale (lower). Figure 3C,D). There was a strong positive correlation between
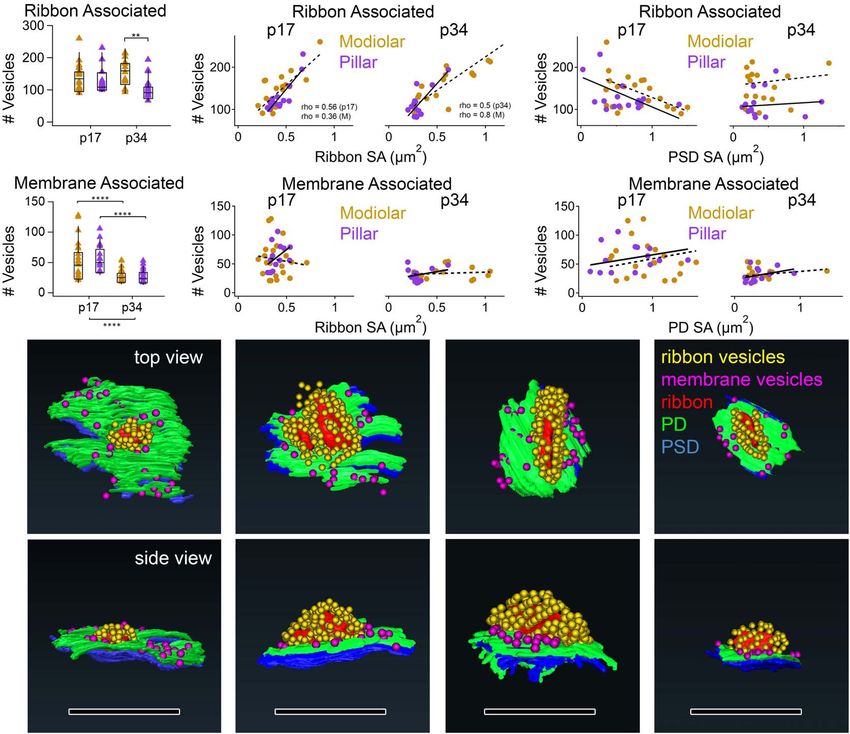
Developmental effects (p17 vs. p34) were larger than spatial ribbon-associated vesicles and ribbon SA at p17 (Spearman’s
effects (M vs. P), and the largest developmental effect was on the rho = 0.56) and p34 (Spearman’s rho = 0.50; Figure 12B).
Frontiers in Synaptic Neuroscience | www.frontiersin.org 15 June 2021 | Volume 13 | Article 678575You can also read