Partial-Volume Effect in PET Tumor Imaging
←
→
Page content transcription
If your browser does not render page correctly, please read the page content below
CONTINUING                EDUCATION

Partial-Volume Effect in PET Tumor Imaging*
Marine Soret1,2, Stephen L. Bacharach3, and Irène Buvat1
1UMR    678 INSERM-UPMC, CHU Pitié-Salpêtrière, Paris, France; 2Nuclear Medicine Department, HIA Val-de-Grâce, Paris, France;
and   3Departmentof Radiology, University of California, San Francisco, California

                                                                              (1,2). Indeed, one of the most promising uses of PET is to
PET has the invaluable advantage of being intrinsically quantita-             quantify changes in tumor metabolism or physiology as a
tive, enabling accurate measurements of tracer concentrations                 function of time. The hope is that the physiologic response of
in vivo. In PET tumor imaging, indices characterizing tumor up-               a tumor to therapy (e.g., by a change in the glucose metabolic
take, such as standardized uptake values, are becoming increas-
                                                                              rate) will become apparent long before gross changes in
ingly important, especially in the context of monitoring the
response to therapy. However, when tracer uptake in small tu-                 tumor size occur. Such information would potentially permit
mors is measured, large biases can be introduced by the partial-              changing or eliminating a particular course of therapy
volume effect (PVE). The purposes of this article are to explain              depending on whether it was producing a change in metab-
what PVE is and to describe its consequences in PET tumor                     olism. The consequences of such a test would be profound—
imaging. The parameters on which PVE depends are reviewed.                    for example, sparing patients from the potentially devastating
Actions that can be taken to reduce the errors attributable to                effects of an ineffective course of chemotherapy or allowing
PVE are described. Various PVE correction schemes are pre-
                                                                              an alternative therapy to be instituted. PET with 18F-FDG is
sented, and their applicability to PET tumor imaging is discussed.
                                                                              highly reproducible (SD around 9%) (3). This fact would seem
Key Words: PET; tumor imaging; partial volume; standardized
uptake value
                                                                              to make PET ideal for monitoring tumor therapy. Unfortu-
                                                                              nately, PVE can have a significant negative impact on the
J Nucl Med 2007; 48:932–945
DOI: 10.2967/jnumed.106.035774
                                                                              ability of PET to be used for this function.
                                                                                 We first describe what PVE is and its consequences in
                                                                              PET tumor imaging. We next present the parameters that
                                                                              affect the magnitude of PVE. Because there is currently no
P    ET has the potential to produce quantitatively accurate
measurements of tracer concentrations in vivo. Thanks to
                                                                              widely accepted solution for PVE correction, we review the
                                                                              different methods that have been proposed so far to reduce
                                                                              the errors attributable to PVE. The relevance of these
PET/CT systems and fast iterative reconstruction, quanti-
                                                                              solutions in the context of PET tumor imaging is discussed.
tative functional imaging has become a clinical reality.
                                                                              Examples are provided to illustrate the potential impact of
Large quantitative biases introduced by attenuation and, to
                                                                              PVE correction in that context.
a lesser extent, scatter can now be corrected for. However,
quantitative biases of the same order as those caused by
attenuation are introduced by the partial-volume effect                       WHAT IS PVE?
(PVE). However, PVE is not routinely dealt with and is
often overlooked, even in clinical research. As indices                          The term ‘‘partial-volume effect’’—somewhat of a
characterizing uptake, such as standardized uptake values                     misnomer—actually refers to 2 distinct phenomena that
(SUVs), become more widely used in PET to assist in the                       make intensity values in images differ from what they
interpretation of the findings, more attention must be paid                   ideally should be. The first effect is the 3-dimensional (3D)
to PVE.                                                                       image blurring introduced by the finite spatial resolution of
   Understanding PVE is of foremost importance in the                         the imaging system. The spatial resolution in PET images is
context of measuring the response to therapy with PET                         limited by the detector design (by the pitch of the crystal in
                                                                              the axial direction, for instance) and by the reconstruction
                                                                              process (4). The resulting 3D blurring causes spillover
                                                                              between regions, as illustrated in 2 dimensions in Figure 1,
  Received Oct. 9, 2006; revision accepted Mar. 20, 2007.
  For correspondence or reprints contact: Irène Buvat, UMR 678 INSERM,
                                                                              although the effect is actually 3D. Because of the finite
91 Boulevard de l’Hôpital, CHU Pitié-Salpêtrière, 75634 Paris Cedex 13,   spatial resolution, the image of a small source is a larger but
France.
  E-mail: buvat@imed.jussieu.fr
                                                                              dimmer source. Part of the signal from the source ‘‘spills
  *NOTE: FOR CE CREDIT, YOU CAN ACCESS THIS ACTIVITY THROUGH                  out’’ and hence is seen outside the actual source (Fig. 1).
THE SNM WEB SITE (http://www.snm.org/ce_online) THROUGH JUNE 2008.
  No potential conflict of interest relevant to this article was reported.
                                                                              Mathematically speaking, the finite resolution effect is
  COPYRIGHT ª 2007 by the Society of Nuclear Medicine, Inc.                   described by a 3D convolution operation. The image is

932       THE JOURNAL       OF   NUCLEAR MEDICINE • Vol. 48 • No. 6 • June 2007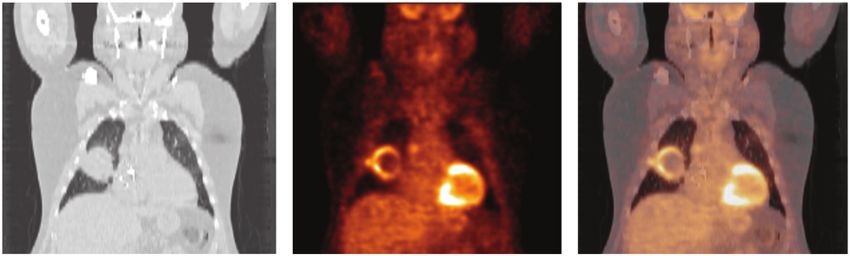
PRACTICAL CONSEQUENCES OF PVE
                                                                        PVE can severely affect images both qualitatively and
                                                                     quantitatively. For any hot lesion of a small size and embed-
                                                                     ded in a colder background, PVE spreads out the signal. This
                                                                     effect typically occurs whenever the tumor size is less than
                                                                     3 times the full width at half maximum (FWHM) of the
                                                                     reconstructed image resolution. The maximum value in the
                                                                     hot tumor then will be lower than the actual maximum value
                                                                     (Fig. 1). A small tumor will look larger but less aggressive
                                                                     than it actually is.
                                                                        PVE compensation is complicated by the fact that not
                                                                     only does activity from inside the tumor spill out but also
FIGURE 1. Circular source (diameter of 10 mm) of uniform             activity from outside the tumor spills into the tumor,
activity (100 arbitrary units) in nonradioactive background yields   partially compensating for the spilling out (Fig. 3). Obvi-
measured image in which part of signal emanating from source
is seen outside actual source. Maximum activity in measured          ously, the spilling out (signal from inside the tumor that
image is reduced to 85.                                              goes outside the tumor [Fig. 3]) depends on the uptake
                                                                     inside the tumor. Most often, it is not balanced by the
                                                                     spilling in (signal from outside the tumor that comes inside
formed by the convolution of the actual source with the 3D           the tumor); therefore, it is difficult to predict the overall
point spread function of the imaging system.                         effect of PVE. In tumors with wholly or partially necrotic
   The second phenomenon causing PVE is image sam-                   centers, spilling in will cause one to think that there may be
pling. In PET, the radiotracer distribution is sampled on a          more viable tumor tissue within the tumor center than there
voxel grid. Obviously, the contours of the voxels do not             really is. Simultaneously, the active part of the tumor will
match the actual contours of the tracer distribution. Most           look less aggressive than it actually is (5).
voxels therefore include different types of tissues. Figure 2           PVE also affects the apparent tumor size. This effect is
illustrates this effect in 2 dimensions, although again, it is       especially problematic when PET is used to assist in radio-
actually a 3D effect. This phenomenon is often called the            therapy treatment planning. The contours of a lesion as seen
tissue fraction effect. The signal intensity in each voxel is        on a PET image may encompass more than the real meta-
the mean of the signal intensities of the underlying tissues         bolically active part of the tumor because of the limited
included in that voxel (Fig. 2). Note that even if the               spatial resolution in PET images (;5 mm). In PET/CT, the
imaging system had perfect spatial resolution, there would           fusion of the PET and CT images usually clearly shows this
still be some PVE because of image sampling. This phe-               discrepancy between the tumor contours as displayed on the
nomenon is why PVE not only is an issue in emission                  CT image and on the PET image (Fig. 4). However, fre-
tomography, which has poor spatial resolution compared               quently the contours seen on the CT image do not delineate
with other imaging modalities, but also is of concern in             the metabolically active part of the tumor, as CT does not
high-resolution imaging, such as MRI or CT.                          show metabolically active tissue but rather shows only the
   Ideally, compensation for PVE should account for both             attenuating properties of the tissue. Only high-resolution
the finite resolution effect and the tissue fraction effect.         functional imaging provides an accurate delineation of the
Motion, especially respiratory motion, also introduces a             metabolically active part of the tumor. The quest for higher-
blurring effect that results in additional PVE. However, this        resolution PET systems therefore remains highly relevant,
specific source of PVE is not covered in this article.               despite the current availability of PET/CT scanners.
                                                                        In the absence of background activity, PVE does not affect
                                                                     the total activity in the tumor. If a large enough region could
                                                                     be drawn around the tumor, then the total activity in the tumor
                                                                     could be recovered. In other words, PVE does not cause any
                                                                     loss of the signal; it just displaces the signal in the image.

                                                                     PARAMETERS AFFECTING PVE
                                                                       The biases introduced by PVE depend on numerous
                                                                     parameters, only some of which can be controlled. All of
FIGURE 2. Influence of image sampling on PVE. Pixels on              these parameters must be kept in mind in the context of
edges of source include both source and background tissues.
Signal intensity in these pixels is mean of signal intensities of    tumor follow-up, as they may not remain constant from one
underlying tissues. Part of signal emanating from source is seen     imaging session to another, making the biases introduced by
outside actual object and therefore is described as spilling out.    PVE vary from one imaging session to another.

                                                                       PARTIAL-VOLUME EFFECT      IN   PET • Soret et al.      933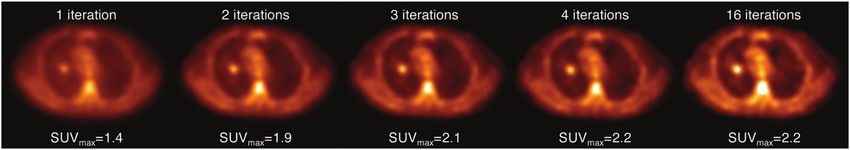
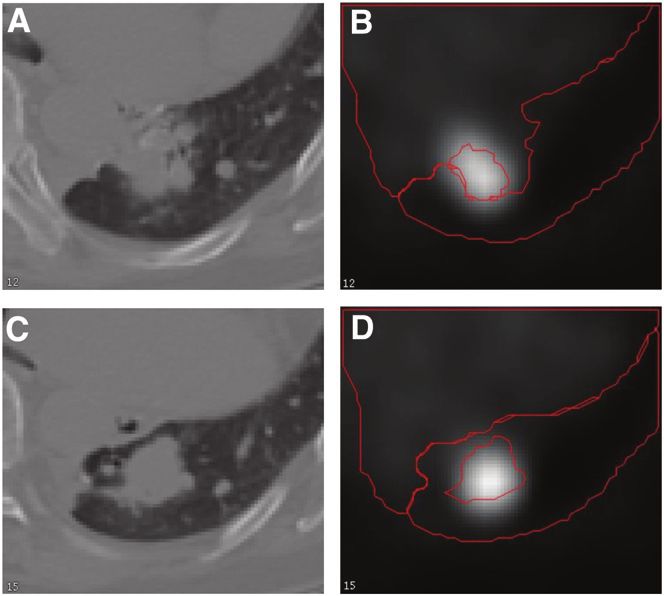
FIGURE 3. The measured image (D) of
the activity distribution (A) results from
mixture of spilling out (B) and spilling in
(C). Image sampling affects background
activity, creating spilling in within tumor
(C). Resulting image is sum of spilling in
and spilling out (D).

Tumor Size and Shape                                               prone to spilling in and spilling out. For instance, a cylindric
   PVE strongly depends on the size of the tumor. The smaller      tumor with a diameter of 2.3 cm and with a volume identical
the tumor, the greater the underestimation of the uptake           to that of a 4.6-cm-diameter sphere will yield an apparent
value. As a result, different tumors with exactly the same         activity about 40% lower than that of a spheric tumor when
uptake value but with different sizes yield tumor images with      activity is measured within the actual contours of the tumor
different degrees of brightness and hence different estimated      (9).
uptake values (Fig. 5) (6).
   The nonlinear correlation that PVE causes between SUV           Surrounding Tissues
and tumor size has been shown in several clinical studies             As previously stated, PVE results in spilling in and spilling
(e.g., studies by Vesselle et al. (7) and Hallett et al. (8)):     out (Fig. 3). The size, shape, and uptake of the tumor fully
small tumors appear less aggressive than they actually are.        determine the spilling out for a given spatial resolution.
This dependence is extremely confounding in the context of         However, the spilling in depends on the surrounding back-
therapeutic follow-up. Indeed, if a tumor shrinks in size as       ground activity. For example, with 18F-FDG a lung tumor
the course of therapy progresses, then it will erroneously         will be less affected by spilling in than will a tumor in the
appear to have less activity when it is small than when it         liver. The lung tumor therefore will appear dimmer than the
was larger. Therefore, even if the true metabolic rate has         liver tumor even if both tumors have the same size, shape, and
stayed constant or increased slightly, PVE may cause an            uptake. The spilling in is often difficult to estimate, especially
erroneous decrease in apparent uptake. Conversely, if a            when the tumor is surrounded by a variety of tissues with
tumor is small to begin with but increases in size over the        different uptake values (Fig. 6). When SUVs are measured
course of therapy, then uptake will erroneously appear to          for therapeutic follow-up, the surrounding non–tumor-specific
increase, even if the true metabolic rate has decreased or         activity (e.g., myocardial uptake, bowel uptake, and activity
remained constant. If the tumor increases in size while the        in the urinary tract) can change from one scan to another.
metabolic activity decreases, then the 2 effects will par-         Changes in apparent tumor uptake therefore should be in-
tially compensate for each other. The net apparent change          terpreted only after changes in the nearby background tissue
in uptake will depend on the respective magnitudes of the          also have been considered, as a change in apparent tumor
changes in tumor volume and the changes in tumor uptake.           uptake may reflect only a change in spilling in, without any
These problems illustrate why PVE is so difficult to deal          change in the metabolic activity of the tumor.
with.                                                                 Similarly, the spilling in depends on whether a tumor
   PVE also depends on the shape of the tumor, more                includes a necrotic region. For a tumor of given size and
precisely, on how ‘‘compact’’ it is. The term ‘‘compact’’          uptake at a fixed spatial resolution, the apparent uptake
refers to how much surface area a tumor has for a given            value will always be lower if the tumor includes a necrotic
volume. The larger the surface area for a given volume, the        region (5).
less compact the tumor. Spheric tumors are the most com-
pact. For a given volume, tumors that are less compact are         Spatial Resolution in Reconstructed Images
more affected by PVE than are spheric tumors, because a              Although tumor size and shape and uptake in tissues
larger part of the tumor is close to the tumor edges and is thus   surrounding the tumor cannot be controlled, the impact of

FIGURE 4. (A) PET image. (B) Corre-
sponding CT image. (C) PET/CT image.
Discrepancy between tumor contours as
seen on CT and PET images is clearly
visible.

934      THE JOURNAL     OF   NUCLEAR MEDICINE • Vol. 48 • No. 6 • June 2007
of therapy, it is essential to compare tumor uptake values
                                                                     only in images with identical spatial resolution values. Any
                                                                     change in reconstruction software potentially affecting the
                                                                     spatial resolution in reconstructed images therefore must be
                                                                     avoided.

                                                                     Image Sampling
                                                                        Image sampling affects the magnitude of PVE through
                                                                     the tissue fraction effect. Large pixels have a greater chance
                                                                     of containing a mixture of tissues than small pixels. The use
FIGURE 5. Transverse PET slice of 6 radioactive spheres with         of large pixels (or thick slices) increases the probability of
different diameters (10, 12, 16, 22, 28, and 34 mm) and filled       mixing tumoral with necrotic or healthy tissues and thereby
with same radioactivity concentrations in uniform radioactive        underestimating the actual metabolic activity of the tumor.
background (left) and corresponding CT slice (right). PVE            For instance, increasing the pixel size by 50% can yield a
makes apparent uptake decrease when sphere size decreases.
                                                                     decrease in the SUV of 7% when the SUV is measured with
                                                                     the maximum pixel value (Fig. 8).
PVE also depends on parameters that can be tuned. The most
important of these parameters is the spatial resolution in the
                                                                     Measurement Method
reconstructed images. Spatial resolution determines how far
                                                                        As mentioned previously, PVE affects tumors with
the signal spreads around its actual location (Fig. 1). High
                                                                     diameters less than 2 or 3 times the resolution (FWHM)
spatial resolution introduces little spread, whereas low spa-
                                                                     of the imaging system (14). This criterion is valid primarily
tial resolution introduces a large amount of spread. There-
                                                                     when tumors with uniform uptake are assessed and when
fore, a given tumor will vary in size, brightness, and SUV
                                                                     tumor uptake is assessed from a small region near the cen-
depending on spatial resolution (10). Spatial resolution is
                                                                     ter of the tumor. Indeed, biases introduced by PVE depend
partly determined by scanner features (e.g., crystal size and
                                                                     on the size of the region used to measure tumor uptake.
arrangement and 2-dimensional [2D] or 3D acquisition mode
                                                                     There is currently no consensus regarding how to define the
(11)), but it also depends on reconstruction parameters (e.g.,
                                                                     region used to quantify tumor uptake. Several different pos-
number of iterations, number of subsets in ordered subset–
                                                                     sibilities are reviewed here, and their respective merits and
type algorithms, filter in filtered backprojection algorithms,
                                                                     drawbacks are discussed.
and postfiltering (12,13)). Therefore, PVE can be partly
                                                                        Maximum Value. The maximum SUV (SUVmax) (or any
controlled through the choice of these parameters: better
                                                                     uptake index) is always obtained for the 1-pixel region of
spatial resolution yields less PVE. Figure 7 illustrates how
                                                                     interest (ROI) corresponding to the maximum pixel value
spatial resolution affects the measured SUV: when too few
                                                                     in the tumor. In the absence of noise, this SUVmax is indeed
iterations are used (as in the left side of Fig. 7), resolution is
                                                                     the least affected by PVE (Fig. 1) and so is often considered
reduced, and the tumor appears less bright. As the number of
                                                                     the best measure of tumor uptake. Unfortunately, SUVmax
iterations increases, resolution improves (right side of Fig. 7),
                                                                     is strongly affected by noise and therefore by the recon-
and the tumor appears brighter (13). Eventually, the recon-
                                                                     struction algorithm (10,12,15), by any smoothing that may
struction routine will have reached its maximum resolution,
                                                                     be performed, and even by the pixel size (the smaller the
and further increases in the number of iterations will increase
                                                                     pixel size, the greater the pixel-to-pixel noise). In any real
noise without further increasing resolution (not shown in Fig.
                                                                     imaging situation, noise is always present, making SUVmax
7). The effects of noise on the measured uptake are discussed
                                                                     highly variable. It usually provides an overestimate of the
further later in this article.
                                                                     true maximum pixel value but can occasionally even under-
   Because of these resolution effects, when sequential
                                                                     estimate it. Therefore, SUVmax depends strongly on noise
measurements of tumor uptake are obtained over the course
                                                                     and, in high-noise situations, can behave in an unpredict-
                                                                     able manner. Consequently, the use of SUVmax for com-
                                                                     paring patient values from one scanner to the next or even
                                                                     for comparing one scan to the next (e.g., before therapy and
                                                                     after therapy) on the same scanner is problematic. Unless
                                                                     the effect of noise can be rigorously accounted for, ob-
                                                                     served changes in SUVmax may be statistical fluctuations
                                                                     rather than true metabolic changes. Use of the maximum
                                                                     pixel value in a tumor to characterize tumor uptake, how-
                                                                     ever, does make the measurement independent of the ob-
FIGURE 6. PET slice (left) and corresponding CT slice (right).       server. This is why, despite its sensitivity to noise, the use
Tumor is close to 3 types of tissues (lung, liver, and medias-       of SUVmax is popular. However, it should be empha-
tinum).                                                              sized that even without noise, a single pixel may not be

                                                                       PARTIAL-VOLUME EFFECT      IN   PET • Soret et al.     935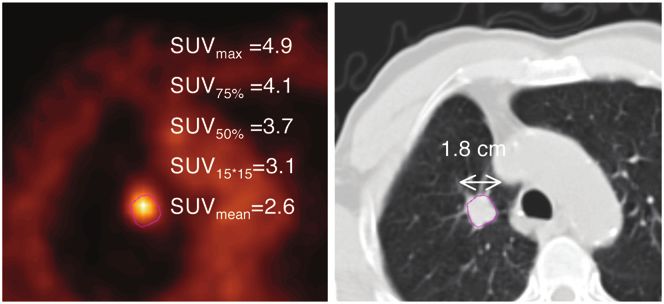
FIGURE 7. Transverse PET slices of same PET data reconstructed with ordered-subset expectation maximization with different
numbers of iterations (8 subsets). SUVmax varies substantially at early iterations.

representative of the overall tumor uptake in a nonhomo-        and will include 65% of the tumor volume. If the maximum
geneous tumor.                                                  pixel value is 112 instead of 100 because of noise, then the
   Mean Value in Manually Drawn Region. For the deter-          isocontour will be set to 84 and will include 37% of the
mination of tumor uptake, a region around the tumor can be      tumor volume. This problem can be addressed by smooth-
manually drawn, and the mean number of counts in that           ing the image aggressively before determining the maxi-
region can be calculated. This approach is a subjective one     mum and then using the resulting isocontour value to draw
prone to observer variability but nevertheless has been used    the region on the original (nonsmoothed) data. Alterna-
in several studies (12,15).                                     tively, the threshold can be based on some other average
   Mean Value in Fixed-Size Region. One simple approach         value within the tumor rather than simply on the maximum.
to avoiding variability in region drawing is to use a region    A second shortcoming of isocontour methods is that if the
of fixed size (e.g., a circle or square), regardless of the     percentage used is too low (for instance, 30%), then the
tumor size. If the placement of the ROI can be automated        resulting region may spread out to inadvertently include a
(for instance, centering the ROI around the center of           significant proportion of the background (12). To bypass
‘‘gravity’’ of the tumor, as determined by counts), then this   this problem, the isocontour value can be based, for
method is insensitive to operator variability. However, the     example, on the difference between the tumor activity
use of a region of fixed size can yield very biased results,    and the background activity (10). Like isocontour methods
depending on the size of the tumor with respect to the size     and with many of the same advantages and limitations, a
of the region. For instance, the mean value from a 15 · 15      3D region-growing algorithm can be used to include in the
mm ROI placed on a 4-cm-diameter tumor yields nearly the        region all contiguous voxels having values above a fixed
true uptake value (assuming a 3-mm pixel size) when             percentage of the maximum pixel value in the tumor.
imaged with a scanner that has a 6.5-mm spatial resolution.        When isocontour or region-growing approaches are used
If the tumor were instead 2 cm in diameter, then the tumor      for therapeutic follow-up, if the true metabolic activity of
uptake would be underestimated by 18% with this same            the tumor decreases, then the isocontour value, expressed as
ROI. Therefore, during therapy, if the tumor shrinks from       a percentage of the maximum pixel value in the tumor, will
4 cm to 2 cm without any change in metabolic activity, then     also decrease. One proposal for addressing this problem is
uptake estimated from this fixed-size region will errone-       to use the isocontour value determined from a pretherapy
ously indicate an 18% decrease in metabolic activity.           study to determine the region for a posttherapy study or
   Mean Value in Region Based on Intensity Threshold.           vice versa.
Another objective method for drawing a region is to use an         A potential advantage of these isocontour or region-
isocontour, defined as a percentage of the maximum pixel        growing methods is that they yield information regarding
value in the tumor (typically between 50% and 80%). A           the metabolically active volume of the tumor, a parameter
drawback of this approach is that the resulting region may      that may be relevant for the monitoring of patients. The
depend on how much noise is present, as the isocontour value    tumor size determined with these approaches is a metabolic
is often based on the maximum pixel value in the tumor.         size, which may disagree with the CT- or MRI-based
For instance, for a 2-cm-diameter tumor seen at a 6.5-mm        morphologic size. When these threshold-based ROI defini-
spatial resolution with an uptake of 100 (arbitrary units), a   tions are used, uptake and metabolic tumor size are not
75% isocontour based on noise-free data will be set to 75       necessarily independent parameters.

FIGURE 8. Transverse PET slices from
same patient with image sampling at 4
and 6 mm, resulting SUVmax, and cor-
responding CT slice.

936     THE JOURNAL    OF   NUCLEAR MEDICINE • Vol. 48 • No. 6 • June 2007
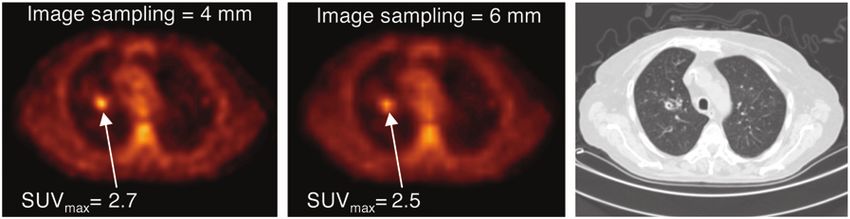
Figure 9 shows how SUVs vary with different region-          work regarding the development of PVE corrections there-
drawing methods. For a 1.8-cm-diameter tumor, the mean          fore has been performed for brain PET. However, no
SUVs within the drawn regions were 47%, 37%, 24%, and           general, widely accepted solution to the PVE problem has
16% lower than the SUVmax when the regions were drawn           yet been found. Therefore, several methods currently under
manually, drawn with a 15 · 15 mm fixed sized, or drawn         investigation for PVE correction are presented here, and
with region growing at 50% and 75% thresholds, respec-          their relevance to tumor imaging is discussed.
tively. Similar trends were reported by Krak et al. (12), who
                                                                Reducing Biases Attributable to PVE
investigated changes in 18F-FDG uptake in breast cancer
                                                                   Precautions can be taken to reduce the biases introduced
patients during chemotherapy. Although various region-
                                                                by PVE in tumor imaging. Obviously, the better the
drawing schemes yielded different absolute results, the
                                                                resolution (e.g., through appropriate reconstruction param-
relative changes in 18F-FDG uptake during chemotherapy
                                                                eters), the smaller the errors caused by PVE but, of course,
showed the same trends regardless of the ROI used. The
                                                                increased resolution often has to be balanced against
largest changes (a decrease of about 55% after 6 courses of
                                                                increased noise. One very important method for enhancing
chemotherapy) were observed with the 15 · 15 mm fixed
                                                                spatial resolution is modeling the detector (or collimator,
region, whereas the smallest changes (a decrease of about
                                                                for SPECT) response into the system matrix used in
35%) were observed with manual drawing. Such variability
                                                                iterative reconstruction (16). Better spatial resolution in
in the magnitude of changes may be problematic for early
                                                                reconstructed images may prevent some structures from
follow-up.
                                                                being affected by PVE and will reduce the biases intro-
   In summary, biases introduced by PVE depend on several
                                                                duced by PVE in others. Pixel size should also be kept
parameters. A relevant meta-analysis of findings reported
                                                                small to reduce the tissue fraction effect.
by different groups regarding tumor uptake and therapy
                                                                   It should be emphasized that the images most appropriate
monitoring would require that all of the parameters that can
                                                                for quantitative measurement may not be the ‘‘best’’ images
be controlled be given. These might include spatial resolu-
                                                                for qualitative assessment (i.e., lesion detection). The use of
tion, spatial sampling in images, the total number of counts
                                                                different images for these 2 purposes may be worth consid-
(or coincidences) achieved, and the region dimensions and
                                                                ering for certain applications, focusing on high-resolution—
placements used to measure tumor metabolic rates or uptake.
                                                                but noisy—images for quantitative measurement while using
Tumor sizes (e.g., from CT or MRI, when available) should
                                                                smoother images for visual interpretation.
also be given to provide a complete representation of what
the influence of PVE might have been. Without a careful         Correction Methods Applied at Regional Level
analysis of these data, meta-analyses are almost meaning-          Some PVE correction methods are applied at a regional
less, given the huge variability (.50%) in estimated uptake     level, meaning that a value (e.g., mean SUV) is measured in a
values that can be introduced by differences in image quality   region of the image, and then some property of that particular
and measurement methods.                                        region is used to modify the value to obtain a PVE-corrected
                                                                value. Such methods do not yield PVE-corrected images but
                                                                rather yield only PVE-corrected regional values. Therefore,
PARTIAL-VOLUME CORRECTION
                                                                these methods may be suitable for the quantification of tumor
  PVE has been identified as a major source of bias in PET      uptake but not for visual analysis. Several such methods are
brain imaging measurements for a long time because of the       described here.
number of intricate, small structures in the brain. Most           Recovery Coefficient (RC). The use of RCs is a very
                                                                simple method for PVE correction. To apply the method,
                                                                one multiplies the measured uptake value in the ROI (here,
                                                                a tumor) by a correction factor called the RC. This RC is
                                                                precalculated for an object whose size and shape are similar
                                                                to those of the structure of interest. This calculation must be
                                                                performed separately for the resolution of each scanner
                                                                (which may differ at different locations in the scanner field
                                                                of view). A necessary assumption is that the volume and
                                                                shape of the metabolically active part of the tumor are
                                                                approximately known. For a spheric tumor, the RC can be
                                                                readily calculated as a function of the sphere size and the
FIGURE 9. Different measurement methods yield different         sphere-to-background contrast for a wide range of spatial
SUVs. SUVmax was calculated from maximum uptake in tumor.       resolution values (6,14) and then used for correction. The
SUV75% and SUV50% were mean values in ROI corresponding         method can also be applied for a tumor that is not spheric.
to isocontours equal to 75% and 50% SUVmax, respectively.
SUV15·15 was measured in fixed rectangular region of 15 · 15    In this situation, the RC can be calculated by convolving a
mm. SUVmean was measured in manually drawn region               binary image of the tumor shape with the known spatial
(represented in red on CT slice [right]).                       resolution. The RC depends not only on tumor volume but

                                                                  PARTIAL-VOLUME EFFECT      IN   PET • Soret et al.      937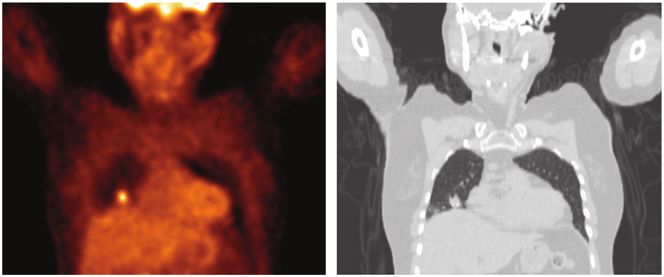
also on image sampling. The RC can be calculated by                structures of interest (called compartments) with the as-
assuming no surrounding activity, and the uptake surround-         sumption that the structures have uniform uptake. The im-
ing the tumor, which has to be estimated to compensate for         age of each compartment as seen by the imaging system is
spilling in, can be accounted for subsequently by use of a         obtained with the knowledge that each compartment will be
simple formula when the RC is applied (17–21).                     blurred by the point spread function of the imaging system.
   As an example, the curves in Figure 10 were determined          The resulting image yields the proportions of signal ema-
by analytically simulating uniform radioactive spheres of          nating from the compartment but detected in each of the
various sizes in a nonradioactive background for different         n – 1 other compartments (Fig. 11). By repeating this step
spatial resolution values. Each curve represents the mean          for each compartment, one can calculate transfer coefficients
activity measured in the true sphere contours divided by the       Wij, corresponding to the fraction of signal emanating from
true activity in the sphere as a function of the sphere size.      compartment i and detected in compartment j. The mea-
For a 1-cm-diameter spheric tumor in a nonradioactive              sured values mj in each compartment of the image to be
background, Figure 10 shows that the RC would be 1/0.27,           subjected to PVE correction can be expressed as a linear
or 3.7, for a 6-mm spatial resolution; therefore, the mea-         combination of the true unknown values vi in each com-
sured activity would have to be multiplied by 3.7 to obtain        partment; the coefficients of this linear combination are the
the PVE-corrected value.                                           transfer coefficients Wij. The PVE-corrected values for
   This approach is extremely simple and is commonly used          each compartment i are obtained by solving the system of
for PVE correction in PET tumor imaging (18,19,22,23).             n equations with n unknowns. The only requirement of this
Usually, tumors are assumed to be spheric, and their diam-         method is the delineation of the functional regions corre-
eters are estimated from CT. Ideally, the contour of the           sponding to the different compartments, which are assumed
metabolically active part of a tumor should be delineated, as      to have uniform uptake. Such delineation is often per-
PVE depends not only on the tumor volume but also on the           formed on anatomic data registered with PET data.
tumor shape. Also, the method assumes that the uptake is              The GTM method can be seen as a generalization of the
uniform throughout the tumor—although a necrotic part              RC method to more than 2 compartments. As with the RC
could be excluded if the tumor is delineated—and the method        method, the transfer coefficients have to be calculated with
usually accounts only for uniform known surrounding activ-         the same spatial sampling as that used for the images to be
ity. If the tumor is close to 2 structures with different uptake   corrected. The transfer coefficients can be calculated either
values, then the use of the RC may be inappropriate (Fig. 6).      by convolving the binary image of each compartment with
   Geometric Transfer Matrix (GTM). Although the RC                the imaging system response function or by projecting and
method accounts only for spillover between 2 structures (the       then reconstructing this binary image (28). The latter
tumor and the surrounding tissues with uniform uptake), the        approach accounts for local variations in the spatial reso-
GTM method can account for spillover among any number              lution in the reconstructed images. However, it does not
of structures. This method was initially proposed in the           account for possible nonlinear effects inherent in iterative
context of brain imaging to correct for the spillover among        reconstruction algorithms. Such effects can be dealt with by
gray matter, white matter, and cerebrospinal fluid (24–27).        use of perturbations during calculation of the transfer
The idea was to use anatomic data to delineate n functional        coefficients (29). This generalization may be useful for

FIGURE 10. Restored activity mea-
sured in actual contour of spheres in
cold background as function of sphere
diameter and spatial resolution of imag-
ing system.

938     THE JOURNAL     OF   NUCLEAR MEDICINE • Vol. 48 • No. 6 • June 2007
a) and added to the current estimate Icorrn21 of the PVE-
                                                                   corrected image to yield a new estimate Icorrn , as follows:

                                                                            Icorrn 5 Icorrn 2 1 1a I 2 Icorrn 2 1 5 F :

                                                                   Deconvolution severely amplifies noise. The authors there-
                                                                   fore proposed not using the PVE-corrected image Icorrn for
                                                                   visual interpretation. Instead, they evaluated the method
                                                                   with only the average pixel value in an ROI placed on this
                                                                   image, the ROI having been previously defined on the
                                                                   uncorrected image I with a region-growing approach (80%
FIGURE 11. Calculation of transfer coefficients for 2 com-
                                                                   threshold).
partments (tumor [t] and background [b]). Image of each binary        In other words, the method first enhances spatial resolu-
compartment as seen by imaging system is obtained by               tion through a deconvolution approach and then estimates
modeling imaging system response. Resulting image is nonbi-        the tumor uptake in a particular region through the use of
nary image from which 4 transfer coefficients can be calculated.   an intensity threshold, although any ROI drawing method
For example, Wtt corresponds to fraction of signal emanating
from tumor and detected in tumor, whereas Wtb corresponds to
                                                                   can be used.
fraction of signal emanating from tumor and detected in               The main advantage of this approach, compared with the
background.                                                        RC or GTM approach, is that it does not require any
                                                                   assumption regarding tumor size, tumor boundary, tumor
                                                                   homogeneity, or background activity. It does, however,
                                                                   require that the local spatial resolution be known to within
reconstruction methods involving corrections that introduce        ;1 mm. This approach does not seem to be appropriate for
strong nonlinear effects, such as detector response com-           recovering uptake values in tumors with diameters less than
pensation.                                                         1.5 times the FWHM in reconstructed images. For tumors
   The GTM method has been successfully applied in PET             with diameters more than 1.5 times the FWHM, uptake
brain imaging, resulting in biases of less than 10% in the         values were recovered more accurately than if the maxi-
estimation of striatal uptake (25,28). Its applicability to        mum or mean value had been determined from uncorrected
tumor imaging is severely restricted by the required delin-        images.
eation process, which can be very challenging (Fig. 12),
and by the assumption of a piecewise constant activity             Correction Methods Applied at Pixel Level
distribution. It may still be worth investigating the use of          The methods previously described allow partial-volume
the GTM method for local correction when a tumor is close          correction to be applied to the uptake value within a tumor
to more than one compartment (for instance, a lung tumor           or other region. A greater challenge exists in producing
close to the liver). In that specific circumstance (Fig. 6), it    PVE-corrected images that have low enough noise to be
may yield more accurate results than the RC method.                interpreted on a pixel-by-pixel basis. All methods in this
   Deconvolution. Deconvolution is often used for image            category rely on the joint use of anatomic and PET images.
restoration, that is, to recover spatial resolution. As PVE is        Partition-Based Correction. This method, proposed for
partly caused by finite spatial resolution, deconvolution has      brain imaging, assumes that the true activity distribution
been suggested to estimate the spillover effect caused by          can be segmented into a series of n nonoverlapping com-
the point spread function. One approach used an iterative          partments with a known uniform uptake (as in the GTM
deconvolution technique (30): at each iteration n, given a         method)—except for one compartment (the compartment
local model of the point spread function (F), the image that       of interest) (31–34). The compartment contours are defined
would be obtained if the true image was Icorrn21 is calcu-         from MR images perfectly registered with PET images.
lated (Icorrn21 5 F) and compared with the image I that was        Given the contours and the uptake of all compartments
actually acquired. The difference is weighted (by the factor       except for one, the PET image that would be obtained if

                                                                                        FIGURE 12. CT image (left), corre-
                                                                                        sponding PET image (middle), and PET/
                                                                                        CT image (right) of tumor with no uptake
                                                                                        in center. Delineation of tumor from CT
                                                                                        image would yield inappropriate defini-
                                                                                        tion of metabolically active part of tumor.

                                                                     PARTIAL-VOLUME EFFECT      IN   PET • Soret et al.       939
only these compartments were present can be modeled by image. If a structure appearing as a hyperintense signal in first convolving the image of each compartment scaled to the PET image corresponds to a hypointense signal in the its uptake value by the point spread function of the imaging high-resolution image, this structure will be wrongly cor- system and then summing the resulting images. This image rected in the PVE-corrected image, but other structures will is subtracted from the actual image, yielding an estimate of be properly corrected. the activity distribution in the compartment with unknown The assumption of a positive correlation between the activity. Given the contours of this latter compartment and gray levels in the anatomic and PET images is obviously the point spread function of the imaging system, the actual unrealistic in whole-body imaging but may be reasonable activity distribution in this compartment of interest can be for analysis of small regions within a whole-body image. A recovered pixel by pixel. The advantage of this approach is weakness of the method is that it is a 2D approach, because that it yields a PVE-corrected image of the compartment of of the 2D nature of the wavelet transform, and therefore is interest, which could be useful in investigating variations in applied slice by slice, whereas PVE is a 3D phenomenon. uptake within a tumor. However, when one attempts to Further investigation of this recently described method is adapt the method to tumor imaging, as opposed to brain required to determine its applicability to tumor imaging. imaging, the underlying assumptions seem unrealistic, Fitting Method. In this method, one assumes that a tumor unless one restricts the analysis to a small region around can be considered as a sphere with an unknown diameter the tumor. Even in this situation, one must still assume that and with uniform uptake and that the background level is the uptake of all compartments surrounding the tumor is uniform. The observed image then can be modeled as the known and that the tumor contours can be delineated. A result of the convolution of this sphere with the point spread variant of this method has been described to account for a function characterizing the local spatial resolution in the nonstationary (i.e., variable throughout the image) point image (38). The unknown parameters of the model (sphere spread response function (35). location, sphere size, sphere uptake, and background up- Another generalization of this method (36) does not take) then can be estimated by minimizing an objective require any assumption regarding the uptake in any of the n function characterizing the quality of the fit and penalizing compartments and also accounts separately for the tissue unrealistic solutions. Similar fitting approaches were pre- fraction effect and the point spread function effect. Through viously proposed and used in brain PET for striatal uptake convolving of the nonbinary image of each compartment, the measurements (39). The applicability of this approach to spilling in and spilling out are modeled as in the GTM tumor imaging is limited by the assumptions needed re- method, but on a pixel-by-pixel basis. One then must deter- garding tumor shape and background (note that the method mine the activity distribution consistent with the values for is not appropriate if the tumor is close to 2 structures with spilling in and spilling out given the observed pixel value. This different activity levels). The advantages of this approach determination is typically made with a least squares method. are that a possible dependence of the local point spread Multiresolution Approach. A second method (37) yield- function on the structure of interest (40) could be accounted ing PVE-corrected images assumes that a high-resolution for and that no anatomic data are required. image (from CT or MRI) perfectly registered with a PET Modeling PVE During Reconstruction. All of the (or SPECT) image is available. The gray levels in the high- methods previously mentioned can be applied to images that resolution image must be positively correlated with those of have already been reconstructed. Several methods (many the functional image to be corrected for PVE. No segmen- developed for brain PET) compensate for PVE during the tation of the high-resolution image is needed, a feature that reconstruction process (41). One such method uses a so- is an advantage of this method over the partition-based called ‘‘maximum a posteriori’’ approach, which incorpo- correction method. The multiresolution method also as- rates previously determined anatomic information into the sumes that the spatial resolution in reconstructed images is reconstruction process. Anatomic images (from MRI), which stationary (i.e., identical throughout the images). The de- are assumed to be perfectly registered with PET images, are tails of this method were described by Boussion et al. (37) used to derive a model of tissue composition (and hence to but are summarized here. compensate for the tissue fraction effect). Additional as- With the assumptions previously mentioned, details of the sumptions regarding the uptake distribution in some com- high-resolution image are extracted, transformed, and in- partments are needed. The hypotheses are similar to those corporated in the low-resolution PET image. Discrete wavelet of the partition-based correction method already described. transforms of both the high-resolution and the low-resolution The major difference is that the partition-based correction images are performed to identify a level of spatial resolu- method is applied after reconstruction, without the use of an tion common to both types of images. Details at the level of explicit noise model, unlike the approach of Baete et al. (41), resolution present in the high-resolution image are then which compensates for PVE during reconstruction. With the incorporated into the low-resolution image on the basis of latter approach, noise suppression can be restricted to spe- the assumed correlation between the gray levels in the 2 cific compartments with anatomically based smoothing. In types of images. A structure that is not visible in the high- other words, if a pixel contains a mixture of activities from resolution image remains unchanged in the PVE-corrected gray matter and white matter, smoothing can be applied to 940 THE JOURNAL OF NUCLEAR MEDICINE • Vol. 48 • No. 6 • June 2007
gray matter activity only. Smoothing during reconstruction       ing the advantage of not requiring high-resolution anatomic
therefore does not increase spillover. In addition, anatomical   information. The accuracy and the robustness of these
priors can be used to preserve strong edges between com-         methods need further study. Another major step that would
partments. The method is very appealing from a theoretic         enhance the value of PET for therapeutic follow-up would be
point of view, but deriving a tissue fraction model in tumor     the availability of PVE-corrected images rather than simply
imaging is much more challenging than it is in brain imaging.    PVE-corrected uptake values. Such images would facilitate
The applicability of the method to tumor imaging thus re-        the detection of nonuniform tracer uptake within a tumor and
mains to be demonstrated. Obviously, because it modifies the     possibly tumor tissue resistant to therapy. Some methods,
reconstruction process, the method cannot be applied retro-      such as the multiresolution approach or the partition-based
spectively (unless sinograms have been stored).                  correction approach and its variants, already offer this capa-
   Kinetic Modeling. PVE correction can also be incorpo-         bility. The reliability of these methods for properly restoring
rated into some kinetic models. This approach has been used      uptake inhomogeneity at the pixel level must still be dem-
in brain and cardiac imaging (42–45). The idea is to include     onstrated. Including PVE correction within the kinetic mod-
in the kinetic model parameters that describe the tissue         eling step is also an elegant approach that may be preferable
fraction effect and to fit these parameters in addition to the   to correcting PVE first and then performing a kinetic anal-
physiologic parameters of the model. The model thus in-          ysis. The latter approach can indeed suffer from poor local
cludes more parameters to be estimated than when PVE is          variance estimates in PVE-corrected images (49). From a
ignored, but spillover and tissue fraction effects are ac-       practical point of view, however, this approach would require
counted for during the fit. This approach is obviously           that dynamic PET scans be the rule and not the exception.
restricted to the analysis of time series and has been used
primarily for tumor blood flow analysis (46,47). The ap-         PRACTICAL IMPACT OF PARTIAL-VOLUME
proach is appealing because it uses the constraints brought by   CORRECTION
the kinetic model to determine the magnitude of PVE. The            The impact of PVE correction has been only recently
availability of different time frames also introduces some       studied in PET tumor imaging. Results so far confirm, as
redundant information regarding the tissue fraction and          expected, that accounting for PVE can be crucial. For
spillover effects (which are invariant in time) and therefore    instance, the correlation between 18F-FDG uptake assessed
facilitates a robust estimation of tissue fraction parameters.   by SUVmax and sphere size observed in non–small cell lung
The feasibility of extending this method to the models used      cancer (NSCLC) tumors disappeared after PVE correction
for assessing the glucose metabolic rate from dynamic 18F-       (7). This effect occurred because this relationship was attrib-
FDG PET scans has yet to be studied.                             utable mostly to the tissue fraction, which makes apparent
   Table 1 summarizes the different approaches that have         activity depend on tumor size (Fig. 5). More puzzling, the
been proposed for PVE correction.                                correlation between primary NSCLC tumor stage and 18F-
   Which PVE Correction Should Be Considered? In choos-          FDG uptake measured with SUVmax also disappeared after
ing among the various PVE correction methods previously de-      PVE correction (50). This result could suggest that 18F-FDG
scribed, one may have to strike a balance between improved       uptake may be prognostic of NSCLC outcome only through
absolute measurement and potentially increased variability.      size dependence (i.e., larger non–PVE-corrected tumors had
The results described so far suggest that even applying a        higher 18F-FDG recovery). This hypothesis is consistent with
method as simple as the RC method can greatly reduce             the observation that for tumors larger than 2.8 cm, which
the bias in uptake estimates with little or no increase in       are thus weakly or not at all affected by PVE, there was no
variability. The RC method has the advantages of being           association between tumor stage and 18F-FDG uptake (50).
applicable retrospectively and of not requiring registered          PVE correction can also reveal relationships that remain
anatomic information. More sophisticated methods involv-         hidden without correction. For instance, a higher 18F-FDG
ing more compartments, such as the GTM method, may be            uptake was found in high-grade non-Hodgkin’s lymphoma
more accurate for tumors close to several compartments           than in low-grade non-Hodgkin’s lymphoma only after
with different uptake values, but this hypothesis remains to     PVE correction (51). Several studies have shown that
be proven. Furthermore, methods requiring the delineation        benign and malignant lesions, such as small tumors (,2
of functional regions on the basis of anatomic images (CT        cm in diameter), breast tumors (17,18), and lung nodules
or MRI) are prone to 2 types of errors that will directly        (23), were better distinguished with PVE correction than
affect the accuracy of the correction: first, misalignment       without.
between anatomic and functional images (48), and second,            Finally, in small-animal tumor imaging, it has been
potential differences between the anatomic contours of the       clearly shown that PVE correction is essential for making
tumor and the contours of the metabolically active part of       the radionuclide concentrations measured with PET agree
the tumor (5).                                                   with the radioactivity concentrations obtained by g-counting
   A major step toward practical PVE correction would be         (52).
achieved if tumor delineation were not needed, as in the            The impact of PVE correction has been recently studied in
deconvolution or multiresolution approach, the former hav-       the context of therapeutic follow-up. During a study of

                                                                   PARTIAL-VOLUME EFFECT      IN   PET • Soret et al.      941
942
TABLE 1
THE JOURNAL
Summary of Main Properties of 8 PVE Correction Approaches*
OF
Anatomic
maximum
Property RC GTM Deconvolution Partition based Multiresolution Fitting a posteriori Kinetic modeling
Assumes tumor No No No No No Yes No No
is spheric?
Assumes known Yes Yes No Yes No Yes Yes No
tumor volume?
Assumes uniform Yes Yes Not Yes No Yes No No
tumor uptake? necessarily
Assumption(s) Locally uniform, Piecewise No Piecewise Gray levels Locally uniform, Partially No
regarding tissues known uptake constant, constant, correlated with unknown uptake known
surrounding tumor unknown uptake known uptake those of
anatomic data
Needs Not necessarily Yes, registered No Yes, registered Yes, registered No Yes Not necessarily
anatomic data?
Mode of action After After After After After After During After reconstruction,
reconstruction reconstruction reconstruction reconstruction reconstruction reconstruction reconstruction time series
required
Type of results Tumor uptake value Tumor average Tumor average Image of PVE-corrected Tumor average PVE-corrected Kinetic parameters
uptake value uptake value tumor image uptake value image compensated for
NUCLEAR MEDICINE • Vol. 48 • No. 6 • June 2007
compartment PVE
Reference(s) for 7,17,18,22,23,50,51,53,54 30 37 38 47,50
PET tumor imaging
*Desirable properties are shown in bold type.changes in blood flow and metabolism for breast cancer in a model with 4 compartments manually delineated on
patients treated with chemotherapy, PVE correction reduced CT by use of a convolution model to calculate the 16 trans-
the changes observed after therapy (53). This result is fer coefficients. The partition-based method was applied
consistent with the fact that for patients who respond to with the same 4 compartments as those used for the GTM
therapy, the decline in metabolic activity is often accompa- method, assuming that only tumor uptake was unknown.
nied by shrinking of the tumor. This reduction in tumor size Finally, the deconvolution approach was applied, consid-
makes the apparent decrease in metabolic activity greater ering an 80% threshold for SUV measurement in the
than it really is unless PVE is compensated for. A comple- deconvolved image.
mentary study by the same group confirmed that PVE PVE-corrected mean SUVs averaged within the tumor
correction reduces the correlation seen between blood flow contours were 11.1, 11, and 10.8 for the RC, GTM, and
measurements and kinetic parameters characterizing 18F- partition-based methods, respectively, and the SUV was 12
FDG metabolism, although significant correlations remain with the deconvolution approach. When applying the RC
even after PVE correction (54). method by considering the RC for a spheric tumor with the
All of the results just mentioned were obtained with the same volume as the volume determined from CT, the
RC method for PVE correction. To the best of our knowl- resulting SUV was 9.2. These results confirm that non-
edge, other PVE correction methods have not yet been corrected SUVs can vary significantly, depending on how
applied clinically in PET tumor imaging. they are calculated, by as much as ;100% (5.7 vs. 11.2).
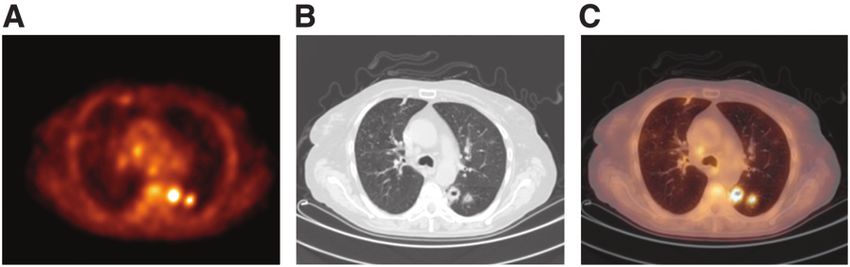
As an example, we applied 4 PVE correction methods Although the true SUV cannot be known in a patient, it is
and calculated the resulting SUV for a lung tumor (Fig. 13) interesting to note that PVE-corrected data are much more
measured with a PET scanner having a reconstructed consistent, with only a small dependence on the method
spatial resolution of 6.5 mm. Four compartments, namely, used for correction (resulting in SUVs of 9.2–12). Interest-
the tumor, lungs, soft tissues, and ‘‘heart,’’ were manually ingly, for this example, the SUVmax (i.e., without PVE
delineated on the CT. The tumor volume, as estimated with correction but with minimization of PVE) was close to the
manual delineation of the tumor on CT, was 6,539 mm3 (a PVE-corrected values—a not entirely unexpected result
sphere with an equivalent volume would have a 23-mm given the relatively large tumor size. Comprehensive stud-
diameter). Without PVE correction, SUVmax was 11.2, and ies are needed to examine how the way in which SUVs are
mean SUV calculated within the contours of the tumors as measured can affect the results and how the various PVE
manually delineated on CT was 5.7. The RC was calculated correction methods influence the measured SUVs.
given that the tumor contours were manually delineated on
CT and assuming that the background was the lung com-
partment (only 1 background compartment can be consid- DISCUSSION
ered with the RC approach). The GTM method was applied PVE can have a major effect on the measurement of
tumor uptake with PET. PVE can produce a large bias in
measured uptake and depends in a complicated fashion on
several parameters. These parameters may vary from pa-
tient to patient and from one scan to the next in the same
patient. The effect is well understood, but the best way to
deal with it has yet to be determined, especially for mea-
surement of tumor uptake in the context of evaluating the
change in uptake with therapy.
Possibly more deleterious than the bias that PVE intro-
duces is the variability in apparent uptake that PVE can
cause. PVE can cause the measured value of tumor uptake to
vary greatly, depending on the tumor characteristics (e.g., its
size and shape), on the tomograph (e.g., spatial resolution),
on the processing (e.g., reconstruction), and on the measure-
ment procedure. Because of this high variability, meta-
analyses of published results are almost impossible, and
prospective clinical trials are fraught with difficulty. Two
strategies could be used to improve this situation. First,
details regarding tumor size, spatial resolution in the recon-
structed images, and measurement methods should system-
atically be reported. Second, standardized procedures could
FIGURE 13. CT (A and C) and PET (B and D) images be introduced for acquisition, for reconstruction, or for
corresponding to 2 slices through lung tumor. Compartment processing (or preferably all 3). Standardization of acquisi-
contours as drawn from CT are shown in red on PET images. tion and reconstruction protocols would at least permit more
PARTIAL-VOLUME EFFECT IN PET • Soret et al. 943reliable comparisons to be made between scans performed the 18F-FDG modeling process, however, such kinetic
with a particular scanner. This standardization would still analyses will continue to be subject to the same PVE as
result in intermachine differences, however. For cross-scanner SUV. This is why PVE is likely to remain a source of error
comparisons, all acquisitions and reconstructions could regardless of the physiologic parameter used to characterize
be adjusted to achieve similar resolution, noise, and pixel tumor 18F-FDG metabolism.
sampling. Some systematic computational schemes for ROI
determinations and uptake measurements could be adopted,
CONCLUSION
although results will still depend on the image characteristics
(e.g., spatial resolution, noise, and sampling). It may not be PVE is a major confounding factor in PET tumor
possible to find a single standardized protocol that is optimal imaging that cannot be ignored. Multiple approaches are
under all conditions. However, such a standardized protocol under development to deal with it and better control its
might well be better than a plethora of more optimal proce- effects, especially in the context of therapeutic follow-up.
dures. The former might allow more accurate within-scanner Simple—although not ideal—correction methods are al-
and across-scanner comparisons to be made than the latter. A ready applicable to substantially reduce the biases intro-
standardized phantom could also be scanned to at least duced by PVE. Until a widely accepted method is routinely
precisely characterize the PVE for a given acquisition and available, great care must be taken to standardize acquisi-
processing protocol, so that such characterization could be tion, processing, and analysis.
subsequently used when one is pooling results from different
studies. Standardization will require much work and coop-
eration but seems essential in order to untangle the compli- ACKNOWLEDGMENT
cated relationship between measured tumor uptake and The authors thank Kevin Teo for testing his deconvolu-
tumor physiology. This approach would seem to be the only tion method (30) on our data.
way to make reliable tumor imaging and therapeutic follow-
up a reality. If such standardization is not achieved, many of
the potential benefits of PET may not be realized. REFERENCES
This review has focused on errors in quantification 1. Weber WA. Use of PET for monitoring cancer therapy and for predicting
caused by tissue fraction and limited spatial resolution. How- outcome. J Nucl Med. 2005;46:983–995.
2. Shankar LK, Hoffman JM, Bacharach S, et al. Consensus recommendations for
ever, other errors can also occur in making measurements the use of 18F-FDG PET as an indicator of therapeutic response in patients in
of tumor uptake. One of the most important of these is National Cancer Institute trials. J Nucl Med. 2006;47:1059–1066.
caused by motion—either inadvertent motion by the patient 3. Weber WA, Ziegler SI, Thodtmann R, Hanauske AR, Schwaiger M.
Reproductibility of metabolic measurements in malignant tumors using FDG
or physiologic motion—for example, the motion caused by PET. J Nucl Med. 1999;40:1771–1777.
respiration or even the motion caused by cardiac contrac- 4. Moses W, Derenzo S. Empirical observation of resolution degradation in
tion. These latter types of motion can often be thought of as positron emission tomographs utilizing block detectors [abstract]. J Nucl Med.
1993;34(suppl):101P.
producing ‘‘blurring’’ in the resultant image and so, from 5. Soret M, Riddell C, Hapdey S, Buvat I. Biases affecting the measurements of
that point of view, yield PVE similar to those produced by tumor-to-background activity ratio in PET. IEEE Trans Nucl Sci. 2002;49:2112–
an imperfect scanner resolution or reconstruction algo- 2118.
6. Hoffman EJ, Huang SC, Phelps ME. Quantitation in positron emission computed
rithm. Motion can also introduce large biases in tumor up- tomography, 1: effect of object size. J Comput Assist Tomogr. 1979;3:299–308.
take estimates (55). The effort expended in attempting to 7. Vesselle H, Schmidt RA, Pugsley JM, et al. Lung cancer proliferation correlates
correct partial-volume errors must therefore be balanced with [F-18]fluorodeoxyglucose uptake by positron emission tomography. Clin
Cancer Res. 2000;6:3837–3844.
against the magnitude of the other errors that might also be 8. Hallett WA, Marsden PK, Cronin BF, O’Doherty MJ. Effects of corrections for
present in the images. blood pool glucose and body size on [18F]FDG PET standardised uptake values
SUV is currently widely used to characterize 18F-FDG in lung cancer. Eur J Nucl Med. 2001;28:919–922.
9. Dewaraja YK, Ljungberg M, Koral K. Monte Carlo evaluation of object shape
uptake. However, it remains only an approximate indicator effects in iodine-131 SPET tumor activity quantification. Eur J Nucl Med.
of the glucose metabolic rate, and it is not clear that it will 2001;28:900–906.
ultimately prove to be the optimum clinical measure of 10. Boellaard R, Krak NC, Hoekstra OS, Lammertsma AA. Effects of noise, image
resolution, and ROI definition on the accuracy of standard uptake values: a
tumor glucose metabolism. As is well known, the validity simulation study. J Nucl Med. 2004;45:1519–1527.
of SUV is limited by its dependence on the time at which 11. Raylman RR, Kison PV, Wahl RL. Capabilities of two- and three-dimensional
imaging is performed, by possible changes in the input FDG-PET for detecting small lesions and lymph nodes in the upper torso: a
dynamic phantom study. Eur J Nucl Med. 1999;26:39–45.
function (i.e., by changes in the dose available to the 12. Krak N, Boellaard R, Hoekstra OS, Twisk JWR, Hoekstra CJ, Lammertsma AA.
tumor), and by the potential presence of residual blood Effects of ROI definition and reconstruction method on quantitative outcome and
activity and nonmetabolized 18F-FDG (56,57). It is possible applicability in a response monitoring trial. Eur J Nucl Med Mol Imaging.
2005;32:294–301.
that some clinically feasible method will be developed to 13. Jaskowiak CJ, Bianco JA, Perlman SB, Fine JP. Influence of reconstruction
permit more accurate measures of metabolic rate (e.g., full iterations on 18F-FDG PET/CT standardized uptake values. J Nucl Med. 2005;
kinetic modeling or Patlak analysis). Some attempts to 46:424–428.
14. Kessler RM, Ellis JR, Eden M. Analysis of emission tomographic scan data:
adopt kinetic analysis for routine clinical use have already limitations imposed by resolution and background. J Comput Assist Tomogr.
been made (56,58–60). Until PVE can be incorporated into 1984;8:514–522.
944 THE JOURNAL OF NUCLEAR MEDICINE • Vol. 48 • No. 6 • June 2007You can also read