NASA Platforms/Instruments for Agricultural Applications
←
→
Page content transcription
If your browser does not render page correctly, please read the page content below
National Aeronautics and Space Administration

                  NASA Platforms/Instruments for
                    Agricultural Applications
           Compiled by Sean McCartney, NASA Applied Remote Sensing Program (ARSET)

       Earth observations (EO) from aerial and satellite-based platforms provide objective,
       timely, consistent, system-wise, and global data products to monitor Earth’s resources
       across space and time. Since the launch of NASA’s first Landsat mission (originally
       named ERTS) in 1972, satellite imagery has been used for global agricultural
       monitoring, providing one of the longest operational applications for the Landsat
       program (Leslie et al., 2017). Below are many of the NASA platforms and instruments
       which contribute to food security and agriculture, with details provided for each
       instrument.

                                                                                                1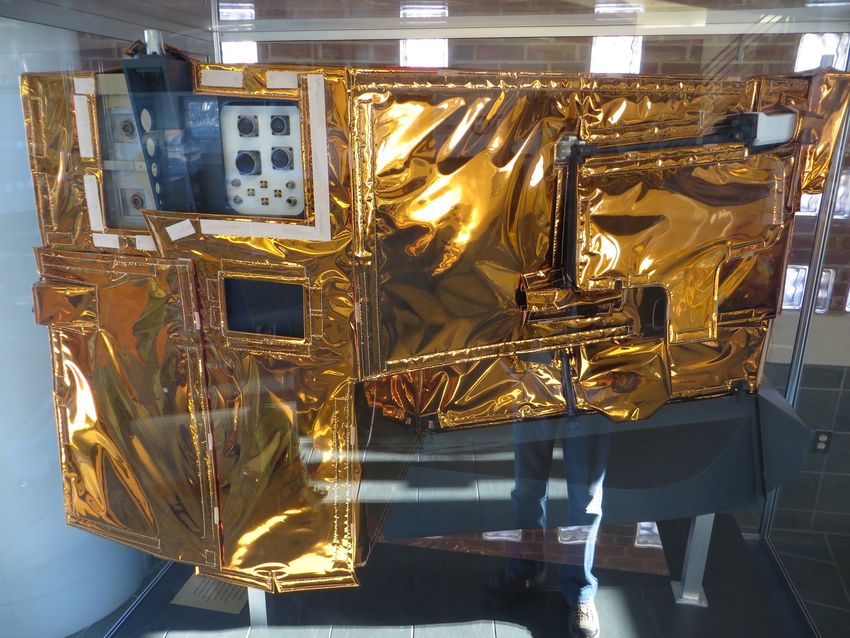
National Aeronautics and Space Administration

                NASA/USG Platforms & Instruments with Agricultural Applications
              Platform                          Instrument    Agricultural Data
                                                              Crop Type, Crop Health,
              Twin Otter International's
                                                              Chlorophyll, Nitrogen, Leaf Water,
              DHC-6, Scaled Composites'         AVIRIS &
                                                              Soil Composition, Soil Salinity, Soil
              Proteus, NASA's ER-2,             AVIRIS-NG
                                                              Carbon, Non-Photosynthetic
              NASA's WB-57
                                                              Constituents
              Aerial (Independent                             “Leaf On” Aerial Imagery during the
                                                NAIP
              contractors)                                    peak growing season
                                                              Surface Reflectance, Soil Moisture,
                                                AMSR-E,       Vegetation Indices, Leaf Area Index,
              Aqua
                                                MODIS         Evapotranspiration, Albedo, Fire,
                                                              Land Surface Temperature
                                                              Impact of surface ozone air
              Aura                              OMI
                                                              pollution on crops
                                                PHyTIR
                                                (Prototype
                                                              Temperature and stress response of
                                                HyspIRI
              ECOSTRESS                                       vegetation, Evapotranspiration (ET),
                                                Thermal
                                                              Evaporative Stress Index (ESI)
                                                Infrared
                                                Radiometer)
              GPM                               GMI, DPR      Rainfall Detection/Precipitation
                                                Microwave
                                                              Runoff and ground water storage on
              GRACE FO                          Ranging
                                                              land masses
                                                System
                                                              Surface Reflectance, Vegetation
              JPSS-1 (NOAA-20)                  VIIRS         Indices, Albedo, Fire, Land Surface
                                                              Temperature
              Landsat 1,2,3                     MSS           Global Agricultural Monitoring
                                                              Surface Reflectance, Crop
              Landsat 4,5                       MSS, TM       Condition, Vegetation Indices, Land
                                                              Surface Temperature
                                                              Surface Reflectance, Crop
              Landsat 7                         ETM+          Condition, Vegetation Indices, Fire,
                                                              Land Surface Temperature
                                                              Surface Reflectance, Crop
              Landsat 8                         OLI, TIRS     Condition, Vegetation Indices, Fire,
                                                              Land Surface Temperature
              POES                              AVHRR         Crop Condition, Vegetation Indices
                                                L-band
              SMAP                                            Soil Moisture
                                                radiometer

                                                                                                      2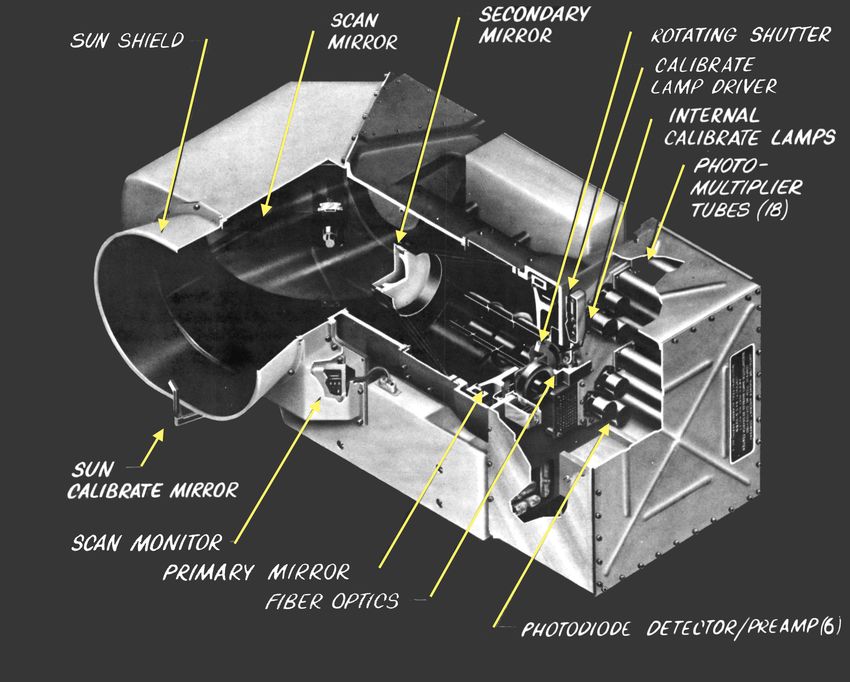
National Aeronautics and Space Administration

              Space Shuttle Endeavour           SRTM            Topography (Elevation)
                                                                Surface Reflectance, Vegetation
              Suomi-NPP                         VIIRS           Indices, Albedo, Fire, Land Surface
                                                                Temperature
                                                                Surface Reflectance, Vegetation
                                                                Indices, Leaf Area Index,
              Terra                             MODIS, ASTER
                                                                Evapotranspiration, Albedo, Fire,
                                                                Land Surface Temperature
              TRMM                              TMI, PR         Rainfall Detection/Precipitation

                          Future NASA Missions with Agricultural Applications
              Platform                          Instrument                 Agricultural Data
              SES-Government Solutions                                     Solar-Induced
                                                GeoCarb
              communications satellite                                     Fluorescence (SIF)
                                                                           Crop Condition,
              Landsat 9                         OLI-2, TIRS-2              Vegetation Indices, Land
                                                                           Surface Temperature
                                                L-band synthetic
                                                                           Hazards and Global
              NISAR                             aperture radar (SAR), S-
                                                                           Environmental Change
                                                band SAR
                                                Ka-band Radar              Reservoir and Lake
              SWOT
                                                Interferometer             Surface Water Heights

                                                                                                      3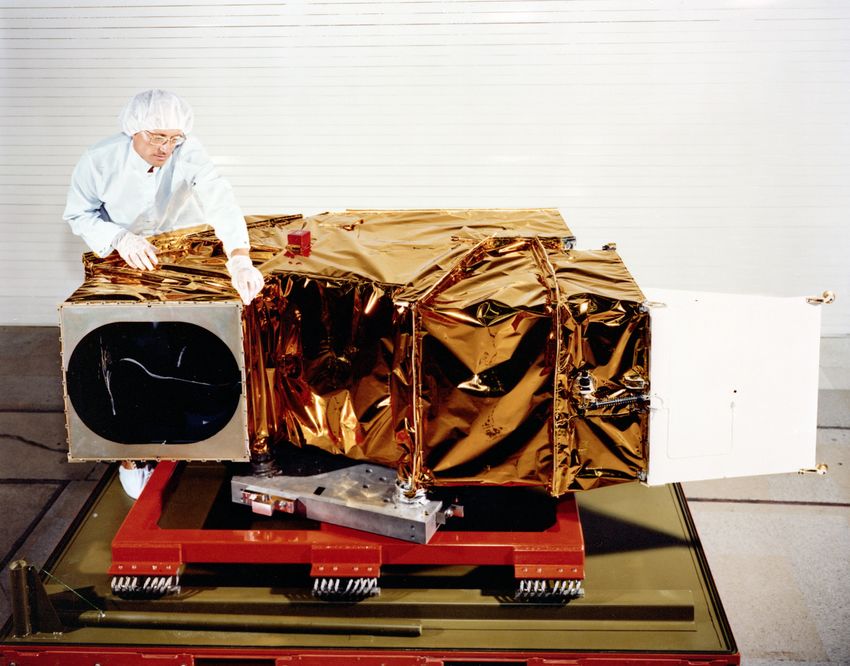
National Aeronautics and Space Administration

       Airborne Visible InfraRed Imaging Spectrometer (AVIRIS) &
       Airborne Visible-Infrared Imaging Spectrometer - Next Generation
       (AVIRIS-NG)
                                         Photo Credit: NASA

       AVIRIS is an imaging spectrometer instrument
       developed at NASA’s Jet Propulsion
       Laboratory (JPL) and flown on an aerial
       platform. Its optical sensor delivers calibrated
       images in 224 contiguous spectral channels
       (bands) with wavelengths from 400 to 2500
       nanometers. It uses a scanning mirror ("whisk
       broom") and four spectrometers to image
       simultaneously in all 224 bands. AVIRIS
       produces 677 pixels for the 224 detectors on
       each scan. The pixel size and swath width of
       the AVIRIS data depend on the altitude from
       which the data is collected. When collected by
       the ER-2 (20 km above the ground) each pixel
       produced by the instrument covers an area
       approximately 20 m in diameter on the
       ground, with some overlap between the pixels,
       thus yielding a ground swath of about 11 km
       wide. When collected by the Twin Otter (4 km above the ground), each ground pixel is 4
       m square, and the swath is roughly 2 km wide. The AVIRIS sensor collects data that
       can be applied to studies in the fields of oceanography, snow hydrology, geology,
       limnology, volcanology, soil and land management, atmospheric and aerosol studies,
       and agriculture (NASA, 2016).

       AVIRIS-NG has been developed at JPL to provide continued imaging spectroscopy
       measurements in the optical range. AVIRIS-NG is expected to replace the AVIRIS-
       Classic instrument that has been flying since the 1980s. The instrument measures
       wavelengths from 380 nm to 2510 nm with 5 nm sampling. Spectra are measured as
       images with 600 cross-track elements and spatial sampling from 0.3 m to 4.0 m from a
       Twin Otter platform. In the near future, a high-altitude platform (NASA's ER-2) will be
       available. AVIRIS-NG has better than 95% cross-track spectral uniformity and >= 95%
       spectral IFOV uniformity (NASA, 2016).

       AVIRIS in the NASA Community
          • The AVIRIS Next Generation team is transitioning to replace the AVIRIS-Classic
             instrument that has been flying since the 1980s.
          • AVIRIS data products can be obtained from two separate portals (AVIRIS-
             Classic & AVIRIS-NG), depending on the instrument.

                                                                                                 4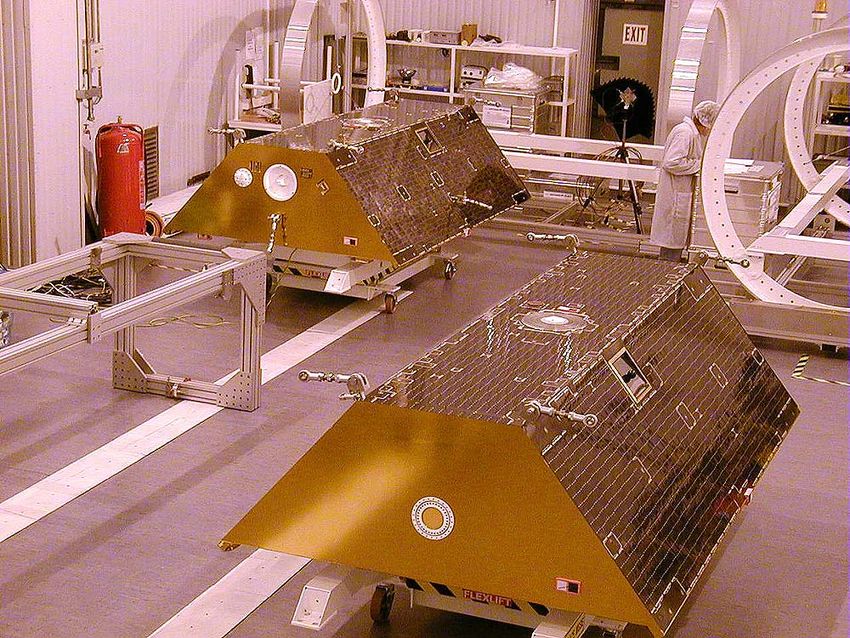
National Aeronautics and Space Administration

       Data
          • Science and agricultural applications include:
               o Crop Type
               o Crop Health
               o Chlorophyll
               o Soil Composition
               o Soil Salinity
               o Soil Carbon

     Band                         Spectral Range (µm)    Resolution (m)        Real-Time Data
     Visible                      0.400 - 0.750          4/20                  N/A
     Near infrared                0.750 - 1.40           4/20                  N/A
     Shortwave Infrared           1.40 - 2.50            4/20                  N/A

       Relevant Publications and Citations

       Green, Robert O, et al. Imaging Spectroscopy and the Airborne Visible/Infrared Imaging
       Spectrometer (AVIRIS). Remote Sensing of Environment, vol. 65, no. 3, 1998, pp.
       227–248., doi:10.1016/s0034-4257(98)00064-9.

       Thompson, David R., et al. A Large Airborne Survey of Earth’s Visible-Infrared Spectral
       Dimensionality. Optics Express, Optical Society of America, 11 Apr. 2017,
       www.osapublishing.org/oe/abstract.cfm?uri=oe-25-8-9186.

       Thompson, David R., et al. Atmospheric Correction with the Bayesian Empirical Line.
       Optics Express, vol. 24, no. 3, 2016, p. 2134., doi:10.1364/oe.24.002134.

                                                                                             5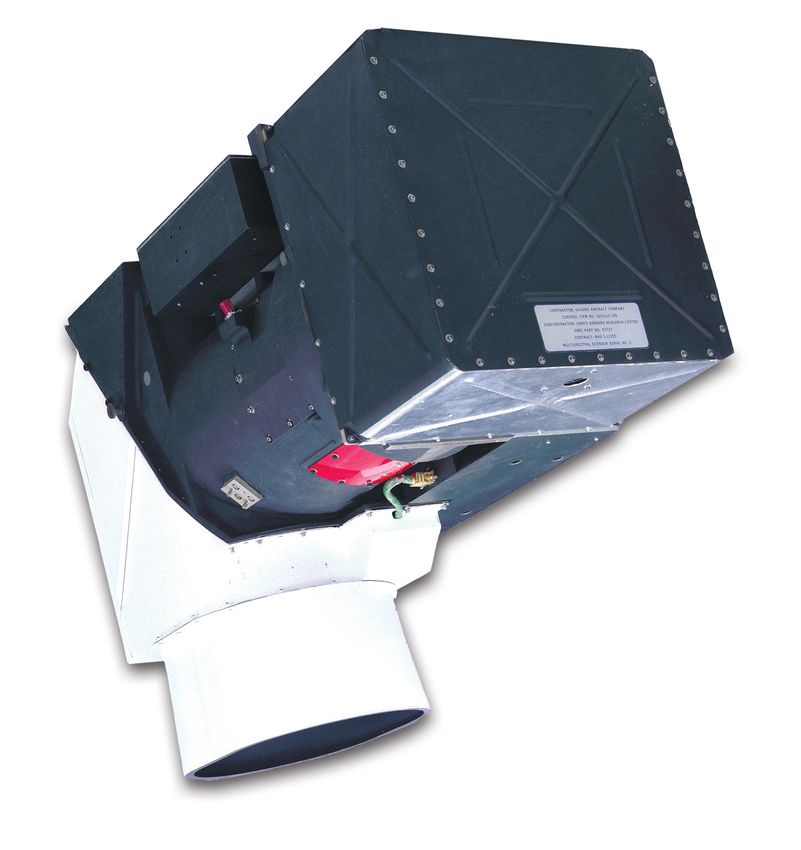
National Aeronautics and Space Administration

       National Agriculture Imagery Program (NAIP)
                                                Image provided by NAIP

                                         The National Agriculture Imagery Program (NAIP) is
                                         administered by the U.S. Department of Agriculture's
                                         Farm Service Agency (FSA) through the Aerial
                                         Photography Field Office (APFO) in Salt Lake City,
                                         Utah. NAIP acquires aerial imagery at a resolution of
                                         0.5-2-meter ground sample distance (GSD) for the
                                         United States during the agricultural growing season,
                                         or “leaf on” conditions. The NAIP imagery is used to
                                         maintain Common Land Unit (CLU) boundaries and
                                         assist with farm programs. The images are
                                         orthorectified which combines the image
                                         characteristics of an aerial photograph with the
                                         georeferenced qualities of a map. NAIP projects are
                                         contracted each year based upon available funding
       and the FSA acquisition cycle. The current contract has three primary contractors
       acquiring imagery for the USDA Farm Service Agency (FSA).

       Each individual image tile, or Digital Ortho Quarter Quad (DOQQ), covers a 3.75 x 3.75-
       minute quarter quadrangle plus a 300-meter buffer on all four sides. Tiles in the NAIP
       collection come in visible (red, green, and blue bands) or near infrared (red, green, blue,
       and near infrared bands) and may contain as much as 10 percent cloud cover per tile.
       The U.S. Geological Survey (USGS) Earth Resources Observation and Science
       (EROS) Center distributes NAIP products in GeoTIFF and JPEG2000 format (USGS,
       2015 & USDA, 2017).

       NAIP in the Agricultural Community
         • NAIP imagery can be obtained from the USGS Earth Explorer website and the
             Geospatial Data Gateway

       Data
          • Science and agricultural applications include:
               o Acreage Reporting
               o Conservation Practices
               o Land Classification
               o Canopy Analysis
               o Ground Truth

                                                                                                 6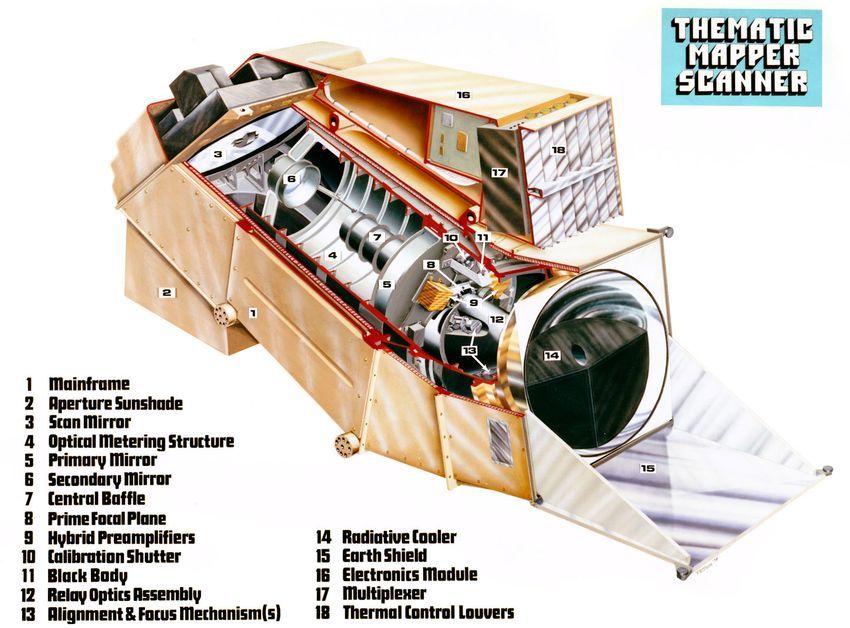
National Aeronautics and Space Administration

     Band                   Spectral Range (µm)      Resolution (m)         Real-Time Data
     Visible                0.435 - 0.651*           0.5 - 2                N/A
     Near Infrared          0.808 - 0.882*           0.5 - 2                N/A
       * Since 2014 imagery has been collected with the Leica ADS100 digital sensor. Spectral
       and spatial resolutions prior to 2014 vary depending on the year and sensor used.

                                                                                            7
National Aeronautics and Space Administration

       Advanced Microwave Scanning Radiometer for EOS (AMSR-E)
                                                 Photo Credit: JAXA

                                                  Launched in 2002 onboard NASA’s second
                                                  EOS mission, AMSR-E is one of six
                                                  instruments on the Aqua satellite, one of
                                                  NASA’s flagship Earth Observing Systems
                                                  (EOS) missions. The instrument measures
                                                  geophysical variables related to the Earth's
                                                  water cycle. AMSR-E is a twelve-channel, six-
                                                  frequency, total power passive-microwave
                                                  radiometer system measuring brightness
                                                  temperatures at 6.925, 10.65, 18.7, 23.8, 36.5,
                                                  and 89.0 GHz. Spatial resolutions
                                                  corresponding to each frequency are as
                                                  follows: 6 x 4 km (89.0 GHz), 14 x 8 km (36.5
                                                  GHz), 32 x 18 km (23.8 GHz), 27 x 16 km
       (18.7 GHz), 51 x 29 km (10.65 GHz), 75 x 43 km (6.925 GHz). The instrument was
       designed and provided by the National Space Development Agency of Japan
       (Contractor: Mitsubishi Electric Corporation).

       The geophysical record will play an important role in climate change monitoring and will
       provide valuable information for understanding the Earth's climate system, including
       water and energy circulation. Various geophysical parameters can be retrieved,
       including water vapor, cloud liquid water, precipitation, sea surface temperature, sea ice
       concentration, snow water equivalent, and soil moisture. The lubricant in the bearing
       assembly gradually deteriorated over the course of the mission leading to the
       instrument being finally turned off in 2016 (NOAA, 2016 & NASA, 2017).

       Data
          • Science and agricultural applications include:
               o Soil Moisture
               o Precipitation
               o Snow Water Equivalent
               o Water Vapor
               o Sea Surface Temperature

           •   Level-1A, Level-2A, Level-2B, and Level-3 data products from AMSR-E can be
               obtained from the NASA National Snow and Ice Data Center Distributed Active
               Archive Center (NSIDC DAAC)

       AMSR-E Performance Characteristics (National Snow and Ice Data Center)

                                                                                                8
National Aeronautics and Space Administration

        Polarization                      Horizontal and
                                          Vertical
        Incidence angle                   55°
        Cross-polarization                Less than -20 dB
        Swath                             1445 km
        Dynamic Range (K)                 2.7 to
                                          340
        Precision                         1 K (1σ)
        Quantifying Bit Number            12-bit     10-bit
        Center Frequency (GHz)            6.925      10.65         18.7      23.8         36.5     89.0
        Bandwidth (MHz)                   350        100           200       400          1000     3000
        Sensitivity (K)                   0.3        0.6           1.1
        Mean Spatial Resolution           56         38            21        24           12       5.4
        (km)
        IFOV (km)                         74 x 43    51 x 30       27 x 16   31 x 18      14 x 8   6x4
        Sampling Interval (km)            10 x 10    5x5
        Integration Time (msec)           2.6        1.3
        Main Beam Efficiency (%)          95.3       95            96.3      96.4         95.3     96
        Beam width (degrees)              2.2        1.4           0.8       0.9          0.4      0.18

     Name                 Frequency (GHz)              Resolution (km)              Real-Time Data
     Microwave            6.925                        12.5 - 25                    N/A
     Microwave            10.65                        12.5 - 25                    N/A
     Microwave            18.7                         12.5 - 25                    N/A

     Microwave            23.8                         12.5 - 25                    N/A

     Microwave            36.5                         12.5 - 25                    N/A
     Microwave            89.0                         12.5 - 25                    N/A

       Relevant Publications and Citations

       Bolten, J. D., Crow, W. T., Zhan, X., Jackson, T. J., & Reynolds, C. A. (2010).
       Evaluating the Utility of Remotely Sensed Soil Moisture Retrievals for Operational

                                                                                                          9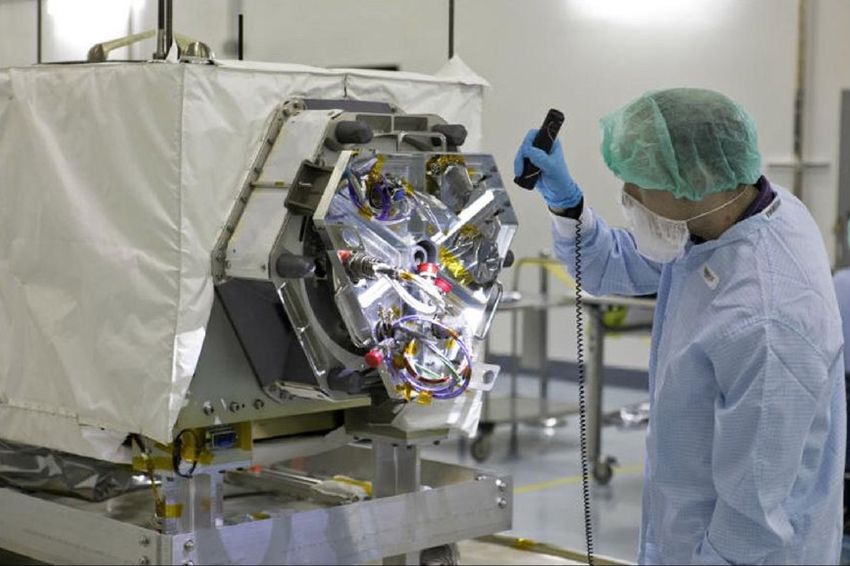
National Aeronautics and Space Administration

       Agricultural Drought Monitoring. IEEE Journal of Selected Topics in Applied Earth
       Observations and Remote Sensing, 3(1), 57-66. doi:10.1109/jstars.2009.2037163

       Liu, D., Mishra, A. K., Yu, Z., Yang, C., Konapala, G., & Vu, T. (2017). Performance of
       SMAP, AMSR-E and LAI for weekly agricultural drought forecasting over continental
       United States. Journal of Hydrology, 553, 88-104. doi:10.1016/j.jhydrol.2017.07.049

       Njoku, E. G. (1999). AMSR Land Surface Parameters. Algorithm Theoretical Basis
       Document: Surface Soil Moisture, Land Surface Temperature, Vegetation Water
       Content, Version 3.0 (NASA, Jet Propulsion Laboratory). Pasadena, CA: Jet Propulsion
       Laboratory.

                                                                                                 10
National Aeronautics and Space Administration
Moderate Resolution Imaging Spectroradiometer (MODIS)
Photo Credit: Sean
McCartney
The Moderate
Resolution Imaging
Spectro-radiometer
(MODIS) is a key
instrument aboard the
Terra and Aqua satellite
missions. Orbiting 705
km above the Earth’s
surface with a 2,330 km
wide swath, MODIS
observes almost all
points on the planet
every 1-2 days. The
MODIS instrument
collects data within 36
spectral bands, ranging in wave-lengths from 0.4 µm to 14.4 µm and provides us with
imagery at a nominal resolution of 250 m at nadir for two bands, 500 m resolution for 5
bands, and the remaining 29 bands at 1 km.
MODIS is ideal for monitoring large-scale changes in the biosphere that are yielding
new insights into the workings of the global carbon cycle. Nearly every day across the
planet, the instrument monitors changes on the land surface, thereby building upon and
extending the heritage begun by Landsat and AVHRR. MODIS’ bands are particularly
sensitive to fires, providing better estimates of the amounts of aerosols and gases fires
release into the atmosphere. The successor to MODIS is the VIIRS instrument first
launched in 2011 on the Suomi NPP platform, and followed by the JPSS-1 (NOAA 20)
series of satellites (NASA, 2017).
Data
• Science and agricultural applications include:
o Surface Reflectance
o Land Cover Type and Extent
o Snow Cover Extent
o Land Surface Temperature
o Evapotranspiration
o Active Fire
o Albedo
11National Aeronautics and Space Administration
• NASA MODIS Land Products are available through the Land Processes DAAC at
the USGS Earth Resources Observation and Science (EROS) Center in Sioux
Falls, South Dakota.
MODIS Performance Characteristics (NASA)
Primary Use Ban Bandwidth Spectral Spatial
d (µm) Radiance Resolution
(m)
Land/Cloud/Aerosols Boundaries 1 0.620 – 0.670 21.8 250
2 0.841 – 0.876 24.7
Land/Cloud/Aerosols Properties 3 0.459 – 0.479 35.3 500
4 0.545 – 0.565 29
5 0.1230 – 5.4
0.1250
6 0.1628 – 7.3
0.1652
7 0.2105 – 1
0.2155
Ocean 8 0.405 – 0.420 44.9 1000
Color/Phytoplankton/Biogeochemist 9 0.438 – 0.448 41.9
ry
10 0.483 – 0.493 32.1
11 0.526 – 0.536 27.9
12 0.546 – 0.556 21
13 0.662 – 0.672 9.5
14 0.673 – 0.683 8.7
15 0.743 – 0.753 10.2
16 0.862 – 0.877 6.2
Atmospheric Water Vapor 17 0.890 – 0.920 10
18 0.931 – 0.941 3.6
19 0.915 – 0.965 15
Primary Use Ban Bandwidth Spectral Spatial
d (µm) Radiance Resolution
(m)
Surface/Cloud Temperature 20 3.660 - 3.840 0.45(300K) 1000
21 3.929 - 3.989 2.38(335K)
22 3.929 - 3.989 0.67(300K)
23 4.020 - 4.080 0.79(300K)
Atmospheric Temperature 24 4.433 - 4.498 0.17(250K)
25 4.482 - 4.549 0.59(275K)
Cirrus Clouds Water Vapor 26 1.360 - 1.390 6
12National Aeronautics and Space Administration
27 6.535 - 6.895 1.16(240K)
28 7.175 - 7.475 2.18(250K)
Cloud Properties 29 8.400 - 8.700 9.58(300K)
Ozone 30 9.580 - 9.880 3.69(250K)
Surface/Cloud Temperature 31 10.780 - 11.280 9.55(300K)
32 11.770 - 12.270 8.94(300K)
Cloud Top Altitude 33 13.185 - 13.485 4.52(260K)
34 13.485 - 13.785 3.76(250K)
35 13.785 - 14.085 3.11(240K)
36 14.085 - 14.385 2.08(220K)
Relevant Publications and Citations
Justice C.O., Vermote E., Privette J., Sei A. The Evolution of U.S. Moderate Resolution
Optical Land Remote Sensing from AVHRR to VIIRS. Ramachandran, B., Justice C.O.,
Abrams M.J. 2011. Land Remote Sensing and Global Environmental Change:
NASA's Earth Observing System and the Science of ASTER and MODIS. Series:
Remote Sensing and Digital Image Processing, Vol. 11, Springer Verlag. 873p. ISBN:
978-1-4419-6748-0
Skakun S., Justice C.O., Vermote E., and Roger J-C, 2017. Transitioning from MODIS
to VIIRS: an analysis of inter-consistency of NDVI data sets for agricultural monitoring.
International Journal of Remote Sensing, 38, 4, 971-992, DOI
10.1080/01431161.2017.1395970
Skakun, S., Franch, B., Vermote, E., Roger, J., Becker-Reshef, I., Justice, C., & Kussul,
N. (2017). Early season large-area winter crop mapping using MODIS NDVI data,
growing degree days information and a Gaussian mixture model. Remote Sensing of
Environment, 195, 244-258. doi:10.1016/j.rse.2017.04.026
Whitcraft, A. K., Becker-Reshef, I., & Justice, C. O. (2014). Agricultural growing season
calendars derived from MODIS surface reflectance. International Journal of Digital
Earth, 8(3), 173-197. doi:10.1080/17538947.2014.894147
13National Aeronautics and Space Administration
Ozone Monitoring Instrument (OMI)
Photo Credit: Netherlands Agency
for Aerospace Programmes (NIVR)
The Ozone Monitoring
Instrument (OMI) is a key
instrument aboard the Aura
satellite mission for
monitoring the recovery of
the ozone layer. Orbiting 705
km above the Earth’s surface
with a 2,600 km wide swath,
the instrument provides daily
global coverage. The OMI
instrument employs
hyperspectral imaging in a
push-broom mode to observe
solar backscatter radiation in
the ultraviolet and visible
(270-365 nm). The hyperspectral capabilities improve the accuracy and precision of the
total ozone amounts and also allow for accurate radiometric and wavelength self-
calibration over the long term. OMI is a contribution of the Netherlands's Agency for
Aerospace Programs (NIVR) in collaboration with the Finnish Meteorological Institute
(FMI) to the EOS Aura mission and will continue the TOMS record for total ozone and
other atmospheric parameters related to ozone chemistry and climate.
OMI measures criteria pollutants such as O3, NO2, SO2, and aerosols. Surface-level
O3 reduces crop yields when it enters a plant’s stomata and chemically reacts with plant
cells. The US Environmental Protection Agency (EPA) has designated these
atmospheric constituents as posing serious threats to human health and agricultural
productivity. (NASA, 2018)
Data
• Science and agricultural applications include:
o Ozone pollution causing crop damage
• NASA OMI products are available through the Goddard Earth Sciences (GES)
Data and Information Services Center (DISC), located at the Goddard Space
Flight Center (GSFC) in Greenbelt, Maryland.
MODIS Performance Characteristics (NASA)
Channel Spectral range Average Ground Pixel Data
Full performance spectral Size products
range
14National Aeronautics and Space Administration
resolution (along x cross-
(FWHM) track)
UV-1 270 - 314 nm 0.42 nm 13 km x 48 km O3 Profile
270 - 310 nm 13 km x 24 km
UV-2 306 - 380 nm 0.45 nm 13 km x 24 km O3 Profile,
310 - 365 nm 13 km x 12 km O3 Column,
BrO, OClO,
SO2, HCHO,
Aerosol,
Surface UV-
B, Surface
Reflectance,
Cloud Top
Pressure,
Cloud Cover
VIS 350 - 500 nm 0.63 nm 13 km x 12 km NO2,
365 - 500 nm 13 km x 12 km Aerosol,
OClO,
Surface UV-
B, Surface
Reflectance,
Cloud Top
Pressure,
Cloud Cover
Relevant Publications and Citations
Avnery, S., Mauzerall, D. L., Liu, J., & Horowitz, L. W. (2011b). Global crop yield
reductions due to surface ozone exposure: 2. Year 2030 potential crop production
losses and economic damage under two scenarios of O3 pollution. Atmospheric
Environment, 45(13), 2297-2309.
Schiferl, L. D. and Heald, C. L.: Particulate matter air pollution may offset ozone
damage to global crop production, Atmos. Chem. Phys., 18, 5953-5966,
https://doi.org/10.5194/acp-18-5953-2018, 2018.
Van Dingenen, R., Dentener, F. J., Raes, F., Krol, M. C., Emberson, L., & Cofala, J.
(2009). The global impact of ozone on agricultural crop yields under current and future
air quality legislation. Atmospheric Environment, 43(3), 604-618
15National Aeronautics and Space Administration
ECOsystem Spaceborne Thermal Radiometer Experiment on Space
Station (ECOSTRESS) / Prototype HyspIRI Thermal Infrared Radiometer
(PHyTIR)
Photo Credit: NASA/JPL-
Caltech/KSC
PHyTIR (Prototype
HyspIRI Thermal
Infrared Radiometer) is
the instrument used for
the ECOSTRESS
(ECOsystem
Spaceborne Thermal
Radiometer
Experiment on Space
Station) mission, one
of two Pathfinder
Programs selected by
NASA in 2014 that will
observe changes in global vegetation from the International Space Station (ISS).
PHyTIR is a high-resolution multiple wavelength imaging spectrometer built by
NASA/JPL (Jet Propulsion Laboratory) in Pasadena, CA, to study the effectiveness of
water use by vegetation. The instrument was initially developed to support testing and
assessment for the HyspIRI (Hyperspectral Infrared Imager) under the auspices of
ESTO (Earth Science Technology Office). ECOSTRESS consists of a cross-track,
push-whiskbroom, scanning, multiband filter radiometer with six spectral bands between
8 and 12.6 µm, and a high spatial resolution of 38 m in-track by 69 m cross-track, and
will be deployed on the JEM (Japanese Experiment Module) External Facility (EF) on
the ISS. Because of the precessing orbit of the ISS, the ECOSTRESS will enable
vegetation water stress assessments on a diurnal scale. This multispectral TIR
(Thermal Infrared) instrument, mounted on the JEM-EF will measure the brightness
temperature of plants and use that information to better understand how much water
plants need and how they respond to stress (evapotranspiration dynamics).
The ISS orbit of ~400 km altitude and 51.6-degree inclination, ECOSTRESS will provide
a repeat cycle of nearly three days and a spatial resolution of ~60 m. Due to the unique
orbital path of the ISS, ECOSTRESS will observe the same spot on Earth at different
times each day. This configuration will enable an unprecedented view of diurnal trends
in vegetation evapotranspiration. ECOSTRESS will provide the highest spatial
resolution thermal infrared data ever from the ISS. One of the core products that will be
produced by the ECOSTRESS team is the Evaporative Stress Index (ESI). ESI is a
leading drought indicator—meaning it can indicate that plants are stressed and that a
16National Aeronautics and Space Administration
drought is likely to occur providing the option for decision makers to take action. (NASA
& ESA, 2018)
Data
• Science and agricultural applications include:
o Evapotranspiration
o Evaporative Stress Index (ESI)
• NASA PHyTIR/ECOSTRESS Land Products are available through the Land
Processes DAAC at the USGS Earth Resources Observation and Science
(EROS) Center in Sioux Falls, South Dakota.
MODIS Performance Characteristics (NASA)
Description Value Unit Notes
Number of spectral bands 6
Measured band centers 8.28, 8.79, 9.06, µm
10.50, 12,05, 12.60
Measured FWHM per 0.26, 0.36, 0.4, 0.43, µm
band 0.59
Pixel size at nadir 69 x 38 m 2 pixels in cross
track and 1 pixel
in down track
Swath width (ISS nominal ≥ 360 km
altitude range is 385 to
415 km)
Radiometric accuracy ≤1 K @ 300 K K
Radiometric precision ≤0.3 K @ 300 K
Dynamic range 270-335 K
Data coverage CONUS, twelve 1,000
x 1,000 km key
climate
zone and twenty-five
Flux net sites for all
opportunities
Data collection On average 1-hour of
science data per day
17National Aeronautics and Space Administration
GPM Microwave Imager (GMI)
Photo Credit: Ball Aerospace & Technology Corporation
The Global Precipitation Measurement (GPM)
Microwave Imager (GMI) is a passive
instrument that observes the microwave
energy emitted by the Earth and atmosphere.
GMI is one of two instruments onboard the
Global Precipitation Measurement (GPM) core
satellite. GPM is a mission between NASA,
JAXA, and partnering space agencies. The
instrumentation enables the core spacecraft to
serve as both a precipitation standard and as a
radiometric standard for the other GPM
constellation members. The instrument is a
multi-channel, conical-scanning, microwave
radiometer, characterized by 13 microwave
channels ranging in frequency from 10 GHz to
183 GHz. In addition to carrying channels
similar to those on the Tropical Rainfall
Measuring Mission (TRMM) Microwave Imager
(TMI), which flew from 1997-2015, the GMI
carries four high frequency, millimeter-wave
channels near 166 GHz and 183 GHz.
Rotating at 32 rotations per minute, the GMI gathers microwave radiometric brightness
measurements over a 140-degree sector centered about the spacecraft’s ground track
vector. The 140-degree GMI swath represents a swath of 904 km (562 miles) on the
Earth's surface. GMI is designed to advance precipitation measurements from space,
improve knowledge of precipitation systems, improve climate modeling and prediction,
improve weather forecasting, and improve hydrological modeling and prediction.
Societal applications include disasters, health, agriculture, and climate prediction. The
Ball Aerospace and Technology Corporation built the GMI under contract with NASA
Goddard Space Flight Center (NASA, 2017).
GMI in the NASA Community
• Precipitation Measurement Missions (PMM) Extreme Weather News is a NASA
effort to provide near real-time information and 3-D visualizations of hurricanes to
the general public.
Data
• Science and agricultural applications include:
o Precipitation
18National Aeronautics and Space Administration
o Extreme Weather
o Floods
o Landslides
o Climate Prediction
o Soil Moisture
o Agriculture
• NASA GMI Precipitation Products can be obtained from the NASA Goddard
Earth Sciences (GES) Data and Information Services Center (DISC), located in
Greenbelt, MD.
GMI Performance Characteristics (NASA)
Channe Central Central Bandwidt Polarizatio Integratio NEDT (K)
l No Frequenc Frequency h (MHz) n n time
y (Ghz) Stabilization (ms)
(±MHz)
1 10.65 10 100 V 9.7 0.96
2 10.65 10 100 H 9.7 0.96
3 18.7 20 200 V 5.3 0.84
4 18.7 20 200 H 5.3 0.84
5 23.8 20 400 V 5 1.05
6 36.5 50 1000 V 5 0.65
7 36.5 50 1000 H 5 0.65
8 89 200 6000 V 2.2 0.57
9 89 200 6000 H 2.2 0.57
10 166 200 3000 V 3.6 1.5
11 166 200 3000 H 3.6 1.5
12 183.31±3 200 3500 V 3.6 1.5
13 183.31±7 200 4500 V 3.6 1.5
Relevant Publications and Citations
Skofronick-Jackson, G., Petersen, W. A., Berg, W., Kidd, C., Stocker, E. F.,
Kirschbaum, D. B., . . . Wilheit, T. (2017). The Global Precipitation Measurement (GPM)
Mission for Science and Society. Bulletin of the American Meteorological Society,
98(8), 1679-1695. doi:10.1175/bams-d-15-00306.1
Kirschbaum, D. B., Huffman, G. J., Adler, R. F., Braun, S., Garrett, K., Jones, E., . . .
Zaitchik, B. F. (2017). NASA’s Remotely Sensed Precipitation: A Reservoir for
Applications Users. Bulletin of the American Meteorological Society, 98(6), 1169-
1184. doi:10.1175/bams-d-15-00296.1
19National Aeronautics and Space Administration
Dual-frequency Precipitation Radar (DPR)
Photo Credit: JAXA/NASA
The Dual-Frequency
Precip-itation Radar
(DPR) is one of two
instruments onboard the
Global Precipitation
Measurement (GPM)
Core satellite. GPM is a
mission between NASA,
JAXA, and partnering
space agencies. The
DPR consists of a Ku-
band precipitation radar
(KuPR) and a Ka-band
precipitation radar
(KaPR). The KuPR (13.6 GHz) is an updated version of the highly successful unit flown
on the Tropical Rainfall Measuring Mission (TRMM). The DPR provides three-
dimensional information about precipitation particles derived from reflected energy by
these particles at different heights within the cloud system. The two frequencies of the
DPR also allow the radar to infer the sizes of precipitation particles and offer insights
into a storm’s physical characteristics. The Ka-band frequency scans across a region of
78 miles (125 kilometers) and is nested within the wider scan of the Ku-band frequency
of 158 miles (254 kilometers).
The DPR is more sensitive than its TRMM predecessor especially in the measurement
of light rainfall and snowfall in high latitude regions. Rain/snow determination is
accomplished by using the differential attenuation between the Ku-band and the Ka-
band frequencies. These Earth-pointing KuPR and KaPR instruments provide rain
sensing over both land and ocean, both day and night. DPR is designed to advance
precipitation measurements from space, improve knowledge of precipitation systems,
improve climate modeling and prediction, improve weather forecasting, and improve
hydrological modeling and prediction. Societal applications include disasters, health,
agriculture, and climate prediction. JAXA and Japan’s National Institute of Information
and Communications Technology (NICT) built the DPR for GPM’s Core satellite (NASA,
2017).
DPR in the NASA Community
• Precipitation Measurement Missions (PMM) Extreme Weather News is a NASA
effort to provide near real-time information and 3-D visualizations of hurricanes to
the general public.
20National Aeronautics and Space Administration
Data
• Science and agricultural applications include:
o Precipitation
o Extreme Weather
o Floods
o Landslides
o Climate Prediction
o Soil Moisture
o Agriculture
• NASA DPR Precipitation Products can be obtained from the NASA Goddard
Earth Sciences (GES) Data and Information Services Center (DISC), located in
Greenbelt, MD.
DPR Performance Characteristics (NASA)
Item KuPR KaPR
Swath Width 245 kilometers (km) 120 kilometers (km)
Range Resolution 250 meters (m) 250/500 meters (m)
Spatial Resolution 5 km (Nadir) 5 km (Nadir)
Beam Width 0.71 degrees 0.71 degrees
Transmitter 128 Solid State Amplifiers 128 Solid State
Amplifiers
Peak Transmit Power 1013 Watts (W) 146 Watts (W)
Pulse Repetition 4100 - 4400 Hertz 4100 - 4400 Hertz
Frequency
Relevant Publications and Citations
Skofronick-Jackson, G., Petersen, W. A., Berg, W., Kidd, C., Stocker, E. F.,
Kirschbaum, D. B., . . . Wilheit, T. (2017). The Global Precipitation Measurement (GPM)
Mission for Science and Society. Bulletin of the American Meteorological Society,
98(8), 1679-1695. doi:10.1175/bams-d-15-00306.1
Kirschbaum, D. B., Huffman, G. J., Adler, R. F., Braun, S., Garrett, K., Jones, E., . . .
Zaitchik, B. F. (2017). NASA’s Remotely Sensed Precipitation: A Reservoir for
Applications Users. Bulletin of the American Meteorological Society, 98(6), 1169-
1184. doi:10.1175/bams-d-15-00296.1
21National Aeronautics and Space Administration
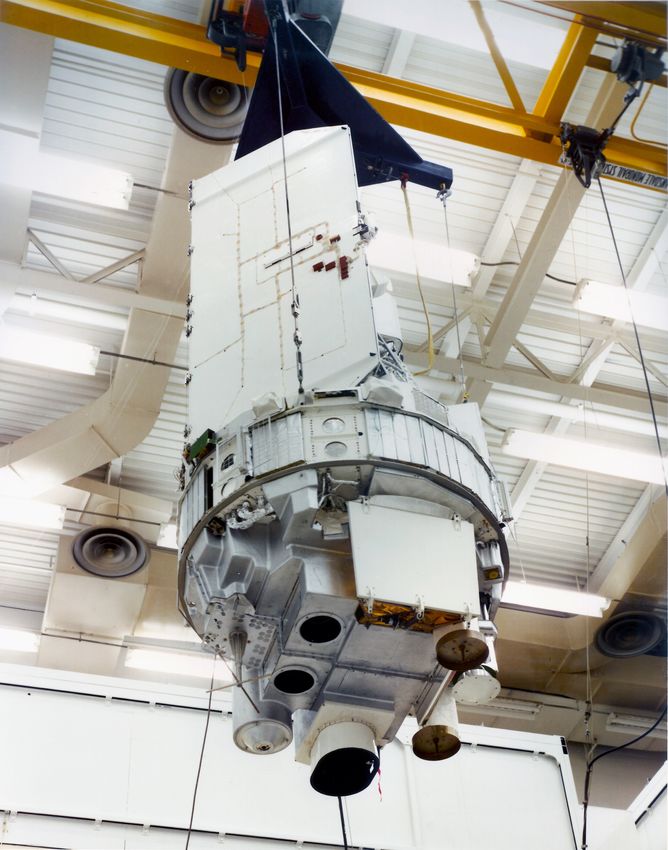
Gravity Recovery and Climate Experiment (GRACE) &
Gravity Recovery and Climate Experiment Follow-On (GRACE-
FO)
Photo Credit: NASA
The GRACE mission
was selected as the
second mission under
the NASA Earth System
Science Pathfinder
(ESSP) Program in May
1997. Launched in
March of 2002, the
GRACE mission is
accurately mapping
variations in Earth's
gravity field. GRACE is
different from most Earth
observing satellite
missions because it
doesn't carry a suite of
independent scientific instruments on board. It does not take measurements of the
electromagnetic energy reflected back to it from the Earth's surface. Instead, the two
GRACE satellites themselves act in unison as the primary instrument. Changes in the
distance between the twin satellites (nicknamed Tom and Jerry) are used to make
gravitational field measurements.
The twin satellites fly about 220 kilometers (137 miles) apart in a polar orbit 500
kilometers (310 miles) above Earth. GRACE maps Earth's gravity field by making
accurate measurements of the distance between the two satellites, using GPS and a
microwave ranging system (K-band Ranging System). GRACE is providing scientists
from all over the world with an efficient and cost-effective way to map Earth's gravity
field with unprecedented accuracy. The gravity variations studied by GRACE include:
changes due to surface and deep currents in the ocean, runoff and ground water
storage on land masses, exchanges between ice sheets or glaciers and the ocean, and
variations of mass within Earth. GRACE is a joint NASA/Deutsches Zentrum für Luft-
und Raumfahrt (DLR, the German Aerospace Center) mission. Following an age-related
battery issue on GRACE-2 in September 2017, the satellite mission has ended scientific
operations.
GRACE Follow-On, a joint NASA/Helmholtz Centre Potsdam German Research Centre
for Geosciences (GFZ) mission, will continue GRACE's legacy. It will also test a new
laser-ranging interferometer developed by a joint German/U.S. collaboration for use in
22National Aeronautics and Space Administration
future generations of gravitational research satellites. GRACE-FO is scheduled for
launch in early 2018 (NASA, 2017).
Data
• Science and agricultural applications include:
o Drought Monitoring
o Flood Potential
o Groundwater
• NASA GRACE Products can be obtained from the NASA Jet Propulsion
Laboratory.
Relevant Publications and Citations
Bernknopf, R., Brookshire, D., Kuwayama, Y., Macauley, M., Rodell, M., Thompson, A.,
. . . Zaitchik, B. (2018). The Value of Remotely Sensed Information: The Case of a
GRACE-Enhanced Drought Severity Index. Weather, Climate, and Society, 10(1),
187-203. doi:10.1175/wcas-d-16-0044.1
Girotto, M., G. J. Lannoy, R. H. Reichle, et al. 2017. "Benefits and Pitfalls of GRACE
Data Assimilation: A Case Study of Terrestrial Water Storage Depletion in India."
Geophysical Research Letters, 44: 4107-4115
Lo, M.-H., J. S. Famiglietti, J. T. Reager, M. Rodell, and S. C. Swenson. 2016.
"GRACE-based estimates of global groundwater depletion." Terrestrial Water Cycle
and Climate Change: Natural and Human-Induced Impacts, 137-146, ISBN: 971-1-
118-97176-5
23National Aeronautics and Space Administration
The Visible Infrared Imaging Radiometer Suite (VIIRS)
VIIRS Photo, courtesy of Raytheon
Space and Airborne Systems
First launched as one of five
instruments on the Suomi-
National Polar-orbiting
Partnership (Suomi-NPP)
Mission in 2011, this
multispectral imager obtains
daily observations from the
visible through the thermal. The
instrument was designed in part
to provide continuity with EOS
MODIS and has many of the
same characteristics for land monitoring (Justice et al. 2011). The Suomi-NPP Mission
shared by NASA and NOAA is a bridging mission to the JPSS-1 (NOAA 20) VIIRS
instruments, the NOAA operational polar orbiting imager which replaces the NOAA
AVHRR instrument series, which started in 1981. JPSS-1 was launched on November
18, 2017 and is the first of four VIIRS instruments in the JPSS series.
VIIRS observes the entire Earth’s surface twice each day from Suomi NPP’s polar orbit
824 km above the Earth’s surface. The 3,000 km swath width of the VIIRS instrument,
which is 710 km greater than that of Moderate Resolution Imaging Spectroradiometer
(MODIS), allows for no gaps in coverage, which are observed in MODIS near the
equator. The VIIRS instrument provides 22 spectral bands at two spatial resolutions,
375 meters (m) and 750 m, which are resampled to 500 m, 1 km, and 0.05 degrees as
NASA data products to promote consistency with the MODIS heritage. Unlike MODIS,
VIIRS maintains a uniform pixel size across scan by resampling.
VIIRS in the NASA Community
• The NASA VIIRS Land Science Team is utilizing S-NPP VIIRS to provide
continuity with the land products from MODIS.
• NASA VIIRS Land Products can be obtained from the Land Product DAAC at
Sioux Falls, South Dakota.
• SPoRT (Short-term Prediction Research and Transition Center) is a NASA
project to transition unique observations and research capabilities to the
operational weather community to improve short-term forecasts on a regional
scale.
Data
• Land products relevant for agricultural monitoring include:
o Surface Reflectance (the input for vegetation indices)
24National Aeronautics and Space Administration
o Land Surface Remperature
o Active Fire
o Albedo
• Near Real Time versions of some of the VIIRS products including surface
reflectance and fire can be obtained via the Land Atmosphere Near real time
Capability for EOS (LANCE).
• Similar land products offered by NOAA
25National Aeronautics and Space Administration
Spectral Range Resolution Real-Time
Band
(µm) (km) Data
Visible (I1) 0.600 - 0.680 0.375
Shortwave Infrared (I4) 3.55 - 3.93 0.375
Longwave Infrared (I5) 10.5 - 12.4 0.375
Day/Night Band Radiance 0.75
Day/Night Band
0.75
Reflectance
Relevant Publications and Citations
Skakun S., Justice C.O., Vermote E., and Roger J-C, 2017. Transitioning from MODIS
to VIIRS: an analysis of inter-consistency of NDVI data sets for agricultural monitoring.
International Journal of Remote Sensing, 38, 4, 971-992, DOI
10.1080/01431161.2017.1395970
Justice C.O., Vermote E., Privette J., Sei A. The Evolution of U.S. Moderate Resolution
Optical Land Remote Sensing from AVHRR to VIIRS. Ramachandran, B., Justice C.O.,
Abrams M.J. 2011. Land Remote Sensing and Global Environmental Change:
NASA's Earth Observing System and the Science of ASTER and MODIS. Series:
Remote Sensing and Digital Image Processing, Vol. 11, Springer Verlag. 873p. ISBN:
978-1-4419-6748-0
Vermote, E., Justice C., & Csiszar, I. (2014). Early evaluation of the VIIRS calibration,
cloud mask and surface reflectance Earth data records. Remote Sensing of
Environment, 148, 134-145.
26National Aeronautics and Space Administration
Multispectral Scanner (MSS)
Four-band Multispectral Scanner
System that flew on Landsat 1
Photo Credit: Hughes Santa
Barbara Remote Sensing / NASA
The Multispectral Scanner
(MSS) sensor was onboard
Landsats 1 through 5. It
acquired images of the
Earth nearly continuously
from July 1972 to January
1992, with an 18-day repeat
cycle for Landsats 1 through
3, and a 16-day repeat cycle
for Landsats 4 and 5.
Starting with its first Launch
on July 23, 1972 aboard
Earth Resources
Technology Satellite 1 (ERTS-1, later named Landsat 1), the MSS instrument has been
crucial to the Landsat mission, a joint effort of the USGS and NASA. Built by Hughes
Aircraft Corporation, this scanning spectroradiometric sensor was the backbone of the
first three Landsat satellites’ data acquisition. It was not until Landsat 4 and 5 that the
MSS became subsidiary to the more advantageous Thematic Mapper (TM). The MSS
sensor was also the first global monitoring system that used multiple band data in a
digital format.
Photo Credit: Hughes Santa Barbara Remote
Sensing / NASA
The whisk broom sensor used an
oscillating mirror to detect light from four
spectral bands ranging from the visible
green to the near-infrared (IR) wavelengths
(0.5 – 1.1 µm). The sensor collected a
swath of 185 km (115 miles) across the
orbital track from an orbital altitude of 917
km (∼570 miles). The precise location of
Landsats 1-3 was not well known, as is
now the standard on modern systems
carrying a GPS receiver. Therefore, the
image processing from these earlier
missions often required manual
intervention to create products that were
27National Aeronautics and Space Administration
comparable to modern approaches. Using the automated systems, only a small number
of MSS scenes could be processed to a terrain-corrected product. To resolve these
issues, MSS data products with improved geometric correction were released in fall
2010. The products are processed on the Landsat Product Generation System (LPGS),
similar to all other Landsat data types. All MSS products are processed to generate a
geolocated, terrain-corrected product (L1T) in the Universal Transverse Mercator (UTM)
projection cast on the WGS-84 datum at a 60-meter spatial resolution.
(NASA, USGS, 2017)
Data
• Science and agricultural applications include:
o Land Use/Land Change
o Agriculture
o Forestry
o Geology
• MSS Level 1T scenes can be obtained from USGS on EarthExplorer or the
USGS Global Visualization Viewer (GloVis).
MSS Performance Characteristics (NASA)
Band # Band # Band # (L4- Spectral Spatial L4/L5 TM Band
(L1-L2) (L3) L5) Resolution (µm) Resolution (m) Equivalent
4 – Green 4 1 – Green 0.5 - 0.6 60 ~ 2 (0.52–0.60 µm)
5 – Red 5 2 – Red 0.6 - 0.7 60 ~ 3 (0.63–0.69 µm)
6 – NIR 6 3 – NIR 0.7 - 0.8 60 ~ 4 (0.76–0.90 µm)
7 – NIR 7 4 – NIR 0.8 - 1.1 60 ~ 4 (0.76–0.90 µm)
N/A 8– N/A 10.4 - 12.6 60 ~ 6 (10.41-12.5 µm)
Thermal
28National Aeronautics and Space Administration
Photo of Landsat 3 spacecraft at GE factory during integration
Photo Credit: GE/NASA
Relevant Publications and Citations
Chander, G., Markham, B. L., & Helder, D. L. (2009). Summary of current radiometric
calibration coefficients for Landsat MSS, TM, ETM , and EO-1 ALI sensors. Remote
Sensing of Environment, 113(5), 893-903. doi:10.1016/j.rse.2009.01.007
29National Aeronautics and Space Administration
Thematic Mapper (TM)
Schematic of Landsat 4/5
Thematic Mapper
Photo Credit: Hughes Santa
Barbara Remote Sensing
The Thematic Mapper
(TM) is a multispectral
scanning, whisk broom
sensor designed to
achieve higher image
resolution, sharper
spectral separation,
improved geometric
fidelity, and greater
radiometric accuracy and
resolution than the
Multispectral Scanner
(MSS). TM flew onboard Landsats 4 and 5 and acquired images of the Earth from 1982
to January 2011, when the instrument stopped acquiring images due to a rapidly
degrading electronic component. The instrument operates in the visible and Infra-Red
regions of the Electromagnetic Spectrum, consisting of six spectral bands with a spatial
resolution of 30 meters for bands 1-5 and band 7, and one thermal band (band 6)
collected at 120 meters, later resampled to 30 meters. The instrument had a temporal
resolution of 16 days.
Landsat 4 Thematic Mapper during fabrication
and test
Photo Credit: Hughes Santa Barbara Remote
Sensing
TM products are processed on the
Landsat Product Generation System
(LPGS), similar to all other Landsat
data types. All TM products are
processed to generate a geolocated,
terrain-corrected product (L1T) in the
Universal Transverse Mercator (UTM)
projection cast on the WGS-84 datum
at a 30-meter spatial resolution. The
instrument was built by Santa Barbara
Research Centre (SBRC) of Hughes Aircraft Corporation (NASA, USGS, 2017).
30National Aeronautics and Space Administration
Data
• Science and agricultural applications include:
o Land Use/Land Change
o Albedo
o Agriculture
o Forestry
o Geology
• TM Level 1T scenes can be obtained from USGS on EarthExplorer or the USGS
Global Visualization Viewer (GloVis).
TM Performance Characteristics (NASA)
Band Number Spectral Resolution Spatial Resolution
(µm) (m)
1 – Blue 0.45 - 0.52 30
2 – Green 0.52 - 0.60 30
3 – Red 0.63 - 0.69 30
4 – Near Infrared (NIR) 0.76 - 0.90 30
5 – Shortwave Infrared (SWIR) 1 1.55 - 1.75 30
6 – Thermal 10.41 - 12.5 120* (30)
7 – Shortwave Infrared (SWIR) 2 2.08 - 2.35 30
* TM Band 6 was acquired at 120-meter resolution, but products are resampled to 30-
meter.
Relevant Publications and Citations
Claverie, M., Vermote, E. F., Franch, B., & Masek, J. G. (2015). Evaluation of the
Landsat-5 TM and Landsat-7 ETM surface reflectance products. Remote Sensing of
Environment, 169, 390-403. doi:10.1016/j.rse.2015.08.030
Huang, J., Tian, L., Liang, S., Ma, H., Becker-Reshef, I., Huang, Y., . . . Wu, W. (2015).
Improving winter wheat yield estimation by assimilation of the leaf area index from
Landsat TM and MODIS data into the WOFOST model. Agricultural and Forest
Meteorology, 204, 106-121. doi:10.1016/j.agrformet.2015.02.001
31National Aeronautics and Space Administration
Enhanced Thematic Mapper Plus (ETM+)
Photo Credit: Hughes Santa Barbara
Remote Sensing / NASA
The Enhanced Thematic
Mapper Plus (ETM+) was
launched onboard the Landsat
7 satellite on April 15, 1999,
and builds off the success of
the Thematic Mapper (TM)
flown onboard Landsats 4/5.
ETM+ optics contain the Scan
Mirror and Scan Line
Corrector (SLC), 8-band
multispectral scanning
radiometer (with a spatial
resolution of 30 m for bands 1-
7), and 15 m spatial resolution
for the panchromatic band 8.
The sensor detects spectrally-
filtered radiation in the visible, Near Infra-Red (NIR), Shortwave Infra-Red (SWIR),
Thermal Infra-Red (TIR), and panchromatic bands in a 183 km wide swath when
orbiting at a nominal altitude of 705 km. The instrument has a temporal resolution of 16
days. The primary new features on ETM+ are a panchromatic band with 15 m spatial
resolution, 5% absolute radiometric calibration, and a thermal IR channel with a four-
fold improvement in spatial resolution over TM. All bands can collect one of two gain
settings (low or high) for increased radiometric sensitivity and dynamic range, while
band 6 collects both low and high gain (bands 61 and 62, respectively) for all scenes.
The ETM+ instrument has been crucial to the Landsat mission, a joint effort of the
USGS and NASA.
On May 31, 2003, the SLC, which compensates for the forward motion of Landsat 7,
failed. Subsequent efforts to recover the SLC were not successful. Without an operating
SLC, the Enhanced Thematic Mapper Plus (ETM+) line of sight now traces a zig-zag
pattern along the satellite ground track (see below). As a result, imaged area is
duplicated, with width that increases toward the scene edge. All ETM+ products are
processed to generate a geolocated, terrain-corrected product (L1T) in the Universal
Transverse Mercator (UTM) projection cast on the WGS-84 datum at a 30-meter spatial
resolution. The instrument was built by Raytheon SBRS (Santa Barbara Remote
Sensing). (NASA, USGS, 2017)
32National Aeronautics and Space Administration
Figure showing result
of SLC failure
impacting the ETM+
instrument (USGS,
2017).
Data
• Science and agricultural applications include:
o Surface Reflectance
o Surface Temperature
o Land Use/Land Change
o Agriculture
o Albedo
o Forestry
o Geology
• ETM+ Level 1T scenes can be obtained from USGS on EarthExplorer or the
USGS Global Visualization Viewer (GloVis).
ETM+ Performance Characteristics (NASA)
Band Number Spectral Resolution Spatial Resolution
(µm) (m)
1 – Blue 0.45-0.515 30
2 – Green 0.525-0.605 30
3 – Red 0.63-0.69 30
4 – Near Infrared 0.775-0.90 30
5 – Shortwave Infrared 1.55-1.75 30
6 – Thermal 10.4-12.5 60* (30)
7 – Shortwave Infrared 2.08-2.35 30
8 – Panchromatic 0.52-0.9 15
* ETM+ Band 6 is acquired at 60-meter resolution, but products are resampled to 30-
meters.
Relevant Publications and Citations
Claverie, M., Vermote, E. F., Franch, B., & Masek, J. G. (2015). Evaluation of the
Landsat-5 TM and Landsat-7 ETM surface reflectance products. Remote Sensing of
Environment, 169, 390-403. doi:10.1016/j.rse.2015.08.030
33National Aeronautics and Space Administration
Masek, J., Honzak, M., Goward, S., Liu, P., & Pak, E. (2001). Landsat-7 ETM as an
observatory for land cover Initial radiometric and geometric comparisons with Landsat-5
Thematic Mapper [Abstract]. Remote Sensing of Environment, 78, 118-130.
Retrieved from http://glcfapp.glcf.umd.edu/library/pdf/rse78_p118.pdf
Roy, D., Kovalskyy, V., Zhang, H., Vermote, E., Yan, L., Kumar, S., & Egorov, A.
(2016). Characterization of Landsat-7 to Landsat-8 reflective wavelength and
normalized difference vegetation index continuity. Remote Sensing of Environment,
185, 57-70. doi:10.1016/j.rse.2015.12.024
34National Aeronautics and Space Administration
Operational Land Imager (OLI)
Landsat 8 Operational
Land Imager at factory
Photo Credit: Ball
Aerospace
The Operational Land
Imager (OLI) is one of
two instruments
launched onboard the
Landsat 8 satellite on
February 11, 2013.
The instrument
collects visible, near
infrared, and short-
wave infrared images
of the Earth with a 16-
day repeat time, and
an 8-day offset to
ETM+ flown onboard
Landsat 7. The
spectral bands of the
OLI instrument, while
similar to the ETM+, provide enhancement from prior Landsat instruments with the
addition of two new spectral bands: a deep blue visible channel (band 1) specifically
designed for water resources and coastal zone investigation, and a new infrared
channel (band 9) for the detection of cirrus clouds. The nine spectral bands have a
spatial resolution of 30 m (15 m panchromatic band) over a 185 km swath at a nominal
altitude of 705 km.
35National Aeronautics and Space Administration
Landsat 8 Operational Land Imager at
factory
Photo Credit: Ball Aerospace
OLI’s design is an advancement
in Landsat sensor technology
and uses an approach
demonstrated by the Advanced
Land Imager sensor flown on
NASA’s experimental EO-1
satellite. Instruments on earlier
Landsat satellites employed scan
mirrors to sweep the instrument
fields of view across the surface
swath width and transmit light to
a few detectors. The OLI instead
uses long detector arrays, with
over 7,000 detectors per spectral
band, aligned across its focal
plane to view across the swath. This push broom design results in a more sensitive
instrument providing improved land surface information with fewer moving parts. All OLI
products are processed to generate a geolocated, terrain-corrected product (L1T) in the
Universal Transverse Mercator (UTM) projection cast on the WGS-84 datum at a 30-
meter spatial resolution. The instrument was built by Ball Aerospace & Technologies
Corporation. The OLI instrument has been crucial to the Landsat mission, a joint effort
of the USGS and NASA (NASA, USGS, 2017).
Data
• Science and agricultural applications include:
o Surface Reflectance
o Land Use/Land Change
o Agriculture
o Albedo
o Forestry
o Geology
• OLI Level 1T scenes can be obtained from USGS on EarthExplorer or the USGS
Global Visualization Viewer (GloVis).
OLI Performance Characteristics (NASA)
Band Number Spectral Resolution Spatial Resolution
(µm) (m)
Band 1 – Coastal / Aerosol 0.433 – 0.453 30
Band 2 – Blue 0.450 – 0.515 30
36National Aeronautics and Space Administration
Band 3 – Green 0.525 – 0.600 30
Band 4 – Red 0.630 – 0.680 30
Band 5 – Near infrared 0.845 – 0.885 30
Band 6 – Shortwave Infrared 1.560 – 1.660 30
Band 7 – Shortwave Infrared 2.100 – 2.300 30
Band 8 – Panchromatic 0.500 – 0.680 15
Band 9 – Cirrus 1.360 – 1.390 30
Relevant Publications and Citations
Irons, J. R., Dwyer, J. L., & Barsi, J. A. (2012). The next Landsat satellite: The Landsat
Data Continuity Mission. Remote Sensing of Environment, 122, 11-21.
doi:10.1016/j.rse.2011.08.026
Roy, D., Kovalskyy, V., Zhang, H., Vermote, E., Yan, L., Kumar, S., & Egorov, A.
(2016). Characterization of Landsat-7 to Landsat-8 reflective wavelength and
normalized difference vegetation index continuity. Remote Sensing of Environment,
185, 57-70. doi:10.1016/j.rse.2015.12.024
Vermote, E., Justice, C., Claverie, M., & Franch, B. (2016). Preliminary analysis of the
performance of the Landsat 8/OLI land surface reflectance product. Remote Sensing
of Environment, 185, 46-56. doi:10.1016/j.rse.2016.04.008
37National Aeronautics and Space Administration
Thermal Infrared Sensor (TIRS)
Photo Credit: NASA/GSFC, Rebecca
Roth
Thermal Infrared Sensor (TIRS)
is one of two instruments
launched onboard the Landsat 8
satellite on February 11, 2013.
TIRS was added to the satellite
mission when it became clear
that state water resource
managers rely on the highly
accurate measurements of
Earth’s thermal energy obtained
by Landsat 8’s predecessors,
Landsat 5 and Landsat 7, to
track how land and water are
being used. The instrument
collects imagery for two thermal
infrared bands (10.8 µm and 12
µm) with a spatial resolution of 100 m, with the purpose to obtain land surface
temperature characteristics. It has a 185 km swath from the nominal altitude of 705 km.
TIRS represents an advancement over the single-band thermal data collected by
previous Landsat satellites. Similar to OLI, TIRS uses long detector arrays, with roughly
1,850 detectors per spectral band, aligned across its focal plane to view across the
swath. This push broom design results in a more sensitive instrument providing
improved land surface information with fewer moving parts.
38National Aeronautics and Space Administration
Photo Credit: NASA/GSFC, Rebecca Roth
Since the launch of Landsat 8 in 2013,
thermal energy from outside the normal
field of view (stray light) has affected the
data collected in Bands 10 and 11 of
TIRS. This stray light increases the
reported temperature by up to four
degrees Kelvin (K) in Band 10 and up to
eight K in Band 11. The errors vary
throughout the scene and depend upon
radiance outside the instrument field of
view, which users cannot correct in the
Landsat Level-1 data product. An
algorithm to correct for this issue was
developed and implemented into the
processing system in February 2017. All
TIRS products are processed to generate
a geolocated, terrain-corrected product
(L1T) in the Universal Transverse
Mercator (UTM) projection cast on the
WGS-84 datum at a 30-meter spatial
resolution. The instrument was built by Ball Aerospace in Boulder, CO, and Goddard
Space Flight Center. The TIRS instrument has been crucial to the Landsat mission, a
joint effort of the USGS and NASA (NASA, USGS, 2017).
Data
• Science and agricultural applications include:
o Land Surface Temperature
o Active Fire
• OLI Level 1T scenes can be obtained from USGS on EarthExplorer or the USGS
Global Visualization Viewer (GloVis).
TIRS Performance Characteristics (NASA)
Band Number Spectral Resolution Spatial Resolution
(µm) (m)
10 – Thermal 10.60 - 11.19 100 * (30)
Infrared
11 – Thermal 11.50 - 12.51 100 * (30)
Infrared
* resampled to 30 meters to match multispectral bands
Relevant Publications and Citations
39National Aeronautics and Space Administration
Barsi, J., Schott, J., Hook, S., Raqueno, N., Markham, B., & Radocinski, R. (2014).
Landsat-8 Thermal Infrared Sensor (TIRS) Vicarious Radiometric Calibration. Remote
Sensing, 6(12), 11607-11626. doi:10.3390/rs61111607
Reuter, D., Richardson, C., Pellerano, F., Irons, J., Allen, R., Anderson, M., . . . Thome,
K. (2015). The Thermal Infrared Sensor (TIRS) on Landsat 8: Design Overview and
Pre-Launch Characterization. Remote Sensing, 7(12), 1135-1153.
doi:10.3390/rs70101135
40National Aeronautics and Space Administration
Advanced Very High Resolution Radiometer (AVHRR)
Photo Credit:
NASA/NOAA
The first Advanced
Very High
Resolution
Radiometer
(AVHRR) was a 4-
channel
radiometer, first
carried on TIROS-
N (launched October 1978). This was subsequently improved to a 5-channel instrument
(AVHRR/2) that was initially carried on NOAA-7 (launched June 1981). The latest
instrument version is AVHRR/3, with 6 channels, first carried on NOAA-15 launched in
May 1998. The instrument is a cross-track scanning system with a twice daily temporal
resolution (0230 and 1430 local solar time). Most AVHRR instruments have been
integrated with NOAA’s constellation of Polar Operational Environmental Satellites
(POES), as well as the European Space Agency’s (ESA) MetOp series of polar orbiting
satellites. The instrument has provided a continuous long-term record of thermal
emissions from the Earth, sea surface temperature, aerosols, and monitoring of land
surfaces for almost four decades.
The instrument has a daily temporal resolution with a 1.1 km spatial resolution in all six
bands. AVHRR has a 2,500 km swath and a nominal altitude of 833 or 870 km. There
are three data types produced from the POES AVHRR: The Global Area Coverage
(GAC), Local Area Coverage (LAC), and the High Resolution Picture Transmission
(HRPT). A fourth data type, Full Resolution Area Coverage (FRAC 1.1 km) is now
available daily for the entire globe with the launch of MetOp-A (ESA). Research quality
data consists of daily, 5-day, 8-day, monthly, and yearly level-3 products on a 4 km
global grid. The instrument was built by ITT, Aerospace/Communications Division
(NOAA, NASA, 2017).
Data
• Science and agricultural applications include:
o Agriculture
o Forestry
o Land Use/Land Change
o Sea Surface Temperature
o Snow Cover
• AVHRR data can be obtained from NOAA through the Comprehensive Large
Array-Data Stewardship System (CLASS) and the USGS through Earth Explorer.
41You can also read