Lower-stratospheric aerosol measurements in eastward-shedding vortices over Japan from the Asian summer monsoon anticyclone during the summer of ...
←
→
Page content transcription
If your browser does not render page correctly, please read the page content below
Atmos. Chem. Phys., 21, 3073–3090, 2021
https://doi.org/10.5194/acp-21-3073-2021
© Author(s) 2021. This work is distributed under
the Creative Commons Attribution 4.0 License.

Lower-stratospheric aerosol measurements in eastward-shedding
vortices over Japan from the Asian summer monsoon
anticyclone during the summer of 2018
Masatomo Fujiwara1 , Tetsu Sakai2 , Tomohiro Nagai2 , Koichi Shiraishi3 , Yoichi Inai4,a , Sergey Khaykin5 , Haosen Xi6 ,
Takashi Shibata7 , Masato Shiotani8 , and Laura L. Pan9
1 Faculty of Environmental Earth Science, Hokkaido University, Sapporo, 060-0810, Japan
2 Meteorological  Research Institute, Japan Meteorological Agency, Tsukuba, 305-0052, Japan
3 Faculty of Science, Fukuoka University, Fukuoka, 814-0180, Japan
4 Graduate School of Science, Tohoku University, Sendai, 980-8578, Japan
5 LATMOS/IPSL, UVSQ, Sorbonne Université, CNRS, Guyancourt, 78280, France
6 Graduate School of Environmental Science, Hokkaido University, Sapporo, 060-0810, Japan
7 Graduate School of Environmental Studies, Nagoya University, Nagoya, 464-8601, Japan
8 Research Institute for Sustainable Humanosphere, Kyoto University, Uji, 611-0011, Japan
9 National Center for Atmospheric Research, Boulder, CO 80301, USA
a now at: Japan Meteorological Agency, Sapporo, 060-0002, Japan

Correspondence: Masatomo Fujiwara (fuji@ees.hokudai.ac.jp)

Received: 20 September 2020 – Discussion started: 21 October 2020
Revised: 21 January 2021 – Accepted: 26 January 2021 – Published: 1 March 2021

Abstract. Eastward air-mass transport from the Asian sum-        without indicate that the former air masses originated within
mer monsoon (ASM) anticyclone in the upper troposphere           the ASM anticyclone and the latter more from edge regions.
and lower stratosphere (UTLS) often involves eastward-           Reanalysis carbon monoxide and satellite water vapour data
shedding vortices, which can cover most of the Japanese          indicate that eastward-shedding vortices were involved in the
archipelago. We investigated the aerosol characteristics of      observed aerosol enhancements. Satellite aerosol data con-
these vortices by analysing data from two lidar systems          firm that the period and latitudinal region were free from
in Japan, at Tsukuba (36.1◦ N, 140.1◦ E) and Fukuoka             the direct influence of documented volcanic eruptions and
(33.55◦ N, 130.36◦ E), during the summer of 2018. We             high-latitude forest fires. Our results indicate that the Asian
observed several events with enhanced particle signals at        tropopause aerosol layer (ATAL) over the ASM region ex-
Tsukuba at 15.5–18 km of altitude (at or above the lo-           tends east towards Japan in association with the eastward-
cal tropopause) during August–September 2018, with a             shedding vortices and that lidar systems in Japan can detect at
backscattering ratio of ∼ 1.10 and particle depolarization of    least the lower-stratospheric portion of the ATAL during pe-
∼ 5 % (i.e. not spherical, but more spherical than ice crys-     riods when the lower stratosphere is undisturbed by volcanic
tals). These particle characteristics may be consistent with     eruptions and forest fires. The upper-tropospheric portion of
those of solid aerosol particles, such as ammonium nitrate.      the ATAL is either depleted by tropospheric processes (con-
Each event had a timescale of a few days. During the same        vection and wet scavenging) during eastward transport or is
study period, we also observed similar enhanced particle sig-    obscured by much stronger cirrus cloud signals.
nals in the lower stratosphere at Fukuoka. The upper tropo-
sphere is often covered by cirrus clouds at both lidar sites.
Backward trajectory calculations for these sites for days with
enhanced particle signals in the lower stratosphere and days

Published by Copernicus Publications on behalf of the European Geosciences Union.

3074                                                                M. Fujiwara et al.: Aerosols in eastward-shedding vortices

1   Introduction                                                     the ATAL to the Japanese archipelago by averaging Cloud–
                                                                     Aerosol Lidar with Orthogonal Polarization (CALIOP) data
The Asian summer monsoon (ASM) circulation includes                  for July–August 2006–2013, although the role of synop-
a continental-scale anticyclone centred over the Tibetan             tic disturbances, such as eastward-shedding vortices, in the
Plateau, spanning from the Middle East to East Asia in the           ATAL eastward extension does not appear to have been in-
upper troposphere and lower stratosphere (UTLS). Satel-              vestigated using CALIOP data.
lite observations show elevated levels of trace gases of sur-           The “westward” extension of the ATAL to northern mid-
face origin (e.g. Randel et al., 2010; Santee et al., 2017),         latitudes was reported by Khaykin et al. (2017) based on
aerosol particles (e.g. Vernier et al., 2015, 2018), and wa-         ground-based lidar at the Observatoire de Haute-Provence
ter vapour (e.g. Randel et al., 2015; Santee et al., 2017)           (OHP) in southern France (43.9◦ N, 5.7◦ E), with a layer of
within the ASM anticyclone due to active convection in               enhanced aerosol in the lower stratosphere with an average
this region and season. The ASM anticyclone exhibits dis-            backscattering ratio (BSR; related to particle size and den-
tinct sub-seasonal variability due to westward- and eastward-        sity) value of 1.05 being a systematic feature during August–
shedding vortices (e.g. Popovic and Plumb, 2001; Amemiya             October. This aerosol layer was shown to correlate with
and Sato, 2018), with the latter possibly being dynamically          the seasonal water vapour maximum, suggesting the influx
linked to the Bonin (or Ogasawara) high in the western Pa-           of convectively moistened air from the ASM anticyclone,
cific (Enomoto et al., 2003) and constituting a major trans-         whose influence on the extratropical lower stratosphere in
port pathway of ASM air masses to the whole Northern                 late summer to early winter is well known (e.g. Vogel et al.,
Hemisphere (NH) midlatitude UTLS through the westerly                2014; Müller et al., 2016; Rolf et al., 2018).
jet stream (e.g. Garny and Randel, 2013; Vogel et al., 2014,            Some lidar systems currently in operation in Japan are
2016; Ungermann et al., 2016; Pan et al., 2016; Fadnavis             capable of measuring UTLS aerosol characteristics, includ-
et al., 2018; Luo et al., 2018; Honomichl and Pan, 2020).            ing those at the Meteorological Research Institute (MRI)
Eastward-shedding vortex events occur once every 10–20 d             in Tsukuba (36.1◦ N, 140.1◦ E; Sakai et al., 2016) and
during the NH summer, with a horizontal scale of 20–30◦              Fukuoka University, Fukuoka (33.55◦ N, 130.36◦ E; Yasui
longitude (2000–3000 km) and with a few days to 1 week of            et al., 1995). Both systems measure the BSR and particle
influence over the Japanese archipelago (e.g. Honomichl and          depolarization ratio (PDR; related to the degree of parti-
Pan, 2020).                                                          cle non-sphericity). Previous studies using data from these
   The enhanced aerosol particle signature in the ASM an-            systems investigated the impacts of large-scale tropical vol-
ticyclone at 14–18 km of altitude was first discovered from          canic eruptions and other recent eruptions (Uchino et al.,
satellite observations (Vernier et al., 2011) and thereafter re-     1993; Sakai et al., 2016), as well as springtime transport of
ferred to as the Asian tropopause aerosol layer (ATAL). It           dust particles from the Asian continent called “kosa” events
was later verified from in situ balloon-borne measurements           (yellow sand–dust events) (Sakai et al., 2003), amongst oth-
(Vernier et al., 2015, 2018; Yu et al., 2017; Brunamonti et al.,     ers; however, the data have not been investigated extensively
2018; Hanumanthu et al., 2020). Information on the chemical          for the possible detection of the ATAL from ASM circula-
composition of the ATAL particles is limited (e.g. Martins-          tion, i.e. its “eastward” extension, partly because extensive
son et al., 2014; Vernier et al., 2018; Höpfner et al., 2019).       summertime cloud cover often prevents lidar sensing of the
Based on model simulations, the ATAL is expected to con-             UTLS region and partly because ATAL signals are much
sist of carbonaceous and sulfate materials, mineral dust, and        weaker than volcanic signals. In this paper, focusing on the
nitrate particles (e.g. Fadnavis et al., 2013; Gu et al., 2016;      July–September 2018 period, we investigate whether these li-
Lau et al., 2018; Fairlie et al., 2020; Bossolasco et al., 2020).    dars are capable of measuring ATAL signals associated with
Through analysis of satellite and high-altitude aircraft ob-         eastward-shedding vortices from the ASM anticyclone, with
servations and laboratory experiments, Höpfner et al. (2019)         combined analyses of backward trajectories, chemical re-
provided evidence that a considerable part of the ATAL may           analysis data, and satellite data for full understanding of the
contain solid ammonium nitrate (NH4 NO3 ) particles. Their           lidar observations. The remainder of this paper is organized
satellite data analysis using Cryogenic Infrared Spectrome-          as follows. Section 2 describes the lidar and other data anal-
ters and Telescopes for the Atmosphere (CRISTA) data in-             ysed in this paper. Section 3 presents the results and discus-
dicates enhanced NH4 NO3 signals around the tropopause               sion, and Sect. 4 concludes the findings.
in both the ASM region and the western Pacific (including
Japan) during 8–16 August 1997 (with the western Pacific
signals suggestive of shedding vortices); also, their analy-         2     Data description
sis of satellite Michelson Interferometer for Passive Atmo-
spheric Sounding (MIPAS) data together with CRISTA data              2.1    Lidar data
shows that the mass of NH4 NO3 in the ASM region at 13–
17 km peaks around August. It is also noted that Vernier et          The lidar system at the MRI in Tsukuba (36.1◦ N, 140.1◦ E)
al. (2015, their Fig. 2b) showed mean eastward extension of          used in this study is an Nd:YAG system operated at a wave-

Atmos. Chem. Phys., 21, 3073–3090, 2021                                               https://doi.org/10.5194/acp-21-3073-2021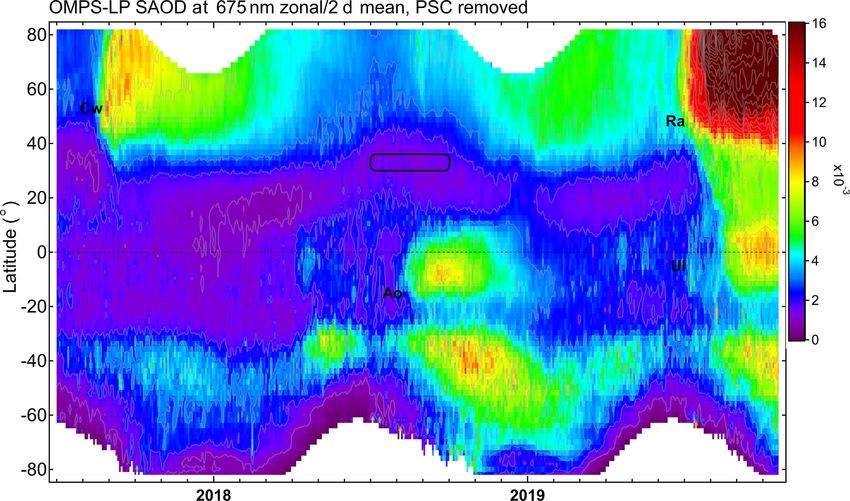
M. Fujiwara et al.: Aerosols in eastward-shedding vortices                                                                     3075

length of 532 nm with capability for both BSR and PDR              an aerosol extinction-to-backscatter ratio of 50 sr over the
measurements (Sakai et al., 2016), which has been operated         whole measurement height range. These assumptions result
continuously since 2002. We define PDR as S/P , where S            in errors in BSR and thus PDR. For example, BSR errors of
and P are the background-subtracted lidar photon counts of         +0.05 and −0.05 result in a bias of −1 % and +3 % in PDR,
the perpendicular (“senkrecht” in German) and parallel com-        respectively, where BSR = 1.1 and TDR = 0.7 %. Based on
ponents, respectively, with respect to the polarization plane      these considerations, we estimate that the total PDR uncer-
of the emitted laser light. The temporal and height resolu-        tainty (random plus bias errors) is ≤ ±5 % PDR.
tions of the original processed data are 5 min and 7.5 m, re-
spectively. Quality control has been done primarily to flag        2.2   Other data
data points influenced by thick cloud layers. To obtain ver-
tical profiles of BSR and PDR with high signal-to-noise ra-        Backward trajectories are calculated with the trajectory
tios, data were averaged over 150 m and 3 h, with time inter-      model used by Inai (2018) and Inai et al. (2018) as well
vals of 18:00–21:00, 21:00–00:00, 00:00–03:00, and 03:00–          as the most recent global atmospheric reanalysis dataset by
06:00 local time (LT) for the use in this paper. BSR data were     the European Centre for Medium-Range Weather Forecasts
normalized to unity at 30–33 km of altitude where aerosol          (ECMWF), ERA5 (Hersbach et al., 2020), with 37 pressure
backscattering is assumed to be negligible, and PDR values         levels up to 1 hPa and horizontal and temporal resolutions of
were obtained using the method of Adachi et al. (2001).            0.25◦ × 0.25◦ and 1 h, respectively. ERA5 temperature data
   The lidar system at Fukuoka (33.55◦ N, 130.36◦ E) used          in the tropical tropopause layer have been evaluated by Tegt-
in this study is also an Nd:YAG system operated at a               meier et al. (2020). Lagrangian transport calculations using
wavelength of 532 nm with PDR measurement capability.              ERA5 and its predecessor ERA-Interim have been compared
This system has been operated manually only during nights          by Hoffmann et al. (2019) and Li et al. (2020).
under clear-sky and/or non-rainy conditions; during July–             The Copernicus Atmosphere Monitoring Service (CAMS)
September 2018, the system was operated on 11 nights. Ver-         atmospheric composition reanalysis dataset produced by the
tical profiles were averaged over 900 m and 4 h for each night     ECMWF (Inness et al., 2019) is used to analyse signatures
for the use in this paper. The PDR for Fukuoka is originally       of the ASM anticyclone and its eastward-shedding vortices,
defined as S/(P + S), which has been converted to S/P for          with 25 pressure levels up to 1 hPa and horizontal and tem-
this paper.                                                        poral resolutions of 0.75◦ × 0.75◦ and 3 h, respectively. Car-
   The uncertainties of lidar data discussed here are applica-     bon monoxide (CO), temperature (T ), and geopotential (8)
ble to both systems. The BSR uncertainties were estimated          data are primarily analysed in this paper. CO is chosen be-
as follows. The random component was estimated from the            cause it is a good tracer for polluted air of surface origin (e.g.
photon counts of the backscatter signals at 532 nm after tem-      Luo et al., 2018). Although CO and ATAL aerosol particles
poral and vertical averaging by assuming Poisson statistics.       do not necessarily have the same emission sources, CO is
Other sources of BSR uncertainties (biases) were estimated         a good chemical tracer to indicate the location of the ASM
by assuming the uncertainty of the normalization value of          anticyclone. CO data on pressure levels are projected onto
BSR to be 8.5 × 10⁻³ (Russell et al., 1979, 1982) and that         isentropic surfaces using temperature data. In the CAMS,
of the extinction-to-backscatter ratio to be 30 sr (Jäger and      the Measurement of Pollution in the Troposphere (MOPITT)
Hofmann, 1991; Jäger et al., 1995). The total uncertainty of       thermal infrared (TIR) satellite total-column CO data are as-
BSR was then estimated to be 2 %–3 %, typically around the         similated, but Microwave Limb Sounder (MLS) and Infrared
tropopause. The PDR uncertainties were estimated from the          Atmospheric Sounding Interferometer (IASI) CO data are
parallel and perpendicular components of backscatter signals       not. CAMS CO data are originally provided as mass mix-
at 532 nm. Other sources of PDR uncertainties (biases) in-         ing ratios (kg kg−1 ), which are converted to volume mixing
clude (1) the uncertainty in calibration of the total depolar-     ratios (ppbv) for this study. It is noted that a quick com-
ization ratio (TDR), due to both particles and air molecules,      parison (not shown) with MLS version 4.2 level 2 CO data
and (2) the BSR uncertainty. Uncertainty (1) was estimated         (Santee et al., 2017; Livesey et al., 2020) at a 400 K isen-
as follows. In the TDR calibration (Adachi et al., 2001), we       tropic surface (in the form of a longitude–time diagram like
subtracted depolarization caused by the lidar system (DEP-         the one in Sect. 3.2) shows that CAMS CO data are roughly
sys) estimated from the observed TDR and BSR obtained in           ∼ 10 ppbv greater than MLS CO over Japan during August–
the altitude region where aerosol backscattering is negligible     September 2018, but it also shows that eastward extension
(i.e. BSR equals unity, and TDR equals the molecular depo-         signals coming over Japan agree fairly well qualitatively
larization ratio) or where spherical particles predominate (i.e.   within the differences in spatio-temporal sampling of the two
in lower-tropospheric water clouds). DEPsys errors result in       datasets. The CAMS dataset also includes different types of
PDR bias. For example, a DEPsys error of ±0.2 % results            aerosol particles, but they are not included in this study be-
in a ±2 % bias in PDR, where BSR = 1.1. Uncertainty (2)            cause relevant variables such as aerosol BSR and NH4 NO3
arises mainly from our assumption that aerosol backscatter-        concentration are not included. The Montgomery stream-
ing is negligible at 30–33 km of altitude. We also assumed         function (MSF), defined as MSF = cp T + 8, where cp is the

https://doi.org/10.5194/acp-21-3073-2021                                            Atmos. Chem. Phys., 21, 3073–3090, 2021
3076 M. Fujiwara et al.: Aerosols in eastward-shedding vortices
specific heat of dry air at constant pressure, in isentropic co- ing vertical profiles are shown in Fig. 2. Because the PDR
ordinates corresponds to geopotential (height) in isobaric co- has more missing data points, the TDR time–height distri-
ordinates (e.g. Popovic and Plumb, 2001; Santee et al., 2017; bution is also shown in Fig. A1. Days with missing data
Amemiya and Sato, 2018; Salby, 1996) and is thus a good (white regions; Fig. 1) are due to thick summertime rain
dynamical indicator of the ASM anticyclone. Potential vor- clouds in the lower to middle troposphere, which prevented
ticity (PV) on isentropic surfaces (e.g. at 360–380 K) is often the laser light from reaching the middle stratosphere. How-
used as a dynamical tracer in studies of the ASM anticyclone ever, some events with enhanced particle signals are evident
(e.g. Popovic and Plumb, 2001; Garny and Randel, 2013; just above the tropopause at 15.5–18 km and last for a few
Ploeger et al., 2015; Amemiya and Sato, 2018); however, PV days, mainly in August but with some in September. In par-
at and above 400 K (the isentropic surface we will focus on in ticular, the event peaking at around 21 August and span-
Sect. 3.2) is not very useful to analyse the ASM anticyclone ning 18–26 August was the strongest one among the events
boundary. Thus, we will analyse MSF at the 400 K surface that the lidars successfully measured during the 3-month pe-
calculated from CAMS data. riod. We also observe another strong event around 9 August
MLS version 4.2 level 2 water vapour data (Santee et at 15–17 km, although missing observations before and af-
al., 2017; Livesey et al., 2020) are analysed because water ter this date prevent characterization of the temporal scale
vapour is also a good tracer of the ASM anticyclone. We of the event; furthermore, the tropopause height was highly
use MLS data rather than CAMS data for lower-stratospheric variable at the time and was located at 17 km on that date,
water vapour because MLS data have been well validated situating the aerosol-enhanced layer temporarily in the tro-
with e.g. balloon-borne frost-point hygrometers (e.g. Hurst posphere. Figure 2 shows that enhanced particle signals at
et al., 2016; Fujiwara et al., 2010; Vömel et al., 2007), while 15.5–18 km were often observed in August and sometimes
reanalysis water vapour data are in general less reliable in in September but not in July. Typical BSR and PDR values
the lower stratosphere (e.g. Davis et al., 2017). We found of enhanced signals are ∼ 1.10 (1.07–1.18) and ∼ 5 % (3 %–
(not shown) that CAMS water vapour volume mixing ratio 10 %), respectively (Figs. 1 and 2). Below the tropopause,
data (converted from the original specific humidity data) are strong signals were sometimes recorded with BSR values of
greater than MLS data at the 400 K isentropic surface over > 1.25 and with PDR values
10 %. In general, the PDR
Japan during July–September 2018 (e.g. the differences are values are 0 % for spherical particles (i.e. water clouds in the
roughly ∼ 2 ppmv for the wet signals around the longitudes troposphere and liquid H2 SO4 particles in the stratosphere)
of Japan in August 2018). and > 25 %–30 % for ice cirrus particles (e.g. Sakai et al.,
The possible influence of volcanic eruptions and wildfire 2003; Fujiwara et al., 2009). Strong signals in the upper tro-
events is investigated using two satellite aerosol particle posphere are thus due to ice cirrus clouds. Enhanced signals
datasets, one providing vertical extinction profile data in the lower stratosphere (15.5–18 km) may be due to solid
at 675 nm from the Ozone Mapping and Profiler Suite particles, as indicated by PDR values of ∼ 5 % (3 %–10 %).
(OMPS) Limb Profiler (LP), level 2 version 1.5 (Chen et Taking PDR uncertainties (Sect. 2.1) into account, these val-
al., 2018), and the other attenuated scattering ratio data ues can be considered small but non-zero. The PDR values of
from the CALIOP on board the Cloud–Aerosol Lidar these signals, together with the region being above the local
and Infrared Pathfinder Satellite Observation (CALIPSO) tropopause in most cases, strongly suggest that they are not
satellite (Thomason et al., 2007; Winker et al., 2007, 2010). ice cirrus particles. However, the possibility of a mixture of
CALIOP level 3 monthly mean stratospheric aerosol data spherical H2 SO4 particles (i.e. background stratospheric sul-
(CAL_LID_L3_Stratospheric_APro-Standard-V1-00) are fate particles) and highly non-spherical particles, such as ice,
used in this study; in this data product, clouds and polar volcanic ash (Prata et al., 2017), and wildfire smoke (Haarig
stratospheric clouds (PSCs) have been removed based on the et al., 2018), cannot be precluded only with our lidar data.
information of particulate extinction-to-backscatter (lidar) We will come back to this issue in Sect. 3.3 after investigat-
ratio and the multiple-scattering factor profile (Young and ing other data. Before looking at the Fukuoka results, it is
Vaughan, 2009; Kim et al., 2018; https://www-calipso.larc. noted that for Tsukuba we do not plot the data with a “rel-
nasa.gov/resources/calipso_users_guide/data_summaries/l3/ ative” uncertainty of PDR larger than 30 %; this treatment
lid_l3_stratospheric_apro_v1-00_v01_desc.php, last access: resulted in removing data points with BSR values lower than
24 February 2021). ∼ 1.05 at which background spherical sulfate particles (with
PDR values of < 2 %) were presumably predominant.
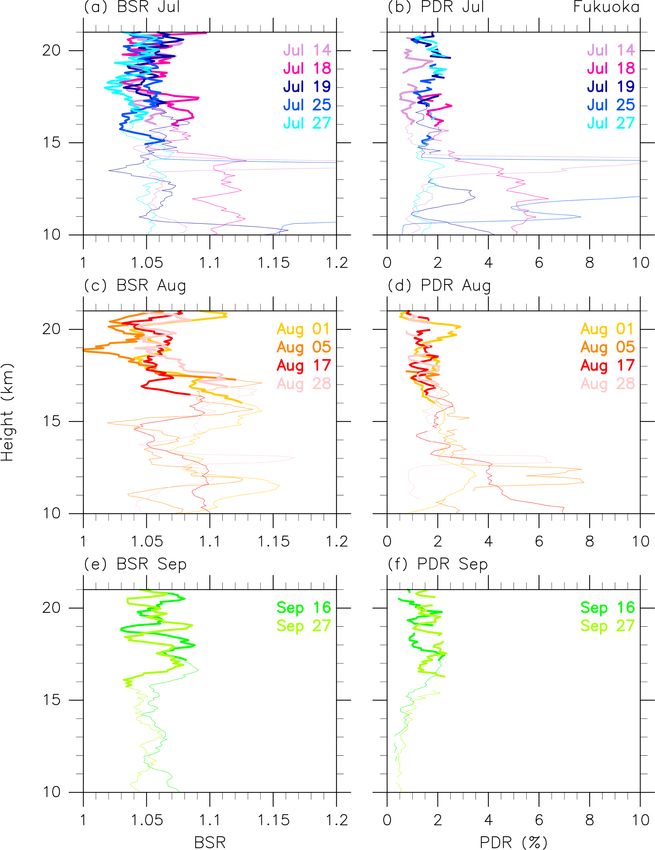
Vertical profiles of BSR and PDR observed at Fukuoka for
3 Results and discussion 11 clear-sky and/or non-rainy nights during July–September
2018 are shown in Fig. 3. Again, enhanced particle signals
3.1 Lidar measurements were observed mainly in August above the tropopause at
15.5–18 km. The BSR values were in the range 1.09–1.14,
Time–height distributions of BSR and PDR observed in the with PDR values of 1 %–3 %, which are smaller than those
UTLS at Tsukuba are shown in Fig. 1, and the correspond- observed at Tsukuba. It should be noted that the dates of lidar
Atmos. Chem. Phys., 21, 3073–3090, 2021 https://doi.org/10.5194/acp-21-3073-2021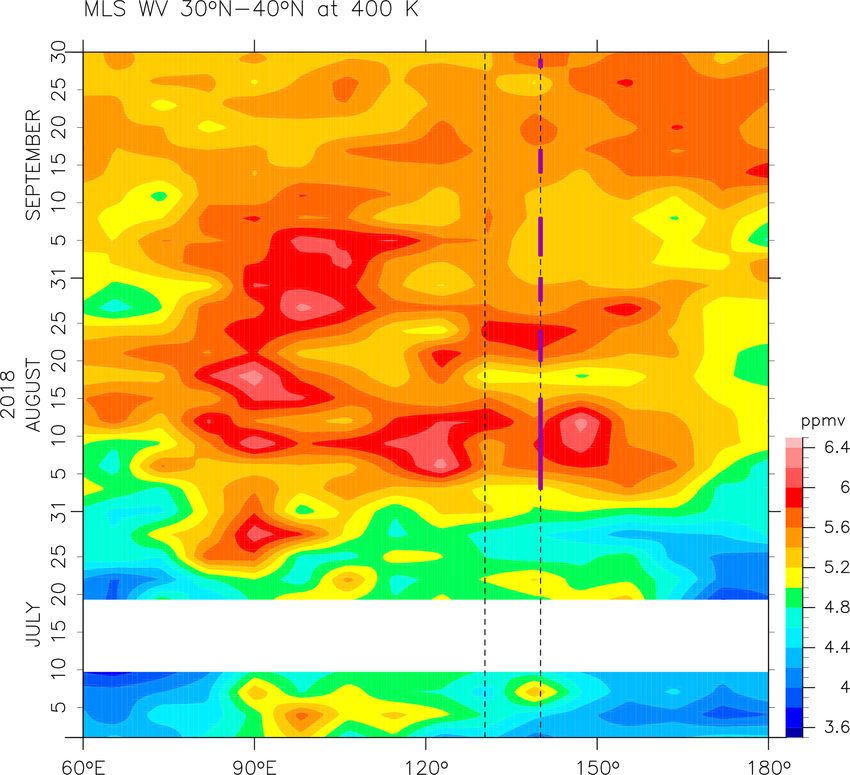
M. Fujiwara et al.: Aerosols in eastward-shedding vortices 3077
Figure 1. Time–height distributions of (a) the backscattering ratio and (b) particle depolarization ratio (%) during July–September 2018, as
measured using the lidar system at MRI, Tsukuba. For each day, four time slots (i.e. 18:00–21:00, 21:00–00:00, 00:00–03:00, and 03:00–
06:00 LT) are prepared, with 3 h averaged data filling the slots where thick lower to middle tropospheric clouds do not exist. Red dots indicate
the daily (first) lapse-rate tropopause locations determined by the Japan Meteorological Agency (JMA) based on 21:00 LT radiosonde data
taken at the JMA Tateno site (which shares the same site as the MRI).
operation at Fukuoka did not overlap those at Tsukuba when anticyclone, CO concentration is > 65 ppbv). These trajecto-
strong enhancement was observed above the tropopause (e.g. ries indicate that air masses over both stations come mainly
9, 18–26 August and 9 September), perhaps partly explaining from the west, sometimes via the north of Japan (indica-
the differences between Figs. 2 and 3. tive of the existence of vortices), and originate from the
ASM anticyclone well within 10 d. They also indicate that
3.2 Trajectories and air masses air masses with enhanced aerosol particles at this height tend
to originate in regions within the ASM anticyclone at alti-
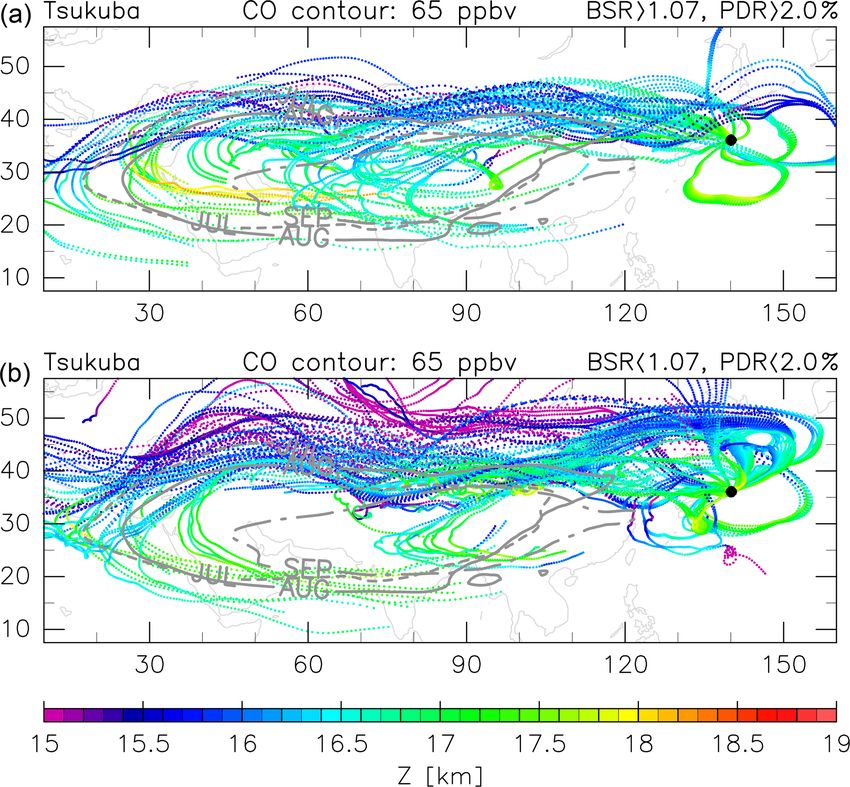
The 10 d kinematic backward trajectories (using vertical tudes of 16.5–18 km, i.e. around or just below the tropopause,
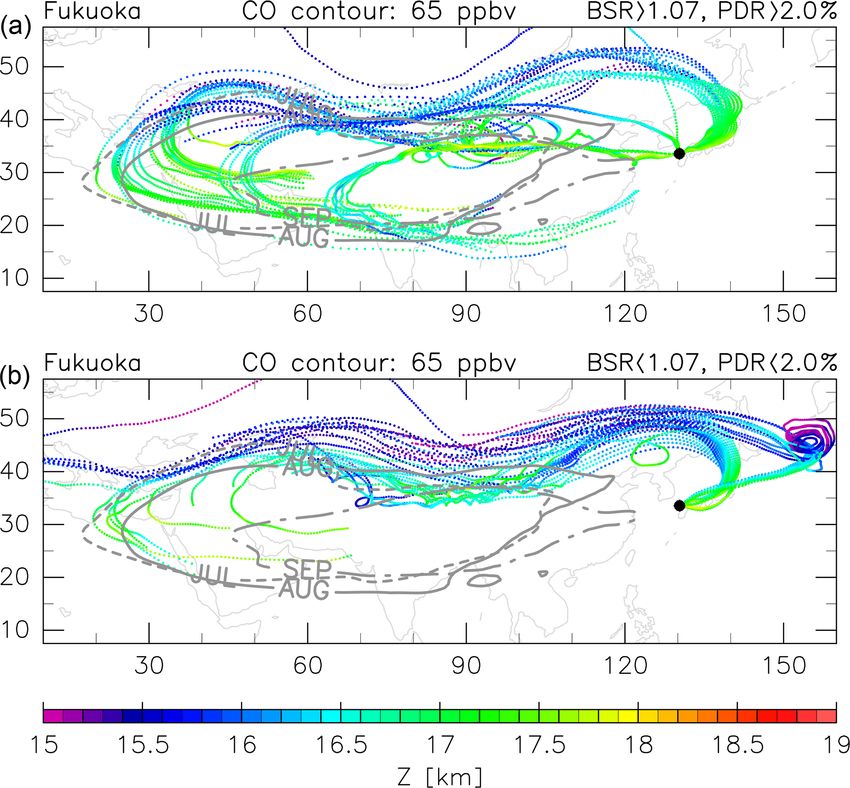
wind) from Tsukuba and Fukuoka are shown in Figs. 4 and whereas those without enhanced aerosol particles tend to
5, respectively, with contrasting cases with or without aerosol originate from edge regions surrounding the anticyclone.
particle enhancement in the 390–410 K potential temperature Note that there is a trajectory that originates in the Pacific
range (around 16.5–17.5 km at these stations). A potential south of Japan as low as 4 km (Fig. 4b, a small-scale spiral
temperature of 400 K corresponds to altitudes of ∼ 17.1 km in purple); this is associated with upward transport in the ty-
at Tsukuba and ∼ 17.3 km at Fukuoka on average during phoon Soulik.
July–September 2018 (based on twice-daily radiosonde data Horizontal distributions of CO and MSF at the 400 K
at each site, taken from http://weather.uwyo.edu/upperair/ potential temperature surface during 18–23 August 2018
sounding.html, last access: 24 February 2021), i.e. near the from the CAMS reanalysis data are shown in Fig. 6. Again,
centre of the lower-stratospheric BSR enhancement. By com- note that a potential temperature of 400 K corresponds to
paring the results from Santee et al. (2017) with our own ∼ 17.1 km at Tsukuba and ∼ 17.3 km at Fukuoka during
analysis, the 65 ppbv contours of monthly mean CAMS CO July–September 2018. The distribution of MSF indicates the
data at 400 K potential temperature are chosen as an index location of the ASM anticyclone from the dynamical view-
of the boundaries of the ASM anticyclone (i.e. within the point. The strongest particle signals during the 3 months
https://doi.org/10.5194/acp-21-3073-2021 Atmos. Chem. Phys., 21, 3073–3090, 2021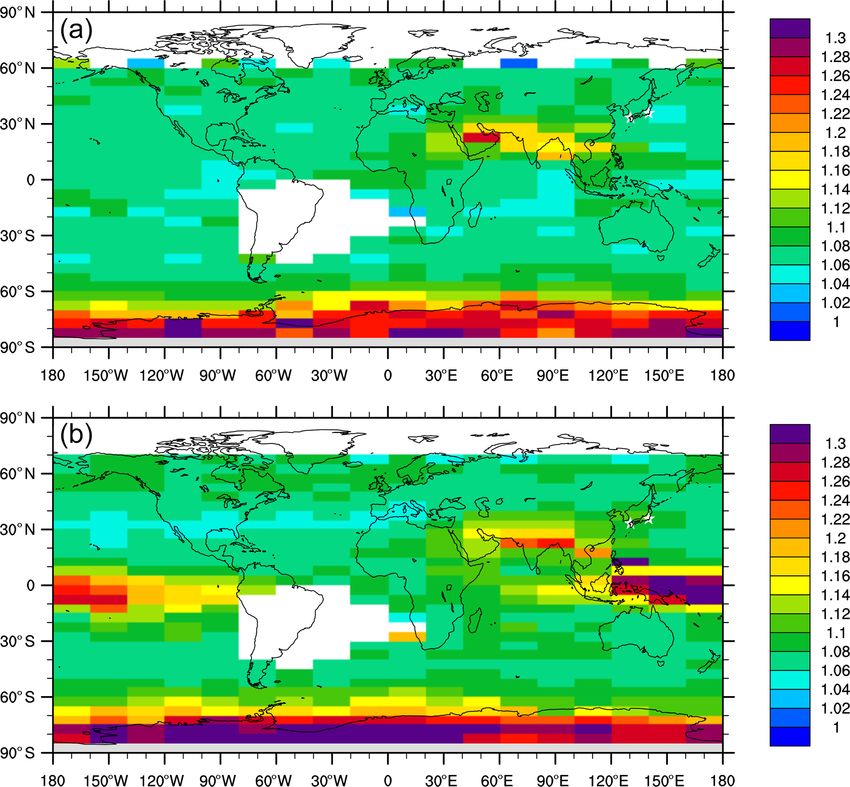
3078                                                                    M. Fujiwara et al.: Aerosols in eastward-shedding vortices

Figure 2. Vertical profiles of (a, c, e) the backscattering ratio (BSR) and (b, d, f) particle depolarization ratio (PDR, in %) in (a, b) July,
(c, d) August, and (e, f) September 2018 obtained using the lidar system at MRI, Tsukuba. It is noted that strong and noisy signals in BSR
below ∼ 15.5 km are due to cirrus clouds.

were observed on 21 August in the lower stratosphere over                 tices are often located slightly to the north at around 25–
Tsukuba. The air mass with high CO concentrations was                     45◦ N, as indicated in Figs. 4–6; the latitude band must there-
transported eastward from the ASM anticyclone centred over                fore be chosen carefully, depending on the research focus. In
the Tibetan Plateau (Fig. 6), with an anticyclonic vortex of              Fig. 7, the 60 ppbv CO contour may be a good indicator of
∼ 20◦ longitude scale reaching the Japanese archipelago on                eastward-shedding vortices. In July 2018, the eastward ex-
21 August, providing a clear signature of eastward-shedding               tension was weak, but in August there were three events that
vortices from the ASM anticyclone (e.g. Luo et al., 2018).                directly affected the two lidar sites on 3–15, 20–24 (Fig. 6),
Daily averaged longitude–time CO distributions over 30–                   and 28–31 August. In September, there were three events
40◦ N are shown in Fig. 7, with that latitude band chosen here            on 3–8, 14–17, and 28–29 September. A comparison with
because it includes the two lidar sites. The ASM anticyclone              Fig. 1 indicates that aerosol-particle-enhanced events corre-
spans roughly 15–40◦ N, whereas the eastward-shedding vor-                spond relatively well to CO-enhanced events, although miss-

Atmos. Chem. Phys., 21, 3073–3090, 2021                                                      https://doi.org/10.5194/acp-21-3073-2021
M. Fujiwara et al.: Aerosols in eastward-shedding vortices                                                                             3079

Figure 3. A total of 11 vertical profiles of (a, c, e) the backscattering ratio (BSR) and (b, d, f) particle depolarization ratio (PDR, in %)
in (a, b) July, (c, d) August, and (e, f) September 2018 obtained using the lidar system at Fukuoka. Dates and colours are assigned in the
legend where, for example, “Jul 14” refers to the night of 14–15 July. The stratospheric portion of the profiles has been thickened using the
daily (first) lapse-rate tropopause location information provided by the JMA based on operational 21:00 LT radiosonde data taken at the JMA
Fukuoka site (at a ∼ 4 km distance from the lidar site).

ing lidar data points (due to low-level clouds) result in only           over Japan correspond well with the CO-enhanced events
the 20–24 August event being relatively well observed, with              over the same region shown in Fig. 7.
the 3–15 August event being captured only on 9 August. The
ASM anticyclone is also characterized as an air mass hy-                 3.3   Investigation of other potential causes
drated by active convection from below (e.g. Santee et al.,
2017). The longitude–time distribution of MLS water vapour               Lidar is sensitive to various types of volcanic aerosol (e.g.
at 400 K, averaged over 30–40◦ N with 8◦ longitude and 3 d               Yasui et al., 1996; Sakai et al., 2016; Khaykin et al., 2017).
bins, is shown in Fig. 8. The water-vapour-enhanced events               The lower stratosphere is continuously influenced by vol-
                                                                         canic eruptions (GVP, 2013), which inject various types of

https://doi.org/10.5194/acp-21-3073-2021                                                   Atmos. Chem. Phys., 21, 3073–3090, 2021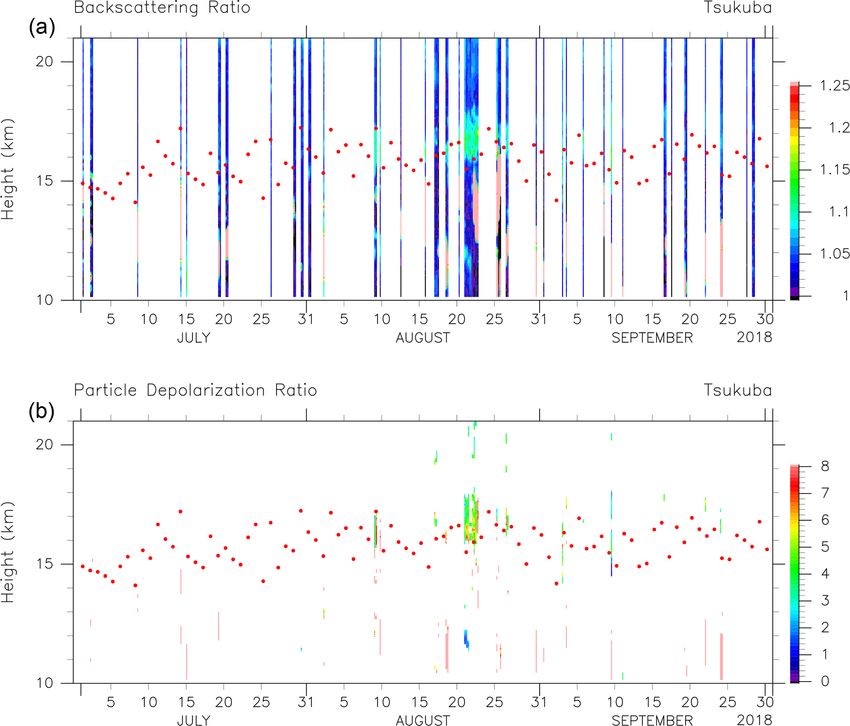
3080                                                                   M. Fujiwara et al.: Aerosols in eastward-shedding vortices

Figure 4. Kinematic backward trajectories for 10 d starting             Figure 5. As for Fig. 4, but for trajectories from Fukuoka with
from Tsukuba in the 390–410 K potential temperature range at            (a) 44 and (b) 37 trajectories.
100 m geopotential height intervals on all days during July–
September 2018 on which measurements were made using ERA5
reanalysis data. Cases are sorted into two categories: (a) with and     eruption of Ambae (or Aoba; 15.389◦ S, 167.835◦ E; GVP,
(b) without enhanced aerosol signals observed by lidar at the tra-      2019), Vanuatu, in the tropical western Pacific, caused in-
jectory starting points. The conditions and number of trajectories      creasing stratospheric AOD in the tropics. We also observed
for the former and the latter cases are respectively BSR > 1.07 and     very weak signals around the same latitude from the begin-
PDR > 2.0 % with 78 trajectories and BSR < 1.07 and PDR < 2.0 %
                                                                        ning of April 2018, possibly due to the eruption of Ambae
with 136 trajectories. Colours indicate geopotential height (Z) val-
ues of the trajectories. Grey contours indicate 65 ppbv monthly
                                                                        again during March–April 2018 (GVP, 2018). However, the
mean CAMS CO levels at 400 K potential temperature, roughly in-         lower-stratospheric AOD at 25–40◦ N was relatively low dur-
dicating monthly mean boundaries of the ASM anticyclone (dotted         ing July–September 2018, at least on a zonal-mean scale. The
for July, solid for August, and dash-dotted for September).             monthly mean CALIOP attenuated scattering ratio distribu-
                                                                        tion due to aerosol particles at 17 km in July and August 2018
                                                                        is shown in Fig. 10 where the ATAL is evident, with en-
                                                                        hanced aerosol signals over the ASM region. In August there
particles and gases into the atmosphere (e.g. Robock, 2000).            was also a hint of eastward extension of the ATAL to Japan,
Among them, solid ash particles may remain in the strato-               with a slight increase in the scattering ratio. By August, ef-
sphere for up to a few months, while liquid H2 SO4 particles            fects of the Ambae eruption had extended to about half of
resulting from the reaction of volcanic SO2 and H2 S gases              the tropics but had not reached Japan directly, at least not in
with OH and H2 O may remain for a year or more. Aerosol                 a monthly mean view (see also the 10 d backward trajecto-
particles are also emitted from biomass burning and forest              ries; Figs. 4 and 5).
fires, and although these particles rarely reach the strato-               Finally, Chouza et al. (2020) showed that lidar measure-
sphere, extensive fire events can influence the stratospheric           ments at Mauna Loa, Hawaii, indicated no signals from vol-
aerosol loading (e.g. Khaykin et al., 2018, 2020; Peterson et           canic eruptions during the summer of 2018. Also, at the
al., 2018; Kablick et al., 2020). In this section, the global           OHP lidar site in France (43.9◦ N, 5.7◦ E), no enhancement
lower-stratospheric aerosol loading during the summer of                in the lower-stratospheric aerosol abundance was observed
2018 is investigated through an analysis of satellite aerosol           during the summer of 2018. In summary, enhanced aerosol
data.                                                                   particle signals observed at Tsukuba (36.1◦ N) and Fukuoka
   The time–latitude distribution of zonal-mean lower-                  (33.55◦ N) were unlikely to be due to volcanic eruptions or
stratospheric aerosol optical depth (AOD) at 675 nm from                northern wildfires.
the OMPS LP satellite instrument is shown in Fig. 9. At
high NH latitudes, the lower-stratospheric AOD increased in
the summer of 2017 due to extensive wildfires in Canada
(Khaykin et al., 2018; Peterson et al., 2018), but their in-
fluence became negligible by early 2018. In July 2018, the

Atmos. Chem. Phys., 21, 3073–3090, 2021                                                  https://doi.org/10.5194/acp-21-3073-2021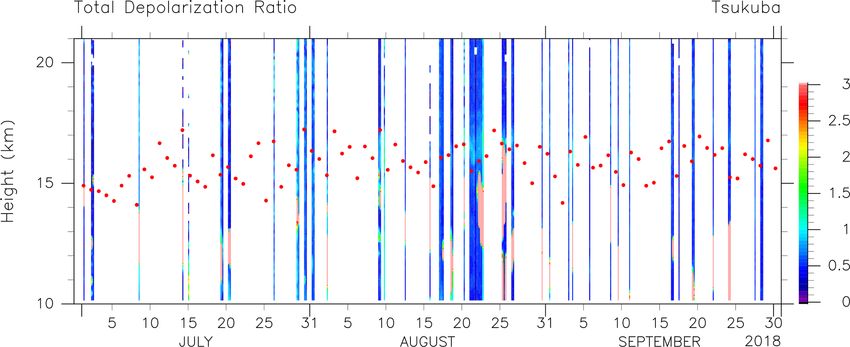
M. Fujiwara et al.: Aerosols in eastward-shedding vortices                                                                         3081

Figure 6. Horizontal distribution of daily instantaneous (00:00 UTC) CO (black contours with grey tone, with intervals of 10 ppbv) and
the Montgomery streamfunction (MSF; coloured contours at intervals of 0.01 × 10⁵ m2 s−2 ) at the 400 K potential temperature level during
18–23 August 2018 (dates indicated at the top right of each plot) using CAMS reanalysis data.

4   Summary and conclusions                                            and PDR values of ∼ 5 % (3 %–10 %) at Tsukuba, with sim-
                                                                       ilar BSR but lower PDR values at Fukuoka. The PDR dif-
Lidar aerosol particle measurements made at Tsukuba and                ference between the two sites may be due to the Fukuoka
Fukuoka, Japan, during the summer of 2018 were investi-                lidar being operated on only 11 nights during the 3-month
gated to determine whether these lidars are capable of detect-         period and due to the fact that the dates of lidar operation
ing the eastward extension of the ATAL from the ASM anti-              at Fukuoka did not overlap those at Tsukuba when strong
cyclone in the UTLS. Both lidars observed enhanced aerosol             enhancement was observed. The lidars often detected strong
particle signals between the local tropopause and up to a few          signals (BSR values of > 1.25 and PDR values  10 %) due
kilometres above it, with BSR values of ∼ 1.10 (1.07–1.18)

https://doi.org/10.5194/acp-21-3073-2021                                                 Atmos. Chem. Phys., 21, 3073–3090, 2021
3082 M. Fujiwara et al.: Aerosols in eastward-shedding vortices
Figure 8. As for Fig. 7, but for water vapour (in ppmv) at 400 K
measured with the satellite MLS instrument. Data for the 30–40◦ N
Figure 7. Longitude–time distribution of the daily averaged CO
region have been aggregated into 3 d and 8◦ longitude bins, each
concentration at 400 K potential temperature averaged over 30–
constituting about 10 individual data points. The white region indi-
40◦ N using CAMS reanalysis data. The contour interval is 10 ppbv,
cates missing measurements. The purple line segments are the same
with 65 ppbv contours added (dotted). Vertical dotted lines indi-
as the orange ones in Fig. 7.
cate the locations of the two lidar sites in Fukuoka (130.36◦ E)
and Tsukuba (140.1◦ E); furthermore, the periods along the longi-
tude of Tsukuba when the CO concentration was ≥∼ 60 ppbv (i.e.
3–15, 20–24, and 28–31 August, as well as 3–8, 14–17, and 28–
29 September) are shown as orange line segments.
to ice cirrus clouds below the tropopause. The Tsukuba mea-
surements indicate that timescales of lower-stratospheric en-
hancements are a few days. Backward trajectory calculations
and reanalysis CO data support the hypothesis that air masses
with enhanced aerosol signals originate in the ASM anticy-
clone and are transported over these sites in association with
eastward-shedding vortices. OMPS LP and CALIOP satellite
data indicated that the 25–40◦ N region was not influenced
by volcanic eruptions or extensive biomass burning events Figure 9. Time–latitude distribution of zonal-mean and 2 d mean
during July–September 2018. Our results indicate that the lower-stratospheric aerosol optical depth at 675 nm between the
enhanced aerosol particle levels measured at Tsukuba and tropopause and 21 km of altitude from July 2017 to October 2019,
Fukuoka are due to eastward-shedding vortices of the ATAL as calculated from OMPS LP satellite data. The tropopause alti-
from the ASM anticyclone; i.e. they originated from pollu- tude for each OMPS LP profile was provided within the OMPS LP
tants emitted from Asian countries and were transported ver- dataset. Signals due to polar stratospheric clouds (PSCs) have been
tically by convection in the ASM region. removed. Major events that significantly enhanced NH stratospheric
aerosol loading are labelled: Cw, Canadian wildfires in the summer
The PDR values obtained at Tsukuba, i.e. ∼ 5 % (3 %–
of 2017; Ao, Ambae (Aoba) eruption, Vanuatu (July 2018); Ra,
10 %), suggest that these enhanced particles are solid par-
Raikoke eruption, Kuril Islands, Russia (June 2019); Ul, Ulawun
ticles rather than spherical liquid H2 SO4 particles (PDR eruption, Papua New Guinea (July, August, and October 2019)
∼ 0 %) or cirrus ice particles (PDR > 25 %–30 %). A recent (GVP, 2013). The rectangular box indicates the period and location
laboratory experiment by Wagner et al. (2020a) showed PDR of the lidar measurements; white regions indicate missing measure-
values of ∼ 9.5 % for solid NH4 NO3 particles at 488 nm. ments.
(Also, Wagner et al., 2020b, showed electron microscope im-
ages of solid NH4 NO3 particles, which are “of rather com-
pact shape with aspect ratios predominantly in the range from
Atmos. Chem. Phys., 21, 3073–3090, 2021 https://doi.org/10.5194/acp-21-3073-2021M. Fujiwara et al.: Aerosols in eastward-shedding vortices 3083 Figure 10. Monthly mean horizontal distribution of attenuated scattering ratio at 17.042 km observed with the CALIOP satellite instrument in (a) July 2018 and (b) August 2018. Spatial bins are 5◦ in latitude, 20◦ in longitude, and 900 m in altitude. Clouds and PSCs have been removed (Sect. 2.2). It is noted that the CALIOP attenuated scattering ratio is defined as the ratio of the measured attenuated backscatter coefficients and the attenuated backscatter coefficients calculated from the molecular model, and its valid range is from 0.60 to 25.00. The two lidar station locations are marked with white stars. White regions indicate missing measurements (see Noel et al., 2014, for the data missing over the South Atlantic region). 0.80 to 1.25”.) Thus, the values obtained with our lidars in et al., 2016; Lau et al., 2018; Fairlie et al., 2020), which are Japan might be consistent with those of solid NH4 NO3 par- solid. ticles suggested by Höpfner et al. (2019). Note that Sakai Lower-stratospheric aerosol enhancement over Japan was et al. (2010) investigated PDR values of other particle types observed mainly during August–September and seldom in at 532 nm in laboratory experiments; among these particles, July. This may be partly explained by the seasonality of the sub-micrometre sea salt and ammonium sulfate crystals (e.g. concentration of solid NH4 NO3 particles in the ASM anticy- Plate 9, pp. 237–239 of Pruppacher and Klett, 1997) were clone (Höpfner et al., 2019), peaking in August with signif- found to have PDR values of ∼ 8 % and ∼ 4 %, respectively. icant year-to-year variations. Furthermore, June and July are Small non-zero PDR values can occur if enhanced liquid in the rainy season for most of Japan, in association with the H2 SO4 particles and fresh ash particles from volcanic erup- “baiu” frontal system (e.g. Ninomiya and Shibagaki, 2007). tions are mixed, although satellite data indicate this is less In July 2018, severe rainfall and flood events occurred early plausible (Sect. 3.3). However, it should be noted that the in the month (Shimpo et al., 2019), after which many parts lidar BSR and PDR measurements cannot exclude the possi- of Japan experienced high surface temperatures with cumu- bility of the co-existence of other types of solid aerosol parti- lonimbus clouds in several areas. Typhoons, synoptic low cles such as mineral dust (e.g. modelling work by Lau et al., systems, and frontal systems affected Japan through the end 2018; in situ measurements by Vernier et al., 2018), black of September 2018, with these rainfall and thick cloud events carbon (e.g. modelling work by Gu et al., 2016), and some preventing the lidars from sensing the lower stratosphere, types of carbonaceous aerosols (e.g. modelling works by Gu causing many of the missed data slots in Fig. 1. https://doi.org/10.5194/acp-21-3073-2021 Atmos. Chem. Phys., 21, 3073–3090, 2021
3084                                                             M. Fujiwara et al.: Aerosols in eastward-shedding vortices

   In summary, part of the ATAL in the ASM anticyclone air
mass is transported eastward and passes over Japan in the
UTLS. Lidars in Japan can observe the lower-stratospheric
portion of these aerosol particles if conditions permit, with
summertime active convection and various weather systems
often preventing their sensing of the lower stratosphere. Vol-
canic eruptions and extensive wildfires may complicate the
detection of particles of ATAL origin over Japan. The upper-
tropospheric portion of these particles is either depleted by
tropospheric processes (convection and wet scavenging) or
obscured by much stronger cirrus cloud signals. Despite
the limited sampling, the lidar detection of ATAL particles
verifies eastward UTLS transport associated with the sub-
seasonal-scale dynamics of the ASM anticyclone, a process
observed by satellite instruments and predicted by models.
The spatial extent and chemical and aerosol content of this
transport process are the main focus of an upcoming airborne
field campaign, the Asian summer monsoon Chemical and
Climate Impact Project (ACCLIP; Pan et al., 2019), which is
scheduled to take place over the western Pacific during July–
August 2022.

Atmos. Chem. Phys., 21, 3073–3090, 2021                                           https://doi.org/10.5194/acp-21-3073-2021
M. Fujiwara et al.: Aerosols in eastward-shedding vortices                                                     3085

Appendix A

The time–height distribution of TDR at Tsukuba is shown in
Fig. A1, complementing Fig. 1b (PDR distribution).

Figure A1. As for Fig. 1, but for the total depolarization ratio (TDR, %).

https://doi.org/10.5194/acp-21-3073-2021                                     Atmos. Chem. Phys., 21, 3073–3090, 2021
3086                                                                     M. Fujiwara et al.: Aerosols in eastward-shedding vortices

Data availability. Lidar data analysed in this study can be down-         Amemiya, A. and Sato, K.: A two-dimensional dynamical model for
loaded from the following websites: https://mri-2.mri-jma.go.               the subseasonal variability of the Asian monsoon anticyclone, J.
jp/owncloud/s/GrNGNiGKzq8tjqH (Sakai, 2021) for Tsukuba                     Atmos. Sci., 75, 3597–3612, https://doi.org/10.1175/JAS-D-17-
and https://www.cis.fukuoka-u.ac.jp/~ksiraisi/LidarDataArchive/             0208.1, 2018.
Fukuoka_2018summer.zip (Shiraishi, 2021) for Fukuoka. ERA5                Bossolasco, A., Jegou, F., Sellitto, P., Berthet, G., Kloss, C., and
and CAMS data can be downloaded from the Copernicus                         Legras, B.: Global modelling studies of composition and decadal
website, the former from https://cds.climate.copernicus.eu                  trends of the Asian Tropopause Aerosol Layer, Atmos. Chem.
(European Commission et al., 2021a) and the latter from                     Phys. Discuss. [preprint], https://doi.org/10.5194/acp-2020-677,
https://ads.atmosphere.copernicus.eu (European Commission et                in review, 2020.
al., 2021b). MLS version 4.2 level 2 data can be downloaded from          Brunamonti, S., Jorge, T., Oelsner, P., Hanumanthu, S., Singh,
https://acdisc.gesdisc.eosdis.nasa.gov/data/Aura_MLS_Level2/                B. B., Kumar, K. R., Sonbawne, S., Meier, S., Singh, D.,
(NASA, 2021a). OMPS LP level 2 version 1.5 data can be                      Wienhold, F. G., Luo, B. P., Boettcher, M., Poltera, Y., Jauhi-
downloaded from https://snpp-omps.gesdisc.eosdis.nasa.gov/data              ainen, H., Kayastha, R., Karmacharya, J., Dirksen, R., Naja, M.,
(NASA, 2021b). CALIOP data can be downloaded from                           Rex, M., Fadnavis, S., and Peter, T.: Balloon-borne measure-
https://asdc.larc.nasa.gov/search (NASA, 2021c).                            ments of temperature, water vapor, ozone and aerosol backscat-
                                                                            ter on the southern slopes of the Himalayas during Stra-
                                                                            toClim 2016–2017, Atmos. Chem. Phys., 18, 15937–15957,
Author contributions. MF, MS, and LLP designed the study. TeS,              https://doi.org/10.5194/acp-18-15937-2018, 2018.
TN, and KS operated the lidar systems, and MF, TeS, and KS anal-          Chen, Z., Bhartia, P. K., Loughman, R., Colarco, P., and De-
ysed lidar data and drafted the paper. YI calculated trajectories. MF       Land, M.: Improvement of stratospheric aerosol extinction re-
and HX analysed CAMS data. SK and MF analysed MLS data. SK                  trieval from OMPS/LP using a new aerosol model, Atmos.
analysed OMPS LP data, while TaS analysed CALIOP data. All au-              Meas. Tech., 11, 6495–6509, https://doi.org/10.5194/amt-11-
thors contributed to the interpretation and reviewed and edited the         6495-2018, 2018.
paper.                                                                    Chouza, F., Leblanc, T., Barnes, J., Brewer, M., Wang, P., and Koon,
                                                                            D.: Long-term (1999–2019) variability of stratospheric aerosol
                                                                            over Mauna Loa, Hawaii, as seen by two co-located lidars and
Competing interests. The authors declare that they have no conflict         satellite measurements, Atmos. Chem. Phys., 20, 6821–6839,
of interest.                                                                https://doi.org/10.5194/acp-20-6821-2020, 2020.
                                                                          Davis, S. M., Hegglin, M. I., Fujiwara, M., Dragani, R., Harada,
                                                                            Y., Kobayashi, C., Long, C., Manney, G. L., Nash, E. R., Pot-
                                                                            ter, G. L., Tegtmeier, S., Wang, T., Wargan, K., and Wright, J.
Acknowledgements. This study was financially supported by a
                                                                            S.: Assessment of upper tropospheric and stratospheric water va-
grant for mission research on the sustainable humanosphere from
                                                                            por and ozone in reanalyses as part of S-RIP, Atmos. Chem.
the Research Institute for Sustainable Humanosphere (RISH), Ky-
                                                                            Phys., 17, 12743–12778, https://doi.org/10.5194/acp-17-12743-
oto University, Japan, for the fiscal years 2019–2020. We thank
                                                                            2017, 2017.
the undergraduate students at the Faculty of Science, Fukuoka
                                                                          Enomoto, T., Hoskins, B. J., and Matsuda, Y.: The formation mech-
University, who operated the lidar system at Fukuoka. The GFD-
                                                                            anism of the Bonin high in August, Q. J. Roy. Meteor. Soc., 129,
DENNOU library was used for producing Figs. 1–8 and A1. We
                                                                            157–178, https://doi.org/10.1256/qj.01.211, 2003.
thank Nawo Eguchi and Suginori Iwasaki for valuable comments
                                                                          European Commission, Copernicus, and ECMWF: Climate Data
on the draft paper. We also thank two anonymous reviewers and
                                                                            Store, available at: https://cds.climate.copernicus.eu, last access:
Michelle Santee for valuable comments and suggestions.
                                                                            24 February 2021a.
                                                                          European Commission, Copernicus, and ECMWF: Atmosphere
                                                                            Data Store, available at: https://ads.atmosphere.copernicus.eu,
Financial support. This study was financially supported by a grant          last access: 24 February 2021b.
for mission research on the sustainable humanosphere from the Re-         Fadnavis, S., Semeniuk, K., Pozzoli, L., Schultz, M. G., Ghude,
search Institute for Sustainable Humanosphere (RISH), Kyoto Uni-            S. D., Das, S., and Kakatkar, R.: Transport of aerosols into the
versity, Japan, for the fiscal years 2019–2020.                             UTLS and their impact on the Asian monsoon region as seen in
                                                                            a global model simulation, Atmos. Chem. Phys., 13, 8771–8786,
                                                                            https://doi.org/10.5194/acp-13-8771-2013, 2013.
Review statement. This paper was edited by Rolf Müller and re-            Fadnavis, S., Roy, C., Chattopadhyay, R., Sioris, C. E., Rap, A.,
viewed by Michelle Santee and two anonymous referees.                       Müller, R., Kumar, K. R., and Krishnan, R.: Transport of trace
                                                                            gases via eddy shedding from the Asian summer monsoon anti-
                                                                            cyclone and associated impacts on ozone heating rates, Atmos.
                                                                            Chem. Phys., 18, 11493–11506, https://doi.org/10.5194/acp-18-
References                                                                  11493-2018, 2018.
                                                                          Fairlie, T. D., Liu, H., Vernier, J., Campuzano-Jost, P., Jimenez,
Adachi, H., Shibata, T., Iwasaka, Y., and Fujiwara, M.: Calibra-            J. L., Jo, D. S., Zhang, B., Natarajan, M., Avery, M. A.,
  tion method for the lidar-observed stratospheric depolarization           and Huey, G.: Estimates of regional source contributions to
  ratio in the presence of liquid aerosol particles, Appl. Optics, 40,      the Asian Tropopause Aerosol Layer using a chemical trans-
  6587–6595, https://doi.org/10.1364/AO.40.006587, 2001.

Atmos. Chem. Phys., 21, 3073–3090, 2021                                                      https://doi.org/10.5194/acp-21-3073-2021
M. Fujiwara et al.: Aerosols in eastward-shedding vortices 3087 port model, J. Geophys. Res.-Atmos., 125, e2019JD031506, Hoffmann, L., Günther, G., Li, D., Stein, O., Wu, X., Griess- https://doi.org/10.1029/2019jd031506, 2020. bach, S., Heng, Y., Konopka, P., Müller, R., Vogel, B., and Fujiwara, M., Iwasaki, S., Shimizu, A., Inai, Y., Shiotani, Wright, J. S.: From ERA-Interim to ERA5: the considerable M., Hasebe, F., Matsui, I., Sugimoto, N., Okamoto, H., impact of ECMWF’s next-generation reanalysis on Lagrangian Nishi, N., Hamada, A., Sakazaki, T., and Yoneyama, transport simulations, Atmos. Chem. Phys., 19, 3097–3124, K.: Cirrus observations in the tropical tropopause layer https://doi.org/10.5194/acp-19-3097-2019, 2019. over the western Pacific, J. Geophys. Res., 114, D09304, Honomichl, S. B. and Pan, L. L.: Transport from the https://doi.org/10.1029/2008JD011040, 2009. Asian summer monsoon anticyclone over the western Fujiwara, M., Vömel, H., Hasebe, F., Shiotani, M., Ogino, S.- Pacific, J. Geophys. Res.-Atmos., 125, e2019JD032094, Y., Iwasaki, S., Nishi, N., Shibata, T., Shimizu, K., Nishi- https://doi.org/10.1029/2019JD032094, 2020. moto, E., Valverde-Canossa, J. M., Selkirk, H. B., and Olt- Höpfner, M., Ungermann, J., Borrmann, S., Wagner, R., Spang, R., mans, S. J.: Seasonal to decadal variations of water vapor in the Riese, M., Stiller, G., Appel, O., Batenburg, A. M., Bucci, S., tropical lower stratosphere observed with balloon-borne cryo- Cairo, F., Dragoneas, A., Friedl-Vallon, F., Hünig, A., Johansson, genic frostpoint hygrometers, J. Geophys. Res., 115, D18304, S., Krasauskas, L., Legras, B., Leisner, T., Mahnke, C., Möhler, https://doi.org/10.1029/2010JD014179, 2010. O., Molleker, S., Müller, R., Neubert, T., Orphal, J., Preusse, P., Garny, H. and Randel, W. J.: Dynamic variability of the Asian mon- Rex, M., Saathoff, H., Stroh, F., Weigel, R., and Wohltmann, I.: soon anticyclone observed in potential vorticity and correlations Ammonium nitrate particles formed in upper troposphere from with tracer distributions, J. Geophys. Res.-Atmos., 118, 13421– ground ammonia sources during Asian monsoons, Nat. Geosci., 13433, https://doi.org/10.1002/2013JD020908, 2013. 12, 608–612, https://doi.org/10.1038/s41561-019-0385-8, 2019. Gu, Y., Liao, H., and Bian, J.: Summertime nitrate aerosol in Hurst, D. F., Read, W. G., Vömel, H., Selkirk, H. B., Rosenlof, the upper troposphere and lower stratosphere over the Tibetan K. H., Davis, S. M., Hall, E. G., Jordan, A. F., and Olt- Plateau and the South Asian summer monsoon region, Atmos. mans, S. J.: Recent divergences in stratospheric water vapor Chem. Phys., 16, 6641–6663, https://doi.org/10.5194/acp-16- measurements by frost point hygrometers and the Aura Mi- 6641-2016, 2016. crowave Limb Sounder, Atmos. Meas. Tech., 9, 4447–4457, GVP (Global Volcanism Program): Volcanoes of the World, v. https://doi.org/10.5194/amt-9-4447-2016, 2016. 4.9.0 (04 Jun 2020), Bulletin of the Global Volcanism Network, Inai, Y.: Long-term variation in the mixing fraction of tropo- https://doi.org/10.5479/si.GVP.VOTW4-2013, 2013. spheric and stratospheric air masses in the upper tropical GVP (Global Volcanism Program): Report on Ambae (Van- tropopause layer, J. Geophys. Res.-Atmos., 123, 4890–4909, uatu), Bulletin of the Global Volcanism Network, 43, https://doi.org/10.1029/2018JD028300, 2018. https://doi.org/10.5479/si.GVP.BGVN201807-257030, 2018. Inai, Y., Aoki, S., Honda, H., Furutani, H., Matsumi, Y., Ouchi, GVP (Global Volcanism Program): Report on Ambae (Van- M., Sugawara, S., Hasebe, F., Uematsu, M., and Fujiwara, M.: uatu), Bulletin of the Global Volcanism Network, 44, Balloon-borne tropospheric CO2 observations over the equato- https://doi.org/10.5479/si.GVP.BGVN201902-257030, 2019. rial eastern and western Pacific, Atmos. Environ., 184, 24–36, Haarig, M., Ansmann, A., Baars, H., Jimenez, C., Veselovskii, https://doi.org/10.1016/j.atmosenv.2018.04.016, 2018. I., Engelmann, R., and Althausen, D.: Depolarization and Inness, A., Ades, M., Agustí-Panareda, A., Barré, J., Benedic- lidar ratios at 355, 532, and 1064 nm and microphysi- tow, A., Blechschmidt, A.-M., Dominguez, J. J., Engelen, R., cal properties of aged tropospheric and stratospheric Cana- Eskes, H., Flemming, J., Huijnen, V., Jones, L., Kipling, Z., dian wildfire smoke, Atmos. Chem. Phys., 18, 11847–11861, Massart, S., Parrington, M., Peuch, V.-H., Razinger, M., Remy, https://doi.org/10.5194/acp-18-11847-2018, 2018. S., Schulz, M., and Suttie, M.: The CAMS reanalysis of at- Hanumanthu, S., Vogel, B., Müller, R., Brunamonti, S., Fadnavis, mospheric composition, Atmos. Chem. Phys., 19, 3515–3556, S., Li, D., Ölsner, P., Naja, M., Singh, B. B., Kumar, K. R., https://doi.org/10.5194/acp-19-3515-2019, 2019. Sonbawne, S., Jauhiainen, H., Vömel, H., Luo, B., Jorge, T., Jäger, H. and Hofmann, D.: Midlatitude lidar backscatter to mass, Wienhold, F. G., Dirkson, R., and Peter, T.: Strong day-to- area, and extinction conversion model based on in situ aerosol day variability of the Asian Tropopause Aerosol Layer (ATAL) measurements from 1980 to 1987, Appl. Optics, 30, 127, in August 2016 at the Himalayan foothills, Atmos. Chem. https://doi.org/10.1364/ao.30.000127, 1991. Phys., 20, 14273–14302, https://doi.org/10.5194/acp-20-14273- Jäger, H., Deshler, T., and Hofmann, D. J.: Midlatitude li- 2020, 2020. dar backscatter conversions based on balloonborne aerosol Hersbach, H., Bell, B., Berrisford, P., Hirahara, S., Horányi, A., measurements, Geophys. Res. Lett., 22, 1729–1732, Muñoz-Sabater, J., Nicolas, J., Peubey, C., Radu, R., Schep- https://doi.org/10.1029/95GL01521, 1995. ers, D., Simmons, A., Soci, C., Abdalla, S., Abellan, X., Bal- Kablick III, G. P., Allen, D. R., Fromm, M. D., and Nedoluha, samo, G., Bechtold, P., Biavati, G., Bidlot, J., Bonavita, M., G. E.: Australian pyroCb smoke generates synoptic-scale strato- Chiara, G., Dahlgren, P., Dee, D., Diamantakis, M., Dragani, R., spheric anticyclones, Geophys. Res. Lett., 47, e2020GL088101, Flemming, J., Forbes, R., Fuentes, M., Geer, A., Haimberger, https://doi.org/10.1029/2020GL088101, 2020. L., Healy, S., Hogan, R. J., Hólm, E., Janisková, M., Keeley, Khaykin, S. M., Godin-Beekmann, S., Keckhut, P., Hauchecorne, S., Laloyaux, P., Lopez, P., Lupu, C., Radnoti, G., Rosnay, P., A., Jumelet, J., Vernier, J.-P., Bourassa, A., Degenstein, D. A., Rozum, I., Vamborg, F., Villaume, S., and Thépaut, J.: The ERA5 Rieger, L. A., Bingen, C., Vanhellemont, F., Robert, C., DeLand, global reanalysis, Q. J. Roy. Meteor. Soc., 146, 1999–2049, M., and Bhartia, P. K.: Variability and evolution of the midlati- https://doi.org/10.1002/qj.3803, 2020. tude stratospheric aerosol budget from 22 years of ground-based https://doi.org/10.5194/acp-21-3073-2021 Atmos. Chem. Phys., 21, 3073–3090, 2021
3088                                                                    M. Fujiwara et al.: Aerosols in eastward-shedding vortices

   lidar and satellite observations, Atmos. Chem. Phys., 17, 1829–       NASA: NASA GES DISK Aura MLS level 2 data, avail-
   1845, https://doi.org/10.5194/acp-17-1829-2017, 2017.                    able at: https://acdisc.gesdisc.eosdis.nasa.gov/data/Aura_MLS_
Khaykin, S. M., Godin-Beekmann, S., Hauchecorne, A., Pelon,                 Level2/, last access: 24 February 2021a.
   J., Ravetta, F., and Keckhut, P.: Stratospheric smoke with            NASA: NASA GES DISK SNPP OMPS data, available at: https:
   unprecedentedly high backscatter observed by lidars above                //snpp-omps.gesdisc.eosdis.nasa.gov/data, last access: 24 Febru-
   southern France, Geophys. Res. Lett., 45, 1639–1646,                     ary 2021b.
   https://doi.org/10.1002/2017GL076763, 2018.                           NASA: Atmospheric Science Data Center, available at: https://asdc.
Khaykin, S. M., Legras, B., Bucci, S., Sellitto, P., Isaksen,               larc.nasa.gov/search, last access: 24 February 2021c.
   L., Tencé, F., Bekki, S., Bourassa, A., Rieger, L., Zawada,           Ninomiya, K. and Shibagaki, Y.: Multi-scale features of the Meiyu-
   D., Jumelet, J., and Godin-Beekmann, S.: The 2019/20 Aus-                Baiu front and associated precipitation systems, J. Meteorol. Soc.
   tralian wildfires generated a persistent smoke-charged vortex            Jpn., 85, 103–122, https://doi.org/10.2151/jmsj.85B.103, 2007.
   rising up to 35 km altitude, Commun. Earth Environ., 1, 22,           Noel, V., Chepfer, H., Hoareau, C., Reverdy, M., and Cesana, G.:
   https://doi.org/10.1038/s43247-020-00022-5, 2020.                        Effects of solar activity on noise in CALIOP profiles above the
Kim, M.-H., Omar, A. H., Tackett, J. L., Vaughan, M. A., Winker,            South Atlantic Anomaly, Atmos. Meas. Tech., 7, 1597–1603,
   D. M., Trepte, C. R., Hu, Y., Liu, Z., Poole, L. R., Pitts, M. C.,       https://doi.org/10.5194/amt-7-1597-2014, 2014.
   Kar, J., and Magill, B. E.: The CALIPSO version 4 automated           Pan, L. L., Honomichl, S. B., Kinnison, D. E., Abalos,
   aerosol classification and lidar ratio selection algorithm, At-          M., Randel, W. J., Bergman, J. W., and Bian, J.: Trans-
   mos. Meas. Tech., 11, 6107–6135, https://doi.org/10.5194/amt-            port of chemical tracers from the boundary layer to strato-
   11-6107-2018, 2018.                                                      sphere associated with the dynamics of the Asian sum-
Lau, W. K. M., Yuan, C., and Li, Z.: Origin, maintenance                    mer monsoon, J. Geophys. Res.-Atmos., 121, 14159–14174,
   and variability of the Asian Tropopause Aerosol Layer                    https://doi.org/10.1002/2016JD025616, 2016.
   (ATAL): The roles of Monsoon dynamics, Sci. Rep., 8, 3960,            Pan, L. L., Kinnison, D., Liang, Q., Atlas, E., Bresch, J., Case, P.,
   https://doi.org/10.1038/s41598-018-22267-z, 2018.                        Fujiwara, M., Honomichl, S., Lait, L., Newman, P., Nishi, N.,
Li, D., Vogel, B., Müller, R., Bian, J., Günther, G., Ploeger, F.,          Randel, B., Smith, R., Tilmes, S., and Toon, B.: Progress in the
   Li, Q., Zhang, J., Bai, Z., Vömel, H., and Riese, M.: Dehy-              Asian summer monsoon Chemical and Climate Impact Project
   dration and low ozone in the tropopause layer over the Asian             (ACCLIP), AGU Fall Meeting 2019, 13 December 2019, San
   monsoon caused by tropical cyclones: Lagrangian transport cal-           Francisco, CA, USA, A51K-2788, 2019.
   culations using ERA-Interim and ERA5 reanalysis data, At-             Peterson, D. A., Campbell, J. R., Hyer, E. J., Fromm, M.
   mos. Chem. Phys., 20, 4133–4152, https://doi.org/10.5194/acp-            D., Kablick III, G. P., Cossuth, J. H., and DeLand, M.
   20-4133-2020, 2020.                                                      T.: Wildfire-driven thunderstorms cause a volcano-like strato-
Livesey, N. J., Read, W. G., Wagner, P. A., Froidevaux, L., Lambert,        spheric injection of smoke, npj Clim. Atmos. Sci., 1, 30,
   A., Manney, G. L., Millán Valle, L. F., Pumphrey, H. C., Santee,         https://doi.org/10.1038/s41612-018-0039-3, 2018.
   M. L., Schwartz, M. J., Wang, S., Fuller, R. A., Jarnot, R. F.,       Ploeger, F., Gottschling, C., Griessbach, S., Grooß, J.-U., Guenther,
   Knosp, B. W., Martinez, E., and Lay, R. R.: Aura Microwave               G., Konopka, P., Müller, R., Riese, M., Stroh, F., Tao, M., Unger-
   Limb Sounder (MLS) Version 4.2x Level 2 and 3 data quality               mann, J., Vogel, B., and von Hobe, M.: A potential vorticity-
   and description document, Technical Report JPL D-33509 Rev.              based determination of the transport barrier in the Asian summer
   E, available at: https://mls.jpl.nasa.gov/, last access: 26 August       monsoon anticyclone, Atmos. Chem. Phys., 15, 13145–13159,
   2020.                                                                    https://doi.org/10.5194/acp-15-13145-2015, 2015.
Luo, J., Pan, L. L., Honomichl, S. B., Bergman, J. W., Ran-              Popovic, J. M. and Plumb, R. A.: Eddy shedding from
   del, W. J., Francis, G., Clerbaux, C., George, M., Liu, X.,              the upper-tropospheric Asian monsoon anticyclone, J.
   and Tian, W.: Space–time variability in UTLS chemical dis-               Atmos. Sci., 58, 93–104, https://doi.org/10.1175/1520-
   tribution in the Asian summer monsoon viewed by limb and                 0469(2001)0582.0.CO;2, 2001.
   nadir satellite sensors, Atmos. Chem. Phys., 18, 12511–12530,         Prata, A. T., Young, S. A., Siems, S. T., and Manton, M. J.: Lidar
   https://doi.org/10.5194/acp-18-12511-2018, 2018.                         ratios of stratospheric volcanic ash and sulfate aerosols retrieved
Martinsson, B. G., Friberg, J., Andersson, S. M., Weigelt, A., Her-         from CALIOP measurements, Atmos. Chem. Phys., 17, 8599–
   mann, M., Assmann, D., Voigtländer, J., Brenninkmeijer, C.               8618, https://doi.org/10.5194/acp-17-8599-2017, 2017.
   A. M., van Velthoven, P. J. F., and Zahn, A.: Comparison be-          Pruppacher, H. R. and Klett, J. D.: Microphysics and Clouds and
   tween CARIBIC Aerosol Samples Analysed by Accelerator-                   Precipitation, Second Revised and Enlarged Edition, Kluwer
   Based Methods and Optical Particle Counter Measurements, At-             Academic Publications, Dordrecht, The Netherlands, 1997.
   mos. Meas. Tech., 7, 2581–2596, https://doi.org/10.5194/amt-7-        Randel, W. J., Park, M., Emmons, L., Kinnison, D., Bernath, P.,
   2581-2014, 2014.                                                         Walker, K. A., Boone, C., and Pumphrey, H.: Asian monsoon
Müller, S., Hoor, P., Bozem, H., Gute, E., Vogel, B., Zahn, A.,             transport of pollution to the stratosphere, Science, 328, 611–613,
   Bönisch, H., Keber, T., Krämer, M., Rolf, C., Riese, M., Schlager,       https://doi.org/10.1126/science.1182274, 2010.
   H., and Engel, A.: Impact of the Asian monsoon on the extrat-         Randel, W. J., Zhang, K., and Fu, R.: What controls strato-
   ropical lower stratosphere: trace gas observations during TACTS          spheric water vapor in the NH summer monsoon re-
   over Europe 2012, Atmos. Chem. Phys., 16, 10573–10589,                   gions?, J. Geophys. Res.-Atmos., 120, 7988–8001,
   https://doi.org/10.5194/acp-16-10573-2016, 2016.                         https://doi.org/10.1002/2015JD023622, 2015.
                                                                         Robock, A.: Volcanic eruptions and climate, Rev. Geophys., 38,
                                                                            191–219, https://doi.org/10.1029/1998RG000054, 2000.

Atmos. Chem. Phys., 21, 3073–3090, 2021                                                     https://doi.org/10.5194/acp-21-3073-2021
You can also read


