Auckland Water Efficiency Plan - 2021 to 2025 - NET
←
→
Page content transcription
If your browser does not render page correctly, please read the page content below
Auckland Water
Efficiency Plan
2021 to 2025
Auckland Water Efficiency Plan 2021-2025
Contents

Foreword                                                          2

Why we need this plan                                              4

Te Mana o te Wai                                                   5

Looking around: where we are                                      6

Where our water comes from                                         7

Where our water goes                                               9

How rainfall affects water demand                                 10

How we use water in Auckland                                      11

Looking back: what have we achieved?                              14

Encouraging Aucklanders to be more water efficient                15

Looking around: the challenges we face                            18

Climate change                                                    19

Population growth                                                 21

Looking ahead: how we intend to meet our targets                  24

Smarter ways to make the most of our water                        25

Focus Area 1: Making every drop of water count by reducing loss   26

Focus Area 2: Improving oversight from source to tap              27

Focus Area 3: Optimising pressure in our network                  28

Focus Area 4: Residential, community and commercial               29
water efficiency

Conclusion                                                        33

Auckland Water Efficiency Plan 2021-2025                           1
Foreword
He waka eke noa focus on Asia. The economic potential of F&B manufacturing
(We’re all in this together) is significant, but we need to grow it sustainably. If we want
this industry to last, we cannot ramp up our manufacturing in
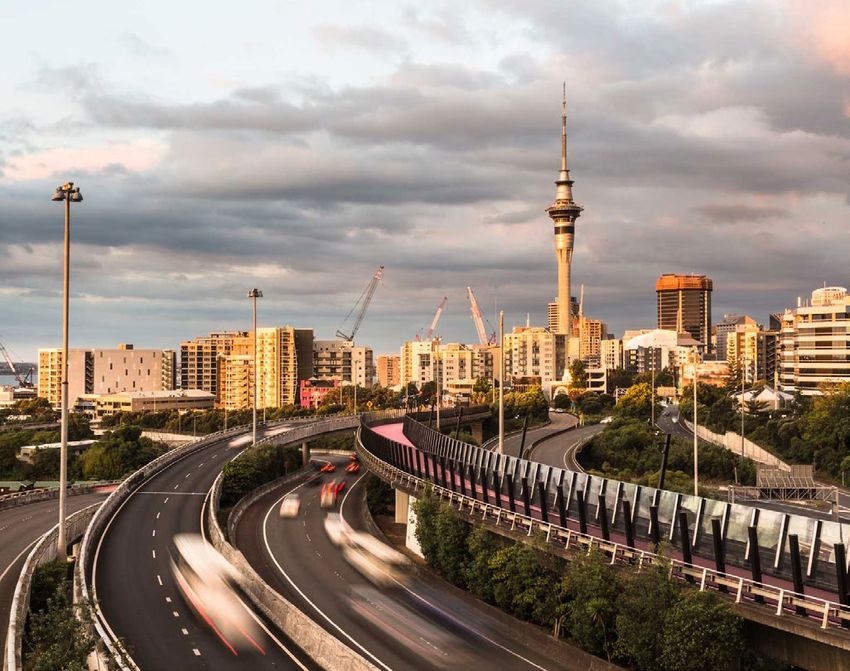
Tāmaki Makaurau is a growing city that thrives from its a way that pollutes and depletes our environment. This is our
relationship with the natural environment. This makes it a great opportunity to grow in a way that is sustainable and world-
place to live, but we need to find ways of balancing increasing leading, and part of that story is how we use the water that
demand for services like water with the resources available. belongs to and is needed by more and more of us.
Auckland is home to a third of New Zealand’s population and If growth in our population and economy are big challenges
is the economic and commercial powerhouse of the country. for Watercare in 2021, climate change is an even bigger one.
Our city grew by 187,000 people from 2013 to 2019, and our It is one of the largest hurdles that we face as a business,
economy (as measured by gross domestic product - GDP) as a people and as a country.
grew by nearly 40% over this time. We are also surrounded
by population growth across the North Island. New Zealand’s The impacts of climate change are often seen through water
four northernmost regions, Northland, Auckland, Waikato, first and therefore become a responsibility that we have to
and the Bay of Plenty, accounted for 60% of the country’s actively consider. Climate change causes new issues to arise
population growth between 2013 and 2019 and these regions and exacerbates problems that already plague us, demanding
are now home to over half of New Zealand’s people. The north of us to change not only what we do but also how we need
of our country is trying to match more growth and livelihoods to do it. We will not be able to remain isolated from the
with the same rain, rivers and aquifers. effects of climate change in other places; we may be called
to accept people who are displaced – regionally, nationally
More and more houses are being built here as construction or internationally – because they will not be able to continue
continues to be a key driver of the Auckland economy. to live in the environment that they call home today. Given
Demand for new housing is booming. Auckland’s construction Auckland’s size and scale, the city’s preparedness for climate
sector growth as measured by GDP doubled between 2011 change will be a cornerstone of our national response, and
and 2018. Developers apply for over 6000 new residential how we manage our water will be key. We know that the
connections to the Auckland water network every year, and water in our dams and rivers is not an infinite resource in the
Kāinga Ora (formerly Housing New Zealand) has plans to build quantities that our growing city demands and therefore is not
more than 43,000 new homes across five redevelopment something that we can take for granted.
areas over the next 20 years. This will replace existing social
housing that is no longer fit for purpose and replace these We will increasingly face extreme weather events, putting
dwellings with new social housing and affordable homes, our water supply at risk, as well as a rise in demand for water
responding to demand for housing in a city that is likely to during hot and dry periods. A single drought is not the same
remain a prized destination into the foreseeable future. as climate change, but the threats to drinking water supply
is one of the most pronounced impacts that this massive
Auckland’s manufacturing sector will continue to grow. global issue will bring. Even slight changes to rainfall, sea
Auckland is the heart of New Zealand’s food and beverage level and temperature will have significant impacts on us and
(F&B) manufacturing and two-thirds of the country’s top generations to come. We will see more frequent droughts and
50 F&B manufacturers are based here. These companies flooding, and rainfall will be a less reliable source of water.
represent 25% of the top 100 largest water users in Auckland, More days with hotter temperatures and longer dry periods
and access to reliable clean water is critical for this sector will cause demand for water to increase, while the assets and
to operate. Growth of F&B manufacturing in Auckland is plants in our water and wastewater systems will face more
supported by nationally funded science and research facilities extreme weather events and the effects of sea level rise.
and export advice and is backed by a strong national brand
that presents New Zealand F&B products as safe, high quality The outcomes for current and future Aucklanders will depend
and trustworthy. F&B manufacturing accounts for 46% of on the decisions we make to mitigate and prepare for the
New Zealand’s total exports per annum and the potential impacts of the city’s growth and climate change now. As we
economic impact in the years to come is considerable. Some look forward to the future, our ability to do more with less of
estimate that F&B processing in New Zealand could treble our water is going to become more and more critical.
over the next 15 years as the market transitions east, away
from our traditional markets in Europe and the US, to fully
Auckland Water Efficiency Plan 2021-2025 2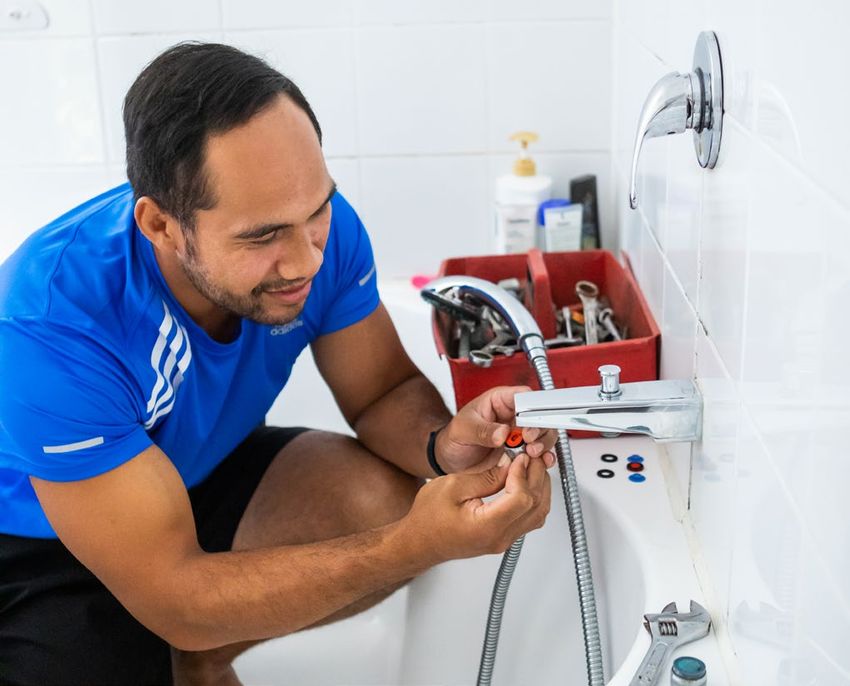
As New Zealanders, we respect the mana of our fresh water:       Unlike previous water efficiency plans, this one has a
te Mana o te Wai. This concept guides how we manage fresh        different purpose. Particularly in light of the recent years
water in New Zealand. We know that water is vital to life        of below-average rainfall, the reason we need to focus on
over and above its financial value. Preserving our drinking      water efficiency is because we want Aucklanders and the
water through water efficiency strategies is an important part   environment we live in to thrive in the longer term. If we can
of a bigger water management system which Watercare is           use and reuse water wisely and stop as much of it being
committed to sustaining and improving.                           wasted as possible, this outcome will be achievable.

This document marks the final stage of Watercare’s               We have also created additional targets to lay some
commitment to the Auckland Three Waters Strategic Plan           foundations for water efficiency before and beyond 2025: the
(2008) which requires Auckland to reduce gross per capita        groundwork we do with this plan is to use units of measurement
consumption by 15% by 2025 (from 2004 levels). The final         that describe efficient use, rather than simply how much is used
reporting period is 2021 to 2025; by 2025 we will know whether   overall. More importantly, we are pursuing water efficiency not
we have achieved the target we set for ourselves in 2008.        because it is the cheaper option but because we are committed
                                                                 to ensuring Auckland remains a healthy, green and resilient city.

                                                                 Jon Lamonte
                                                                 Chief Executive

Auckland Water Efficiency Plan 2021-2025                                                                                          3
Why we need this plan

Almost every aspect of our lives relies on ready access to          As we look ahead, we are putting more effort into fewer
clean water. Without a reliable water supply, individuals,          projects. We are refining our focus and will take a more data-
communities, the environment and economic activity all suffer.      driven approach. For example, a better understanding of our
                                                                    consumption may positively influence our relationship with
For many years, Auckland has had plenty of water and we             water. And that is what we need to focus on.
continue to seek and bring on new sources of water to supply
the city. However, with the growth of the city and the impacts of   Water is a natural treasure that we must value and protect.
extreme weather and climate change, we need to plan ahead.          This plan identifies the targets Watercare will work towards
                                                                    to ensure the efficient delivery and use of water across our
Five of the past seven years have been amongst the warmest          network, and how Watercare and the people of Auckland will
on record in New Zealand,1 followed by a prolonged drought.         work together to look after this precious taonga (treasure)
During 2020 we campaigned hard to urge everyone not to              from now and into the future.
waste water, and then imposed restrictions to help preserve
the water left in our water storage lakes. Since May 2020,
Watercare has been delivering additional supply and worked
to reduce demand – not only to address the drought – but
also to provide Auckland’s growing population with the water
we need to thrive as a healthy and prosperous city. We are
also increasingly exploring sources of non-potable water for
uses that do not require drinking quality water.

Looking forward, given the constraints on our renewals
budget and the changing climate, our water efficiency target
will not be easy to achieve. Higher temperatures lead to
increased demand for water and changing rainfall patterns
will affect our existing water sources. We will continue to
develop new sources of water and do what is within our
capability to strengthen our network so that we make the
most of what we have. However, we will still need Aucklanders
to use water wisely so that there is enough of it to sustain
all of us and the environment we live in. We want people in
Auckland to embrace the idea that collectively we are the
kaitiaki (guardians) of our water.

Auckland Water Efficiency Plan 2021-2025                                                                                             4
Te Mana o te Wai
Māori attitudes to water guide and shape
Watercare’s approach.

To truly appreciate the value of water, we only have to look                      Te Mana o te Wai in freshwater management and the values
at the way Māori understand the interconnected nature of                         of tangata whenua (the people of the land) inform key
the water system. Water is precious in both a spiritual and                      national guidelines to which Watercare is aligned. These
a physical sense. It is a fundamental need. Kei te ora te wai,                   include the Ministry for the Environment’s National Policy
kei te ora te whenua, kei te ora te tangata (when the water is                   Statement for Freshwater and the National Environmental
healthy, the land and the people are nourished).                                 Standards for Drinking Water.1

As New Zealanders, we respect the mana of our fresh water:                       We need to play our part in adopting an integrated approach
Te Mana o te Wai. This concept guides how we manage fresh                        to managing land use and freshwater and work with other
water in New Zealand.                                                            guardians of our water. Therefore, our investment choices
                                                                                 need to show how much we value water. While our decisions
Te Mana o te Wai establishes a hierarchy of obligations where                    are data-driven and we remain a cost-effective provider, we
the well-being of water takes precedence over its use. This                      acknowledge that water is vital to life and valuable over and
means that our discussions about managing fresh water                            above its financial worth. Watercare will seek partnerships
should start with consideration of the health and well-being                     beyond the mandate of service provision and help to bring
of the water. To give effect to Te Mana o te Wai, we must be                     mana back to Auckland’s water system.
respectful about how much water we take (not be wasteful)
and be careful with how we discharge our treated wastewater,
so that people can still swim and fish in the water that is part
of our identity.

Our rivers and lakes – from the mountains to the sea – and
how we care for and use them are a fundamental part of who
we are. We need to care for the wider environment (such as
our land and our trees) because this needs to be healthy to
keep our water healthy.

Our treatment and delivery of water and wastewater, and
all our water efficiency initiatives are only a component of
a much bigger water system. We acknowledge that, overall,
New Zealand’s water environment is in a degraded state.
Mauri (the vital essence) must be restored.

1
    For more information about the Freshwater NPS 2014 (rev. 2017) see Freshwater NPS

Auckland Water Efficiency Plan 2021-2025                                                                                                         5
Looking around:
where we are
Before we can look to the future,
it is important to understand
what is currently happening with
Auckland’s water.

Auckland Water Efficiency Plan 2021-2025   6
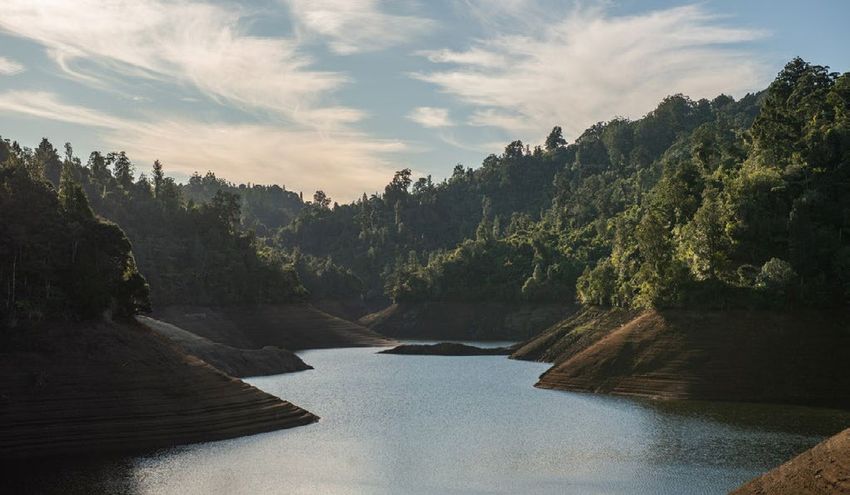
Where our water comes from
Based on our current operations, around 64% of our water          From our treatment plants, water flows along transmission
comes from dams in the Hūnua and Waitākere ranges, and            pipelines through supply points to provide homes,
31% from rivers. We also have a small groundwater source in       businesses, community and government organisations with
Onehunga that supplies around 5% of the city’s water.             high-quality water.

The raw water is processed at treatment plants to remove          We monitor quality throughout the network to make sure that
contaminants. The largest of these plants are in Ardmore,         every customer is supplied safe drinking water that meets:
Titirangi and Tuakau. Of these, Ardmore is the most cost-
effective, while water from Tuakau is the most expensive.         •   The expectations of the New Zealand Drinking Water
When there is enough water in the lakes, we use mostly the            Safety Plan Framework
Ardmore supply to reduce costs. When water is scarcer, we         •   The requirements of the Health (Drinking Water)
protect the southern lakes by using other sources first. Since        Amendment Act 2007
mid-2019, we have maximised our take from the Waikato             •   The Drinking Water Standards for New Zealand
River to the full capacity of the treatment plant, for example.   •   Any new regulations arising from the Three Waters
                                                                      Review by the Minister of Local Government.

64%                                         31%                                    5%
FROM DAMS                                   FROM RIVERS                            GROUND WATER

Auckland Water Efficiency Plan 2021-2025                                                                                      7
Water supply in Auckland: Treatment plants and water sources with daily contribution per source in 2019/2020
Water supply in Auckland – Treatment plants and water sources, with daily contribution per source in 2019/20
Wellsford
Wellsford
Snells-Algies
Snells-Algies
Warkworth
Warkworth
Key:
Key:
Water storage
Water source*dam*
Water treatment
Water treatment plant*
plant*
areaof
Current area ofservice
service
Water supply
Water supplynetwork
network
*scaleindicative
*scale indicativeofofthe
thedaily
daily volume
volume
Helensville
Helensville
Mangakura
Mangakura
Dams
Dams
Muriwai
Muriwai
Waitākere
Waitakere
Waitakere
Waitākere
Dam
Dam
Upper
Upper
Nihotupu Onehunga
Onehunga
Nihotupu
Dam
Dam
Huia
Huia
Upper
Upper Lower
Huia
Huia Nihotupu
Dam Huia
Dam Lower Lower
Huia Dam
Nihotupu
Huia
Village Lower
Village
Huia Dam
Dam
Dam
Cosseys
Ardmore Cosseys
Dam
Dam
Upper
Upper
Hays Mangatawhiri
Mangatangi
Hays Dam
Creek
Creek Dam
Dam
Dam
Mangatangi
Wairoa
Dam
Dam
Wairoa
Dam
Mangatangi
Dam
Bombay
Bombay
Cornwall Rd
Cornwall Rd
Waiuku
Waiuku Waikato River
VictoriaAve
Victoria Ave Treatment Plant
Auckland Water Efficiency Plan 2021-2025 8Where our water goes
Watercare’s sources provide water to at least 1.6 million people The targets in this Water Efficiency Plan have been set up to
and thousands of businesses and organisations in Auckland. provide better oversight of residential usage and non-revenue
water now and into the future. Constraints on our ability to
Our peak summer demand reached a record high of 560 finance our renewals budget mean that we are unable to
million litres per day over several days in February 2020, address leakage to the extent that we would like to. However,
when many people on tank water outside the Auckland we will continue to focus on our non-revenue water to ensure
metropolitan area had run out of water.2 we conserve as much water as we can, using the tools and
the funding available to us.
Non-revenue water includes water lost through leakage,
as well as water lost through unauthorised use, firefighting,
network maintenance and under-reading of meters. While
water leakage in Auckland is an area for concern, and one we
seek to address, it is worth noting that this is by no meansa
unique issue. Water authorities around the world report
similar losses through leakage.
2
In 2020 we began rolling out a new type of connection called Town-to-Tank, which allows people on tank water to connect to the
metropolitan supply using a low-flow connection. This enables them to top up their tanks slowly from town supply as they choose to,
rather than waiting for their tanks to run low and ordering a fill from a tanker at the driest point in summer (i.e. the time of peak demand).
Auckland Water Efficiency Plan 2021-2025 92016
Monthly average of dem
2017
2018
400000
2019
How rainfall affects 2020
2021
water demand 350000
300000
The more summer rainfall
Jul we receive,
Aug theSepless supplied
Oct water Dec
Nov Jan Feb Mar Apr May Jun
the average person uses. The difference can be significant.
The graph below shows that water use was lower in wetter
years such as 2017 and 2018, and notably higher in dry
summers such as 2013, 2019 and 2020.
Average daily demand by month (m3) 2009-2021 (selected years)
575000
525000
475000 2020
2019
2016
425000
2013
2012
2009
375000
325000
Jul Aug Sep Oct Nov Dec Jan Feb Mar Apr May Jun
In hotter and drier summers, Auckland’s average daily consumption of water is significantly higher.
Hot summer days drive demand to levels we have not seen To enable our water treatment plants to cope with Auckland’s
before. Dry weather means that people reliant on tank water record- breaking demand for water, they have been staffed
increasingly need to access Auckland’s water supply network. 24/7 during summer. We need to be especially mindful about
As our population grows and our summers become hotter water use over the hottest summer months to ensure that
and drier, we are seeing significant rises in the city’s summer our treatment plants can manage this extreme demand. This
demand for water. means that we need to help Aucklanders moderate their
consumption.
Auckland Water Efficiency Plan 2021-2025 10How we use water in Auckland
Auckland’s total water use falls into four main categories:
Residential: Bulk:
Water used in homes. Water supplied to other local authorities to
on-sell within their own networks, e.g. Papakura,
Tuakau and Pokeno.
Commercial:
Non-revenue:
Water used by businesses, schools,
Water that is treated and conveyed in Watercare’s
hospitals, etc.
network but cannot be billed to generate revenue.
This includes water used for firefighting and lost
through leakage, under-reading of meters or from
unauthorised usage.
Nature of demand: 2012-2019, by Customer Class (million litres per day)
375
250
125
0
2012 2013 2014 2015 2016 2017 2018 2019
Residential demand Commercial demand Bulk supply Non-revenue water
The breakdown of water demand in Auckland has remained remarkably stable over the years.
Auckland Water Efficiency Plan 2021-2025 11Residential
The average Auckland residential consumption compares well
with other major centres in New Zealand. We have one of the
lowest per capita consumption levels in the country.
Residential PCC
(litres/person/day)
New Zealand
250 Australia
200
150
Auckland
2020
100
50
0
Whangarei Tauranga Nelson Kapiti City West South East Yarra Western Sydney
Coast Water, Water Ltd, Valley Water, Water
Melbourne Melbourne Water, Victoria
Melbourne
Auckland’s residential per capita consumption compares well to similar Australian cities.
Auckland uses less water per capita than other cities in
Australasia. Watercare does not compare as favourably
against some European cities. They have more condensed
housing (with fewer private gardens, for example),
significantly lower levels of network loss and much higher
water charges.3
3
Only 7.6% of tap water is lost in transmission in Denmark. See https://stateofgreen.com/en/partners/state-of-green/news/
danes-water-consumption-the-lowest-ever-recorded/
Auckland Water Efficiency Plan 2021-2025 12Commercial demand Bulk
It stands to reason that the bigger Auckland becomes, the Pokeno, Tuakau and Papakura, which receive bulk water from
more water we use. What is surprising, though, is that the Watercare, face the same future as Auckland in terms of water
nature of demand has remained proportionately stable, even supply. We work closely with the authorities in these areas to
though our economic growth has been greater than our promote water efficiency.
population growth.4 We would have expected the amount
of water used by commercial and other non-residential Non-revenue
organisations to have increased as a proportion of overall
consumption, but that has not happened.
The major component of non-revenue water is what we lose
through leakage. Under-reading of meters and unauthorised
The reason for this is twofold: firstly, we have worked hard use are relatively minor contributors, though we are working
with our key commercial customers (our top 20 customers to address those. Non-revenue water used for firefighting,
use 12% of all of Auckland’s water) to reduce wastage, and of course, is a community contribution we make gladly.
many other companies have adopted water- saving initiatives
over this time. Many large companies and organisations
have undertaken a combination of sustainability and cost-
reduction initiatives to reduce their water use. For instance,
Auckland Council (our second biggest single water consumer)
is continuing its drive to reduce water usage by 30%. Among
many other initiatives, our commercial team has been actively
looking for ways to recycle water in industrial processes
where water does not need to be of drinkable quality.
We are working with commercial customers to reduce waste,
but fully recognise that water use will inevitably increase as
industry grows.5 To understand the gains we make in water
efficiency, we need to look separately at the growth of the
economy and the drinking water supplied to residents.
4
Auckland’s economy rose by 38.5% between 2013 and 2018, https://www.stats.govt.nz/information-releases/regional-gross-domestic-
product-year-ended-march-2018, and the population grew by 15% during this period. https://www.stats.govt.nz/information-releases/2018-
census- population-and-dwelling-counts
5
We still work closely with our commercial customers to ensure that they have access to technology and processes that will help them be
more water efficient, but by thinking beyond set reduction targets, we can better gauge our performance and more actively support theirs.
Auckland Water Efficiency Plan 2021-2025 13Looking back: what have we achieved? Watercare has been looking after Auckland’s water supply for many years, implementing strategies such as the ones described in this document. Before we look ahead, we should reflect honestly on our achievements and where challenges remain. Auckland Water Efficiency Plan 2021-2025 14
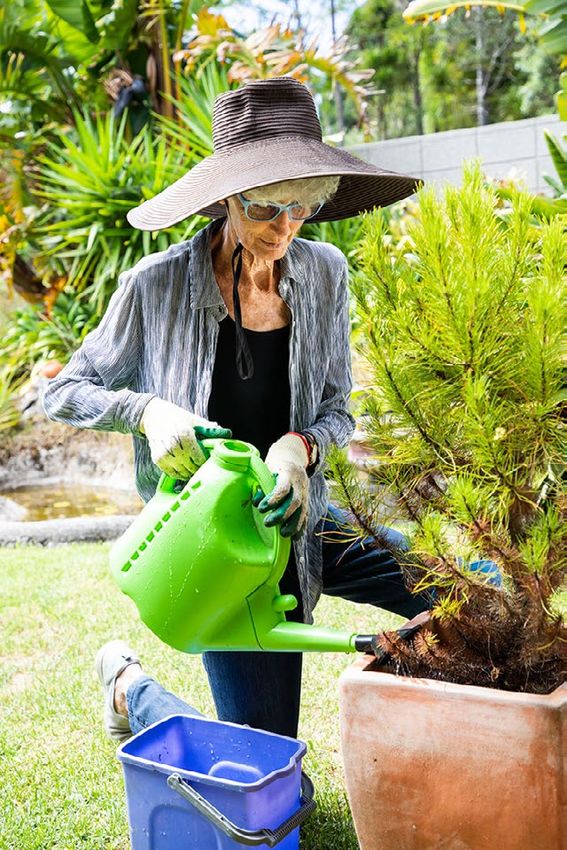
Encouraging Aucklanders to be
more water efficient

Since 2008, we have been committed to reducing gross per-        Residential water efficiency programme
capita demand by 15% by 2025 (compared with 2004 levels).
Our target in 2017 was to reduce consumption to the point        We work with schools and sports clubs to raise awareness
where we would not have to invest in new water sources until     of water efficiency.
2031. However, this goal has proven to be unattainable due
to increased demand as well as weather impacts that have
                                                                 Our school education programme focuses on the water
constrained our water supply.
                                                                 system and stresses the importance of not wasting water.
                                                                 Our lessons are popular in primary and intermediate schools
However, our water efficiency drive is working well. Through     throughout Auckland. There is demand from schools to
the efforts of our commercial customers and the community,       increase the offering to reach twice as many schools.
gross per capita consumption has been declining. This trend
continued as expected until 2019, when extremely hot and
                                                                 Together with Litefoot (an award-winning charitable trust
dry weather raised the summer demand for water to higher
                                                                 that conducts sustainability audits on sports clubs), we
levels than we have ever seen before. The 2020 drought
                                                                 monitored water consumption trends in real-time using
showed how critical it is for everyone in Auckland to take
                                                                 digital meters at 10 sports clubs, with a water-saving
water efficiency seriously, making scarcity of water a reality
                                                                 campaign reaching total of 13,750 members. We installed 70
for many Aucklanders who have continued their good habits
                                                                 water-saving devices, resulting in nine million litres saved.
even under reduced restrictions.

                                                                 Our partnership with EcoMatters gives households
Below, we consider each of the four main pillars of the 2017
                                                                 the opportunity to have their water use audited by a
strategy, with comments on our performance so far.
                                                                 sustainability advisor who comes to their home. Households
                                                                 are then given a tailored report on the water and dollar
Municipal water efficiency programme                             savings they can achieve by changing the way they
                                                                 use water, having maintenance done or changing their
This relates to how Watercare itself and our largest customer,   appliances. Each household is sent a follow-up report on
Auckland Council, use water.                                     their water usage over a six-month period. The key areas
                                                                 covered in audits are education around leak testing, shower
Watercare                                                        time and installing flow restrictors.

Watercare has reduced water usage by reusing water in our
treatment processes. Our four largest wastewater treatment

                                                                 13,750
plants all use recycled water in place of potable (drinkable)
water where possible. In 2019, the Māngere Wastewater
Treatment Plant reused 36 million litres of water per day.

Our other water treatment plants recycle water from the          MEMBERS REACHED
treatment processes as well.

Auckland Council
Auckland Council is working towards saving 30% of water
use via several initiatives. These include amending supply
                                                                 70
agreements to make contractors more responsible for water        WATER-SAVING DEVICES
use, ensuring public parks are only watered when necessary (in   INSTALLED
some cases installing moisture sensors) and fixing leaks. Some
public toilets have been fitted with rain tanks for flushing.

                                                                 9M
                                                                 LITRES SAVED IN 2019

Auckland Water Efficiency Plan 2021-2025                                                                                         15
Commercial water efficiency programme Non-revenue water reduction programme
Our commercial team continues to work with key customers Watercare has made good progress on reducing three aspects
to reduce demand from our largest water users. To date, our of non-revenue water: leakage, under-reading of meters, and
digital meter roll-out project includes 51 high-use commercial unauthorised use.
customers, representing nine different industry segments,
e.g. food manufacturing, education and retail. Twenty-seven Leakage
meters have been deployed in schools and 26 at high-use
sports clubs. In total, 104 digital meters have been installed As noted earlier, there is leakage in every water network.
across high-use sites. We are working with our partners on Our focus to date has been to bring our non-revenue water
how to make the most of the new visibility they have about down to align with global standards.
their water use.
Metering technology helps us to reduce water loss and
We are also investigating the viability of water reuse with improve leak detection. Data we receive from the network is
commercial customers, e.g. in using purified recycled water making it easier for us to know where to look for leaks. This
to irrigate public green spaces. We intend to work with the was seen in our sweep of Māngere and Maungakiekie in 2019
Ministry of Health to develop the required quality standards where we found and fixed more than 600 leaks, saving about
and guidelines and ensure that our customers receive good 1.4 million litres of water per day. We have also developed
advice as to how they might use a ‘cascades of quality’ smaller district metered areas. For instance, Waitākere re-
approach in production where appropriate. established smaller district metered areas to pinpoint the
worst areas for leakage. Such district meters are increasingly
providing real-time data to add to the amount of data we
receive from bulk supply points.
Pressure reduction has also helped to decrease non-revenue
water usage by limiting pressure on pipes and meters so they
are less likely to break and has reduced the amount of water
lost when leaks do occur.
2870+
LEAKS FIXED IN FY2021 (TO DATE)
>6M
LITRES SAVED PER DAY IN FY2021 (TO DATE)
Auckland Water Efficiency Plan 2021-2025 16Meter inaccuracies To combat unauthorised use of water, we:
• Conduct periodic audits on property data where there
In addition to reducing network leakage, we are focusing
are dwellings near the Watercare network without
on addressing domestic meter inaccuracies. Watercare has
known connections. We had to take immediate action
about 450,000 customer meters, of which 30% are more than
in about 10% of cases where properties had
20 years old. With age and consumption over time, these
unauthorised connections.
mechanical meters slow down and under-read consumption.
In some cases, as plumbing fittings and home appliances • Compile information received from Aucklanders who are
become more water efficient, household use has fallen to levels concerned about the misuse of water. This guides us to
that the old meters are too inaccurate to correctly measure. where we should undertake site visits, install security
cameras or provide customer education.
To address this, we have accelerated our aged meter renewal
programme from 20,000 to 30,000 meters per year. Newer • Alert our contractors about the unauthorised use of
meters, with increased accuracy, will help us reduce non- water. This led to a doubling of reports received from
revenue water consumption and also provide valuable detailed them between October and December 2019. Around
insights into water usage. 20% of reports confirmed the unauthorised use of the
water supply. The success of the campaign led to an
ongoing programme of site investigations.
Unauthorised use
To address unauthorised use in the network, we have
established a revenue assurance team at Watercare.
These personnel visit construction sites and other locations
with high water use on a rostered basis. They assess the
site for correct meter installation and report any cases
of unauthorised use. This work started in January 2020
and revealed 12 cases of unauthorised water use from 74
construction sites within six months
Auckland Water Efficiency Plan 2021-2025 17Looking around: the challenges we face We have to address the challenges ahead to ensure we are prepared to face them. Auckland Water Efficiency Plan 2021-2025 18
reductions from our operations which align with keeping the
     In early 2019, we launched our first ever Climate Change
                                                                                       global temperature increase within 1.5 degrees Celsius.
     Strategy. This sets out our future direction as we embark on a
     journey to operate a low-carbon company that is resilient to                      •    Net Zero emissions by 2050
     climate impacts. The strategy covers specific actions that we

     Climate change
                                                                                       •    Reduce operational greenhouse gas emissions by
     will take immediately and establishes a pathway of monitoring
     and understanding between now and 2025. This is so that we
     can adapt to the changing climate based on evolving data and                       We realise that this is not a challenge that we can solve on our
     projections. The strategy also enacts Watercare’s Climate                          own and we will need to work with other organisations to
     Change   Policy whichchallenges
                           communicates                                                 achieve our goals and inform our thinking. To become future fit
      One of the  greatest             thatto
                                            westaff
                                                faceand suppliers
                                                     as an        what
                                                           organisation                 We are already seeing the impacts of severe weather events
     is expected of them to contribute to our climate objectives                        we will collaborate across the Auckland Council family, enable
      and as a people is climate change. This worldwide issue                          today and the projections show this impact increasing for
     each year.                                                                         our employees to develop solutions and work together with
     requires immediate and decisive action. The global climate                        the next 100 years and beyond. There is uncertainty about
                                                                                        suppliers and customers.
      has already
     Climate  changechanged
                        is one atof an
                                    theunprecedented
                                         largest challenges rate. The
                                                               that wemain
                                                                        face as        the severity of impacts that the changing climate will pose.
      driver
     an      for this is Its
         organisation.   theeffects
                               increase
                                      canin  greenhouse
                                           include           gas emissions
                                                    temperature     increases,         However,   we do know
                                                                                        We have developed      we will
                                                                                                             a work    experience
                                                                                                                    plan          different
                                                                                                                         that consists       weather
                                                                                                                                       of 14 portfolios
      from human
     drought,        activity.
               increased         Climate of
                             frequency     change
                                              severeposes
                                                     stormconsiderable
                                                              events and               patterns, which will affect Auckland’s water supply
                                                                                        across  both adaptation and mitigation. Some         andand the
                                                                                                                                       of these
      challenges
     rising        to the
            sea levels.     supply
                         Every       of water
                                 aspect   of ourand  wastewater
                                                 operations         services
                                                               is potentially          demand in future.
                                                                                        direct impact of climate
                                                                                                           6     change  on our operations  are
      in Auckland,
     impacted        as well
                 by these       as forright
                             effects    Hamilton   andplanning
                                            from the    other communities
                                                                   and design          described below.
      relying
     of       on supply from
        our infrastructure,        the way
                                to the  Waikato   River. is sourced and
                                             raw water
     treated, or how wastewater is processed and discharged.

          CLIMATE CHANGE IMPACTS

                                                                       Droughts and more hot days         More extreme                Rising sea
                                                                            (more than 25oC)              rainfall events               levels

          ADAPTATION

         Water source                     Managing water                  Treatment resilience:       Network resilience:       Environmental
         resilience: making               demand:                         ensuring that our           monitoring our            stewardship:
         sure there is enough             understanding and               water and wastewater        networks, modelling       understanding the
         good-quality water               influencing our                 treatment plants are        our climate change        natural environment
         for Auckland                     customers’ water                fit for purpose             effects and using         to inform our
                                          consumption                                                 resilient design and      long-term decisions
                                                                                                      construction

          MITIGATION

                Planting and                 Energy efficiency             Energy-neutrality at            Low-carbon             Reduce treatment
               carbon removal                                               major wastewater              infrastructure          process emissions
                                                                            treatment plants

     Climate change will have wide-ranging effects on how we live in Auckland.
16   Watercare Services Limited

     6
      For more information, see Auckland Region Climate Change Projections, NIWA: https://knowledgeauckland.org.nz/media/1170/tr2017-030-2-
     auckland-region-climate-change-projections-and-impacts-revised-jan-2018.pdf and Watercare’s climate change strategy: https://wslpwstoreprd.
     blob.core.windows.net/kentico-media-libraries-prod/watercarepublicweb/media/watercare-media-library/sustainability/climate_change_
     strategy.pdf

     Auckland Water Efficiency Plan 2021-2025                                                                                                             19
Watercare is working closely with Auckland Council on our joint We are likely to see increasing fluctuations in water
response to the challenges of climate change. Water plays a availability from our sources. Decreases in summer and
key role in Te Tāruke-ā-Tāwhiri, Auckland’s Climate Plan. autumn rainfall and higher losses of water due to higher
temperatures could lead to reduced water supply. Long
In mid-2017, Auckland Council and its Council-Controlled periods of drought will further reduce supply. The outcome
Organisations commissioned the National Institute of Water is that we will have to manage our water supply more
and Atmospheric Research (NIWA) to model the projected proactively throughout all seasons.
climate changes for the city and to assess their potential
impact. The study uses two emission scenarios to set a range Climate change could also cause more water leakage across
of possible impacts: the network. We know that leaks increase in extreme weather.
Long, hot, dry spells reduce soil moisture, putting pressure on
• Scenario 1 is the stabilisation or best-case scenario. pipes (particularly joins), which leads to more pipe breakages.
• Scenario 2 reflects business as usual, where global
In sharp contrast, extreme rain increases land instability and
greenhouse gas emissions continue to climb unabated
erosion, causing the ground around our pipes to shift, which
at their current projected rate.
also increases the need for maintenance. As the climate
becomes more extreme, this will put more pressure on the
This information is the basis for Watercare’s climate change network. To conserve as much of our water as possible, we
strategy. The scenarios have different timeframes attached will need better oversight of where our water is going, and
and under both scenarios the seasonal distribution of rainfall when this is happening.
in Auckland is projected to change markedly. While total
annual rainfall may not change significantly, we expect there We are establishing stronger measurement, monitoring and
will be less rainfall in spring and more in autumn. The number performance protocols to track the impacts of the changing
and intensity of extreme rainfall events are likely to increase. weather on water supply and demand. This information will
In addition, droughts are projected to become more common help us meet the targets of this Water Efficiency Plan, as well
and more severe in Auckland due to changing rainfall patterns as support our growing understanding of how we might adapt
and temperature increases. our water management systems into the future.
Auckland is predicted to become considerably warmer.
Projections for Scenario 1 indicate a mean annual temperature
increase of between 1.6°C and 3.4°C by the year 2110.
Currently we experience 20 hot days per year (days where
the maximum temperature exceeds 25°C). Under Scenario 1,
most of Auckland is projected to experience more than 40 to
50 additional hot days per year by 2110. Under Scenario 2, it
will be more than 70. As noted earlier, warmer days lead to
increased demand for water.
Auckland Water Efficiency Plan 2021-2025 20Population growth
Although Aucklanders have been measurably reducing their Our overall target per capita is 924 litres per connection per
per person consumption of water since 2006, the demand day.8 This is the target for all water supplied to the metropolitan
on Auckland’s water supply has increased, simply because region, inclusive of domestic consumption, commercial (non-
we have so many more people now. (Auckland’s resident domestic) consumption and non-revenue water.
population grew from 1.3 million in 2006 to 1.6 million in 2018.)
In addition, as the chart below shows, since 2014, progress in However, as signaled in a previous water efficiency strategy,
per capita consumption has flattened out. In their own words, we are additionally measuring other indicators of water
most Aucklanders believe they are ‘already water efficient’.7 efficiency that accurately reflect our performance in specific
Yet, the conservation campaign during the drought showed areas. These are:
that Aucklanders can do even better. The seven-day rolling
consumption rate is well below the target and significantly • Residential consumption
lower than for the previous year. Our aim is to make the current • Non-revenue water
attitudes towards conserving water more permanent. All of these factors will be measured in litres per connection
per day (l/c/d) and will be reported quarterly.9
130
125
120
115
Index 2006 = 100
110
105
100
95
90
85
80
2006 2007 2008 2009 2010 2011 2012 2013 2014 2015 2016 2017 2018 2019 2020
Population Gross per capita consumption
This chart shows our population growth and our per capita water efficiency performance over time relative to 2006
levels. Since 2006, our per capita consumption of water has decreased, and then flattened out.
7
In mid-2020, 66% of Aucklanders said that they are already doing all that they could to reduce their water consumption (TRA/Watercare:
Aucklanders’ relationship with water, presented 12 June 2020).
8
This is the equivalent of 253 litres per person per day in 2025, based on connections growth of 6000 new connections (both residential and
commercial) per annum and population growth at 1.8% per annum in accordance with Statistics New Zealand’s estimates. To achieve this, we
need to achieve a drop of 36 l/c/d per connection as our current level is at 960 l/c/d. The starting value used for population numbers is based
on the 2013 census data.
9
In line with our Statement of Intent (SOI), we will establish baseline measures of commercial (non-domestic) consumption by sector, and
publish a target for our next (2021/22) SOI. But for reasons described above, we are working with commercial customers to reduce waste
rather than productivity, and will develop a target which better measures water efficiency performance than ‘water used’ per connection.
Auckland Water Efficiency Plan 2021-2025 21Residential rather than overall consumption Per-connection measure
Our change in performance metrics is in line with our We will also use residential consumption per connection as
Statement of Intent, which refers to the “average consumption a measure of water efficiency over time. This is much more
of drinking water per day per resident”, and reflected in the accurate than measuring the total population’s usage. We
wording of the Department of Internal Affairs as “the average know how many households are connected to our network;
consumption of drinking water per day per resident.”10 As however, we do not know how many visitors use our water, or
previous mentioned, residential consumption is a better how many people are leaving, arriving or staying in Auckland
indicator of Watercare’s performance, whereas commercial at any given time.
demand speaks more to Auckland’s overall economic health.
For instance, the chart above shows how overall gross per We project overall domestic growth of 1.8% per year, with
capita consumption improved significantly in 2008/09, as about 6000 new (residential) connections each year. Our
industries suffered due to the global financial crisis. target is to reduce domestic consumption from 516 litres per
connection per day in 2019 to 481 litres per connection per
day in 2025.
Residential consumption actual and target
530
520 516
512 512
509 508 510
508
510 504
499
l/c/d
500
493
490 487
481
480
470
2014 2015 2016 2017 2018 2019 2020 2021 2022 2023 2024 2025
Residential consumption (l/c/d) Residential consumption (l/c/d) target
Actual past residential water consumption and our future target consumption.
10
Under Part 2 (5) Demand Management https://www.dia.govt.nz/diawebsite.nsf/Files/Local-Government-Non-Financial-Performance-
Measures-Signed-Rules/$file/Local-Government-Non-Financial-Performance-Measures-Signed-Rules-1.pdf Also see letter from John Pfahlert,
CEO, Water New Zealand, to Richard Hardie, DIA, regarding Non-Financial Performance Measure Rules Improvement Opportunities, and DIA
520 516
wording around drinking water supplied/consumed
https://www.waternz.org.nz/Attachment?Action=Download&Attachment_id=3645 513
515 512 512
509 508 508 510
510 Plan 2021-2025
Auckland Water Efficiency 507 22
504
505 501OUR EXPANDED TARGETS FOR 2025 ARE: GROSS WATER RESIDENTIAL NON REVENUE WATER AT OR SUPPLY OF CONSUMPTION OF BELOW 924 481 186 LITRES PER LITRES PER LITRES PER CONNECTION CONNECTION PER DAY CONNECTION PER DAY PER DAY Our ability to meet this target will depend on the strength of our relationship with the people we serve, our continued commitment to reducing non-revenue water, and on how well we improve the oversight of our network. NOTE: Non-revenue water (NRW) is not the same as leakage or real loss. NRW includes water used for firefighting, to clean water mains, unauthorised connections and use, and meter under-reading as well as leakage. Auckland Water Efficiency Plan 2021-2025 23
Looking ahead:
how we intend to meet our
targets
In response to the challenges we face,
Watercare has devised a range of strategies to
ensure that we make the most of what we have
in the years ahead.

Auckland Water Efficiency Plan 2021-2025         24
Smarter ways to make the most of
our water
Looking ahead to a significantly different climate with more   lakes. However, our goal is to work within Auckland to find
droughts and more extreme rainfall events, we need to find     smart solutions we can implement, with the cooperation
a sustainable way forward.                                     of our customers, rather than using high prices as a
                                                               disincentive to use water. We have looked at a wide range of
There are numerous ways to reduce the amount of water we       options to improve our water efficiency. Rather than try to do
use. In many industries, pricing is seen as a way to manage    everything at once, we have decided to focus on measures
demand, and we know that future sources of water will be       that can be implemented quickly, are sustainable over time
more expensive. It is more costly to produce and distribute    and are likely to give the biggest benefit.
water from the Waikato River than from the water storage

                                                               We identified four key areas that meet all these criteria:

                                                               •   Making every drop of water count by reducing loss
                                                               •   Improving oversight from source to tap (for better
                                                                   visibility of loss and consumption)
                                                               •   Optimising pressure in our network
                                                               •   Residential, community and commercial water
                                                                   efficiency.
                                                               The following is a statement of principles and aims,
                                                               identifying our key priorities. It does not provide a detailed
                                                               operational plan of how we will achieve our goals.

Auckland Water Efficiency Plan 2021-2025                                                                                        25
Focus Area 1: Making every drop of water count by
reducing loss
Like many of our peers worldwide, Watercare puts more water Based on the costs and benefits found in an extensive trial
into our network than is bought by our customers. This non- covering more than 500 kilometres of pipeline, we estimate
revenue water consists of: it will cost $111 million over five years to reach our target.
(This cost includes renewals, which are required to ensure
• Water used to clean mains that pipes do not continue to break due to age while they
• Water used to fight fires are being fixed.) As noted earlier, our renewals budget is not
• Unauthorised connections sufficient to enable us to reach our 2025 target without the
• Meter under-reading help of our customers conserving water. However, our aim is
• Leakage in the network to use a targeted approach to where we carry out renewals
Our target is to hold our non-revenue water at or below to give us the best water-saving value possible given our
186 litres per connection per day. financial constraints. The length and severity of breaks
determine the parts and labour required, as well as the type
While all the factors above play a role, most of the losses are of ground covering (e.g. grass or concrete) and the nature of
through network leaks. To fix this, we need to invest in leak the area (e.g. areas requiring significant traffic management).
detection and manage pressure across the network. Both We will do our best with the resources that we have.
activities can be more effectively managed by centralised data
that identifies the areas we need to focus on. The table below outlines the initiatives we will undertake to
achieve our target.
District meters District meters create smaller areas within the network where we can monitor leakage and
other non-revenue water. Leak detection and pressure management can then be targeted at
the highest priority areas and the effectiveness of our leak reduction activity can be measured
and tracked.
Active leak detection We use proactive leak detection in the areas in which we notice higher losses. Contractors use
acoustic methods to detect leaks. They will survey 500km of network pipes per month.
Innovation in leak Watercare is looking at new methods to discover leaks rather than relying on contractors
detection using physical methods, e.g. through minimum night-flow analysis and acoustic and pressure
sensors within zones, and the use of dogs who are able to sniff out leaks so these can be found
and fixed faster.
Rapid response teams Contractors will increase their staffing levels to reduce any backlog of leaks to be fixed when
the need arises. Maintenance Services Networks, Citycare and Downer crews will receive extra
training to undertake these works safely and in a timely manner, while continuing to limit
customer disruption and minimising the loss of water.
Minimising water loss Watercare already has an active renewals programme to maintain our assets in good condition.
due to breaks In future, we will replace assets based on water loss, rather than simply their age. Replacing
pipes and meters that are in the most critical condition will maximise the water savings of the
renewals programme.
Auckland Water Efficiency Plan 2021-2025 26Focus Area 2: Improving oversight from
source to tap
We will continue to build a smarter network, enabling more Access to real-time consumption data will create greater
proactive maintenance of our network and consequently awareness of water use for both residential and commercial
minimise customer disruption due to bursts and leaks. customers. It will also help with the early detection of leaks,
thereby minimising water loss and the potential of high bills
Building a smart network means that we will develop a for customers.
dynamic data model that measures loss across the network at
any point in time. Greater data oversight will give us an early We replace 30,000 water meters every year, based on their
indication of where water is lost, and which assets need to be age, to ensure customers have accurate visibility of their
maintained or replaced. consumption. By attaching smart loggers to these meters,
we will be able to provide real-time visibility of water use.
We are developing new methods to detect leaks through This enables us and our customers to make efficient, data-
minimum night-flow analysis, as well as with acoustic driven decisions and ultimately waste less water. We have
and pressure sensors. The intention is to incorporate already started rolling out smart meters to our commercial
information from new sensing and analytical technologies customers and all Auckland schools.
into the Watercare Nerve Centre. The Nerve Centre is a
centralised monitoring and remote management platform. Finally, our smart network will help us take greater control of
It organises data into an alert system that we use to direct our standpipes and provide better oversight of fire hydrant use.
our maintenance and network development work. The idea
is to find burst pipes proactively and start fixing them before
customers even become aware that there is a leak.
Bulk supply point data Bulk supply points will continue to be used to direct our efforts, particularly in terms of water
loss and pressure management.
District meter area Smaller district metering areas are under development also and will allow us to pinpoint our
data efforts even further, giving greater understanding of our network.
Customer data Our smart meter roll-out will provide customers with transparent consumption data in real-
time, enabling them to proactively manage their water use, make more informed decisions and
identify high usage as it happens.
Auckland Water Efficiency Plan 2021-2025 27Focus Area 3: Optimising pressure in our network
Water pressure management is an integral part of Watercare’s This phase will also introduce a more comprehensive data
strategy to reduce consumption. Through network intelligence reporting system to track breaches of upper and lower
and improved control of water distribution, we can achieve pressure limits. This data will be used alongside leak
more stable (and typically slightly lower) water pressure detection to manage system performance, to help prioritise
within the network and control loss. asset replacement and to assist with planning.
In terms of water efficiency, this has the benefit of reducing: We anticipate that losses from our network will decrease
because flows from leaks will be smaller, customers in
• The instances and severity of leaks in both private and previously high-pressure areas will consume less water, and
public pipes data capture will give us greater network intelligence that we
• The associated flushing after a leak repair can use to achieve further gains. A pressure optimisation pilot
• Customer water use by marginally reducing the rate of was undertaken during 2020 in three metropolitan zones
water flowing out of taps. which supply around 50,000 people. As a result of a minor
pressure reduction, water savings of 1 to 2 million litres per
The first stage of pressure management is underway, day and an average of at least 5% fewer reported faults were
reducing excessive pressure in zones where there are a high observed over a three-month period.
number of network leaks and more vulnerable pipes. We also
prioritise areas that experience fluctuations in pressure, by
trimming excess supply pressure. We are developing ways to
integrate pressure data into the centralised Nerve Centre for
real-time reporting.
In the second phase, we will assess the success of our initial
pressure management activities. We can then reconfigure
area boundaries with new pipework and valves, as well as
install new flow meters and pressure-reducing valves at
supply points. The aim is to reduce the size of network areas
to improve the visibility and performance of our network.
At the same time, we need to ensure a high level of service
to customers and good pressure for firefighting use.
Auckland Water Efficiency Plan 2021-2025 28Focus Area 4: Residential, community and
commercial water efficiency
Watercare needs to develop the relationship we have with our In general, Aucklanders seldom see the pipes which carry our
customers beyond the transactional purchase of water and water and, until recently, have not considered the possibility
wastewater services, towards greater whakawhanaungatanga of a serious drought. Many people are not aware of how much
(establishing links, working together). Aucklanders need to water they use or where it goes (the answer is that most of the
understand how to conserve more water, and we need to water we use in our homes is in the shower and the washing
communicate what is happening in our world in a constructive machine, with the toilet being the next biggest use of water).
and informative way.
Most believe that they are already conserving as much water
As we look ahead, we can see that our customers are looking as they can.11 However, our customer research shows that only
for different kinds of support from us, and there is no one- half of Auckland’s households have a water-efficient washing
size-fits-all approach to reducing demand. To enhance water machine, and only one in five has a water efficiency device
efficiency, we need to approach customers in a way that installed.12 Only a quarter of Aucklanders with gardens collect
speaks to their needs and values. rainwater.
As we learn more about our customer base, we can send So, while there is a perception among the community that
communications that are more helpful to people in whatever there is little left to do to further reduce our water use, and we
stage of life they are at, be they landlords, retirees, younger are efficient compared to other New Zealanders, there is more
people flatting, or large families. We will increasingly encourage that we need do to ensure that Auckland has a supply of top-
Aucklanders to save water using language and channels that are quality water available, now and in the future.
meaningful to them and which embrace ingenuity. Improving
water efficiency amid climate change is an opportunity to co-
create solutions for problems that we all share.
Residential water use
2% 1%
Bathtub Dishwasher
3%
Leaks
27%
12% Shower
Outdoor
14%
Taps
23%
Washing
Machine
18%
Toilet
A typical Auckland household uses more water for showering than anything else. (Breakdown of water use in
an Auckland home, Auckland water use study, BRANZ 2008)
11
TRA research, Aucklander’s relationship with Water, June 2020
12
Monthly Tracker survey data, available upon request.
Auckland Water Efficiency Plan 2021-2025 29In Auckland, the relative scale of our customer base means puts the purified water back into the water network. Indirect
that it is possible for small individual activities to make a reuse is similar, taking treated wastewater and discharging
significant difference overall. We are already encouraging the it to another environment first, like a river, dam or aquifer
use of non-potable water where appropriate. When enough catchment. Other approaches being investigated include
people reduce their shower time or reuse water in the home, on-site wastewater treatment and reuse for non-drinking
for instance, this can make a significant difference overall. purposes, like irrigation of sports fields and the wash-down
of manufacturing and production plants.
We also have partnerships that we can leverage to improve
people’s awareness and help them be more water efficient. We are aware of the barriers to the use of treated wastewater
One of these is EcoMatters, a not-for-profit community in the current New Zealand regulatory framework. While it is
organisation and long-term partner of Watercare in our efforts not feasible to apply for discretionary resource consents for
to reduce water waste. EcoMatters’ advisors have helped our individual uses of recycled water in the longer term, we are
customers understand and reduce their water usage through advancing conversations at a council and national level to
community engagement and home water audits. Follow-up establish a suitable framework. We have committed to Waikato-
support can help people to embed good habits in the longer Tainui that should the current Board of Inquiry application
term. EcoMatters has developed an online water audit and be granted, we will not submit any further applications for
hopes to reach many more Aucklanders to make the small use from the Waikato River; 300 million litres per day is the
savings at home that will add up to big savings overall. maximum we will take from that source. Therefore, we must
actively consider reuse as a new source of water for Auckland,
Recycling water as well as reuse in homes, businesses and other organisations
as a way of reducing demand. We are already exploring options
around the use of treated wastewater from the Rosedale plant
We also need to consider how we can recycle and reuse water
for the irrigation of council parks. Similarly, we will continue to
in both commercial and residential settings. Water reuse is
work closely with Auckland Council to promote water reuse in
a growing trend worldwide, involving recycling wastewater
the home, through providing advice and improving support for
back into the water network, directly or indirectly. Direct reuse
greywater tanks.
takes highly treated wastewater from the treatment plant and
Rainwater and greywater tanks
Rainwater and greywater tanks can reduce mains water use. Stored water can be used for
watering gardens, agriculture, flushing toilets, in washing machines and for washing cars. If
rainwater tanks could substitute for metropolitan supply for outdoor use alone, in theory this
could save 12% of residential water usage. Watercare doesn’t recommend using rainwater for
drinking where the public network is available.
Rainwater tanks offer other benefits too:
• Diverting some of the roof-generated contaminants away from public waterways
• Reducing potential vulnerability during civil defence emergencies
• Removing some stormwater run-off from our natural environment, where that stormwater
would otherwise contribute to bank erosion and ecological contamination
• Embedding a culture that values water as precious taonga within our communities.
As rainwater tanks generate most savings in times of frequent rain, they are not a solution to
meeting peak summer demand. Consumers who depend on rainwater tanks need to purchase
more water from tanker operators during the warm and dry periods of the year. This means
that the water sold to tanker operators, which is supplied by our metropolitan network, is then
distributed to consumers that are not connected to our metropolitan network.
By contrast, greywater tanks provide more reliable water savings all year round. However, on-site
greywater recycling systems are not common in Auckland and we need to investigate this option
further. Other home water recycling is already occurring, and will continue to be encouraged,
such as using water from the shower or washing machine to water the garden.
Auckland Water Efficiency Plan 2021-2025 30You can also read