Plot-level rapid screening for photosynthetic parameters using proximal hyperspectral imaging
←
→
Page content transcription
If your browser does not render page correctly, please read the page content below
Journal of Experimental Botany, Vol. 71, No. 7 pp. 2312–2328, 2020
doi:10.1093/jxb/eraa068 Advance Access Publication 24 February, 2020
This paper is available online free of all access charges (see https://academic.oup.com/jxb/pages/openaccess for further details)

RESEARCH PAPER

Plot-level rapid screening for photosynthetic parameters
using proximal hyperspectral imaging

                                                                                                                                                                       Downloaded from https://academic.oup.com/jxb/article-abstract/71/7/2312/5754088 by Brookhaven National Laboratory user on 10 June 2020
Katherine Meacham-Hensold1,2,*, Peng Fu2,*, Jin Wu3,4, Shawn Serbin3, Christopher M. Montes1,
Elizabeth Ainsworth1,2,5, Kaiyu Guan6,7, Evan Dracup5, Taylor Pederson2, Steven Driever2,8 and
Carl Bernacchi1,2,5,†,
1
    Department of Plant Biology, University of Illinois at Urbana-Champaign, Champaign, IL, USA
2
    Carl R. Woese Institute for Genomic Biology, University of Illinois at Urbana-Champaign, Champaign, IL, USA
3
    Environmental & Climate Science Department, Brookhaven National Laboratory, Upton, New York, USA
4
    School of Biological Sciences, University of Hong Kong, Pokfulam, Hong Kong
5
    USDA ARS Global Change and Photosynthesis Research Unit, Urbana, IL, USA
6
    Department of Natural Resources and Environmental Sciences, University of Illinois at Urbana-Champaign, Champaign, IL, USA
7
    National Center of Supercomputing Applications, University of Illinois at Urbana-Champaign, Champaign, IL, USA
8
    Center for Crop Systems Analysis, Wageningen University, The Netherlands.

* These authors contributed equally to this work.
†
  Correspondence: Carl.Bernacchi@USDA.gov

Received 10 February 2020 Accepted 10 February 2020

Editor: Tracy Lawson, University of Essex, UK

Abstract
Photosynthesis is currently measured using time-laborious and/or destructive methods which slows research and
breeding efforts to identify crop germplasm with higher photosynthetic capacities. We present a plot-level screening
tool for quantification of photosynthetic parameters and pigment contents that utilizes hyperspectral reflectance
from sunlit leaf pixels collected from a plot (~2 m×2 m) in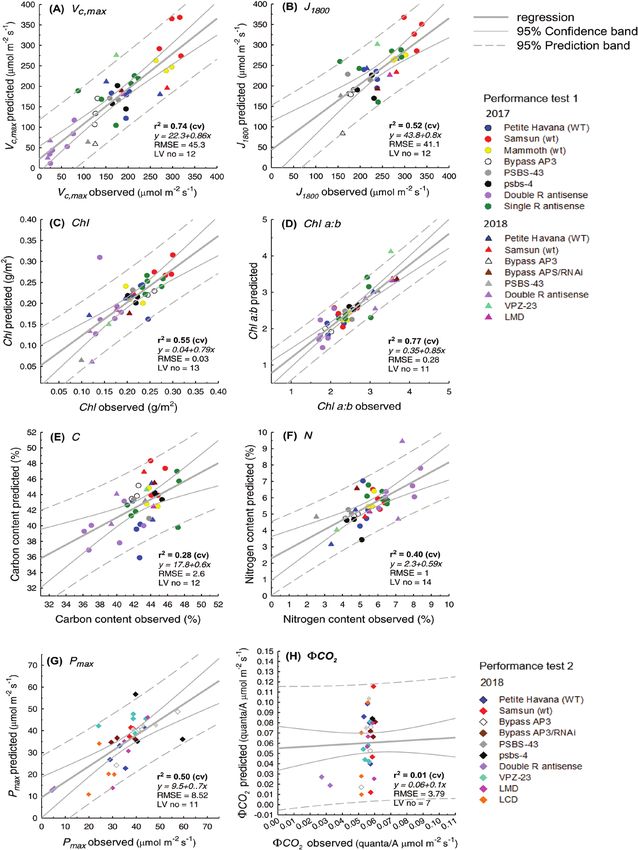
Plot-level rapid screening for photosynthetic parameters using hyperspectral imaging | 2313

Introduction
Projected population increase and pressures on land and agri-         At the leaf level, with a hand-held spectral leaf gun, photosyn-
cultural resource availability induced by a changing global cli-      thetic capacity (Vc,max and Jmax) and chlorophyll, carbon (C) and
mate is placing increased demand to secure global food supply         nitrogen (N) content have been predicted successfully from
in the coming decades (Tilman et al., 2009; Foley et al., 2011).      hand-held reflectance spectroscopy across the full electromag-
Improving photosynthetic capacity has become a target to en-          netic spectrum (400–2500 nm) for tree species (Serbin et al.,
able crop yield increases (Monteith and Moss, 1977; Long et al.,      2012, 2016), productive cropping systems (Ainsworth
2006; Zhu et al., 2010; Evans, 2013). Inefficiencies in the photo-    et al., 2014; Yendrek et al., 2017; Silva-Perez et al., 2018; Ely
synthetic pathway have inspired research efforts to exploit nat-      et al., 2019), and in field trials of Nicotiana tabacum with altered

                                                                                                                                              Downloaded from https://academic.oup.com/jxb/article-abstract/71/7/2312/5754088 by Brookhaven National Laboratory user on 10 June 2020
ural variation in photosynthetic capacity (Lawson et al., 2012),      photosynthetic pathways (Fu et al., 2019; Meacham-Hensold
and to improve photosynthetic pathways transgenically (Ort            et al., 2019). Partial least squares regression (PLSR) analysis
et al., 2015). Thus, crop scientists and breeders face the chal-      of reflectance spectra has also been applied to predict photo-
lenge of characterizing genetic improvements in field trials in a     synthetic capacity with airborne hyperspectral imaging at the
high-throughput manner as a screening tool to identify ‘photo-        agroecosystem canopy scale (Serbin et al., 2015); however, the
synthetically superior’ germplasm (Furbank and Tester, 2011).         most advanced satellite hyperspectral systems capture ~1 pixel
While photosynthetic capacity has been successfully estimated         per 10–30 m (Transon et al., 2018), which is too coarse in spa-
from hyperspectral imaging at the ecosystem scale (Serbin             tial resolution to identify genotypic variation within field trials
et al., 2015), it is often too coarse in spatial resolution to dis-   of many small plots. Advanced UAV (unmanned aerial vehicle)
criminate in mixed germplasm field trails. While hyperspectral        systems are able to capture greater spatial resolution (~40 cm
analysis has predicted leaf-level photosynthetic capacities and       per pixel) (Zarco-Tejeda et al., 2013; Ruwaimana et al., 2018),
pigment contents (Serbin et al., 2012; Ainsworth et al., 2014;        but still fall short of the millimeter resolution required to
Yendrek et al., 2017; Silva-Perez et al., 2018), it has limitations   build models to predict photosynthetic capacities at the scale
as leaf clip measurements only pinpoint a few individual leaves       of individual leaves in small plots. While multispectral cam-
in a plot canopy. Currently there are limited tools to screen a       eras are widely available at higher resolution and used to de-
whole plot, rather than individual leaves, for photosynthetic         rive plot-level spectral vegetation indices (SVIs) from discreet
performance. Plot-level estimations with proximal sensing             spectral wavelengths (Curran et al., 1990; Gamon et al., 1992;
platforms are needed to allow rapid capture of reflectance from       Thenkabail et al., 2000; Zarco-Tejada et al., 2002; Haboudane
all sunlit vegetation in the sensor range, eliminating the need to    et al., 2004), SVIs are not able to determine photosynthetic
make assumptions about plot performance based on leaf-level           parameters beyond structural inference on physiological pro-
samples, and expanding the spatial and temporal capabilities of       cesses from discreet spectral bands. Satellite-mounted multi-
analysis to capture hundreds of plots in a single day.                spectral imaging systems have also been widely exploited to
   The maximum carboxylation rate of Rubisco (Vc,max) and             derive spectral indices such as the enhanced vegetation index
maximum electron transport rate in given conditions (Jmax) are        (EVI) and normalized difference vegetation index (NDVI),
widely used as determinants of photosynthetic capacity for the        and, more recently, solar-induced fluorescence (SIF) (Guanter
carbon reduction cycle and the electron transport chain, respect-     et al., 2014; Porcar-Castell et al., 2014; Guan et al., 2016) and
ively (von Caemmerer and Farquhar, 1981; von Caemmerer,               linked to ecosytem gross primary productivity (GPP) (Smith
2000), and are traditionally derived at the leaf level with infra-    et al., 2002;Wylie et al., 2003; Rahman et al., 2005; Zhang et al.,
red gas exchange analysis.The response of leaf-level CO2 assimi-      2014, 2018; Barnes et al., 2017; Shi et al., 2017; He et al., 2019).
lation to incrementing CO2 is measured (Long and Bernacchi,           Multispectral SVI and SIF estimates have been incorporated
2003) and analyzed (Sharkey et al., 2007) according to the            into terrestrial biosphere models to predict photosynthetic
mechanistic model of photosynthesis (Farquhar et al., 1980).          capacities at the ecosystem scale (Demarty et al., 2007; Kattge
The quantum yield of CO2 fixation (ϕCO2) and maximum                  et al., 2009; Zhang et al., 2014), but have not been used to pre-
light-saturated photosynthetic rates (Pmax) are also used as deter-   dict photosynthetic capacity in smaller scale plot trials.
minants of photosynthetic operating efficiency, as derived from          Resolving hyperspectral analysis of photosynthetic parameters
leaf-level gas exchange measurements of the response of CO2           at the plot level holds many practical and technical challenges.
assimilation to incrementing photosynthetically active radiation      First, hyperspectral cameras and sensors that capture reflectance
(PAR) (Ögren and Evans, 1993). Due to the wealth of physio-           at the spatial and spectral resolution required for plot-level ana-
logical information provided, leaf-level gas exchange has dom-        lysis are often limiting in terms of availability, affordability, and
inated retrieval of these photosynthetic parameters for decades,      suitability for field trial scanning. Secondly, field phenotyping
but it is limited and time restrictive for the sampling required      proximal sensing platforms (Deery et al., 2014) to house such
to measure large crop trials. Additionally, upscaling from leaf gas   sensors are not currently commercially available and need to
exchange to determine plot or canopy photosynthetic capacity          be fabricated for purpose. Thirdly, hyperspectral imaging sys-
from gas exchange often requires complex modeling with many           tems generate memory-intensive three-dimensional data sets
assumptions (de Wit, 1965; Evans and Farquhar, 1991; De Pury          with two spatial dimensions (Sx and Sy) and one spectral (Sλ)
and Farquhar, 1997;Yin and Struik, 2017; Wu et al., 2019).            dimension, forming ‘hypercubes’ (Bannon, 2009), necessitating
   Recently, advances have been made in quantifying photo-            advanced data storage systems and custom analysis pipelines.
synthesis from spectral analysis at the leaf to ecosystem scales.     Fourthly, at the plot level, plant geometrical structure, leaf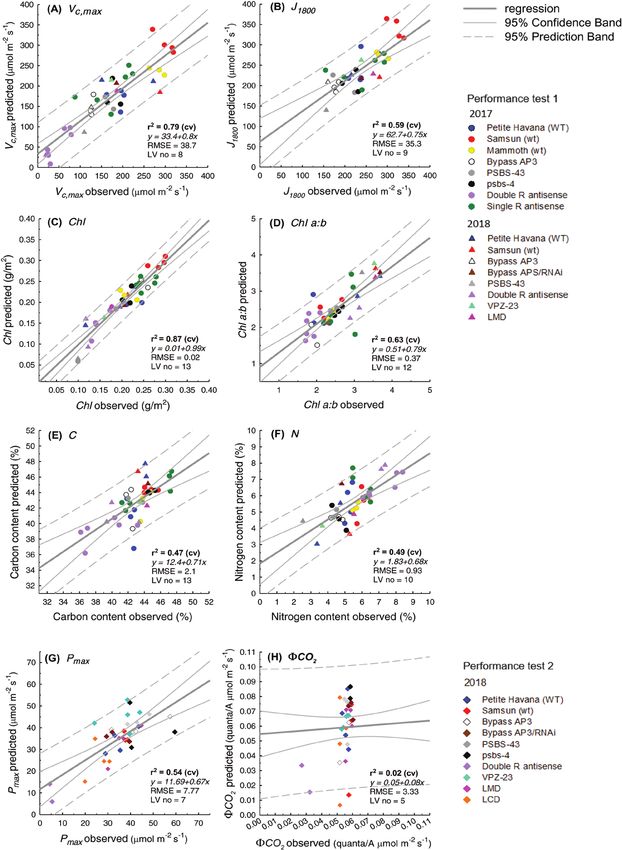
2314 | Meacham-Hensold et al.

scattering properties, background soil, and dynamic environ-                       In 2018, two wild-type, five previously grown transgenic lines, and
mental conditions (Verhoef, 1984; Vogelman et al., 1996; Gao                    three newly added transgenic lines (described in detail in Table 1) were
                                                                                grown according to the same protocol as in 2017. All transgenic plant
et al., 2000; Jay et al., 2016) need to be resolved against leaf-level          material was homozygous, with the exception of the single Rubisco anti-
‘ground truth’ measurements to accurately infer photosynthetic                  sense and decreased PsbS line (4-KO). Single Rubisco antisense plants
performance upscaled from leaf to plot level. Finally, ensuring                 were planted to the field without screening. The 4-KO seedlings were
use of this technology answers important physiological questions                screened 8 d post-emergence with chlorophyll fluorescence imaging to
requires effective interdisciplinary collaboration between engin-               identify and select only plants with the PsbS knockout phenotype for low
                                                                                non-photochemical quenching (NPQ).
eering, computational, and biological specialists.
   In this study, we present a plot-level high-throughput

                                                                                                                                                                        Downloaded from https://academic.oup.com/jxb/article-abstract/71/7/2312/5754088 by Brookhaven National Laboratory user on 10 June 2020
phenotyping platform housing two hyperspectral cameras.                         Hyperspectral image collection
One visible near infra-red (VNIR) camera captured reflect-                      A ground-based field phenotyping platform was built to house two
ance from 400 nm to 900 nm (spectral resolution 2.1 nm) and                     hyperspectral push-broom cameras mounted on a horizontal beam
the second near infra-red (NIR)/shortwave infra-red (SWIR)                      (Fig. 1A). The first hyperspectral imaging camera (PIKA II; Resonon, Inc.,
                                                                                Bozeman, MT, USA) captured spectral radiation from 400 nm to 900 nm
camera from 900 nm to 1800 nm (spectral resolution 4.9 nm).                     in 2.1 nm contiguous bands (240 spectral bands in total) with 640 spatial
We created an automated hyperspectral imaging processing                        channels. The second camera (PIKA NIR: Resonon, Inc.) recorded spec-
pipeline that extracts plot-level sunlit vegetation pixel reflect-              tral radiation from 900 nm to 1800 nm in 4.9 nm contiguous bands (164
ance spectrum to predict Vc,max, J1800, chlorophyll content, Chl                spectral bands) with 320 spatial channels. Both cameras were mounted at a
a:b, C content, N content, Pmax, and ϕCO2. From PLSR ana-                       height of 1.6 m from the soil and were triggered simultaneously above a plot
                                                                                to acquire two images during an ~30 s scan. Images were captured in high-
lysis of plot-level reflectance spectra from hyperspectral images,              irradiance conditions during a 3 h window around solar noon and stored
we predict these photosynthetic traits in field trials of wild-                 using SpectrononPro software (Resonon, Inc.). A 99% reflective white
type and genetically modified lines of N. tabacum.We assess the                 Teflon panel was mounted horizontally and level with the top of the plant
contribution of spectral regions and the applicability of this                  canopy and captured in the field of view for each image (Fig. 1B). Images
technique to the field phenotyping community, and offer a                       were captured and stored in raw data mode.The cameras were calibrated to
                                                                                remove electrical and dark current daily prior to data acquisition. Camera
tool for high-throughput phenotyping of large-scale crop trials                 integration time was set at 20% below the saturation point according to the
to facilitate screening for increasing crop yields.                             radiance signal from the Teflon panel before each scan to avoid saturation.

Materials and methods                                                           Hyperspectral image analysis pipeline
                                                                                An automated image analysis pipeline was created using Python (Python
Data from two growing seasons (2017 and 2018) were used in this study,          Software Foundation, https://www.python.org/), to extract spectral re-
presented in two performance tests. For performance test 1, three wild-type     flectance from images acquired in raw data mode (Fig. 2A). Data from
and seven transgenic N. tabacum lines were measured over the 2017 and           each camera went through the same three phases of processing: first,
2018 growing seasons (Table 1). Measurements in 2017 were taken from            conversion of raw data in digital numbers to radiance using radiometric
22 June to 1 August and in 2018 on 24 and 25 July. For performance test         calibration; secondly, the classification of pixels (Fig. 2B); and, thirdly,
2, two wild-type and eight transgenic N. tabacum plants were measured in        conversion of radiance pixels to reflectance (Fig. 2C). For the first phase,
2018 on 26, 27, and 28 July. In performance test 1, predictive models were      raw data were converted to absolute radiance using radiometric calibra-
built from hyperspectral reflectance (both leaf and plot level) with ground     tion files from the camera manufacturer. In the second phase, the image
truth data from gas exchange measurement of CO2 response curves for             was segregated to represent six matter classifications using K-means clus-
Vc,max and J1800, and leaf pigment extractions for chlorophyll content, Chl     tering (Spath, 1985) which separated pixels of interest (sunlit leaves and
a:b, C content, and N content. For performance test 2, predictive models        Teflon) from shaded leaves, soil, platform shadow, and non-biological
for plot- and leaf-level Pmax and ϕCO2 were trained with ground truth data      matter. Thirdly, reflectance (R) was calculated using the radiance signa-
from gas exchange measurement of light response curves.                         ture from the Teflon white reference captured in each image against a
                                                                                lab-calibrated Teflon standard using Equation 1:
Plant material                                                                                                         Ssunlit
In 2017, three wild-type N. tabacum cultivars and six transgenically modi-                                      R=            ∗Rref                             (1)
                                                                                                                        Sref
fied lines (described in detail in Table 1) were grown at the University
of Illinois Energy Farm Facility in Urbana, Illinois (40°03'46.4''N,            where Ssunlit is radiance from sunlit leaves, Sref is radiance from the Teflon panel,
88°12'25.4''W, 215 m above sea level). All experiments consisted of four        and Rref is the percentage reflectance from the lab-calibrated Teflon standard.
replicated plots of each genotype arranged in a 6×6 grid and spaced             Brightness in digital numbers was converted to percentage reflectance (Fig.
0.38 m apart with 36 plants per plot. Each plot measured ~2×2 m. All            2D), before reflectance from all sunlit pixels in each image was averaged per
transgenic material is expressed in the Petite Havana background, with          plot (Fig. 2E). Spectral reflectance from both cameras in the same plot was
the exception of the Rubisco antisense lines in the W38 background.             joined to give reflectance for sunlit leaves per plot from 400 nm to 1800 nm.
Seedlings were germinated in greenhouse conditions in float trays using         Spectra were filtered with a polynomial order of 2 using 11 spectral measure-
a coir soil mix (Coco loco) maintained daily at 150 ppm N using a               ments (nm) as the window length (Savitzky and Golay, 1964). Prior to PLSR
20–20–20 general-purpose water-soluble fertilizer. Plants were trans-           analysis, spectral bands below 450 nm and above 1700 nm were removed due
planted to the field at the four-leaf stage. High levels of ESN Smart           to excess noise, and those between 1313 nm and 1440 nm were removed due
Nitrogen (310 kg ha–1, ~150 ppm soil concentration) were applied to             to atmospheric water absorption (Hill and Jones, 2000; Serbin et al., 2015).
the field site 2 weeks prior to transplanting. A broad action herbicide,
glyphosate-isopropylammonium (41%) (Killzall; VPG) (15 liters at 70 g
l–1) was applied once to all plots 2 d prior to transplanting. A biological     Leaf spectral measurements
pesticide Bacillus thuringiensis var. kurstaki (54%) (DiPel PRO) was applied    Leaf-level spectral measurements were made using a spectroradiometer
to the prepared field site 5 d prior to transplant and at biweekly intervals    (Fieldspec4; Analytical Spectral Devices - ASD, Boulder, CO, USA), with
thereafter to control for tobacco pests. Irrigation was provided to all plots   a leaf clip attached to a fiber optic cable. Leaf spectral reflectance was
as needed to eliminate water limitation throughout growth.                      measured in situ from 400 nm to 2500 nm with spectral resolution of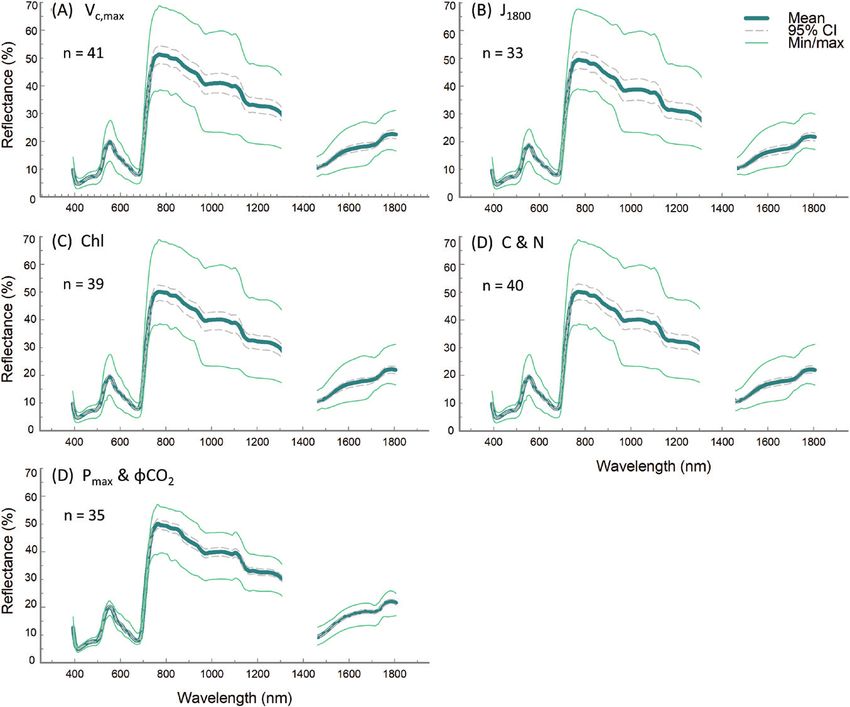
Plot-level rapid screening for photosynthetic parameters using hyperspectral imaging | 2315

Table 1. Nicotiana tabacum genotypes used in this study and description of transgenic modification, with reference to detailed
description of transformation

Genotype           Year(s) grown       Transgene                                                                        Expected transgene function
Petite Havana      2017 and 2018       None (WT)                                                                        NA
Samsun             2017 and 2018       None (WT)                                                                        NA
Mammoth            2017                None (WT)                                                                        NA
Single R           2017                Rubisco small subunit antisense from Nicotiana benthamiana. 40% of               Reduced photosynthetic capacity
antisense                              wild-type Rubisco, background: W38 (Hudson et al., 1992)
Double R           2017 and 2018       Rubisco small subunit antisense from Nicotiana benthamiana. 10% of               Reduced photosynthetic capacity

                                                                                                                                                                Downloaded from https://academic.oup.com/jxb/article-abstract/71/7/2312/5754088 by Brookhaven National Laboratory user on 10 June 2020
antisense                              wild-type Rubisco, background: W38 (Hudson et al., 1992)
Bypass AP3         2017 and 2018       Two transgenic genes expressing the enzymes glycolate dehydrogenase              Increased photosynthetic capacity,
                                       and malate synthase as an alternative photorespiratory pathway, back-            by reduction of energy loss
                                       ground: Petite Havana (South et al., 2019)                                       associated with photorespiration.
Bypass AP3/        2018                Same as Bypass AP3 but with RNAi to down-regulate native chloroplast             Increased photosynthetic capacity,
RNAi                                   glycolate transport, background: Petite Havana (South et al., 2019).             by reduction of energy loss
                                                                                                                        associated with photorespiration.
PSBS-43            2017 and 2018       Increased PsbS mRNA levels from transformation with Nicotiana                    Increased photosynthetic
                                       benthamiana Psbs coding sequence and 35S promoter, background:                   capacity, due to increase in elec-
                                       Petite Havana (Głowacka et al., 2016, 2018)                                      tron transport metabolite pools.
Psbs-4             2017 and 2018       Decreased PsbS mRNA levels from transformation with Nicotiana                    Reduced photosynthetic capacity,
                                       benthamiana Psbs coding sequence and 35S promoter, background:                   due to decreased electron
                                       Petite Havana (Głowacka et al., 2016, 2018)                                      transport metabolite pools.
VPZ-23             2017 and 2018       Three transgenes from Arabidopsis thaliana, expressing violaxanthin              Increased photosynthetic capacity,
                                       de-epoxidase (VDE), zeaxanthin epoxidase (ZEP), and PSII subunit S               due to overexpressed xanthophyll
                                       (psbS), background: Petite Havana (Kromdijk et al., 2016)                        cycle enzymes.
LMD                2018                Transgene from Arabidopsis thaliana expressing plastid division protein          Low mesophyll density: increased
                                       (FtsZ), background: Petite Havana.                                               chloroplast size and decreased
                                                                                                                        chloroplast number.
LCD                2018                Decreased mRNA levels of low cell density (LCD1) homolog of Nicotiana            Low mesophyll cell density and
                                       tabacum by RNAi, background: Petite Havana.                                      lowered photosynthetic capacity

Fig. 1. A ground-based phenotyping platform housing two hyperspectral cameras and an RGB camera (A), with a moveable white reflectance panel
mounted at the top of the canopy level (B).

3 nm in the visible and NIR spectra (350–1000 nm) and 8 nm in SWIR              five per plot in 2018. Measurements were made on the last fully expanded
(1000–2500 nm) spectra. The device houses a radiometrically calibrated          leaf, maintaining natural leaf orientation avoiding the leaf midrib and
light source which was standardized for relative reflectance prior to meas-     edges. On a single leaf, six reflectance spectra were recorded using the leaf
urement using a Spectralon (Labsphere Inc., North Dutton, NH, USA)              clip attachment in different regions of the same leaf. The six spectra for
panel for white reference. In 2017, three leaves were sampled per plot and      a single leaf were then averaged to give a mean spectrum per leaf. Each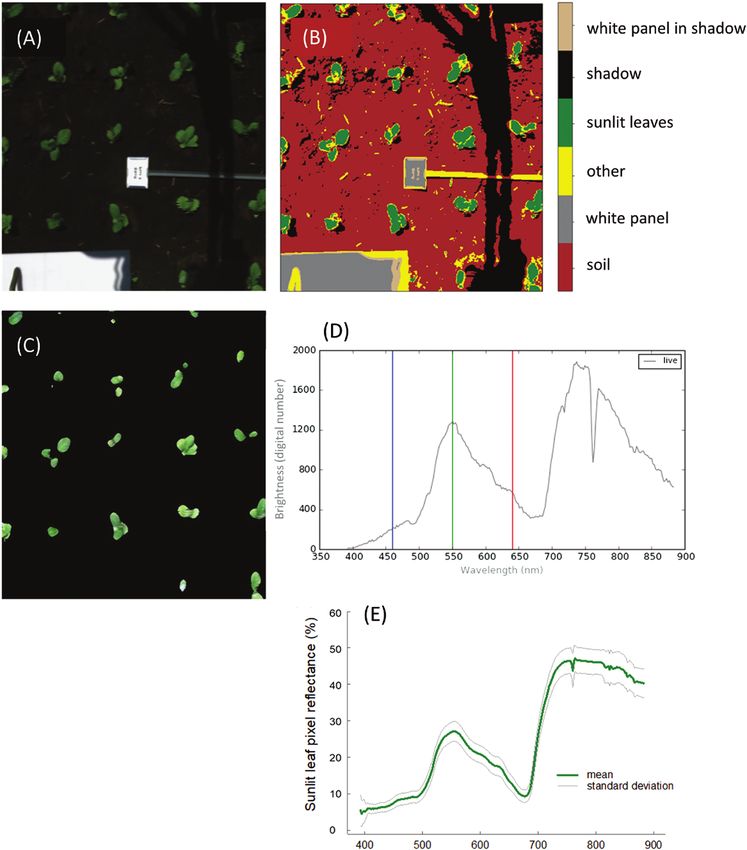
2316 | Meacham-Hensold et al.

                                                                                                                                                                Downloaded from https://academic.oup.com/jxb/article-abstract/71/7/2312/5754088 by Brookhaven National Laboratory user on 10 June 2020
Fig. 2. Example of the hyperspectral image analysis processing workflow. Images are captured in raw data mode (digital numbers) and represented as
an RBG image (A). Pixels are separated into categories using K-means clustering (B) to extract all sunlit leaf pixels, and converted to reflectance (C) from
raw data in digital numbers (D). Mean value and the SD of all sunlit leaf reflectance pixels are computed (D).

single measurement was the mean of 10 scans at a scan speed of 100 ms.          modified for N. tabacum. Although in our previous work (Fu et al., 2019),
A spectral splice correction was applied to each spectrum to remove heat        multiple stacked machine learning algorithms showed increased predict-
drift effects that may shift the sensors and align the visible and SWIR         ability (+5% for R2) of photosynthetic capacity (Vc,max), we used PLSR
sensors to the NIR sensors within the Fieldspec4, using the FieldSpectra        only in this work given the ability to derive scaling coefficients across the
package in R according to Serbin et al. (2015). For quality control, spectra    electromagnetic spectra from this technique, which allow inference of
with abnormally high light levels at 450 nm were excluded from analysis         important contributing regions of the spectra for trait prediction. Unlike
to ensure the leaf clip was properly fastened onto the leaf for each meas-      other predictive algorithms, PLSR coefficient loadings can be calculated
urement. Spectral samples with a deviation from the mean reflectance            to infer the physiological importance of specific spectral bands based on
>2% were eliminated from analysis along with leaves with fewer than             known vegetation spectral properties, and thus can be used to confirm
four viable spectra.                                                            the biological relevance of model builds between different devices and
   Predictive PLSR models for all traits were built at both leaf and canopy     scales.
levels for comparisons. For plot-level models, the averaged ground truth           We used the open-source PLS package (Mevik and Wehrens, 2007) in
subsamples (three leaf measurements in 2017 and five leaf measurements          R (The R Foundation for Statistical Computing,Wien, Austria) to create
in 2018) from each plot were used as input for model building and valid-        a linear model of waveband coefficients that account for trait variation in
ation. For leaf-level models, each individual leaf subsample measurement        reflectance spectra. The optimal number of components (latent variables:
was included as a training data point without averaging per plot.               LVs) for each model build was determined from the minimum root mean
                                                                                square error (RMSE) of the predicted residual sum of squares (PRESS)
                                                                                statistic (Esbensen et al., 2002), using a leave-one-out cross-validation
PLSR analysis                                                                   (CV) approach that then makes a prediction for the out-of-sample ob-
Predictive models were built for eight traits, following PLS principles         servation (Siegmann and Jarmer, 2015). This prevents overfitting. Models
(Wold et al., 2001) according to the protocol of Serbin et al. (2015),          were trained with data pairs of leaf or plot reflectance and a ground truth
Plot-level rapid screening for photosynthetic parameters using hyperspectral imaging | 2317
measurement, and cross-validated with 1000 times random resampling to Chlorophyll, carbon, and nitrogen content
determine model stability. All model R2 values presented herein are from In performance test 1, immediately following each leaf spectral measure-
this CV. Loading weights indicate known spectral peaks or profiles for ment, a 2.01 cm2 leaf disc was destructively harvested from each leaf using
each model and are translated to the variable importance in projection a cork borer, placed in 2 ml tubes and flash-frozen in liquid nitrogen. To
(VIP), calculated as the weighted sum of squares of PLS weights (Wold determine leaf chlorophyll (mg m–1), one leaf disc from each leaf was
et al., 2001; Farrés et al., 2015). incubated in 96% (v/v) ethanol for 24 h at 4 °C. The bleached material
Temperature corrections were not applied to bring photosynthetic and ethanol were mixed (100 µl of solution for each sample) and analyzed
parameters to a standard temperature prior to model fitting; absolute plot with a Synergy 2 photospectrometer (BioTek Instruments, Inc,Winooski,
temperature was not measured at the time of image capture. As such, all VT, USA) at 470, 649, and 665 nm (Lichtenthaler and Wellburn, 1983).
leaf- and plot-level models include temperature variation. No outliers To determine leaf carbon and nitrogen content (%), three more 2.01 cm2
were removed from the predictive models presented. leaf discs were destructively harvested, and dried until constant mass, and
Downloaded from https://academic.oup.com/jxb/article-abstract/71/7/2312/5754088 by Brookhaven National Laboratory user on 10 June 2020
a subset of ground tissue of known mass (3±0.5 mg) was combusted
with oxygen in an elemental analyzer (Costech 4010; Costech Analytical
Infra-red gas exchange measurements
Technologies) and calibrated to %N and %C against an acetanilide
CO2 response standard curve.
Photosynthetic (A) versus intercellular CO2 (Ci) response curves were col-
lected within 30 min of the leaf spectral measurements on the same last fully
expanded leaves to determine Vc,max and J1800 for each leaf using a portable
leaf gas exchange system with a leaf cuvette (LI-6800; LICOR Biosciences, Results
Lincoln, NE, USA). Four machines were used by four operators to ensure
unbiased sampling. Leaf temperature was determined as the mean of three
Physiological and spectral characteristics
measurements with a hand-held IR gun (FLIR TG54, FLIR® Systems, Our models captured a wide range of natural and genetically
Inc., Wilsonville, OR, USA). Leaf temperature for gas exchange was set to
match this mean leaf temperature prior to each CO2 response curve, and altered trait variation over consecutive growing seasons (2017
relative humidity was set to 65%. PAR was set to 1800 µmol m−2 s−1, and and 2018). For performance test 1, averaged plot-level meas-
CO2 concentrations were adjusted stepwise over a range of 50–2000 µmol urements of observed Vc,max, J1800, chlorophyll content, Chl a:b,
mol−1 in set increments as follows: 400, 200, 50, 100, 300, 400, 600, 900, N content, and C content (Supplementary Fig. S1A–F) in-
1200, 1500, 1800, and 2000. Leaves were acclimated to chamber conditions clude variation of environmental and meteorological condi-
for a minimum of 160 s prior to each A/Ci curve with a minimum and
maximum wait time of 160 s and 200 s, respectively, before each individual tions (between three and five subsamples per plot), with Vc,max
measurement of a response curve. Vc,max and J1800 were determined from from 13.4 µmol m−2 s−1 to 359.3 µmol m−2 s−1 (Supplementary
these A/Ci curves according to the mechanistic model of photosynthesis Fig. S1A), J1800 from 54.9 µmol m−2 s−1 to 362.1 µmol m−2 s−1
(Farquhar et al., 1980) and analyzed using a curve fitting utility developed (Supplementary Fig. S1B), chlorophyll content from 0.1 mg m–2
by Sharkey et al. (2007).While light response curves were carried out prior to 0.3 mg m–2 (Supplementary Fig. S1C), Chl a:b from 1.7 to
to analysis to determine saturating light intensity as ~1800 µmol m−2 s−1;
we refer to maximum electron transport as J1800 rather than Jmax to avoid 3.7 (Fig. S1D), N content from 2.53% to 8.4% (Supplementary
potential false claims of true maximal capacity (Sharkey, 2016). Mesophyll Fig. S1E), and C content from 36.2% to 47.4% (Supplementay
conductance (gm) was constrained according to values for tobacco at 25 °C Fig. S1F). In performance test 2, from light response curves
reported previously, with temperature dependency incorporated from the measured between 26 and 29 July in 2018, Pmax ranged be-
linear relationship of gm with temperature where y= –0.44 + 0.058x (Evans tween 4.1 µmol m−2 s−1 and 77.7 µmol m−2 s−1 (Supplementary
and von Caemmerer, 2013).
Fig. S1G), and ϕCO2 ranged between 0.024 µmol m−2 s−1 and
0.064 µmol m−2 s−1 (Supplementary Fig. S1H). Hyperspectral
Light response reflectance from all sunlit pixels per plot used to build PLSR
In performance test 2, to train the Pmax and ϕCO2 PLSR models, photo- models for all traits exhibit a peak centering at ~550 nm and
synthetic (A) versus irradiance (Q) response curves were collected within
30 min of leaf spectral measurements, on the same leaves, with a portable high reflectivity in the NIR from 800 nm to 1300 nm, and
leaf gas exchange system (LI-6800; LICOR Biosciences). All environ- a smaller peak developing from 1440 nm to 1800 nm, fol-
mental settings matched those for A/Ci response curves (temperature to lowing the expected spectral profile pattern. However reflect-
match ambient, relative humidity 65%), but with CO2 set to 400 µmol ance values are slightly lower than expected between 900nm
mol−1. Irradiance concentrations were adjusted stepwise over a range of and 1250 nm (Fig. 3).
2000–0 µmol m−2 s−1 in set increments as follows: 2000, 1800, 1400, 1000,
600, 400, 200, 150, 100, 75, 50, and 0.
Leaf absorption for each genotype was determined using an
integrating sphere (LI-1800; LICOR Biosciences) connected to a Plot-level PLSR predictions
spectrometer (USB-2000; Ocean Optics Inc., Dunedin, FL, USA) as
the mean absorptance of six last fully expanded leaves (Supplementary The corresponding reflectance spectrum from all sunlit pixels
Table S1 at JXB online) measured on the last day of performance test per plot (Fig. 3) paired with the observed, measured traits
2 (29 July 2018). A/Q curves were then corrected for absorbed ir- (Supplementary Fig. S1) produced robust predictive plot-level
radiance (Ia). ϕCO2 was calculated as the slope of the relationship be-
tween A and absorbed irradiance below 150 µmol m−2 s−1. Pmax was
models for all traits other than ϕCO2. Mean spectra used for
calculated by a non-rectangular curve fit according to Thornley and each model build in performance test 1 varied slightly, as spectra
Johnson (1990) as: without a paired ‘ground truth’ sample for each trait were elimin-
» ated from model build data sets (Fig. 3). For example, in the SSuD
2
Ia + Pmax − (Ia + Pmax ) − 4Ia θPmax genotype, J1800 could not be determined from gas exchange as
Pmax = − Rd
2θ the low Rubisco content meant this genotype was never elec-
tron transport limited but instead always Rubisco limited. Given
where Pmax is maximum light-saturated photosynthesis, ϕ is quantum
yield, Ia is absorbed irradiance, θ is the curvature factor, and Rd is the dark that J1800 could not be calculated, the J1800 spectral sample size
respiration rate. is reduced compared with the Vc,max model build (Fig. 3A, B).2318 | Meacham-Hensold et al.
Downloaded from https://academic.oup.com/jxb/article-abstract/71/7/2312/5754088 by Brookhaven National Laboratory user on 10 June 2020
Fig. 3. Mean plot-level sunlit leaf reflectance for all spectra included in plot-level PLSR models, from performance test 1, Vc,max (A), J1800 (B), chlorophyll
content and Chl a:b (C), and C and N content (D), and performance test 2, Pmax and ϕCO2 (E). Spectra are obtained from our automated image analysis
pipeline with the atmospheric water absorption band at 1313–1440 nm removed, and displayed with the minimum and maximum from all data and 95%
confidence intervals. n=the number of plots the spectra represent. Sample size for each trait varies dependent on the amount of viable ground truth
samples taken for each trait.
Similarly, a small number of leaf disc samples for leaf chlorophyll, Model loading weights indicate the importance of regions of
carbon, and nitrogen content were lost in transportation, storage, the reflectance spectra for trait variation. For plot-level PLSR
or during analysis, creating slight variation in spectral sample used predictions with a single VNIR camera (450–900 nm), the re-
for chlorophyll (Fig. 3C), and C and N (Fig. 3D) model builds. gion around 700 nm is important for all traits (Fig. 6). When
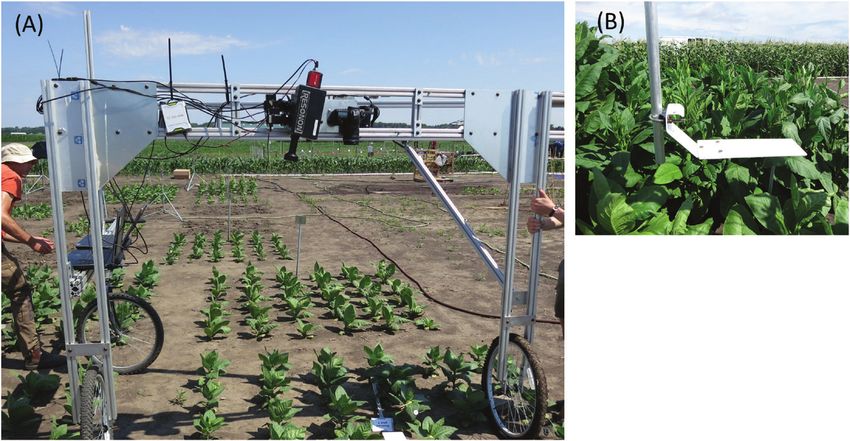
Using reflectance spectra from 450–900 nm only, collected translated to a VIP score for easier interpretation (Fig. 7), 700 nm
with a single VNIR hyperspectral camera, Vc,max (R2 0.79, is shown to be the most important region for Vc,max, J1800, and
RMSE% 11.9), J1800 (R2 0.59, RMSE% 11.5), chlorophyll con- chlorophyll content predictions. While ~700 nm is important
tent (R2 0.87, RMSE% 10), Chl a:b (R2 0.63, RMSE% 18.5), for all other traits, for C and N content regions from 500 nm to
and Pmax (R2 0.54, RMSE% 10.6) were highly predictable from 650 nm and from ~820 nm and ~870 nm in the NIR also hold
PLS hyperspectral regression models (Fig. 4; Table 2). PLSR importance (Fig. 7C, D). For Chl a:b and Pmax, the entire NIR
predictions performed moderately well for C content (R2 0.47, from 700 nm to 900 nm holds weight. When plot-level model
RMSE% 18.7, Fig. 4E) and N content (R2 0.49, RMSE% loadings (Fig. 6) and VIP scores (Fig. 7) are compared with those
15.9%, Fig. 4F), but offered no predictability for ϕCO2 (R2 from leaf-level PLSR models built using the same leaves that
0.02, RMSE%, Fig. 4H; Table 2). When compared with the ground truth the plot-level models, they generally follow the
single camera models, PLSR models using both hyperspectral same response pattern for all traits, with the exception of VIP
cameras (Fig. 5) had weakened predictive power (lower R2 scores for Chl a:b (Fig. 7D) and ϕCO2 (Fig. 7H).
and increased RMSE%) for all traits, except Chl a:b (Table 2).
Using both cameras, Vc,max (R2 0.74, RMSE% 13.1, Fig. 5B), Leaf-level PLSR models
R2 decreased by 5% and RMSE% increased by 1.9%. However,
for Chl a:b, predictability increases when both cameras are used When leaf-level PLSR models were built to include different spec-
(R2 0.77, RMSE% 14, Fig. 5D), where R2 increases by 14%, tral ranges (500–900, 500–1700, and 500–2400 nm), only Vc,max,
and RMSE% decreases by 4.5% (Table 2). N content, and Pmax predictability showed minor improvementPlot-level rapid screening for photosynthetic parameters using hyperspectral imaging | 2319
Downloaded from https://academic.oup.com/jxb/article-abstract/71/7/2312/5754088 by Brookhaven National Laboratory user on 10 June 2020
Fig. 4. Comparison between observed photosynthetic parameters and those predicted from PLS regression of plot-level sunlit leaf reflectance using
a single VNIR hyperspectral camera (450–900 nm) for Vc,max (A), J1800 (B), chlorophyll content (C), Chl a:b (D), C content (E), and N content (F) in
performance test 1, and Pmax (G) and ϕCO2 (H) in performance test 2. Observed parameters are the mean of 3–5 leaf-level ground truth measurements,
and predictions are the mean of 1000 times cross-validation of the model.
with greater spectral range (Table 3). The CV R2 for Vc,max re- a 2% increase when the full spectrum was used (500–2400 nm).
mained the same when the model used reflectance from 500 nm For Pmax CV, R2 increased by 7% when the spectral bandwidth
to 1700 nm, rather than from 500 nm to 900 nm, but there was matched that of both hyperspectral cameras (500–1700 nm)2320 | Meacham-Hensold et al.
Table 2. PLSR stability statistics for models built with a single camera (450–900 nm), and for models built with both cameras
(450–1700 nm)
Trait 450–900 nm (Pika II) 450–1700 nm (Pika II+Pika NIR)
2 2
Train R CV R RMSE RMSE (%) Bias Train R2 CV R2 RMSE RMSE (%) Bias Change Change
(trait unit) (trait (trait unit) (trait unit) in CV R2 in RMSE
unit) (%) (%)
Vc,max (µmol m–2 s–1) 0.91 0.79 38.7 11.2 -0.49 0.96 0.74 45.3 13.1 1.64 -5 +1.9
J1800 (µmol m–2 s–1) 0.88 0.59 35.3 11.5 -0.39 0.95 0.52 41.1 13.4 3.42 -7 +1.9
Chlorophyll (mg m–2) 0.98 0.87 0.02 10 0.002 0.98 0.55 0.03 15 –0.0008 -32 +5
Downloaded from https://academic.oup.com/jxb/article-abstract/71/7/2312/5754088 by Brookhaven National Laboratory user on 10 June 2020
Chl a:b 0.95 0.63 0.37 18.5 0.103 0.97 0.77 0.28 14 0.024 +15 –4.5
C content (%) 0.9 0.47 3.1 27.6 0.23 0.91 0.28 2.6 23.1 0.15 -19 +4.4
N content (%) 0.85 0.49 0.93 15.5 -0.32 0.95 0.40 1 17 –0.007 -9 +1.2
Pmax (µmol m–2 s–1) 0.82 0.54 7.77 1.06 0.12 0.91 0.50 8.52 11.6 0.75 -4 +1
ϕCO2 0.35 0.02 3.33 8325 0.014 0.5 0.01 3.79 9475 -0.099 -0.1 +1150
(quanta/A µmol m–2 s–1)
rather than with the single VNIR only (500–900 nm), but no with the Airbourne Visible Infrared Imaging spectrometer
benefit was seen with the addition of the SWIR (1700–2400 nm). (AVIRIS) has been used with PLSR analysis of reflectance
Leaf N content is the only trait for which improved predictability spectra to successfully predict photosynthetic capacity (Vc,max)
correlated with increased spectral range, with a 3% increase in at the agroecosystem canopy level, providing lessons for eco-
CV R2 using 500–1700 nm, and a further 7% increase using 500– system and earth system models (Serbin et al., 2015). The re-
2400 nm (Table 2). Unlike the plot-level ϕCO2 model, ϕCO2 sults here offer a tool to measure between these contrasting
was highly predictable from PLSR analysis of leaf-level spectral scales to derive photosynthetic capacity as a crop breeding
reflectance (CV R2 between 0.61 and 0.63,Table 3). selection tool. The predictive models presented in this study
For PLSR models built at the leaf level for three different show the utility of hyperspectral imaging as a tool for plot-
spectral ranges (500–900, 500–1700, and 500–2400 nm, level phenotyping for superior photosynthetic performance in
Fig. 8A–H),VIP scores in the VNIR from 400 nm to 800 nm large-scale field trials, offering potential to screen hundreds of
were larger than those in the NIR and SWIR from 800 nm accessions in a single day.
to 2400 nm, for all traits other than leaf C and N contents. For
C (Fig. 8E) and N (Fig. 8F) contents,VIP peaks at ~1400 nm Spectral compositional features
and 1900 nm suggest these regions also hold high importance
for predictability. Comparing VIP scores for models built with Electromagnetic energy in the visible range provides the en-
a single VNIR camera (Pika II, 450–900 nm) showed greater ergy for photosynthesis, and absorption in the visible region
variability than those for models built with two cameras (Pika specifically between 660 nm and 700 nm is of high importance
II and Pika NIR, Fig. 8I–P). While all models had high VIP for photosynthetic predictions from reflectance spectra (Serbin
scores between 450 nm and 900 nm, and C and N contents et al., 2012; Silva-Perez et al., 2018; Fu et al., 2019; Meacham-
followed a similar pattern seen at the leaf level (Fig. 8M, N), Hensold et al., 2019). Similarly, the region of transition from
Vcmax and J1800 also had VIP peaks at ~1100 nm and 1700 nm low reflectivity in the visible range to higher reflectivity in
(Fig. 8I, J). VIP scores for plot-level ϕCO2 models were not the NIR (~750 nm), termed ‘red-edge’, has been utilized to
shown due to the lack of predictability of this parameter with predict Vc,max (Dillen et al., 2012) and is also heavily weighted
hyperspectral imaging in this study. in previous PLSR predictive model loadings (Yendrek et al.,
2017; Silva-Perez et al., 2018; Meacham-Hensold et al., 2019).
These relationships are underpinned by the importance of
chlorophyll, nitrogen, and Rubisco in photosynthetic processes
Discussion (Evans, 1989) and the dominating influence of these pigments
Results show that photosynthetic capacity (Vc,max and J1800), on reflectance spectra from 500 nm to 800 nm (Curran, 1989;
maximum light-saturated photosynthesis (Pmax), and associ- Elvidge, 1990; Ustin et al., 2009).VIP scores quantify the con-
ated photosynthetic pigment contents (C, N, chlorophyll, and tribution of each variable (spectral bands) to overall variance
Chl a:b) can be predicted using high-throughput proximal and, in this study, when models were built using data from a
plot-level hyperspectral imaging. PLSR analysis of reflectance single VNIR camera (450–900 nm), the greatest peaks in VIP
spectra is now well established as a robust tool for estimating scores are also in the chlorophyll absorption bands and the red-
photosynthetic performance at the leaf level (Serbin et al., 2012; edge regions for Vc,max and J1800, Pmax, chlorophyll content, and
Ainsworth et al., 2014; Yendrek et al., 2017; Silva-Perez et al., N content (Fig. 7), fitting with previous spectral reflectance
2018), and the technique holds integrity when used on plants compositional observations (Farrés et al., 2015).
with altered photosynthetic pathways (Meacham-Hensold Previous leaf-level studies show that some regions of the
et al., 2019). At a broader spatio-temporal scale, data collected lower energy NIR, particularly ~1400 nm, are also importantPlot-level rapid screening for photosynthetic parameters using hyperspectral imaging | 2321
Downloaded from https://academic.oup.com/jxb/article-abstract/71/7/2312/5754088 by Brookhaven National Laboratory user on 10 June 2020
Fig. 5. Comparison between observed photosynthetic parameters and those predicted from PLS regression of plot-level sunlit leaf reflectance using
both VNIR hyperspectral camera (450–900 nm) and NIR/SWIR (900–1700 nm) cameras for Vc,max (A), J1800 (B), chlorophyll content (C), Chl a:b (D), C
content (E), and N content (F) in performance test 1, and Pmax (G) and ϕCO2 (H) in performance test 2. Observed parameters are the mean of 3–5 leaf-
level ground truth measurements, and predictions are the mean of 1000 times cross-validation of the model.
for photosynthetic PLSR predictions (Yendrek et al., 2017). predictability than those using reflectance from a greater spec-
However, in this study, plot-level models built using reflect- tral range (450–1700 nm) (Figs 4, 5; Table 3). This was unex-
ance in the VNIR range only (450–900 nm) give greater pected and may be the result of compounding factors. In our2322 | Meacham-Hensold et al.
Downloaded from https://academic.oup.com/jxb/article-abstract/71/7/2312/5754088 by Brookhaven National Laboratory user on 10 June 2020
Fig. 6. Model loadings from leaf-level and plot-level PLSR models from 450–900 nm for all traits: Vc,max (A), J1800 (B), chlorophyll content (C), Chl a:b (D),
C content (E), and N content (F) in performance test 1, and Pmax (G) and ϕCO2 (H) in performance test 2.
plot-level analysis using both cameras (450–1700 nm), we re- 2015), where removal of these bands is unnecessary when
moved reflectance between 1313 nm and 1440 nm given con- using a leaf clip with an artificial light source. Thus, it follows,
volution of reflectance spectra in that region from atmospheric with the absence of reflectance at ~1400 nm, that the spec-
water absorption properties (Hill and Jones, 2000; Serbin et al., tral region detected by the single VNIR camera (400–900 nm)Plot-level rapid screening for photosynthetic parameters using hyperspectral imaging | 2323
single VNIR camera (Fig. 4). In addition, when reflectance
spectra from both cameras (450–1700 nm) were used to build
predictive models,VIP scores for chlorophyll content (Fig. 8K),
Chl a:b (Fig. 8L), and Pmax (Fig. 8P) show that reflectance from
the NIR above 900 nm holds little or no importance (Fig. 8).
This is not surprising given that the absorption of chloro-
phyll occurs in the visible range (Ustin et al., 2009) and that
Pmax should be highly related to pigment and pigment pool
distributions. However, for Vc,max (Fig. 8I), J1800 (Fig. 8J), C
Downloaded from https://academic.oup.com/jxb/article-abstract/71/7/2312/5754088 by Brookhaven National Laboratory user on 10 June 2020
content (Fig. 8M), and N content (Fig. 8N), while VIP peaks
between 400 nm and 900 nm dominate, peaks at ~1150 nm
and 1750 nm are present, suggesting secondary importance of
these regions. Despite the known spectral properties for N and
C contents in these regions (Curran, 1989; Asner and Martin,
2008), and similarly high VIP scores around ~1100 nm in pre-
dictions of Vc,max from airborne spectroscopy (Serbin et al.,
2015), models for these three parameters built with reflectance
from both cameras (450–1700 nm) rather than just the VNIR
(450–900 nm) are weaker (Figs 4, 5; Table 2).
Chl a:b is the only trait for which predictions improve when
two cameras (450–1700 nm) are used for the model build ra-
ther than the single VNIR (450–900 nm) camera (Figs 4D,
5D).With known chlorophyll absorption dominant only in the
visible range, supported by the low loading values for the leaf
level Chl a:b models above 900 nm (Fig. 8D), this raises ques-
tions as to the cause of improved predictability when adding
reflectance spectra above 900 nm. This is probably due to the
dilution effect for spectral regions of physiological importance
when a ratio of two physiological traits is presented. While the
Chl a:b model is unlikely to be overfit given the reliance on
the PRESS statistic in latent variable number selection, physio-
logical importance is reduced, allowing ‘statistical’ number
training rather than physiologically based ‘trait’ training. Thus
care should be taken to eliminate spectral regions shown to
hold little weight for the original trait pair when using this
PLSR technique to predict ratio values.
Leaf-level comparisons
In attempts to understand the relationship between spectral
range and predictability power of PLSR models, we built
leaf-level models for all of the plot-level ground truth ma-
terial measured in this study at three different spectral ranges
(Table 3). For each trait, we built models first using reflectance
spectra measured with the Fieldspec4 from 500 nm to 900 nm,
secondly from 500 nm to 1700 nm, and thirdly from 500 nm
to 2400 nm. At the leaf level, with a single device measuring
from 400 nm to 2500 nm and an artificial light source, the only
trait prediction that improved with greater spectral range inclu-
sion was leaf N (500–900 nm CV R2=0.66, 500–1700 nm CV
R2=0.69, 500–2400 nm CV R2=0.76, Table 3). The predict-
Fig. 7. Comparison of variable importance projection (VIP) scores from
leaf-level and plot-level PLSR models from 450–900 nm for all traits: Vc,max
ability of all other parameters was not increased with increased
(A), J1800 (B), chlorophyll content (C), Chl a:b (D), C content (E), and N (F) in spectral range.This may be due to the almost equal importance
performance test 1, and Pmax (G) and ϕCO2 (H) in performance test 2. of VIP peaks around 1400 nm and 1900 nm when compared
with the chlorophyll and red-edge regions from 500 nm to
800 nm for N content (Fig. 8F). In contrast, at the leaf level
captures the most important regions for photosynthetic pre- for all other predicted traits in this study, the highest VIP scores
dictions. This offers one possible explanation for the strength occur between 500 nm and 800 nm, with only small peaks
of PLSR predictions for all parameters in this study from the in the NIR and SWIR (Fig. 8A–H), which may explain the2324 | Meacham-Hensold et al.
Table 3. PLSR models built at leaf level for all traits using three different spectral ranges (500–900, 500–1700, and 500–2400 nm)
Spectral range (nm) R2 Train R2 CV RMSECV (trait unit) RMSE (%) Model bias (trait unit) Latent variable (LV) no.
Vcmax (µmol m–2 s–1)
500–900 0.71 0.67 48.33 13.98 0.066 7
500–1700 0.75 0.67 45.21 13.08 0.497 10
500–2400 0.79 0.69 41.67 12.06 0.646 11
J1800 (µmol m–2 s–1)
500–900 0.59 0.40 38.58 13.38 1.211 11
500–1700 0.58 0.39 39.15 13.57 0.454 11
Downloaded from https://academic.oup.com/jxb/article-abstract/71/7/2312/5754088 by Brookhaven National Laboratory user on 10 June 2020
500–2400 0.53 0.40 41.38 14.35 0.017 8
Chlorophyll content (mg m–2)
500–900 0.82 0.78 0.02 8.82 0.00007 10
500–1700 0.78 0.74 0.03 9.76 0.00003 6
500–2400 0.80 0.77 0.03 9.32 0.00001 6
Chl a:b
500–900 0.87 0.78 0.25 8.56 -0.003 14
500–1700 0.86 0.79 0.25 8.84 0.0001 15
500–2400 0.85 0.76 0.50 7.50 0.005 13
C content (%)
500–900 0.86 0.74 0.96 7.85 -0.011 15
500–1700 0.84 0.76 1.01 8.30 0.007 15
500–2400 0.86 0.75 0.95 7.84 0.016 15
N content (%)
500–900 0.80 0.66 0.57 8.50 0.011 15
500–1700 0.80 0.69 0.58 8.65 0.007 15
500–2400 0.85 0.76 0.50 7.50 0.005 15
Pmax (µmol m–2 s–1)
500–900 0.63 0.50 8.04 10.92 0.12 9
500–1700 0.71 0.57 7.15 9.71 -0.04 13
500–2400 0.72 0.56 7.04 9.55 0.04 13
ϕCO2 (quanta/A µmol m–2 s–1)
500–900 0.76 0.62 0.004 8.82 0.000004 11
500–1700 0.77 0.63 0.003 8.63 -0.000001 12
500–2400 0.73 0.61 0.004 9.24 0.000044 9
lack of correlation between PLSR prediction power and spec- 1989), and the strong VIP peaks at ~1100 nm and 1700 nm
tral range included in the leaf-level model builds for Vc,max, (Fig. 8M, N). This unexpected reduced model strength with
J1800, chlorophyll content, Chl a:b, C content, Pmax, and ϕCO2. increased spectral range is likely to be due to instrumentation
While ϕCO2 is not predictable with PLSR analysis at the plot limitations. Hyperspectral imaging equipment for phenotyping
level (Figs 4H, 5H), it is highly predictable at the leaf level in field trials is limited. We used two hyperspectral cameras,
(Table 3; Supplemenetary Fig. S2), highlighting the need for with different spectral resolution (Pika II, 2.1 nm; Pika NIR,
high variation in observed trait values, to cover greater ‘trait 4.9 nm), different spatial resolution (Pika II, 7.4 µm pixel size;
space’ (Ely et al., 2019) for building robust models (Meacham- Pika NIR, 30 µm pixel size), and different signal to noise ratios
Hensold et al., 2019). Where observed leaf traits are averaged (Pika II,198; Pika NIR, 1885), given the lack of affordability
(between three and five subsamples) at the plot level for ϕCO2, and availability of a single sensor to cover the full electromag-
observed measurement repetitions are thus reduced, shrinking netic spectra. The NIR camera has greater intrinsic error.
the trait space and consequently the model prediction strength.
Vegetative structural reflective properties and the compara- Improving plot-level hyperspectral predictions
tive loading and VIP scores for leaf and plot-level models from
450 nm to 900 nm (Figs 6, 7) support the strength of plot-level The quality of the signal from the Pika NIR (900–1800 nm)
models built with a single VNIR camera (Fig. 4). Loadings and camera presents a key challenge throughout this work. Model
VIP scores may support a lack of improved predictability when predictions using two cameras are probably weakened due to
models for the same traits are built with reflectance from two technical limitations rather than lack of importance of par-
cameras that span a greater spectral range (400–1700 nm), but ticular NIR spectral regions for physiological trait prediction.
they do not explain the apparent reduction in predictive power The reflectance profile from the Pika NIR imaging system,
(Table 3). N and C content predictions, in particular, should ~900–1250 nm, is lower than expected when compared with
perhaps be improved when lower energy regions of the NIR reflectance measured with a leaf clip. Working with spec-
are included in analysis with both cameras, due to the known tral reflectance measured by imaging systems using sunlight
absorption features properties of C and N in the NIR (Curran, rather than a leaf clip with an artificial light source presentsPlot-level rapid screening for photosynthetic parameters using hyperspectral imaging | 2325
Downloaded from https://academic.oup.com/jxb/article-abstract/71/7/2312/5754088 by Brookhaven National Laboratory user on 10 June 2020
Fig. 8. PLSR model variable importance projection (VIP) scores for models built with different spectral ranges for leaf level and for Vc,max (A), J1800 (B),
chlorophyll content (C), Chl a:b (D), C content (E), N content (F), Pmax (G), and ϕCO2 (H), and at the plot level for the same traits, respectively (I–P). VIP
scores for plot-level ϕCO2 models are not shown due to the lack of predictability of this parameter at the plot level.
challenges, with light having been influenced by the atmos- compared with reflectance from integrated full-spectrum leaf-
phere before reaching the leaf and again after reflection before level devices. For example, quantification of leaf angles, re-
detection by a sensor. This results in a more complex signal moval of background noise from scattered reflectance at lower2326 | Meacham-Hensold et al.
canopy levels, removal of background noise from soil (Verhoef, for rapid field phenotyping for photosynthetic performance.
1984; Gao et al., 2000), and correction for plot temperature Such synthesis of large spatial and temporal data sets with user-
at the time of image capture (Serbin et al., 2015) could all friendly analysis pipelines that derive biologically relevant out-
improve plot-level model strength. Our plot-level reflectance comes will be increasingly important in the fight for increased
spectra are also lower between 900 nm and 1250 nm than global food production. The success of predictive models with
those from aircraft and other proximal hyperspectral imagers. a single VNIR hyperspectral camera widens the relevance and
Proximal hyperspectral imagery usually presents data captured potential application of this technique for greater utility, as re-
from nadir sensors rather than push-broom scanning plat- duced spectral bandwidth equates to reduced cost of acquisi-
forms. At the time of our data collection, for mounting ~1 m tion and operation of hyperspectral imaging systems.
Downloaded from https://academic.oup.com/jxb/article-abstract/71/7/2312/5754088 by Brookhaven National Laboratory user on 10 June 2020
above the target vegetation on a proximal sensing push-cart,
push-broom line sensors offered the greatest spatial resolution
and affordability. However, the camera angle rotation increases Supplementary data
directional anistropy and, coupled with light scattering from
Supplementary data are available at JXB online.
background vegetation, increases our signal to noise ratio.
Table S1. Leaf absorption values used to correct Pmax and
While our automated analysis pipeline (Fig. 3) very accur-
ϕCO2 for genotypes in performance test 2.
ately accounts for radiance at the time of image capture using
Fig. S2. ‘Ground truth’ Vc,max, J1800, chlorophyll content, Chl
a Teflon reference panel for accurate conversion to reflectance
a:b, N content, C content, Pmax and ϕCO2 values used to train
(Fig. 2B), the signal could probably be improved with an up-
predictive models.
dated nadir scanner and future incorporation of more complex
Fig. S3. Comparison between observed photosynthetic
radiative transfer modelling to account for background scat-
parameters and those predicted from PLS regression of leaf-
tering. Leaf-level VIP scores show less variation than plot-level
level reflectance using ASD Fieldspec4 with leaf clip attach-
scores (Fig. 8), particularly in the NIR. While VIP scores are
ment for ϕCO2 from reflectance from 500 nm to 900 nm and
higher at the plot level, peaks do follow the same trends, thus
from 500 nm to 1700 nm.
the variation is likely to be indicative of scattering detected by
Dataset 1. Spectrum collected with hyperspectral imaging
the NIR hyperspectral camera and sensor noise rather than a
cameras used for model builds for each trait as presented in
need to question the true importance of these regions for pre-
Fig. 3.
diction of a given trait.
Dataset 2. PLSR model predictions from a single VNIR
The variation in plot-level ground truthing also presents
hyperspectral camera (450–900 nm), as shown in Fig. 4.
a known challenge as plot-level estimations are trained with
Dataset 3. PLSR model predictions from two hyperspectral
leaf-level measurements. While currently this is the only real-
cameras (450–1800 nm), as shown in Fig. 5.
istic ground truth method for canopy photosynthetic measure-
ments, it is not ideal given the known limitations of applying
leaf-level measurements to canopy estimations (Amthor, 1994;
Acknowledgements
Baldocchi and Harley, 1995; De Pury and Farquhar, 1997; Wu
et al., 2016) and the known variation in photosynthetic rates This research was supported by a Bill and Melinda Gates Foundation
and capacities within crop canopies of the same germplasm grant OPP1060461, ‘RIPE—Realizing increased photosynthetic ef-
and even within plant crowns at the highest levels of a canopy ficiency for sustainable increases in crop yield’ and the USDA-ARS
due to variation in light environment (Niinemets, 2007). through Project Number 5012-21000-030-00D to the Global Change
and Photosynthesis Research Unit. We thank David Drag, Ben
More robust plot-level models could be trained with a greater
Harbaugh, Ben Thompson, and Ron Edquilang for greenhouse and field
number of ground truth samples, but the time taken to ob-
plant management. Professor Susanne von Caemmerer (ARC Centre
tain gas exchange measurements of photosynthetic capacity is of Excellence for Translational Photosynthesis Research, Australian
a limitation. These challenges persist for the high-throughput National University) kindly provided the Rubisco antisense Nicotiana
phenotyping and the remote-sensing community and, as tabacum. Johannes Kromdijk, Katarzyna Glowaka, Steven Driever, and
equipment develops and sensor integration capabilities ad- Stephen P. Long provided transgenic N. tabacum lines VPZ-23, PSBS-
vance, predictive models of the nature presented in this study 43, psbs-4, LMD, and LCD, and Paul South and Donald R. Ort pro-
will probably improve. Despite these challenges, this study vided lines Bypass AP3 and Bypass AP3/RNAi. Co-authors SPS and
proposes robust plot-level predictions of key photosynthetic JW were supported by the United States Department of Energy con-
parameters and structural traits that are the focus of current tract no. DE-SC0012704 to Brookhaven National Laboratory. We also
research efforts to increase crop yields for global food security thank Caitlin Moore, Amanda Cavanagh, Marshall Mitchell, Emily
Timms, Justine Brumm, Kyle Coffland, Morgan Prinn, Alyssa Dwyer,
(Evans, 2013; Ort et al., 2015).
Alex Riley, Isaac Howenstein, Jennifer Ward, Sam Jameson, and Elena
The challenges facing agricultural production in the face of
Pelech for assistance with the field work. Any opinions, findings, and
resource limitation and changing climate necessitates methods conclusions or recommendations expressed in this publication are
for rapid screening of large field trials for productivity and those of the author(s) and do not necessarily reflect the views of the
performance. The results from the automated hyperspectral U.S. Department of Agriculture (USDA). Mention of trade names or
image analysis pipeline we present synthesize high-resolution commercial products in this publication is solely for the purpose of
plot-level information to a single sunlit plot leaf reflectance providing specific information and does not imply recommendation
spectrum for use in a variety of applications. Photosynthetic or endorsement by the USDA. USDA is an equal opportunity provider
predictions from PLSR analysis of this output offers a tool and employer.You can also read