Drug Money and Bank Lending: The Unintended Consequences of Anti-Money Laundering Policies
←
→
Page content transcription
If your browser does not render page correctly, please read the page content below
Drug Money and Bank Lending: The
       Unintended Consequences of Anti-Money
                Laundering Policies∗

              Pablo Slutzky1 , Mauricio Villamizar-Villegas2 , and Tomas Williams3
                            1
                            Department of Finance, University of Maryland
                                     2 Central Bank of Colombia
                      3 Department of Economics, George Washington University

                                                    Abstract
          We explore how anti-money laundering (AML) policies affect banks and credit pro-
      vision to firms. For identification we exploit the enactment of a financial regulation in
      Colombia. Aimed at controlling the flow of money from drug trafficking into the fi-
      nancial system, we find that after implementation bank deposits in municipalities with
      high drug trafficking decline. This negative liquidity shock has consequences for credit
      in other municipalities. Banks sourcing their deposits from areas with high drug traf-
      ficking cut lending relative to other banks. Using a proprietary database containing
      data on bank-firm credit relationships, we show that small firms that rely on credit
      from affected banks experience a negative shock to sales, investment, and profitability.
      Furthermore, we use night-lights data to show that these results are not due to a re-
      allocation of activity across firms nor between the formal and informal sectors. Our
      evidence uncovers a hidden to be considered when implementing AML policies.

JEL Classification: K42, G18, G21

Keywords: Money laundering; organized crime; financial system; bank lending; liquidity; economic growth

   ∗
     Corresponding author: Pablo Slutzky, R. H. Smith School of Business, University of Maryland, 4427 Van Munch-
ing Hall, College Park, Maryland, 20742. Email: pslutzky@rhsmith.umd.edu. We received valuable comments from
Allen Berger, Jason Donaldson, Joras Ferwerda, Rohan Ganduri, Şebnem Kalemli-Özcan, Michael Levi, Victor Ly-
onnet, Gabriel Natividad, Ronen Palan, Lorenzo Pandolfi, Jose Luis Peydro, Jacopo Ponticelli, Peter Reuter, Daniel
Rico, Julio Riutort, Felipe Saffie, Andre Silva, Janis Skrastins, Bryan Stuart, Cesar E. Tamayo, and conference and
seminar participants at AL CAPONE workshop on crime, AML Empirical Research Conference, Annual Conference
in Financial Economics Research (IDC), ASSA 2020, the 8th MoFiR Workshop on Banking, Short-Term Funding
Markets Conference, the Darla Moore School of Business (IB), IAE Business School, McGill University, and the
University of Maryland. The views expressed herein are those of the authors and should not be attributed to the
Central Bank of Colombia, its Executive Board, or its management. Maria Alejandra Ruiz Sanchez provided excellent
research assistance.

                                                        1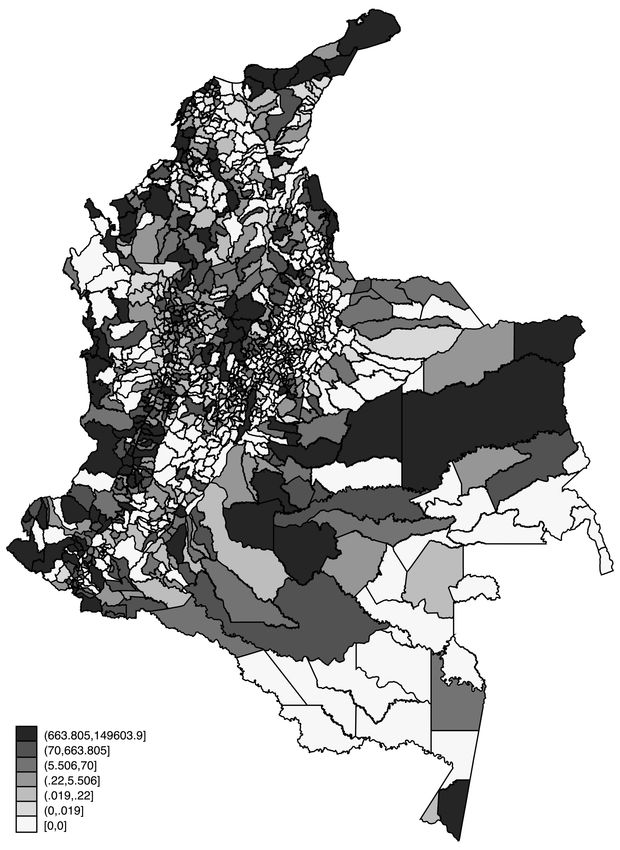
“This year, Pemex earned $4 billion dollars, this country’s biggest exporter. My or-
              ganization made $15 billion dollars. I pull my money from your banks... this country
              crumbles. Overnight.”

                     Diego Luna, enacting drug lord Miguél Ángel Félix Gallardo in Narcos: Mexico.

                                              I.    Introduction

Money laundering is often a key element in organized crime operations. Despite global efforts to

deter it, financial globalization as well as rapid developments in technology and communications

allow money to flow quickly and easily, facilitating the laundering cycle. The amount of money

laundered globally each year is estimated to be somewhere between 2% and 5% of global GDP.1 In

this context, the United Nations Office on Drugs and Crime declared that the “task of combating

money-laundering is more urgent than ever.”2

    Numerous studies argue that money laundering undermines the integrity of the financial sys-

tem, channels resources to less efficient sectors, increases reputation risks, and facilitates corruption,

among other things.3 The economic and social benefits to an effective deterrent to money launder-

ing seem to be fairly straightforward. Nonetheless, they could have unintended consequences. For

instance, money laundering can increase liquidity in the financial system and allow firms to borrow

and invest, especially in developing countries (Levi (2002)). In such cases, effective anti-money

laundering (AML) policies have important negative consequences. For example, rapid implementa-

tion of these policies could produce a sudden decrease in liquidity in the financial system, reducing

credit availability. This could lead to a decline in investment, employment, and economic activity.

    Despite the importance and widespread use of AML policies, there are, to the best of our

knowledge, no empirical studies analyzing these consequences.4 Several empirical challenges could
1
  Early evidence of the fight against money laundering is the establishment of the Financial Action Task Force on
  Money Laundering (FATF) at the 1989 G-7 summit, with the goal of coordinating actions against money laundering.
2
  https://www.unodc.org/unodc/en/money-laundering/globalization.html, accessed on July 8th 2019.
3
  See, for example, Melvin and Ladman (1991), Taylor (1992), Quirk (1997), Masciandaro (1999), Bartlett (2002), Levi
  (2002), Thoumi (2002), Bagella et al. (2004), Reuter and Truman (2004), Holmes and De Piñeres (2006), Levi and
  Reuter (2006), Geiger and Wuensch (2007), Argentiero et al. (2008), Barone and Masciandaro (2008), Unger (2009),
  Dalla Pellegrina and Masciandaro (2009), Ferwerda (2009), Walker and Unger (2009), Schneider (2010), Barone
  and Masciandaro (2011), Pedroni and Yepes (2011), Slim (2011), Kumar (2012), Ardizzi et al. (2014), Chong and
  Lopez-De-Silanes (2015), and Loayza et al. (2017).
4
  One potential exception is Collin et al. (2015). However, the authors acknowledge that their data only allows them

                                                         2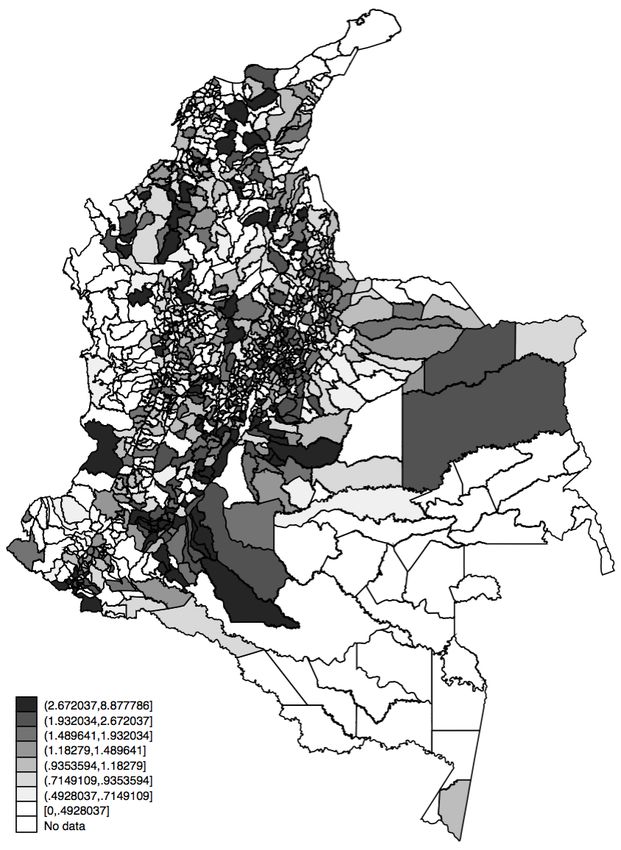
explain this. First, measuring the flow of funds from illicit activities into banks is inherently

difficult. Second, aggregate bank data do not allow differentiation between credit supply effects

and a decline in firms’ credit demand. Third, information linking banks and private firms is rarely

available.

    In this paper, we empirically analyze the effects of AML efforts on the financial system by

studying the implementation of an AML regulation in Colombia, a developing economy and the

world’s largest producer of cocaine (World Drug Report 2019, UNODC). In 2008, the Colombian

government issued a regulation that required financial institutions to implement an asset laundering

and terrorist financing risk management system (SARLAFT) to identify and manage the risk of

being used to launder money. The objective of this regulation was to prevent the flow of money

from illegal activities into the financial system. We employ four steps to explore the consequences

of the implementation of SARLAFT in the financial system.

    First, we study whether the regulation affected the flow of funds into municipalities with higher

illegal drug activity. Since illegal drug activity is unobservable, we proxy it using official records of

cocaine confiscations at the municipality level prior to the AML regulation.5 Using a difference-in-

differences approach, we find that bank deposits in municipalities affected by illegal drug activities

declined relative to deposits in non-affected municipalities after the implementation of the AML

regulation. Quantitatively, a one standard deviation increase in exposure to illegal drug activities

translates into approximately a 0.6% decline in the volume of aggregate deposits at the municipality

level following the regulation. Interestingly, the decline in deposits is not immediate, becoming

noticeable 18 months after the implementation and coinciding with stricter enforcement as measured

by a dramatic increase in money laundering cases received by the Office of the Prosecutor.6

    Second, we examine whether bank lending was affected by the negative liquidity shock. To

do so, we compare lending by banks that source their deposits in areas with higher illegal drug
  to observe correlations and not to make systemic judgments. Meanwhile, Ferwerda (2013) compiles a lists of 25
  effects of money laundering mentioned in the literature and notes that “hardly any of the effects are backed by
  empirical evidence” (our emphasis).
5
  While data on the location of illicit coca crops are available, the proceeds from the sale of coca leaves remain mostly
  in the informal sector and do not enter the formal financial sector. More information is provided in Subsection A..
6
  Throughout the paper, we refer to the timing of the passage of the regulation as the “implementation” date and
  to the timing of the stricter enforcement of the regulation as the “enforcement” date, as measured by a noticeable
  increase in the number of money laundering cases processed, which more than doubled from 2009:Q4 to 2010:Q1.

                                                           3
activity with lending by banks that source their deposits in other areas. One potential concern with
this estimation strategy is the effect that the AML regulation might have had on credit demand.
For instance, it could reduce the availability of criminal money in the formal economy, reducing
consumption and demand for firms’ products. Such a decline would lower the demand for credit
in areas with high illegal drug activity and might result in an erroneous interpretation of the
results. To overcome this problem, we exploit differences in the geographical structure of banks’
branch networks and only focus on bank lending in municipalities with little or no drug trafficking
activity. Furthermore, we use municipality-time fixed effects that proxy for credit demand at the
municipality level, which allows us to isolate the effect of credit supply changes from the demand
for credit. We show that banks that source their deposits in areas with higher illegal drug activity
reduced lending to firms in areas not directly affected by the AML regulation relative to banks
that source their deposits from other locations. This finding suggests that the negative liquidity
shock led to a contraction in credit supply to areas not directly affected by the AML regulation via
banks’ internal capital markets. Consistent with this channel, the timing of the fall in commercial
credit coincides with that of the decline in deposits.
Third, we explore the effect of the negative credit supply shock on economic growth. Using a
proprietary database, we match bank-firm credit data with firms’ financial statements for more than
20,000 predominantly private firms in Colombia for the 2006-2014 period. We compare outcomes
for firms within the same industry and municipality and exploit differences in indirect exposure to
the AML regulation, measured as the credit-weighted share of exposure faced by each firm’s lenders.
We show that the credit supply shock significantly affected the growth of small firms. In particular,
we find that for small firms, a one standard deviation increase in indirect exposure is associated
with a 9.3% larger decline in sales, a 10% larger decline in property, plant, and equipment, a 3.4%
larger decline in total assets, a 24.3% larger decline in the level of financial debt, and a 2.5% larger
decline in net profits.
Last, we examine the aggregate effects in municipalities indirectly affected by the negative
liquidity shock. In particular, we analyze total economic activity —both formal and informal—
as proxied by the intensity of night lights. We find that indirect exposure, as measured by the
4credit-weighted exposure of the banks that operate within that municipality, is associated with
a decline in the intensity of night lights. Our firm-level results correspond to a decline in real
economic activity, not to a reallocation of economic activity across firms or to a shift away from
the formal economy.
This paper makes several contributions to the literature. First, it provides novel causal evidence
on a negative unintended consequence of AML policies. This contribution stems from our ability
to combine a sound research design with unusually detailed data on banks and firms. Papers such
as Masciandaro (1999), Bartlett (2002), Geiger and Wuensch (2007), Barone and Masciandaro
(2008), Pedroni and Yepes (2011), and Kumar (2012) focus on the benefits and costs of AML
policies. However, other papers concentrate on the monetary and operational costs of these policies.
Meanwhile, Agca et al. (2020) study how AML policies affect the composition of banks in areas
more exposed to money laundering by imposing disproportionate costs on small banks. Our paper
uncovers an additional cost, namely the reduction of the funds available to fund licit businesses via
banks’ internal capital markets. Our paper is, to the best of our knowledge, the first to demonstrate
empirically the effectiveness of AML policies in preventing inflows of money from illegal activities
into the financial system.
Our second contribution is to provide causal evidence that liquidity shortages in bank deposits
lead to a contraction in credit supply with negative real effects, especially for small firms. Thus,
we show the importance of deposit funding for banks. In general, previous studies have shown that
liquidity windfalls for banks lead to expansions of credit supply (Gilje et al. (2016); Bustos et al.
(2017); Carletti et al. (2019)), but there is little evidence of the effect of negative liquidity shocks on
firms in a setting where banks do not simultaneously experience solvency issues.78 Three notable
exceptions are Schnabl (2012), Paravisini et al. (2015), and Restrepo et al. (2019). Schnabl (2012)
looks at a negative liquidity shock experienced by Peruvian banks during the 1998 Russian crisis and
how it affected their lending to firms. Relative to this paper, we make two contributions. First, we
7
In papers such as Amiti and Weinstein (2011), Chodorow-Reich (2014), Carvalho et al. (2015), Kalemli-Ozcan et al.
(2016), and Huber (2018), banks are affected by both liquidity and solvency shocks.
8
More broadly, this paper is related to a large literature on the economic effects of credit supply shocks such as Khwaja
and Mian (2008), McKenzie and Woodruff (2008), Cole (2009), Jimenez et al. (2012), Banerjee and Duflo (2014),
and Chodorow-Reich (2014). We show that a regulation designed to combat money laundering had unintended
consequences in the supply of credit.
5provide additional evidence on the real effects of a negative liquidity shock on firm-level outcomes
such as sales, investment, and profitability, and on municipality-level outcomes, such as number of
firms, employment, and real economic activity. Second, we show that negative shocks to funding
via deposits, as compared to bank-to-bank lending shocks, also lead to economic contractions.
Meanwhile, Paravisini et al. (2015) study the effect on Peruvian exporters of exposure to banks
differentially affected by the global financial crisis. However, due to large entry costs involved in
exporting, the firms studied are sizable, with average debt levels above one million USD. Our data
allows us to study the effect on smaller firms and on aggregate outcomes. Last, Restrepo et al.
(2019) exploit a shock in Colombia subsequent to ours to study how a relative increase in the cost
of very short-term debt affected the funding structure of firms. Although similar to ours in terms
of geography and time period, we study the real economic effects of a shock to banks’ liquidity.
Finally, our paper contributes to the literature on organized crime, where papers such as Daniele
and Marani (2011), Pope and Pope (2012), Pinotti (2015), Bianchi et al. (2017), Dimico et al.
(2017), Moglie and Sorrenti (2017), Ganau and Rodriguez-Pose (2018), Scognamiglio (2018), and
Slutzky and Zeume (2018) study the effect of organized crime on development, productivity, and
economic growth. We contribute to this literature by identifying an additional mechanism by which
criminal activities affect licit firms. By laundering money, criminal organizations provide funds to
the financial system that affect growth in regions other than where they operate.
The paper proceeds as follows. In Section II. we provide an overview of the illegal drugs industry
in Colombia, the money laundering process, and the banking system. Section III. describes the
data used in the paper. Section IV. presents the methodology we use to study the effect of the AML
regulation on the economy and discusses the corresponding results. In Section V. we conclude.
II. Institutional Setting
Colombia is a unique setting to study the economic effect of illegal drug money. In this section, we
provide an overview of the Colombian economy, its money laundering problem, and the efforts to
control it. We also describe its banking system. For the interested reader, we provide additional
information on the history of the illegal drugs industry and the fight against money laundering in
6the Internet Appendix.
A. The Illegal Drugs Industry
Colombia is the fourth largest economy in Latin America and 39th globally, with a GDP of USD
323.8 billion as of 2019. Its service sector constitutes 56% of the GDP, followed by the indus-
trial sector (38%) and agriculture (6%). It is the 26th largest country in terms of area and has a
population of 49.6 million. The country is politically divided into 32 departments and a capital
district. The mean department has 1.4 million inhabitants, but the population is highly concen-
trated in the capital district (Bogota), with over 8 million inhabitants. Each department is split
into municipalities, for a total of 1,122 municipalities across the country.9
The illegal drugs industry in Colombia has evolved for over half a century. By the 1980s,
Colombia was already the largest producer of cocaine in the world. Although some things have
changed over the last two and a half decades following governmental efforts to eradicate coca
production and trafficking, many others have not. The recent report issued by the United Nations
Office on Drugs and Crime provides a rich description of the current situation of coca and cocaine
production in Colombia.10 Evidencing the partial failure of the war against drug production and
trafficking, we find that only three out of thirty-two departments (the first political division of
Colombia) are coca-free, when there were eight coca-free departments in 2008. Figure 1 shows the
geographical distribution of coca crops across the country. In addition, 80% of the areas with coca
plantations detected in 2016 had been previously detected, evidence that growers perceive a low
risk of detection or law enforcement. The report also indicates that Colombia produces between
55% and 76% of the global cocaine base. Its estimated cocaine hydrochloride production for 2017
is 1,379 metric tons, an increase of 31% over its 2016 capacity.
The previous findings shed light on several facts. Colombia is still the largest cocaine producer
in the world, a status that the country has maintained for decades. Illegal drugs activities are
scattered across the country, and illegal drug activity generates large revenues.
9
Source: DANE, Colombian National Department of Statistics.
10
“Colombia - Survey of territories affected by illicit crops. UNODC (2017).”
7B. Money Laundering
Money laundering is the conversion of revenue from illicit activities into assets that cannot be traced
to the originator. There are three stages in the process: placement, layering, and integration. The
initial stage involves placing the funds from illicit activities into the financial system via deposits,
the purchase of money orders or checks, or via the cash purchase of financial instruments, such
as securities or insurance contracts, among other avenues. The second stage is that of layering.
The funds are then moved to create multiple layers between the funds and their origin. In some
cases, the funds are used to purchase securities, or used to pay for goods or services via fictitious
business expenses and fake invoices, transferring the funds to shell corporations. The last stage is
integration. Funds flow into the licit economy via the purchase of assets, such as real estate, luxury
goods, or financial assets.
C. The Fight against Money Laundering
Colombia’s efforts to curb money laundering were weak until 2008.11 That year, in response to in-
ternational pressure, the Superintendencia Financiera de Colombia, which is the government agency
responsible for overseeing financial institutions and regulations, passed the regulatory circular 026,
requiring financial institutions implement an Asset Laundering and Terrorist Financing Risk Man-
agement System (SARLAFT, after its Spanish acronym). The system would help the supervised
entities to manage the risk of being used as instruments to launder money or to channel resources
towards the funding of terrorist activities. However, each supervised entity has to develop and per-
fect its own money laundering prevention system.12 The goal of the system should be the effective,
efficient, and timely knowledge of all customers, compliance with the processes related to interna-
tional lists of suspicious people, and development of capacity to report suspicious transactions and
certain cash transactions to the Financial Information and Analysis Unit (UIAF). Thus, it was not
until early 2010 that financial institutions had implemented the system and the regulation had a
significant impact, as illustrated by the number of money laundering cases received by the Office
11
Detailed information is provided in the Internet Appendix.
12
Failure to develop a proper SARLAFT for each financial institution carried a monetary penalty.
8of the Prosecutor, as shown in Figure 2.13
While efforts to combat drug production and trafficking do not seem to have had a discernible
impact in Colombia, efforts to deter money laundering seem to have had a significant effect. The
Basel Anti-Money Laundering Index attempts to measure countries’ risk level in money launder-
ing/terrorist financing; in 2017 it ranked Colombia amongst the countries with the lowest risk.14
It is the Latin American country with the lowest ranking (lowest risk), and has risk levels compa-
rable to those of Norway and France and lower than those of Germany and the United Kingdom.
Unfortunately, the index was first constructed in 2012, therefore there is no information to analyze
the effect of the regulation on Colombia’s risk of money laundering.
D. Colombian Banking Sector
There are four types of financial institutions in Colombia: banks, financial corporations, leasing
companies, and financial cooperatives. The banking sector, which is the focus of this paper and
consists of a small number of banks, is the largest, with more than 86% of total assets in the financial
system under control. At the beginning of 2008, when the AML regulation was implemented, there
were 16 banks authorized to operate in Colombia: 10 domestic and 6 foreign. Another characteristic
of the banking sector in Colombia is that it is highly concentrated. The five largest banks control
over two-thirds of total assets, and four of these banks are domestic.
In 2008, there were 4,222 bank branches across 817 municipalities. Table 1 provides summary
statistics for each bank, and Figure 3 shows the number of bank branches in each municipality.
There are fewer banks in the south east, in the departments of Amazonas, Vaupés, and Guainía,
which are departments that border Brazil and are slightly populated (less than 0.35% of the total
population).
These branches are a key resource for firms. According to the World Bank’s data on domestic
13
The number of cases received by the Office of the Prosecutor declined significantly in 2011. A potential expla-
nation for this is that with intensified controls in the banking sector, money launderers shifted towards other
mechanisms, such as illegal gold mining. Consistent with this, the Office of the Comptroller reported in August
2013 that as of 2011, 63% of the entire mining sector was operating illegally, compared to 36% a decade ear-
lier. https://www.contraloria.gov.co/documents/20181/198738/Separata-Mineria-Ilegal.pdf/4d3d5cbe-4bda-430a-
831e-ef2f6bbf5d0d?version=1.0, accessed on July 10th, 2019.
14
Colombia ranked 125th out of 146 countries.
9credit by banks, when the regulation was implemented in 2008, the private sector in Colombia
ranked among the highest in Latin America in terms of reliance on domestic credit, surpassed only
by Chile and Brazil. Its level of dependence on domestic credit is higher than in Argentina, Bolivia,
Ecuador, Mexico, Paraguay, Peru, and Uruguay. This characteristic makes a shock to the flow of
funds into banks potentially damaging for firms.
III. Data
For our study, we merge multiple datasets. Our first dataset includes quarterly information on
banks’ deposits and loans at the bank-municipality level for 2006:Q1 to 2014:Q4. These data were
provided by the Superintendencia Financiera de Colombia, the government agency responsible
for overseeing and regulating financial institutions. This information includes the volumes held in
different types of deposit accounts (savings, checking, term, etc.) and loans (commercial, mortgages,
consumption, microcredit, etc.). For each quarter, our dataset includes information on between
1,600 and 2,200 bank-municipality combinations. This number is lower than the total number of
branches because our data are at the bank-municipality level, and in large municipalities banks
have more than one branch.
Our second dataset includes Colombian firms’ financial statements and was provided by the
Superintendencia de Sociedades, the Colombian agency responsible for monitoring firms. We obtain
information from 2006 to 2014, and the data for 2007:Q4 are summarized in Table 2. For each
year, we obtain the balance sheet, income statement, and cash flow statement for reporting firms.
Our dataset includes information on more than 20,000 firms. Our median firm has annual sales of
USD 944,000.
The third source of data is a proprietary credit registry that includes information on new
loans issued and balances outstanding of existing loans. This information is reported quarterly by
financial institutions under Form 341 and includes the tax ID of the borrower, allowing us to match
the data with firms’ financial statements. Our fourth dataset comes from the Department of Labor
of Colombia, and includes information at the municipality-year level on the number of firms and
employees between 2009 and 2014.
10Our fifth source of data includes information on cocaine confiscations at the municipality-year
level. These data were provided by the Observatorio de Drogas de Colombia, the government agency
responsible for the dissemination of information related to drugs and related crimes. The agency
provides yearly information on drug confiscations at the municipality level starting in 1999. The
data include information on drug seizures. We focus on cocaine seizures, since the monetary value
of the production and trade of cocaine in Colombia is orders of magnitude larger than that of any
other illegal drug. For instance, the year in which the regulation was implemented almost 200,000
kilograms (220.5 tons) of cocaine were seized, but only 645 kilograms (1,422 pounds) of heroin and
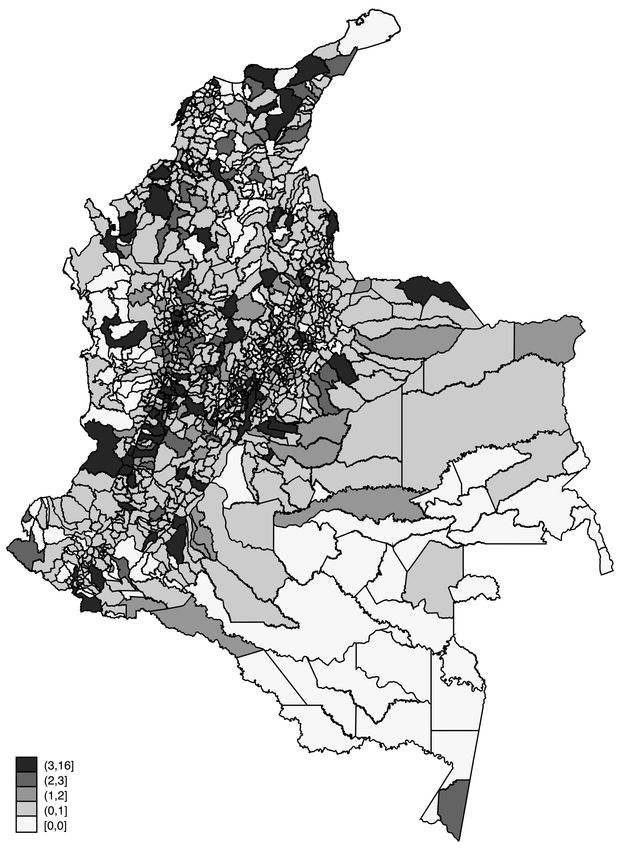
none of LSD. Table 3 presents the annual data from 1999 to 2007 aggregated at the department
level, and Figure 4 provides aggregate confiscations from 1999 to 2007 at the municipality level.
Our median municipality has no cocaine confiscations, and about a quarter of the municipalities
have confiscations.
The last dataset provides information on the intensity of artificial lights, used as a proxy of
economic activity, which has been frequently used in the literature when reliable data are not
available [for instance, in Henderson et al. (2012) and Chodorow-Reich et al. (2018)]. These data
are collected by the U.S. Air Force Weather Agency and processed by the National Oceanic and
Atmospheric Administration’s National Geophysical Data Center. The processing involves the
removal of observations for places experiencing the bright half of the lunar cycle, the summer
months when the sun sets late, auroral activity, and forest fires, leaving primarily man-made light.
We collect these data for 2006-2014 and match it with Colombian municipalities using geographic
coordinates for each municipality.
IV. Methodology and Results
In this section, we describe the methodology we use to study the effect of the AML regulation
on the economy and discuss the corresponding results. We proceed in three steps. First, we test
whether controls on the flow of illicit funds into banks had an impact on deposits. Second, we
test whether banks that source their deposits in areas with high levels of illegal drug activity cut
lending in other areas in response to the AML regulation. Last, we explore the consequences for the
11real economy looking at firms’ financial statements, employment, number of firms, and intensity of
artificial light in each municipality following the implementation of the AML regulation.
A. Bank Deposits
To study the effect of the AML regulation on bank deposit flows, we compare deposits in munici-
palities with different degrees of exposure to illicit activities, before and after SARLAFT. We use
data on cocaine confiscations at the municipality level to construct a measure of its exposure to
illicit activities. Our assumption is that the volume of cocaine seizures in a municipality is pro-
portional to its level of drug-related business. While data on coca crops are readily available, our
preference for data on cocaine seizures is based on the amount of money involved in the different
parts of the production process and on the location where this money enters the formal financial
system, the focus of our study.15 The price of fresh coca leaves in 2018 was approximately USD
0.95 per kilogram (USD 0.43 per pound). Once the coca leaves are processed and transformed into
cocaine hydrochloride, its price is USD 1,633 per kilogram (USD 740.7 per pound) in Colombia,
and much higher in countries like the U.S.. This means that with a planted area of 81,000 hectares
(200,155 acres) in 2008, the total price of coca leaves produced was approximately USD 370 million.
Meanwhile, the price of the 1,379 metric tons of cocaine hydrochloride produced was approximately
USD 2.25 billion.
A potential concern is that cocaine confiscations data are affected by selection bias. Confis-
cations signal among other things the inability of drug lords in that municipality to corrupt the
authorities. Thus, municipalities with no confiscations might still have high levels of illegal drug
activity, but drug lords find ways of evading the authorities and the law. Given this, our estimates
are likely a lower bound of the effects of the AML regulation on the bank deposits. More likely,
confiscations can be thought as an implicit tax on the income generated by drug-related activities
that allow authorities to signal commitment and enforceability.16
15
Melvin and Ladman (1991) show that, in coca-leaf-producing areas in Bolivia, the U.S. dollars derived from the
illegal activity enter the informal loan market.
16
We thank Daniel Rico for this insight.
12A.1. Municipality-level Results
We test whether the AML regulation impacted the inflow of bank deposits as follows.17 We aggre-
gate deposits across banks at the municipality level for each quarter. We then use a difference-in-
differences approach to test whether municipalities in areas with higher illegal drug activity expe-
rience a decline in deposits following the regulation.18 In Figure 5, we plot the quarter-by-quarter
coefficients of a regression of municipality-level log deposits on the exposure of the municipality to
illegal drug activity, as measured by the volume of cocaine confiscations. The first vertical dashed
line demarks the implementation of the AML regulation (2008:Q3, while the second vertical dashed
line depicts the quarter before the large increase in AML cases reported in Figure 2 (2009:Q4). In-
terestingly, we find that the effect is not discernible immediately after the introduction of the AML
regulation. In fact, the timing of the decline in bank deposits coincides with the sharp increase in
money laundering cases received at the prosecutor’s office, suggesting that the implementation and
enforcement of the AML regulation was slow. This is consistent with the fact that the regulator
did not provide an AML system, and that each bank had to develop its own, test it, and perfect
it. In light of this evidence, in our estimations we consider the effective start of the regulation as
the first quarter of 2010, when the AML cases processed increase substantially.
Our baseline empirical specification to test this is as follows:
ln(Deposits)m,q = αm + αq + β (Exposurem P ostq ) + εm,q , (1)
Our dependent variable, ln(Deposits)m,q , is the log of the volume of banks deposits in municipality
m in quarter q. Exposurem is the extent to which a municipality is exposed to illegal drug activity,
as measured by cocaine confiscations between 1999 and 2007, the year before the passage of the AML
regulation. P ostq is a dummy variable set to one in 2010:Q1, when enforcement became stricter,
and the following quarters. We include two sets of fixed effects: municipality fixed effects (αm )
17
We study the inflow of money that originated in criminal activities irrespective of the hierarchy of the individual
involved in the financial transaction. While it is unlikely that the funds belong to cartel leaders –since they have
other means to launder money– they might belong to local drug lords or intermediaries such as carriers or sales
people.
18
We obtain very similar estimates when using deposit growth as our dependent variable.
13control for the time-invariant characteristics of bank deposits at the municipality level, and quarter
fixed effects (αq ) control for common shocks that affect bank deposits. In alternative specifications,
we include department-time fixed effects to control for regional shocks. For robustness, we use
alternative measures of exposure, including cocaine confiscations between 2003 and 2007. Standard
errors are clustered at the municipality level.
The results in Table 4 show that municipalities with higher levels of exposure to illegal drug
activity experience a decline in bank deposits following the implementation of the AML regulation.
In specifications for columns (1)-(3), we use data on cocaine confiscations from 1999 to 2007 to
measure exposure. The coefficients in column (1) show that municipalities with a higher exposure
to illegal drug activity experience a large decline in bank deposits after the AML regulation was
enforced. More specifically, a one standard deviation increase in exposure to illegal drug activities
translates into a 0.6% decline in deposits post-regulation. These results are similar after the in-
clusion of time and municipality fixed effects (column (2)) and municipality and department-time
fixed effects (column (3)). For robustness, in columns (4)-(6) we use data on confiscations from
2003 to 2007 and find that the results are economically and statistically similar.1920
For robustness, we perform two additional tests. First, we perform a similar test using the
growth of bank deposits instead of levels and find similar results, as shown in Table A1 in the
Internet Appendix. Second, to mitigate concerns that our measure of confiscations might be biased
due to corruption at the local police level, we repeat the test using only cocaine confiscations by
the national military forces of Colombia, which are less prone to local corruption.21 The results in
Table A2 are similar to those found using confiscations by both local and federal authorities.
19
Interestingly, the coefficients on P ost in columns (1) and (4) is positive and significant. While we cannot explicitly
attribute this growth to the AML regulation due to other simultaneous events at the country level, it might be
argued that the regulation had a positive overall effect on deposits by, for instance, improving the reputation of
banks.
20
A potential concern is that the areas where the drug cartels operate are larger than the municipalities we identify
as exposed to illicit activities using the confiscations data. In this case, following the regulation, deposits would
decline not only in the municipalities we identified but also in neighboring municipalities, biasing our results. While
this is plausible, such an effect would bias the estimated coefficients downwards.
21
We thank Murillo Campello for this suggestion.
14A.2. Bank-level Results
The richness of our data allows us to analyze whether our results are driven by certain banks and not
others. With this in mind, we test two hypotheses. First, that foreign banks were already subject to
stricter scrutiny in terms of money laundering, and that our results are driven by domestic banks.
Second, that the results are driven by the largest state-owned bank — Banco Agrario — the most
widespread bank and the only bank present in some municipalities.
We start by replicating our results with data at the bank-municipality level in Table 5, where
we additionally include municipality-bank and department-time fixed effects. We repeat our prior
tests and obtain similar results in column (1) as those in Table 4. We then include an indicator
variable for foreign banks and test whether these banks behave differently. In column (2), we do not
find this to be the case, with the coefficient for the triple interaction term being indistinguishable
from zero. We next repeat the analysis excluding Banco Agrario de Colombia from our sample. In
column (3) we find similar results as those in column (1), suggesting that our results are not driven
exclusively by the state-owned bank.
A.3. Additional Evidence on Bank Deposits
There are two alternative explanations for our results that merit evaluation. First, they might reflect
a shift in locations as to where illegal drug money enters banks and not a decline in the volume.
For instance, income from illicit activities could be deposited in areas with weaker enforcement
of the AML regulation. In this case, the results in Table 4 would reflect a relocation rather than
a decrease in money flows into the financial system.22 Second, there is the possibility that the
decline in bank deposits is not due to money laundering, but to legal money. For example, if
there is a decline in drug-related businesses due to the AML regulation and this affects economic
activity, people and businesses might move from municipalities with higher illegal drug activity
to those with lower activity. In turn, this could lead to a differential effect on bank deposits. To
rule out these concerns, we focus on the second stage of the money laundering process, layering.
22
Note that this would be a violation of the Stable Unit Treatment Value Assumption (SUTVA) in our difference-in-
difference model since municipalities that act as a control group would be positively affected by the treatment.
15After the placement stage, when the funds enter the financial system, drug cartels transfer funds
between jurisdictions to create additional layers between the funds and the underlying activity that
generated them.
To test whether our results capture a shift in locations, we focus on the aggregate volume of
money flowing to foreign jurisdictions typically used to launder money. We obtain data on cross-
country claims by Colombian residents from the Bank for International Settlements (BIS). The
quarterly data include the volume of claims by Colombian residents reported by 30 counterparties,
which allows us to measure the effect of the AML regulation on cross-country flows of money. We
use the Basel AML Index to identify jurisdictions with a higher risk of being used to launder money
and test whether there is a differential effect of the regulation on the volume of claims in these
countries, vis-à-vis countries with lower risk. This index was developed by the Basel Institute on
Governance and is based on three aspects: the FATF Mutual Evaluation Reports, the Financial
Secrecy Index, and the U.S. State Department International Narcotics Control Strategy Report.
Our specification is:
ln(Claims)c,q = αq + αc + β1 High Riskc × P ostq + εc,q , (2)
Our dependent variable, ln(Claims)c,q , is the volume (logged) of claims owned by Colombian
residents in country or jurisdiction c and quarter q. High Riskc is an indicator variable set to one for
Guernsey, Isle of Man, Jersey, Luxembourg, and Switzerland, jurisdictions with a high risk of being
used for money laundering. P ostq is an indicator variable set to one from 2010 onwards. We include
quarter and country fixed effects to absorb common shocks and country-specific characteristics. The
results in the column (1) of Table 6 show that following the enforcement of the AML regulation,
claims in high-risk countries decline by approximately 37% relative to those in low-risk countries,
suggesting that our results reflect an actual decrease in volume, not a relocation of money laundering
activity. We illustrate this result in Figure 6, where we plot the year-by-year coefficients of this
estimation. Prior to the enforcement of the AML policies, there is no differential trend in the
claims of Colombian residents between countries with low and high risk of being used for money
laundering. In contrast, from 2010 onwards there is a decline in the volume of claims in high-
16risk countries relative to low-risk ones, suggesting that the enforcement of the AML regulation in
Colombia decreased the total volume of money laundering activity.
B. Bank Lending
We next test whether the drop in deposits affected banks’ lending to domestic firms. A potential
concern is that the AML regulation can simultaneously affect loan demand by firms in affected
municipalities. For instance, the regulation likely reduces incentives to engage in criminal activity,
affecting local employment and consumption and reducing the demand for firms’ products and ser-
vices, which would reduce credit demand. In order to mitigate the concern of potential confounding
effects due to changes in credit, we exploit banks’ branching networks and focus our analysis on
municipalities with low or no illegal drug activity.
Our identification strategy is based on comparing the supply of commercial loans within a
municipality by banks with different levels of exposure to the AML regulation. We construct a
measure of the 2007 pre-AML regulation exposure to illicit funds at the bank level. This measure
indicates the percentage of deposits sourced from municipalities with high levels of illegal drug
activity relative to the total deposits for each bank, and is measured as follows:
PM
m=1 Depositsb,m Im
Exposureb = PM
, (3)
m=1 Depositsb,m
where M is the number of municipalities in which the bank operates, Depositsb,m is the volume of
deposits in bank b and municipality m, and Im is a proxy of whether municipality m is exposed to
illegal drug activity. More specifically, Im is equal to one if the volume of cocaine confiscations is in
the top quartile across municipalities. Thus, our measure captures the percentage of bank deposits
in bank b that are sourced from affected municipalities. For the banks in our study, exposure ranges
from 42.43% to 100%.
Next, we test whether the decline in bank deposits affected lending to firms in municipalities
not directly exposed to illegal drug activities. We do so with the following difference-in-differences
specification:
ln(Loans)m,b,q = αb + αm,q + β (Exposureb P ostq ) + εm,b,q (4)
17Our dependent variable, ln(Loans)m,b,q , is the log of new commercial loans (volume) granted by
bank b in municipality m in quarter q. Exposureb is a measure of the extent to which a bank draws
its deposits from municipalities with high levels of illegal drug activity, as measured in equation
(3). We include two sets of fixed effects. Municipality-quarter fixed effect (αm,q ) control for shocks
at the municipality level that might affect loan demand. Bank fixed effects (αb ) control for the
time- invariant characteristics of the loans issued by a bank. Standard errors are clustered at the
municipality level. This specification allows us to control for local demand shocks and identify
the effect of the funding gap on lending. In addition, to address potential confounding effects
from changes in credit demand in municipalities directly exposed to illicit activities, we focus on
municipalities not directly exposed to the AML regulation. For that, we exclude municipalities in
top quartile in terms of the volume of cocaine confiscations.
For the results to be meaningful, we make two assumptions. First, we follow Bustos et al.
(2017), and assume that due to interbank market imperfections, banks fund part of their lending
operations with their own deposits. Second, we assume that banks operate an internal capital
market (i.e., funds raised in one municipality can be used to issue loans in another municipality).
In our context, this is a crucial assumption, since it would transfer the shock from affected to
non-affected municipalities. While this notion is consistent with findings by Gilje et al. (2016)
and Ben-David et al. (2017) for the U.S. market, we study the validity of this assumption for the
Colombian market by creating a loan-deposit ratio at the bank-municipality level at the end of 2007.
Without internal markets — and ignoring reserve requirements — this ratio should be one or less
for all bank-municipalities. Table 7 presents evidence that some municipalities are net providers
of funds (those with loan-deposit ratios below one) and others are net receivers of funds (those
with loan-deposit ratios above one). In some cases, the differences are stark. For instance, Banco
Agrario de Colombia has branches in municipalities that are pure sources of funds (loan-deposit
ratios are zero), while branches in other municipalities are net receivers, with coefficients close to
9. To provide a graphical representation, Figure 7 is a map of the distribution of net receivers and
net providers of funds for Banco Agrario de Colombia at the end of 2007. This evidence suggests
that there is a functioning internal capital market within banks.
18Table 8 presents the results of our test of the effect of the AML regulation on bank lending.
Banks with higher exposure to illegal drug activity reduce lending in non-directly exposed mu-
nicipalities. In particular, the results in column (1) show that a one standard deviation increase
in a bank’s exposure to illegal drug activity is associated with a decline of 32% in the supply of
new commercial credit following the AML regulation. When we include time fixed effects in the
regression, the results do not change significantly, as shown in column (2). In addition, the re-
sults are robust to the inclusion of municipality-quarter fixed effects (column (3)) showing that,
within a municipality, banks with a one standard deviation higher exposure to illegal drug activity
experience a 35% decline in the supply of new commercial credit relative to other banks.23
To further illustrate our results we plot the quarter-by-quarter coefficients from our estimation
framework in Figure 8. This figure shows that prior to the enforcement of the AML regulation, there
was no differential effect in new commercial credit supplied by more and less exposed banks. This
suggests that other potentially confounding shocks that might have occurred during that period do
not seem to affect differentially banks with different levels of exposure to illegal drug activity. This
is important for our identification strategy, since Colombia was affected by the 2007-2009 global
financial crisis, which took place during the period we examine.
Moreover, we find that the fall in new commercial credit coincides with the decline in bank
deposits in areas with higher illegal drug activity triggered by the stricter enforcement of SARLAFT
(Figure 5). There are two reasons why our results on bank deposits and new commercial credit
merit some discussion. First, while deposits in Figure 5 experience a recovery following the decline
in bank deposits, there is a persistent decrease in new commercial credit, as shown in Figure 8.
Second, in response to a one standard deviation increase in exposure to illegal drug activity, bank
deposits fall by 3% when we consider our bank-municipality level results in Table 5. Meanwhile,
new commercial credit falls by about 35% on average.24 To put these numbers in perspective, we
compare the magnitude of the effect on bank deposits to the effect on new commercial credit. A 3%
23
In unreported results, we find that banks more exposed to illegal drug activityexperience a decline in profitability
following the enforcement of the AML regulation, relative to less exposed banks. This is consistent with more
exposed banks being hurt due to the reduced funding and consequent contraction in credit.
24
We compare our estimates from the bank-municipality deposit estimations in Table 5 to our credit estimates in
Table 8, which are also at the bank-municipality level.
19decline in the average volume of bank deposits (81,143.4 million COP) translates into a decrease
in bank deposits of 2,434.3 million COP. Meanwhile, a 35% decline in the average volume of new
commercial credit (289.8 million COP) translates into a decline of 101.7 million COP per quarter.
Thus, over the 2010-2011 period, new commercial credit in indirectly affected municipalities declined
by 813.6 millions COP, which amounts to 33.4% of the decline in bank deposits. This magnitude
seems plausible given that we are only analyzing new commercial credit in non-affected areas and
that a fraction of bank deposits is held as bank reserve requirements.
B.1. Credit Supply or Credit Demand?
One potential concern with our specification is that the effect we capture is due to changes in
credit demand and not a response to a decline in the credit supply. One way we address this in
Table 8 is that we only consider municipalities with low or no confiscations, which should be less
directly affected by the AML regulation. In addition, we present two additional pieces of evidence
consistent with a credit supply channel. First, we use data on interest rates for new commercial
credit from the credit registry. We re-estimate equation (4) using the level of interest rates as a
dependent variable. Consistent with a credit supply channel, in Table 9 we find an increase in
interest rates for banks that are more exposed to illegal drug activity, even when we control for
municipality-time fixed effects. Quantitatively, a one standard deviation increase in bank exposure
leads to a 34 basis points higher interest rate following the stricter enforcement of the regulation.
Second, we also re-estimate equation (4) and include municipality-time fixed effects, which capture
the average growth in new commercial credit within each municipality and quarter. Our results in
column (3) in Table A3 in the Internet Appendix are robust to the inclusion of these fixed effects.
A potential concern is that we are not capturing all unobservable factors related to credit
demand, and that our results may suffer from omitted variable bias. Altonji et al. (2005) and
Oster (2019) suggest that a potential omitted variable bias can be analyzed by looking at how the
R-squared and estimated coefficients change due to the introduction of observable controls.25 In
our framework, we introduce observable controls that proxy for time-varying credit demand at the
25
See Williams (2018) for an application of this method to analyze the effects of credit supply and credit demand.
20municipality level. When we compare the results in column (3) to those in column (1) in Table A3,
we find that introducing fixed effects at the municipality-time level increases the R-squared from
10% to 47%, a more than fourfold increase. Despite that, the coefficient in column (3) is relatively
similar and within the confidence interval of that in column (1); if anything, the coefficient in
column (3) is slightly larger (in absolute terms). Therefore, the introduction of municipality-time
fixed effects captures a substantial variation in credit growth, while does not appearing to affect our
treatment effect. This suggests that the estimated effect we document is unlikely due to changes
in credit demand at the municipality level.
C. Consequences for the Real Economy
In this subsection, we analyze the effects of the negative credit supply shock on the real economy.
We start by analyzing firm-level outcomes and then examine night light intensity as a proxy for
both formal and informal economic activity.
C.1. Firms’ Financial Statements
We study firms’ outcomes and test whether the negative liquidity shocks for banks and the con-
sequent negative credit supply shock affect firms’ growth. We exploit a proprietary dataset that
includes all the loans issued to firms by all the banks in Colombia, during the 2006-2014 period.26
We match this information with the financial statements of firms in Colombia. We end up with
2,143 firms with a relationship with at least one bank in our sample.27
Our empirical strategy relies on firms’ differential access to financing, where the source of
variation comes from the exposure to illegal drug activity of the banks each firm borrows from. For
instance, two otherwise identical firms operating in the same industry and municipality might have
relationships with different banks, therefore their access to financing might differ after the AML
regulation and impact their outcomes. We construct a firm-level measure of indirect exposure to
the regulation by evaluating the exposure of the banks the firm borrows from. Thus, we calculate
26
Our results are robust to using alternative time periods.
27
A number of firms obtain loans from financial institutions, such as credit cooperatives, that are not regulated by
the Superintendencia Financiera de Colombia and/or that do not take deposits. Since the information provided by
these financial institutions is limited, we cannot measure their exposure to illegal drug activity.
21pre-regulation indirect exposure (IE) to the AML regulation as follows:
PB
b=1 Commercial Loansb,f Exposureb
IEf = PB , (5)
b=1 Commercial Loansb,f
where B is the number of banks that lend to firm f , Commercial Loansb,f is the size of loans from
bank b to firm f at the end of 2007, and Exposureb is our bank-level measure calculated in equation
(3). Thus, our measure captures the share in a firm’s credit portfolio that each bank has, as well
as the exposure of each bank to the negative liquidity shock.
To illustrate, we provide a simplified example. Suppose that there are only two banks in
Colombia, Bank A and Bank B. Bank A (B) sources 80% (30%) of its deposits from municipalities
exposed to illegal drug activity. Now consider three firms, X, Y, and Z, that are not directly exposed
to illegal drug activity (i.e., they operate in municipalities with no cocaine confiscations between
1999 and 2007). Firm X borrows exclusively from Bank A. Thus, the indirect exposure of firm X is
80% (1 x 0.8). Firm Y borrows exclusively from Bank B. Thus, the indirect exposure of firm Y is
30% (1 x 0.3). Firm Z borrows from both banks in equal amounts, therefore the indirect exposure
of firm Z is 55% (0.5 x 0.3 + 0.5 x 0.8). This example shows that, even though these three firms
are not exposed to the AML regulation directly, they are indirectly affected via the internal capital
market of the banks and their negative liquidity shock.
Our specification to test the effect of the AML regulation on firms’ outcomes is as follows:
yf,m,i,t = αf + αi,t + αm,t + β1 × P ostt × IEf + γf,t−1 + εf,m,i,t , (6)
where yf,m,i,t is one of our outcome variables for firm f in municipality m, operating in industry i at
time t. IEf is the measure of exposure calculated in equation (5) and P ostt is an indicator variable
that is set to one starting in year 2010, when enforcement of the AML regulation became strict.
We include firm fixed effects (αf ), industry-time fixed effects (αi,t ), and municipality-time fixed
effects (αm,t ), to control for shocks to each particular industry, shocks to each municipality, and
unobservable firm characteristics, respectively. We also include firm-level controls (γf,t−1 ), such as
size and profitability, and we cluster standard errors at the firm level. In an alternative specifica-
22tion, we include industry-municipality-year fixed effects (αm,i,t ). In all of these specifications, we
exclude firms that operate in municipalities in the top quartile in terms of the volume of cocaine
confiscations.
Equation 6 allows us to compare outcomes of firms that operate in the same industry and
municipality, but rely on credit from different banks. Our coefficient of interest is β1 , which
measures the effect of the negative credit supply shock on firms with higher indirect exposure to
the AML regulation. We report the results in Table 10. We find that, on average, there is no real
effect on firms’ outcomes. One potential explanation is that the average effect masks heterogeneity
across firms. Arguably, the effect on small firms might be larger, since small firms are usually more
financially constrained (Beck et al. (2008)). Thus, they might face larger difficulties when seeking
alternatives for bank credit. In order to test this, we estimate the following:
yf,m,i,t = αf + αi,t + αm,t + β1 × P ostt × IEf + β2 × P ostt × Smallf +
(7)
β3 × P ostt × Smallf × IEf + γf,t−1 + εf,m,i,t ,
where Smallf is an indicator variable for firms below the median in terms of sales within each
municipality at the end of 2007. Equation 7 allows us to test the heterogeneous effects on different
sized firms. Our coefficient of interest is β3 , which measures the differential effect on small firms
with higher indirect exposure to the AML regulation. As before, to address potential confounding
effects, we focus on municipalities not directly exposed to illegal drug activity.
The results in Table 11 show that following the decline in bank deposits in municipalities
affected by illegal drug activity, small firms that were indirectly affected experience worsening
business outcomes. The results in Panel A indicate that a one standard deviation increase in
indirect exposure to the credit supply shock (0.065) for small firms is associated with a 9.3% (-
1.432 x 0.065) larger decline in sales, a 6.5% larger decline in cash holdings (although not significant
at the 10% level), a 10% larger decline in property, plant, and equipment, a 3.4% larger decline in
total assets, a 24.3% larger decline in the level of financial debt, and a 2.5% larger decline in net
profit. In contrast, we find no effect on large firms. When we include industry-municipality-year
fixed effects, the results remain practically unchanged, as shown in Panel B.
23You can also read