Westpac New Zealand Limited - Submission to the Reserve Bank of New Zealand on "Capital Review Paper 4: How much capital is enough"
←
→
Page content transcription
If your browser does not render page correctly, please read the page content below

Westpac New Zealand Limited

       Submission to the Reserve Bank of New Zealand on
       “Capital Review Paper 4: How much capital is enough”

       17 May 2019

                                                  Mark Weenink
                                      General Manager, Regulatory Affairs,
                            Corporate Legal Services and General Counsel New Zealand
                                         Westpac New Zealand Limited

                                                                                       1

Classification: PROTECTED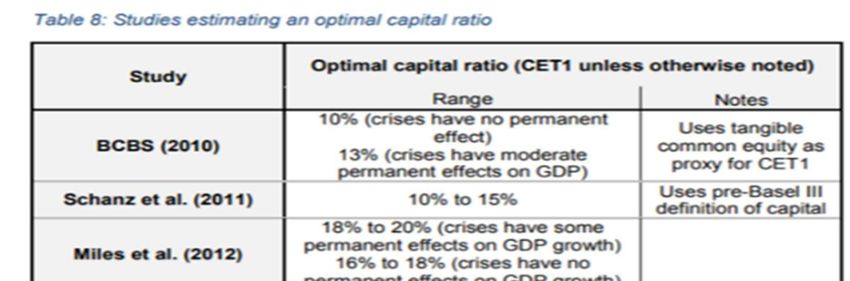
1. Background

                       1.1. This submission to the Reserve Bank of New Zealand (RBNZ) is made on behalf of Westpac
                            New Zealand Limited (WNZL) in respect of the consultation paper “Capital Review Paper 4:
                            How much capital is enough?” (January 2019) (Consultation Paper). Westpac's contact for
                            this submission is Mark Weenink (General Manager, Regulatory Affairs, Corporate Legal
                            Services & General Counsel).

                 2. Executive Summary

                       2.1. WNZL supports the RBNZ’s objective of ensuring that New Zealand banks are well capitalised
                            for the safeguarding of the financial system and the prevention of banking crises. WNZL
                            believes that well-managed and strongly capitalised banks will ensure resilience of the banking
                            system through periods of stress and are key building blocks for a robust New Zealand
                            economy.

                       2.2. However, WNZL considers that the proposals outlined in the Consultation Paper (Proposals)
                            go significantly further than is required to meet these objectives, go well beyond international
                            norms and would create a productivity drag. Given the complexity of the combination of
                            untested inputs and likely wide ranging impact of the Proposals, a comprehensive independent
                            cost-benefit analysis is required.

                       2.3. In particular, WNZL considers that the Proposals are unnecessarily conservative and, if
                            implemented, will significantly impact the cost and quantity of credit available to New Zealand
                            borrowers.

                       2.4. WNZL estimates that the cumulative imposition of such high levels of regulatory capital on
                            New Zealand banks will increase the cost to borrowers in New Zealand by more than 100bps
                            (as demonstrated in paragraph 2.8 of Part E), which would equate to an increase of
                            approximately $6,000 to the annual borrowing cost for an average home loan in Auckland (as
                            an example).1

                       2.5. The conservatism in the Proposals is particularly evident in three areas:

                            a)   Quantum of capital: The proposal to require banks that the RBNZ designates as
                                 systemically important in New Zealand (D-SIBs) to hold 16% Tier 1 capital is significantly
                                 higher than in comparable international jurisdictions. Further, as is acknowledged by the
                                 RBNZ, banks hold an operating buffer above the regulatory minima.2 Therefore, the
                                 practical effect of the Proposals would be to increase the average capital held by D-SIB
                                 banks to around 18 percent3 of risk weighted assets (RWA).

                            b)   Measurement of RWA: The RBNZ has proposed increasing the risk weightings on New
                                 Zealand banks’ assets substantially beyond international comparable risk measurements
                                 without providing quantitative justification. The effect of this proposal would be to increase
                                 the cost to borrowers and to place New Zealand’s producers at a disadvantage to
                                 international competitors.

                            c)   Capital instruments: The impact of the Proposals is further amplified by the “de-
                                 recognition” of Additional Tier 1 (AT1) hybrid capital. In the absence of eligible securities
                                 in New Zealand markets, this capital will require replacement by Common Equity Tier 1
                                 (CET1) capital. The effect for WNZL would be to require a further $1.5bn of CET1 capital.

                 1
                   Refer to Table 6 below at paragraph 2.14 of Part E.
                 2
                   Reserve Bank of New Zealand Capital Review Paper 4: How much capital is enough? (December 2018).
                 3
                   Including a 2% operating buffer.

                                                                                                                             2

Classification: PROTECTED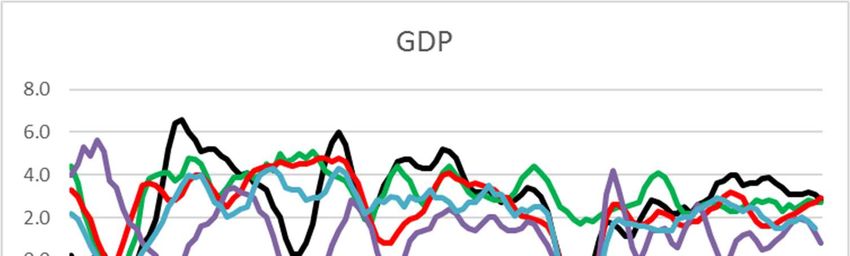
2.6. The cumulative impact of the Proposals would be to increase CET1 capital requirements of D-
                            SIB banks from 9.5% to 18%4; an increase of 8.5%. This would amount to increased CET1
                            capital of around $4.5bn for WNZL and more than $25bn across New Zealand banks to meet
                            current lending. In order to fund growth at a rate of 3%5 over the proposed five-year transition
                            period, WNZL would be required to raise additional CET1 capital of $6.5bn.

                       2.7. The following Parts A to F set out our submissions in more detail. Specifically, our submissions
                            are:

                            a)         The risk appetite framework: the bases of the risk appetite framework adopted in the
                                       Proposals are flawed. The effect is to significantly overstate the optimum level of capital
                                       to be held by New Zealand banks; (Part A)

                            b)         Risk weightings: the risk weightings, output floors and scalar adjustment included in the
                                       Proposals have been structured with the objective of “levelling the playing field” between
                                       internal ratings-based (IRB) accredited banks (the four largest banks) and standardised
                                       banks (all other banks). Whilst we do not accept that this is part of the RBNZ’s statutory
                                       mandate, the objective can be achieved in a more efficient manner, substantially
                                       lessening the impact on the wider economy; (Part B)

                            c)         Recognition of AT1 capital instruments: AT1 capital plays a critical role in meeting “going
                                       concern” capital needs in a cost-efficient manner while providing New Zealand investors
                                       with exposure opportunities to New Zealand banks. AT1 instruments are accepted by
                                       other international banking regulators and form a key part in providing efficient capital to
                                       banks in comparable jurisdictions. The concerns raised with respect to AT1 capital
                                       instruments by the RBNZ are without reasonable foundation and are overstated, and such
                                       concerns can be addressed with specific structural arrangements, rather than complete
                                       removal of eligibility; (Part C)

                            d)         International comparisons: the level of capital proposed to be held by New Zealand banks
                                       substantially exceeds levels held by international banks. The Proposals would require
                                       New Zealand banks to hold in excess of double the capital held by international banks,
                                       and almost double that held by major Australian banks6; (Part D)

                            e)         Impact of the Proposals: the Consultation Paper significantly underestimates the impact
                                       of the Proposals by not giving consideration to the cumulative impact of the various
                                       proposed changes. WNZL’s estimate of the impact of the Proposals, if implemented, is
                                       an increase of capital of $25bn or $2.5bn of additional funding costs across the four major
                                       banks. In the absence of a cost-benefit analysis, it is unclear that the economic costs of
                                       implementing the proposals are justified; (Part E)

                            f)         Alternate proposal: our recommendation is that a number of aspects of the Proposals be
                                       reconsidered to better achieve the key objectives of the Capital Review, as follows:

                                 i.         total capital, rather than CET1, should be the key metric. This would provide
                                            efficiency to the bank capital structure and consistency with global bank capital
                                            standards, while still meeting the RBNZ objectives associated with well capitalised
                                            banks;

                                 ii.        in order to accurately assess optimum capital levels, include in the assessment of
                                            “how much capital is enough?” the operating buffer that banks operate under to
                                            ensure a safe operating margin over minimum levels of regulatory capital;

                 4
                   Including a 2% operating buffer.
                 5
                   Reserve Bank of New Zealand, above n 2, at 38. The RBNZ assumes a 6% growth rate. For the purposes of
                 WNZL’s submissions, this has been halved to 3%, which reflects the more dovish economic outlook.
                 6
                   PricewaterhouseCoopers International comparability of the capital ratios of New Zealand’s major banks –
                 update paper (17 May 2019).

                                                                                                                                 3

Classification: PROTECTED
iii.        utilise the Basel Committee on Banking Supervision (BCBS) Basel III revised
                                             standardised risk weightings to “level the playing field” between IRB and
                                             standardised banks, removing the need for artificially high output floors and scalar;
                                             and

                             iv.             allow appropriate levels of both AT1 capital instruments and Tier 2 instruments to
                                             be utilised to achieve strong levels of capital (achieving “soundness”) in an efficient
                                             manner to maintain economic competitiveness for New Zealand borrowers
                                             (achieving “efficiency”).

                                        WNZL’s alternate structure is discussed in more detail in Part F.

                 3. The Proposals

                       3.1. The Consultation Paper outlines a number of proposals in relation to the level, composition
                            and calculation of capital required by banks in New Zealand. Significantly, the Proposals
                            would:

                            a)          require D-SIB banks to hold CET1 capital of 16% of RWA, and other banks to hold 15%;

                            b)          for IRB accredited banks (including WNZL), set the RWA floor under the IRB approach to
                                        85% of the calculation under the standardised approach applied by standardised banks;

                            c)          increase the scalar required to be applied to RWA from 1.06 to 1.2 which, in addition to
                                        (b) above, has the objective of increasing the RWA of IRB banks to a minimum of 90%
                                        of standardised banks; and

                            d)          “de-recognise” AT1 hybrid capital, effectively requiring capital to be made up purely from
                                        CET1 capital.

                 4. Introduction

                       4.1. WNZL welcomes the opportunity to provide feedback to the RBNZ on the Consultation Paper.

                       4.2. WNZL supports measures to ensure banks are well-capitalised in order to maintain investor
                            confidence, even in periods of economic stress. WNZL believes that such capital should be
                            readily available to offset lending losses in times of stress, in the form of equity capital and
                            capital instruments that are convertible into equity, to enable banks to be quickly and
                            seamlessly recapitalised if required.

                       4.3. The RBNZ has proposed that New Zealand banks hold sufficient capital to reduce the
                            probability of a financial crisis in New Zealand to a 1 in 200 year event. However, the RBNZ
                            has not provided New Zealanders with important context for this proposal (such as
                            counterfactuals), and has advised that it has not attempted to undertake a cost-benefit analysis
                            of the Proposal.

                       4.4. In our view, the Consultation Paper does not adequately consider (and therefore inform)
                            readers of the adequacy of current minimum capital requirements in New Zealand, or assess
                            the probability of crisis based on the current capitalisation requirements. The RBNZ has not
                            considered whether there is in fact a problem with current capitalisation and, consequently,
                            has not defined the problem that the Proposals seek to solve.

                       4.5. At the core of the Proposals is the RBNZ’s requirement that New Zealand banks increase
                            CET1 capital by $20bn. However, the limited information about the modelling and analysis
                            outlined by the RBNZ in the Consultation Paper does not appear to support this aspect of the
                            Proposals.

                       4.6. The Consultation Paper does not adequately address the cumulative impact of each element
                            of the Proposals, in particular the effect of changes to risk weightings. As a result, the cost of

                                                                                                                                  4

Classification: PROTECTED
the Proposals, and the impact on the economy, have been significantly underestimated.
                            WNZL considers that the Proposals are likely to have a significant negative impact on the
                            economy (an annual drag of approximately 1.3% of GDP) as a result of higher borrowing costs
                            and restrained lending capacity resulting from credit rationing.

                       4.7. Importantly, the Proposals ignore current New Zealand bank capital levels relative to
                            international markets. The deep body of knowledge and expertise among central bank
                            regulators globally is a valuable resource in assessing what is appropriate for global banks,
                            and, ultimately, for New Zealand banks. A key consequence of the disconnect in capital
                            requirements would be to cause New Zealand producers to be at a material disadvantage in
                            international markets as a result of higher funding costs and restricted access to credit. While
                            there is an understandable temptation to lead international regulatory capital developments, it
                            is an area that would benefit from steady, sustainable observation of jurisdictions with greater
                            scale and experience of crises.

                       4.8. An objective underlying the Proposals is to “level the playing field” of capital treatment between
                            IRB accredited banks and standardised banks, although it is not clear how that is consistent
                            with the RBNZ’s mandate. The Consultation Paper does not consider a range of options
                            available in attempting to achieve this outcome, other than the proposed solution which is to
                            apply inappropriate risk weightings to the entire regulated banking sector. The inevitable and
                            undesirable consequence will be to drive activity away from the regulated sector towards
                            offshore and alternative sources of finance. Further compounding the issue is the proposal to
                            restrict certain capital instruments from qualifying as “capital”.

                       4.9. Independent commentators have raised concerns about whether the consultation process
                            meets the commitments outlined in the RBNZ “Relationship Charter” designed to achieve
                            sustainable considered outcomes. In the context of the concurrent Treasury and RBNZ review
                            of the Reserve Bank of New Zealand Act 1989 (the Act) which considers appropriate
                            governance of the RBNZ (Phase 2 Review), and in the absence of the prudential regulatory
                            checks and balances that would be found in the exercise of powers of other regulators, a
                            balanced consideration of the capital options and comprehensive independent cost benefit
                            analysis is a necessary component of the consultation process.

                                                                                                                            5

Classification: PROTECTED
PART A: THE RISK APPETITE FRAMEWORK

                 1. Introduction

                      1.1. The RBNZ’s powers of prudential supervision are contained in part 5 of the Act. These powers
                           must be exercised for the purposes of “promoting the maintenance of a sound and efficient
                           financial system”.7 Underpinning the Proposals is the RBNZ’s risk appetite framework approach
                           to determining the appropriate level of capital to be held by New Zealand banks for the purposes
                           of promoting a sound and efficient financial system.

                      1.2. In this section we outline our concerns with the RBNZ’s risk appetite framework approach.
                           Specifically, our submissions are:

                            a)   RBNZ’s risk appetite settings: the bases of the risk appetite settings in the Proposals
                                 (including the purported societal risk appetite of a 0.5% chance of bank crisis) are not
                                 justified by any supporting data or evidence and do not provide the correct starting point
                                 for the consideration of the appropriate level of capital in the banking system; and

                            b)   RBNZ analysis: the analysis provided to submitters is materially incomplete and flawed.
                                 Academic research appears to have been selectively utilised, and international
                                 comparatives inappropriately applied in forming the Proposals.

                 2. RBNZ’s risk appetite settings

                      2.1. The RBNZ has acknowledged that “the risk preferences of New Zealanders cannot be known
                           with great precision” but considers that it has the delegated authority to make such decisions
                           on behalf of the public.8 The authority for this delegated authority is not provided in the
                           Consultation Paper.

                      2.2. At the heart of the Proposals is an assessment that the correct starting point, in the absence of
                           an understanding of the risk tolerance of the general public, should be a 0.5% probability of a
                           banking crisis. This is expressed in the Consultation Paper as a one-in-200 year (1:200)
                           probability of crisis. Given the significance of this metric on the quantum of the proposed level
                           of capital which flows from this, we would expect this metric to be at the centre of the substantive
                           analysis.

                      2.3. Neither the Consultation Paper nor the subsequent outline of the analysis supporting the risk
                           appetite statement (Background Paper)9 appear to adequately justify this risk setting beyond
                           a broad discussion of societal risk appetite. As recently as 6 weeks before the Consultation
                           Paper was published, internal RBNZ steering group papers show a proposed policy goal for
                           the Capital Review as capping the probability of crisis to 1% (i.e. 1 in 100 year event), this figure
                           being based on a benchmark set by the Federal Bank of Minneapolis.10 In a change of
                           approach which is not explained (other than to state that the RBNZ opted for “a more
                           conservative option”), the RBNZ moved the probability to 0.5%.11
                      2.4. The only support provided for the 1:200 probability setting in the Consultation Paper is to refer
                           to “precedents”12, including a 0.5% risk of insolvency used in insurance solvency standards in
                           Europe. It is not clear however, how solvency standards for the insurance industry are relevant
                           to the probability of banking crises, when the nature of risks and costs associated with events
                           differ significantly between the two industries.

                 7
                   Reserve Bank of New Zealand Act 1989, s 68.
                 8
                   Susan Guthrie Capital Review Background Paper: An outline of the analysis supporting the risk appetite
                 framework (April 2019) at 12.
                 9
                    Guthrie, above n 8.
                 10
                    Susan Guthrie Risk Appetite framework used to set capital requirements (October 2018).
                 11
                    Susan Guthrie Capital Ratio Calibration (November 2018).
                 12
                    Reserve Bank of New Zealand, above n 2, at 13.

                                                                                                                              6

Classification: PROTECTED
2.5. The assumption that New Zealanders will favour lower risk (i.e. 1:200 year probability setting)
                            has not been evidenced, and presupposes that the cost of this benefit is less relevant. The
                            RBNZ indicates that the Proposals represent a fair reflection of society’s risk appetite and, in
                            effect, that society is prepared to pay an increased premium (in the form of an economic
                            downturn and higher interest rates) to pay for the capital increases required to meet these risk
                            settings.
                       2.6. A more comprehensive approach would include assessing the level of risk New Zealand bank
                            deposit holders are prepared to take in relation to the credit worthiness of deposit-taking
                            institutions. Recent history suggests that New Zealanders have a propensity to take substantial
                            risk in pursuit of additional yield.
                       2.7. A more robust approach to the assessment of societal risk appetite would be a detailed
                            “willingness to pay” survey, alongside detailed information about the costs and benefits
                            associated with increased capital levels. A recent local example is work undertaken in the
                            electricity sector to assess customers’ willingness to pay to avoid power outages.13 The work
                            was complex, requiring detailed exposition of outages, the direct and indirect costs and how
                            much responders are willing to pay for each scenario. Other sectors that have taken a similar
                            approach include analysis of options on ports, toll roads, congestion charging and rail networks.
                       2.8. Given the potential impact of the Proposals, more research, including a survey, should be
                            undertaken. Presently, the Consultation Paper and Background Paper set out a series of
                            assumptions which do not provide a complete picture of crisis scenarios, nor a realistic view of
                            how the Proposals may impact borrowers and savers in ordinary times. Detailed analysis of the
                            effect of the Proposals, including (permanent) increases to interest rates and credit rationing,
                            has not been undertaken. The lack of analysis is problematic given that the effect of the
                            Proposals may be such that small businesses, farms and first-time home buyers in particular,
                            may be at risk of isolation from mainstream lenders faced with restricted capital resources.

                 3. Analysis incomplete and flawed

                       3.1. A number of observations in the Consultation Paper, while based on logic in isolation, do not
                            support the proposed quantitative outcome. While it is clear that society prefers to avoid
                            financial crises, what cannot be drawn from this observation is how much society is prepared
                            to pay for this risk relief. Moreover, while more capital may provide banks with more resilience
                            in the face of financial crises, it is not clear to what extent bank capital at the levels proposed
                            by the RBNZ could prevent a crisis, or at what point requiring additional capital is inefficient and
                            impedes economic growth.

                       3.2. The quality of econometric work throughout the Proposals is superficial relative to the scale of
                            the potential impact, and appears positioned to support the Proposals, rather than to inform
                            them. Attempts to link 0.5% probability of crisis to 16% CET1 capital appear to be an exercise
                            in setting a range of improbable variables that produce a desired range of outcomes to justify
                            an optimal capital level.

                       3.3. The background papers released by the RBNZ on 25 January 2019 following Official
                            Information Act requests (Information Release) as supplemented by the Background Paper,
                            provide only very limited insight into the RBNZ modelling undertaken by the RBNZ. The
                            Information Release was produced some time after the Consultation Paper, and didn’t include
                            a model. Therefore, it is difficult to decipher what information formed part of the RBNZ’s
                            considerations at the time of the Proposals.

                       3.4. To complement the international studies outlined in the Consultation Paper, the RBNZ states
                            that it has undertaken its “own modelling exercise using a similar analytical approach”14 to the

                 13   Electricity Authority “Investigation into the Value of Lost Load in New Zealand” (July 2013)
                 .

                 14
                      Reserve Bank of New Zealand, above n 2, at [77].

                                                                                                                              7

Classification: PROTECTED
international studies. However, the RBNZ has not presented its results in the form of an optimal
                            capital ratio and has not provided access to the models, or detailed modelling results.

                      3.5. Nevertheless, based on the information provided by the RBNZ in the Background Paper, we
                           have undertaken our own modelling utilising New Zealand data in an effort to back-solve for
                           the inputs that must have been used to produce the RBNZ results. As demonstrated in Table 2
                           (see page 17), our modelling does not produce an optimal CET1 level of 16%.

                      3.6. Table 2 demonstrates that Probability of Default (PD), Loss Given Default (LGD) and Default
                           Correlation (R) settings require considerable manipulation to unreasonable levels to achieve a
                           capital ratio of 16%. These settings and our outline of alternative appropriate settings are
                           included in Part B, paragraph 2.

                      3.7. While it is difficult to provide probability precision as far as three standard deviations into the
                           tail of outcomes, more robust modelling and a closer read of academic literature indicates that
                           a 16% CET1 requirement would equate to a range of probabilities of crisis occurring between
                           1:333 and 1:500 years. Table 2 demonstrates that, in order to justify a minimum CET1 ratio of
                           16%, the probability of crisis would need to be set at no less than 1:400. Of note is that this
                           conclusion is drawn despite utilising midpoints of the RBNZ’s PD and LGD variables which
                           WNZL considers to be materially inflated. More reasonable PD and LGD settings would
                           produce even lower probabilities of crisis (in excess of 1:1000 years).15 The Proposals have
                           essentially assumed that New Zealanders would be willing to pay for protection against a
                           banking crisis occurring within a period equivalent to that from the time between the failure of
                           the Medici Bank in 1494, through the South Sea Bubble in 1720, to today.
                 Failure to consider impact of prudential policies
                      3.8. The RBNZ’s Liquidity Policy (BS13), which delivered improvements in bank liquidity and core
                           funding, has been operational in New Zealand for almost a decade. BS13 has operated to
                           ensure that New Zealand banks are now better placed to withstand liquidity and funding crises,
                           similar to those which lead to the global financial crisis (GFC) in 2008. We note that the GFC
                           affected New Zealand bank funding and liquidity but did not produce a credit related banking
                           crisis. In other words, it did not produce a banking crisis in New Zealand which could have been
                           alleviated by increased capital.

                      3.9. Further, the Proposals have not been considered in the broader context of New Zealand's bank
                           failure resolution and bank resilience policies and systems, including the open bank resolution
                           (OBR) regime, statutory management and the proposal to introduce depositor protection being
                           considered as part of the Phase 2 Review. It is important that these existing systems and the
                           Proposals are considered holistically and designed to work together efficiently. The RBNZ has
                           previously acknowledged the interrelationship between the OBR regime and capital
                           levels. Discussing the costs and capital requirements of a banking crisis, the RBNZ noted that
                           “[t]his does not lead us to require ever increasing levels of capital however, as the introduction
                           of the Open Banking Resolution policy will reduce the probability of a bailout…”16

                      3.10.        Macro-prudential enhancements have improved asset quality, particularly with respect
                           to bank mortgage portfolios. The Proposals should be considered in the broader context of
                           other prudential policies in order to demonstrate the “efficiency” element of the RBNZ’s statutory
                           mandate. Had such analysis been undertaken, it is unlikely that the RBNZ would have
                           concluded that the levels of capital proposed in the Consultation Paper could be justified.
                 Selective inclusion of academic studies

                      3.11.        The Proposals do not align New Zealand risk appetite with global standards in the
                           context of a globally connected regulatory environment. The Proposal and Information Release

                 15
                   Utilising a confidence level of 99.9% per the RBNZ’s Capital Adequacy Framework Document (BS2B)
                 16
                   Reserve Bank of New Zealand Regulatory impact assessment of Basel III capital requirement in New Zealand
                 (September 2012), at [44].

                                                                                                                            8

Classification: PROTECTED
also contain selective international research and data, without consideration of application to
                            New Zealand.

                      3.12.          New Zealand risk weights are already set at globally conservative levels (well in excess
                           of long-term New Zealand loss rates). A recent PricewaterhouseCoopers (PwC) comparison17
                           of global capital estimated that New Zealand banks’ capital levels would be 540bps higher than
                           the face value reported, once adjusted to be globally comparative. While the RBNZ has
                           disputed some of the metrics used by PwC (and therefore the exact quantum of excess)18 it did
                           not dispute the conclusion that New Zealand banks are materially stronger than in other
                           jurisdictions, including Australia. A similar study undertaken in Australia by PwC19, and largely
                           accepted by the Australian regulator, concluded that Australian banks were 400bps stronger
                           when reported on a globally comparative basis.

                      3.13.          In support of the CET1 capital ratio at 16%, the RBNZ produced a table of international
                           studies providing conclusions as to optimal levels of capital entitled “Studies estimating an
                           optimal level of capital” 20 (reproduced below as Table 1). The optimal capital ratios presented
                           in this table range from as low as 7%-11% to as high as 13%-26%.

                      3.14.         However, the studies listed in this table predominantly do not support a CET1 capital
                           ratio as high as 16%. This holds true notwithstanding the fact that:

                            a)   the studies were conducted in jurisdictions with substantially lower (i.e. less conservative)
                                 calculations of regulatory RWAs than in New Zealand; and

                            b)   bank data associated with the GFC was utilised, including from banks requiring
                                 governmental support. This is in contrast to New Zealand (and Australian) banks which
                                 remained solvent and viable throughout the GFC. Of the papers which consider more fully
                                 the impact and recovery from the GFC, Brooke et al (2015) 21 (Brooke) and Cline (2016)
                                 22 (Cline) find that the optimum level of CET1 capital is significantly short of 16%.

                 17
                    PricewaterhouseCoopers International comparability of the capital ratios of New Zealand’s major banks
                 (October 2017).
                 18
                    Reserve Bank of New Zealand 2017 PwC (NZ) Study (May 2018).
                 19
                    PricewaterhouseCoopers International comparability of the capital ratios of Australia’s major banks (August
                 2014).
                 20
                    Reserve Bank of New Zealand, above, n 2, at 28.
                 21
                    Martin Brooke, Oliver Bush, Robert Edwards, Jas Ellis, Bill Francis, Rashmi Harimohan, Katharine Neiss, and
                 Caspar Siegert Measuring the macroeconomic costs and benefits of higher UK bank capital requirements (Bank
                 of England Financial Stability Paper, 2015).
                 22
                    William Cline Benefits and Costs of Higher Capital Requirements for Banks (Peterson Institute for
                 International Economics Working Paper Series, 16(6), 2016).

                                                                                                                              9

Classification: PROTECTED
Table 1 – Studies estimating an optimal capital ratio

                      3.15.       Only the Firestone et al. (2017) (Firestone) study 23 supports 16% as the optimum
                           CET1 capital ratio. However, this study cannot be properly applied to the New Zealand banking
                           environment. Specifically:

                            a)   this study draws on bank data from the United States and is dominated by two periods of
                                 substantial bank stress covering the period following the share market crash of 1987 and
                                 the GFC;

                            b)   the United States lending market differs structurally from the New Zealand market in that
                                 it is more risky, including (relevant to the GFC experience) the existence of sub-prime
                                 lending and non-recourse (“walk away”) loans in the United States. The United States
                                 results include the impact of 14% non-performing subprime loans in a housing crisis
                                 fuelled by lending practices not seen in New Zealand, such as “ninja loans”24. A key
                                 contributing factor to the crisis in the United States was the disintermediation of banks
                                 from mortgage origination funded by securitisation. This disintermediation relieved the
                                 originator from credit losses associated with the lending. Such disintermediation is not a
                                 feature of the bank lending market in New Zealand;

                            c)   the study utilises a significantly short time series of data (1988-2011). This period
                                 includes a number of substantial global shocks that, while relevant to such a study, have
                                 had the effect of skewing the data. If the study had been undertaken over a longer time
                                 period, the probability of a crisis would likely to have been more akin to that of the BCBS
                                 (2010)25 (BCBS) and Brooke studies. In particular, we note that the Firestone study
                                 utilised a probability of crisis of 3.8% (for 8% of CET1 capital held) as a calibration point
                                 for other capital levels.26 As a comparative, this calibration point is materially higher than
                                 is used in other credible studies; and

                 23
                    Simon Firestone, Amy Lorenc, and Ben Ranish An empirical economic assessment of the costs and benefits of
                 bank capital in the US,’ Finance and Economics Discussion Series 2017- 034 (Washington: Board of Governors
                 of the Federal Reserve System, 2017).
                 24
                    “Ninja” is an acronym for “No Income, No Job and No Assets” borrowers.
                 25
                    Basel Committee on Banking Supervision An assessment of the long-term economic impact of stronger
                 capital and liquidity requirements (2010).
                 26
                    Brooke et al, above n 21, at 18.

                                                                                                                            10

Classification: PROTECTED
d) the study also assumes a Modigliani-Miller (MM) offset of 50%. We believe this to be at
least double the New Zealand experience. Further discussion of the MM offset is
contained in Appendix 1 to this submission.
3.16. In order for the Firestone study to be applicable to New Zealand, it would require
substantial recalibration, including to address the impact of crisis management tools, non-
recourse mortgages, liquidity, stable funding and RWA calculations, and would require the
utilisation of a more appropriate MM offset. Such recalibration would likely reduce the Firestone
estimate of optimal CET1 capital ratio to substantially below 14%.
3.17. The discussion of the Brooke study in the Consultation Paper, including to restate the
optimum CET1 capital ratio as between 14-16%27, is flawed. The only scenario in which this
CET1 capital ratio is supported in this study is where a bank resolution does not work. This
could not be the case in New Zealand, given that New Zealand has a robust OBR regime that
is imposed and regulated by the RBNZ.
3.18. Other studies considered by the RBNZ, including Brooke and Mendicino et al. (2015)28,
which produce higher optimal CET1 capital ratios are based on United States data and would
require significant recalibration to be applicable in New Zealand. In particular, and as discussed
in paragraph 3.15(b) above, there are higher inherent risks in United States mortgage products
when compared with those in New Zealand. The findings of the studies are the result of the
lower average risk weightings utilised by United States banks, i.e. 16%-17% for residential
mortgages (which is almost half of the WNZL reported risk weighting).
3.19. In the BCBS study, the meeting of Net Stable Funding Ratio (NSFR) requirements was
found to have a material impact on the probability of a crisis.29 The BCBS study found that a
13% CET1 capital ratio would achieve a 0.5% probability of a crisis, which is further reduced to
a 0.3% probability for banks that have a NSFR of 1.12.30
Use of inappropriate international comparatives
3.20. The Proposals reference extreme global economic events as examples of those that
could happen in New Zealand. One such event was the experience of the housing market in
Ireland in 2009. The Irish housing market underwent a spectacular boom from 2002 to 2008,
followed by a significant market correction during the GFC. Absent from the Proposals is
consideration of the effect of changes to Irish mortgage legislation in 2009 (pursuant to the
Land and Conveyancing Law Reform Act) which made mortgagee sales almost impossible for
mortgages dated prior to 1 January 2009.31 As a result, a disproportionate number of borrowers
opted to suspend mortgage payment as a means of managing financial stress.32
3.21. The short-term outcome of the implementation of this legislation was a rapid increase
in non-performing loans well above rates in other comparable markets33 (illustrated in Chart 1
below). The level of non-performing loans reflected the effect of the legislation, rather than a
gauge of mortgage default rates. Many mortgages returned to “performing” following
amendment of the legislation.
27
Reserve Bank of New Zealand, above n 2, at 21.
28
Caterina Mendicino, Kalin Nokolov, Javier Suarez and Dominik Supera Welfare analysis of implementable
macroprudential policy rules: heterogeneity and trade-offs (ECB Macroprudential Bulletin, No. 1, 2016).
29
Basel Committee on Banking Supervision, above n 25.
30
Basel Committee on Banking Supervision, above n 25, at 15. We note that BCBS refers to banks exceeding
1.12x the NSFR minimum. In a New Zealand context we estimate this translates to a Core Funding Ratio of
slightly above 80% which is exceeded by all D-SIBs.
31
Land and Conveyancing Law Reform Act 2009.
32
The Land and Conveyancing Law Reform Act 2009 was not amended to remove these provisions until 2013.
33
Matt Phillips “Welcome to Ireland, where mortgage payments are apparently optional” (2013)
.
11
Classification: PROTECTED3.22. While we accept that the Irish market was likely to have seen an escalation of arrears
during the GFC (as was the case in other European markets), the key driver of increased
arrears in Ireland was the legislation and is not, therefore, a reasonable parallel for the New
Zealand environment. By way of example, arrears in residential mortgages in 2011 in Ireland
peaked at 13% while post-GFC New Zealand residential mortgage arrears peaked at 0.8%.
3.23. We also accept that New Zealand is not immune from future housing stress. However,
excluding the extreme events in Ireland and Greece (which related to broader structural
dysfunction) a New Zealand experience would not be expected to be materially more significant
than other European experiences through this period (i.e. non-performing loans of up to 2% as
in Chart 1 below). Even the United States market, with non-recourse lending, saw a peak in
arrears of prime mortgages of 3.1% during the GFC (despite arrears of sub-prime mortgages
reaching 14%).34
Chart 1 – European mortgage arrears
The GFC as a case study
3.24. The GFC provided a relevant study for a number of key observations with respect to
financial crises and bank capital, though it does not feature extensively in the RBNZ analysis.
The GFC had its genesis in the international abundance of cheap credit (particularly in Europe
and the United States), which contributed to lax lending standards and fuelled asset inflation.
The combination of these factors lead to the misallocation of resources and the ultimate default
of many (housing and business) loans in geographies where the assets had become
substantially overvalued and underutilised.
3.25. Ultimately, the GFC led to the collapse of a number of assets markets, which, in turn,
gave rise to bank failures in Europe and the United States. The extent to which the holding of
higher levels of capital by banks would have prevented bank collapses is a matter of debate,
however, it is generally acknowledged that the GFC would not have been prevented simply by
higher bank capitalisation.
34
Data sourced from Canadian and U.S. Residential Mortgage Arrears and Foreclosure Rates “Canada
Mortgage and Housing Corporation – Residential Mortgage Arrears and Foreclosure Rates” (2018)
.
12
Classification: PROTECTED3.26. In economies where resource allocation had not been pursued with the same vigour
as in Europe and the United States, and where bank risk-taking had not radically departed from
the path of traditional lending, resource reallocation was less marked. In countries with strong
regulator monitoring of resource allocation (including Australia, Canada and New Zealand), the
GFC did not lead to a banking crisis.
Excessive bank capitalisation does not reduce cost of crisis
3.27. Well-capitalised banks are a valuable resource for ensuring financial resilience.
However, the burdening of banks with excessive levels of capital will ultimately handicap the
growth of the broader economy and will not, in and of itself, prevent a financial crisis.
3.28. Underlying the Proposals is an assumption that crises are either caused by bank
failure, or could have been prevented by enhanced bank capitalisation. The conclusion drawn
is that higher levels of bank capital could have prevented such crises, without reference to the
importance of other accepted mitigants such as standby liquidity tools or stable sources of bank
funding.
3.29. The financial crisis in 2008 resulted in a material drop in GDP across a number of
nations. Chart 2 below sets out the movements in GDP from 1990 – 2008 in New Zealand,
Australia, Japan, the United States and the United Kingdom.35 While it may be argued that
bank collapses in the United Kingdom and the United States contributed to the subsequent
recession in these countries, a banking crisis did not occur in New Zealand, Australia or Japan.
All these countries experienced a drop in GDP and, in Japan’s case, a deeper recession than
in both the United Kingdom and United States, despite there being no banking crisis.
Chart 2: GDP 1990 – 2018
3.30. Following the share market crashes in 1987, many countries experienced economic
contraction which lasted into the early 1990s. In New Zealand, the impact was felt in bank
lending losses. However, only one bank (BNZ) required recapitalisation via a taxpayer bailout.
All other major New Zealand banks remained solvent and operational.
3.31. Arguably, the issues experienced by BNZ were largely the result of aggressive
overseas growth (primarily in Australia where the large majority of losses were experienced),
35
Data sourced from Stats NZ Gross domestic product: December 2018 quarter (2019).
13
Classification: PROTECTEDcompounded by poor capitalisation.36 New Zealand banks now operate almost exclusively in
New Zealand, with superior risk profiles and lower risk appetite.
3.32. The product and business requirements for New Zealand banks and businesses are
substantially less sophisticated than larger multinational banks and, therefore, risk is better
understood and managed in New Zealand. The lack of sophistication avoided the issues
associated with securitisation and hidden leverage during the GFC.
3.33. The RBNZ considers that there are limited New Zealand experiences of crises from
which to gather data.37 However, we consider that have been a number of global events in
more recent history that have tested the New Zealand economy. Riddell and Sleeman38 provide
a number of examples in their review of economic events affecting New Zealand, none of which
resulted in local domestic financial crises.
3.34. These experiences demonstrate that few economic crises have their origin in New
Zealand. In fact, no domestic crisis has had its origins in New Zealand for over 40 years.
However, material global slowdowns can lead to a marked slowdown in the New Zealand
economy. Importantly, despite the economic slowdowns (and notwithstanding BNZ in 1991),
New Zealand banks have proven very resilient.
3.35. Other studies which have considered the impact of a financial crisis over the longer
term are limited. Cline 39 analysed data from countries that had crises and those that did not
(including New Zealand). Cline’s observations suggest that a financial crisis is not made
substantially better or worse when considered alongside a bank crisis. In fact, he noted that
countries such as Australia, Canada, Norway and Finland were not materially better off than
many economies that did experience bank crises.
Failure to consider impact of parental support
3.36. The 1991 economic slowdown demonstrated certain key considerations which have
been largely discounted or ignored in the Consultation Paper. Perhaps the most critical in this
period is an observation that the major banks with offshore ownership managed through the
stress without the need for taxpayer support. It is reasonable to consider that parental support
through the 1991 slowdown and post-GFC in New Zealand, through both enhanced risk
management and financial input, was a key factor which contributed to the banks’ recovery.
3.37. The offshore ownership of major banks in New Zealand holds key benefits for the
broader New Zealand economy. As subsidiaries of international banks, the major New Zealand
banks have limited international exposure on their New Zealand balance sheets, with
international exposure generally held by the parent bank in another jurisdiction. As such, the
local entity is spared the impact of more substantial losses associated with downturns in
international economies. This is in contrast to the experience of BNZ in 1991 which took a large
portion of losses in Australia. The BNZ loss experience was mirrored by NZI Bank which at the
time was also New Zealand owned and managed, but incurred substantial lending losses as a
result of a failed attempt to expand into Australia.
3.38. The benefits of the support of a large (Australian) parent was evident for major banks
in New Zealand throughout the GFC through the provision of funding and liquidity support. This
support was demonstrated by way of direct funding, or as implied support manifested in
favourable credit ratings and ultimately market access for wholesale funding.40 The value of
36
BNZ had a CET1 capital ratio ofparental support can be undermined however if local New Zealand capital requirements move
out of line with those of the parent’s regulator. The effect of significantly increasing the required
level of capital held in the subsidiary may either restrict the parent’s capacity to support, or
undermine the implied parental support, and may therefore negatively impact the overall credit
rating.
3.39. Further, the RBNZ assumes that the increased capital would be available and willingly
provided by the banks’ shareholders, and that the cost to the economy would be the reduction
in the return required by shareholders providing the additional capital. An alternative scenario
exists however, in whole or in part, under which the required capital is not provided. The
Proposals contain no analysis of the likelihood or effects of such a scenario. Yet statements
made recently by the shareholders of the four large banks41 indicate that a willingness to
provide additional capital should not be assumed. The economic consequences could therefore
be much worse than a rise in interest rates. If the large New Zealand banks cannot obtain
sufficient additional capital, they will be forced to reduce RWAs (by reducing lending). Such
lending reductions cannot easily be replaced by other market participants (most of whom are
much smaller). Economists agree that such a scenario could have significant economic
consequences.
41
The Australian Business Review Big banks on war path over NZ central bank's bid to raise minimum capital (8
May 2019).
15
Classification: PROTECTEDPart B: Risk Weightings
1. Introduction
1.1. The Consultation Paper only provides limited information on the modelling that the RBNZ
undertook to reach the conclusion that the Proposals were appropriate, particularly in respect
of the proposed CET1 ratio of 16% for D-SIBs.42
1.2. Whilst the subsequent Information Release on 25 January 2019 provides further information
on the modelling undertaken, it appears that much of the quantitative analysis and related
material was completed subsequent to the release of the Consultation Paper to support, rather
than to inform, the initial Proposals.
1.3. In this section we outline our concerns with the RBNZ’s analysis of risk weightings in the
Consultation Paper. Specifically our submissions are:
a) The key model judgements (PD, LGD and R) lack rigour;
b) The RBNZ’s regulatory approach already results in New Zealand banks having higher
risk weightings than in other similar jurisdictions and increasing the RWA calculations for
IRB banks will increase the differential further;
c) The risk weightings, output floors and scalar adjustment included in the Proposals have
been structured with the objective of levelling the playing field between IRB and
standardised banks. This objective can be achieved in a more efficient manner,
substantially lessening the impact on the wider economy, by adopting the latest Basel III
standardised risk weighting recommendations; and
d) The results of bank stress testing have been largely dismissed by the RBNZ as irrelevant
in assessing the capacity of New Zealand banks to withstand periods of sustained
economic slowdown. However, stress testing is considered internationally to be central
to the continued, safe operation of the financial system and is widely utilised by
international regulators to assess bank resilience.
2. RBNZ Risk Modelling
2.1. The key model judgements in the Proposal (PD, LGD and R) lack rigour. The judgements
appear to be simplistically derived and draw on limited analysis of actual loss experience.
2.2. The RBNZ has modelled outcomes utilising the Asymptotic Single Risk Factor (ASRF) model
and utilised just one exposure as a representation of the risk model of the entirety of the New
Zealand banking system. WNZL considers that the use of a single factor risk model to inform
optimal capital levels is too simplistic and the outcomes are not representative of the New
Zealand banking sector. As an example, the ASRF model makes no differentiation between
retail and non-retail parameters and how these perform through the cycle.
2.3. WNZL considers the PD range of between 1.0% and 2.25% utilised in the RBNZ modelling is
overly conservative. New Zealand banks utilise a PD of around 1.1% to be representative of
long run aggregate portfolio default rates. The RBNZ has conceded that there is insufficient
“non-performing loan” data pre-1996 to inform a “through the cycle PD” and have therefore
relied on historical impairment data.43 The data is skewed by the issues of the early 1990s
(discussed above) and the PD range is therefore not representative of New Zealand’s current
banking industry.
42
Reserve Bank of New Zealand, above n 2, at [50 - 61].
43
Guthrie, above n 8, at 56.
16
Classification: PROTECTED2.4. WNZL also considers that the LGD range utilised by the RBNZ of between 30%-40% is too
high. While in some higher risk portfolios this range may appear appropriate, when considering
the totality of New Zealand bank lending, the levels are extreme. By way of example, high
Loan-to-value ratio (LVR) farming loans (with an average LGD of 41%) make up less than 1%
of the WNZL RWA book. This can be compared against its residential mortgage book (with
an average LGD of 20%) which makes up over 50% of the WNZL lending portfolio. The use
of an LGD value of 40% is inappropriate as this is not representative of the system risk profile
and drives an overly conservative capital outcome. Of note is that the 2017 bank stress testing
across New Zealand’s four large banks (in relation to stressed outcomes) indicated a weighted
average LGD of around 31%.44
2.5. The RBNZ analysis does not take account of key factors affecting PD values. It does not
consider the significant changes to bank portfolios over the timeframe of the supporting data
which influence both PD and LGD values in terms of both retail and non-retail composition.
Further, the analysis does not consider the macro-prudential changes to LVR distribution over
the last 5 years, which materially influence both values and the overall safety of the portfolios.
2.6. WNZL considers that the R values applied by the RBNZ (at a range of 25-35%) are also too
high. R is a simplistic measure utilised to measure how defaults in different portfolios react,
proportionately and directionally, under stress conditions. Correlations of this magnitude do
not recognise the diversification effect of a bank with broad customer coverage across multiple
sectors and geographies. In addition, the RBNZ does not appear to have modelled decreasing
asset correlations with increasing PD, which has had the effect of materially overstating the
impact of higher defaults.
2.7. Further, with respect to the 2.0% “failure threshold” used in the RBNZ’s modelling for capital,
New Zealand banks already hold more capital than the regulatory minima in the form of
operating buffers. As such, this failure threshold is an unnecessary additional element of
capital.
2.8. Table 2 below illustrates a range of ASRF model outcomes and the significant assumptions
adopted (particularly in respect of correlation) to achieve the proposed capital setting of 16%.
The table demonstrates that significant data manipulation is required to achieve this setting.
Table 2 – ASRF model outcomes and assumptions
RBNZ
RBNZ WNZL
RBNZ Min RBNZ Max Implied for WNZL Min WNZL Max
Model Input Midpoint Midpoint
Values Values 16% Values Values
Values Values
Midpoint
PD 1.00% 2.25% 1.63% 1.63% 1.38% 1.38% 1.38%
LGD 30% 40% 35% 35% 28% 28% 28%
R 35% 25% 30% 30% 8% 24% 16%
Confidence Level 99.50% 99.50% 99.50% 99.75% 99.90% 99.90% 99.90%
Failure Capital % RWA 2.00% 2.00% 2.00% 2.00% 2.00% 2.00% 2.00%
Reqd Capital Ratio % 11.7% 17.1% 15.0% 18.0% 6.8% 13.9% 10.2%
Less Failure threshold 9.7% 15.1% 13.0% 16.0% 4.8% 11.9% 8.2%
Failure Probability (Years) 200 200 200 400 1000 1000 1000
2.9. Notwithstanding the mathematically inappropriate treatment of these variables, the table also
demonstrates that the use of the RBNZ’s midpoint values would require the probability of
failure to increase to 1:400 years (confidence level of 99.75%) to meet the 16% capital ratio if
the failure threshold is ignored (i.e. if the operating buffer is included in the bank’s capital
stack).
44
Reserve Bank of New Zealand, above n 2, at [59].
17
Classification: PROTECTED2.10. The modelling undertaken should have been utilised as a means of determining a
reasonable stressed output and how this might then be applied to a more extreme stress event.
Our analysis suggests that there has been limited attempt in modelling the Proposal to
ascertain the scenario in which losses sustained by banks might endanger capital buffers. The
implication is that the modelling has been designed to solve for a pre-determined outcome in
order to support an increase in capital above current levels.
3. Banking regulation
3.1. Following the adoption of Basel capital adequacy standards, the RBNZ has introduced several
changes to the standards that have resulted in risk weightings that are higher than in other
jurisdictions.
3.2. Whilst absolute differences in capitalisation are difficult to quantify, RBNZ standards are more
conservative than comparative jurisdictions. By way of example, Table 3 below sets out a
comparison between the LGD values applied by the RBNZ to non-property investment
residential mortgage loans and property investment residential mortgage loans, against those
applied by the Australian Prudential Regulation Authority (APRA) and BCBS.
3.3. As demonstrated in Table 3, BCBS prescribes in its default risk weightings a 10%, and APRA
a 20%, LGD floor for exposures secured by residential mortgages. The RBNZ prescribes a
minimum LVR-stepped LGD that distinguishes between non-property investment residential
mortgage loans and property investment residential mortgage loans.
Table 3 – Comparison of LGD values applied by RBNZ, APRA and BCBS
Mortgages RBNZ RBNZ APRA APRA BCBS BCBS
LVR LGD LGD LGD LGD LGD LGD
Non Property Property Non Property Property Non Property Property
Investment Investment Investment Investment Investment Investment
90% and over 38.00% 40.00% 20.00% 20.00% 10.00% 10.00%
80%-89% 33.25% 35.50% 20.00% 20.00% 10.00% 10.00%
70%-79% 28.50% 31.00% 20.00% 20.00% 10.00% 10.00%
60%-69% 19.00% 21.50% 20.00% 20.00% 10.00% 10.00%
Under 60% 10.00% 12.50% 20.00% 20.00% 10.00% 10.00%
4. “Levelling the playing field”
4.1. A key policy goal of the RBNZ is to limit the extent to which capital requirements differ between
IRB and standardised banks, and to create a “level playing field” between banks creating some
simplistic public support for this aspect of the Proposals.45 However, the RBNZ is not a
competition regulator and the concept of “levelling the playing field” between banks is not
currently within the statutory mandate of the RBNZ.46
4.2. The Proposals outline the use of output floors and an increase in the applicable scalar to level
the playing field, which substantially increase risk weightings for IRB banks to bring overall risk
weightings up to “90% of the outcome that would result under the standardised approach”.47
4.3. IRB banks employ substantial resourcing in risk analytics. This resourcing contributes to the
origination process and the management of portfolio risk, which makes the bank, and the
banking system, sounder. The convergence of IRB banks to standardised levels (as in the
45
Reserve Bank of New Zealand, above n 2, at 7.
46
We note that as part of the Phase 2 Review, the RBNZ and the Treasury are considering whether
competition should be included as an objective of the RBNZ.
47
Reserve Bank of New Zealand, above n 2, at [88].
18
Classification: PROTECTEDProposals), has the reverse effect, through discouraging bank investment in risk analysis and
risk modelling. The Proposals would artificially increase RWAs for IRB banks, and would not
support the efficient and effective management of the origination or portfolio risk management
process.
4.4. While it may be economically beneficial for a smaller organisation with limited product offerings
to default to standardised treatment, the approach has the effect of dulling portfolio signals in
the event of an economic downturn. An IRB-modelled portfolio is representative of current risk
composition to a much greater degree than a standardised framework. A specific review of
New Zealand standardised banks with portfolios weighted to residential lending may indicate
that capital levels are unduly conservative. However, this would be an inappropriate metric or
driver for change in IRB banks’ more sophisticated measure of appropriate levels of capital.
4.5. Current differentials in RWA calculations between IRB banks and standardised banks highlight
the benign credit environment. In more normalised stages of the credit cycle, the differentials
between the IRB and standardised approaches will self-regulate. At peak periods of stress, it
is likely that IRB risk weightings will move above standardised levels. The RBNZ should
welcome IRB bank data as an opportunity to inform itself of current market risk.
4.6. Of importance is that the current standardised levels utilised in the Proposals are based on
Basel II recommendations which were superseded by the latest Basel III recommendations.
In late 201748, the BCBS, when introducing more granular standardised risk weightings,
concluded that an output floor of 72.5% of the standardised approach was appropriate.49
Phased implementation of the Basel III reforms starts in 2022 with full implementation by
2027.50 APRA is also planning to use a 72.5 per cent output floor in Australia. By contrast, the
RBNZ is proposing an output floor of 85% by 2020.
4.7. It is proposed that the scalar, which is used as a multiplier of the IRB banks’ calculation of risk
weights, is increased from 1.06 to 1.20. By contrast, the BCBS has proposed dropping the
scalar entirely as a result of cumulative conservatism built into the risk assessment process.
Given that New Zealand’s capital framework is already conservative by both Australian and
global standards, there seems to be no justification for not following the BCBS’s
recommendation of removing the scalar.
4.8. As a result of LVR restrictions imposed by the RBNZ since late 2013, New Zealand mortgage
portfolios have become relatively risk-homogenous across banks. The restrictions, in addition
to the competitive nature of the New Zealand mortgage market has resulted in relatively
frictionless movement across mortgage suppliers. As such, mortgage products, and
performance of those portfolios, differ little across the various banks.
4.9. Utilisation of the new Basel III standardised weightings (refer to Table 4 below) for
standardised banks would provide a more granular approach to mortgage risk weightings.
These weightings are particularly relevant when considering the RBNZ objectives relating to
the harmonising of risk weightings for more generic portfolios (e.g. residential mortgages). As
such, the weightings have a significant impact on standardised banks’ competitiveness with
regard to capital treatment for these products.
48
Basel Committee on Banking Supervision Basel III: Finalising post-crisis reforms (2017).
49
Basel Committee on Banking Supervision, above n 48, at 137.
50
Basel Committee on Banking Supervision, above n 48, at 139.
19
Classification: PROTECTEDYou can also read