MRNA therapy restores euglycemia and prevents liver tumors in murine model of glycogen storage disease - Nature
←
→
Page content transcription
If your browser does not render page correctly, please read the page content below
ARTICLE
                  https://doi.org/10.1038/s41467-021-23318-2                 OPEN

                  mRNA therapy restores euglycemia and prevents
                  liver tumors in murine model of glycogen storage
                  disease
                  Jingsong Cao1,4, Minjung Choi1,4, Eleonora Guadagnin1, Maud Soty2, Marine Silva2, Vincent Verzieux2,
                  Edward Weisser1, Arianna Markel 1, Jenny Zhuo1, Shi Liang1, Ling Yin1, Andrea Frassetto1,
                  Anne-Renee Graham3, Kristine Burke3, Tatiana Ketova3, Cosmin Mihai3, Zach Zalinger3, Becca Levy3,
1234567890():,;

                  Gilles Besin3, Meredith Wolfrom3, Barbara Tran3, Christopher Tunkey3, Erik Owen3, Joe Sarkis 3,
                  Athanasios Dousis3, Vladimir Presnyak3, Christopher Pepin3, Wei Zheng3, Lei Ci3, Marjie Hard3,
                  Edward Miracco3, Lisa Rice1, Vi Nguyen1, Mike Zimmer1, Uma Rajarajacholan1, Patrick F. Finn1, Gilles Mithieux2,
                  Fabienne Rajas2, Paolo G. V. Martini1 ✉ & Paloma H. Giangrande 1 ✉

                  Glycogen Storage Disease 1a (GSD1a) is a rare, inherited metabolic disorder caused by
                  deficiency of glucose 6-phosphatase (G6Pase-α). G6Pase-α is critical for maintaining inter-
                  prandial euglycemia. GSD1a patients exhibit life-threatening hypoglycemia and long-term
                  liver complications including hepatocellular adenomas (HCAs) and carcinomas (HCCs).
                  There is no treatment for GSD1a and the current standard-of-care for managing hypogly-
                  cemia (Glycosade®/modified cornstarch) fails to prevent HCA/HCC risk. Therapeutic mod-
                  alities such as enzyme replacement therapy and gene therapy are not ideal options for
                  patients due to challenges in drug-delivery, efficacy, and safety. To develop a new treatment
                  for GSD1a capable of addressing both the life-threatening hypoglycemia and HCA/HCC risk,
                  we encapsulated engineered mRNAs encoding human G6Pase-α in lipid nanoparticles. We
                  demonstrate the efficacy and safety of our approach in a preclinical murine model that
                  phenotypically resembles the human condition, thus presenting a potential therapy that could
                  have a significant therapeutic impact on the treatment of GSD1a.

                  1 Rare Diseases, Moderna, Inc, Cambridge, MA, USA. 2 INSERM UMR1213, Université Claude Bernard Lyon 1, Lyon, France. 3 Platform, Moderna, Inc,

                  Cambridge, MA, USA. 4These authors contributed equally: Jingsong Cao, Minjung Choi. ✉email: Paolo.Martini@modernatx.com; phgiangrande@gmail.com

                  NATURE COMMUNICATIONS | (2021)12:3090 | https://doi.org/10.1038/s41467-021-23318-2 | www.nature.com/naturecommunications                     1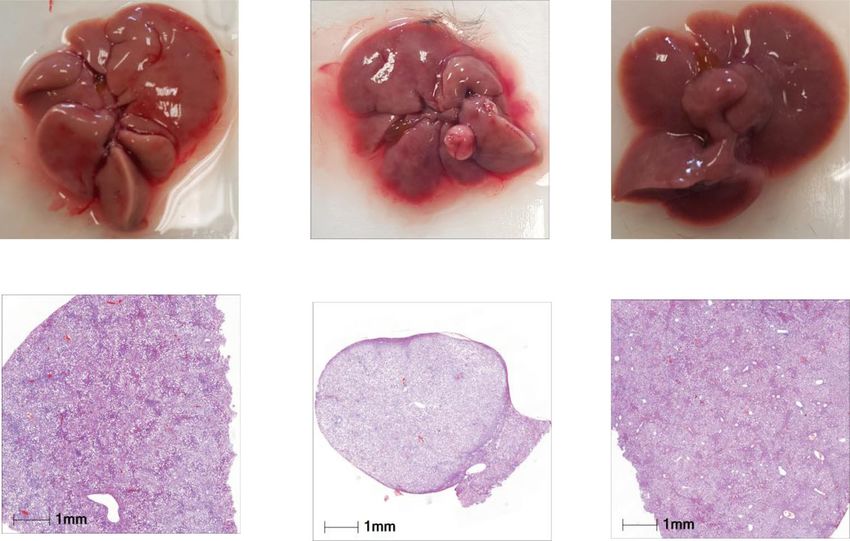
ARTICLE NATURE COMMUNICATIONS | https://doi.org/10.1038/s41467-021-23318-2
G
lycogen storage diseases (GSDs) are a class of rare genetic mRNA therapy may allow titrating an ideal dose for each patient,
disorders characterized by failure to synthesize or break- something not easily feasible with viral vector-mediated gene
down glycogen due to enzyme abnormalities in glycogen therapy29,30. Despite numerous benefits, the advancement of
metabolism1,2. Among them, glycogen storage disease type1a mRNA-based therapeutics in the clinic has been hampered by
(GSD1a) (OMIM: 232200) is caused by the deficiency of the lack of efficient and safe delivery methods that can transport long
glucose-6-phosphatase-alpha (G6Pase-α, encoded by the G6PC chains of negatively charged nucleotides across the cellular
gene), a key enzyme that catalyzes the last step in glycogenolysis membrane. Recent developments in the encapsulation of mRNAs
and gluconeogenesis3,4. G6Pase-α is expressed in gluconeogenic in lipid nanoparticles (LNPs) as delivery vehicles have enabled
organs, primarily in the liver, but also in the kidneys and small several proof-of-concept preclinical and clinical studies33,34.
intestine5. GSD1a is characterized by severe hypoglycemia, since Furthermore, advances in mRNA chemistries have greatly
G6Pase-α plays a pivotal role at the junction between glycogen- improved safety profiles for non-immunostimulatory mRNA-
olysis and gluconeogenesis6. The conversion of glucose-6- based therapies35–37. The therapeutic potential of safe and effi-
phosphate (G6P) to free glucose catalyzed by G6Pase-α is a key cacious re-dosing of our LNP technology has been demonstrated,
step in releasing glucose from the liver into the bloodstream; in mouse models, for other liver metabolic diseases such as
consequently, the absence of G6Pase-α causes GSD1a patients to methylmalonic acidemia (MMA)38,39, acute intermittent por-
suffer from life-threatening hypoglycemia during fasting7. As phyria (AIP)40,41, Fabry disease42, and others43–45. These pre-
G6P is a metabolite at the crossroads of multiple metabolic clinical findings are particularly encouraging as they suggest that
pathways, accumulation of G6P leads to other metabolic imbal- the mRNA therapeutic modality can restore intracellular or
ances such as lactic acidemia, hypertriglyceridemia, hyperur- transmembrane proteins, which are considered undruggable by
icemia, hypercholesterolemia, and steatosis8. Furthermore, current ERTs.
glycogen buildup in liver and kidneys leads to hepatomegaly and In this report we evaluate the efficacy and safety of mRNA
nephromegaly, which are hallmarks of GSD1a7. therapy for GSD1a following repeat dosing. Previous efforts
The current standard-of-care for GSD1a relies on vigilant dietary centered on developing an mRNA-based treatment for GSD1a
management9: frequent feedings (every 4–6 h) of uncooked or were limited to single-dose, proof-of-concept studies performed
modified cornstarch10 and gastric drip feeding of glucose through in mouse models of the disease, to assess the effects of the exo-
the night (mainly used in young patients)11. However, any feeding/ genously delivered mRNA on fasting blood glucose levels46.
cornstarch interruptions or delays can result in serious complica- Importantly, given the need for chronic therapy for the treatment
tions leading to death and dietary management alone is only par- of this disease, herein we show that mRNA therapy can address
tially effective at preventing the accumulation of glycogen and other both the life-threatening hypoglycemia, as well as the long-term
underlying metabolic abnormalities that lead to long-term hepatic high risk of HCA/HCC associated with this disease. Together,
and renal complications12. Long-term hepatic complications these results highlight the therapeutic potential of LNP encap-
include hepatocellular adenomas (HCAs) which, are observed in sulated mRNAs for GSD1a.
75% of adult patients of which 10% are at risk of malignant
transformation into hepatocellular carcinoma (HCC)13–15. The only
curative treatment option for these patients is liver/kidney Results
transplantation16, which remains high-risk with long-term com- Identification of optimized mRNA sequence encoding human
plications associated with chronic immunosuppression. G6Pase-α. To ensure effective mRNA performance in vivo, we
To circumvent the high-risk associated with liver transplanta- optimized protein sequences as well as codon choices in the
tion for GSD1a patients, not to mention the challenges associated mRNA sequence (Supplementary Table 1). We first performed a
with finding matched donors, several less-invasive alternatives are computer-aided bioinformatics search for consensus protein
being pursued. Liver stem cell infusion restores metabolic para- sequence and identified amino acid residues that are highly
meters without complications, but its therapeutic effects are conserved among >100 mammalian orthologs (Fig. 1b). The top
transient (lasting only for a few months)17,18. Several somatic ten out of a total of 20 G6Pase-α protein variants derived from
gene therapies that use an array of viral vectors have shown some the bioinformatics analysis were individually evaluated for
promise in correcting hypoglycemia and prevention of HCA in expression and enzymatic activity in HeLa cells. The G6Pase-α
GSD1a animal models19–22 and one of these is currently being protein variant, bearing the serine (S) to cysteine (C) substitution
evaluated in humans23. However, the clinical application of these at position 298 (S298C), showed an improvement in expression
approaches is likely to be limited by the gradual loss of transgene levels and activity by >2-folds compared to wild type human
expression over time, the potential risk of genotoxicity, and G6Pase-α (hG6Pase-α_WT) (Fig.1c). Therefore, we selected the
preexisting neutralizing antibodies24. In addition, due to its highly S298C protein variant for further analysis. This finding is con-
hydrophobic nature and localization in the endoplasmic reticu- sistent with and supports previous studies by Zhang et al., which
lum membrane, G6Pase-α poses considerable challenges for reported similar improvements in protein expression with the
protein purification and drug delivery, thereby impeding enzyme S298C variant47,48. Based on predicted topology analysis49, the
replacement therapy (ERT) as an option for GSD1a25. S298C substitution falls within the eighth transmembrane
Restoration of protein function via delivery of mRNA to tissues domain of hG6Pase-α, downstream of residues R83, H119, and
offers considerable advantages over conventional methods. This H17650, that are directly involved in hG6Pase-α activity (see
platform can encode for any protein sequence of choice and predicted topology, Supplementary Fig. 1).
utilizes the intracellular machinery for the production and proper Next, we evaluated the subcellular localization of the exogenous
cellular localization of the target protein for therapeutic or pre- hG6Pase-α_S298C variant protein. Co-localization of hG6Pase-
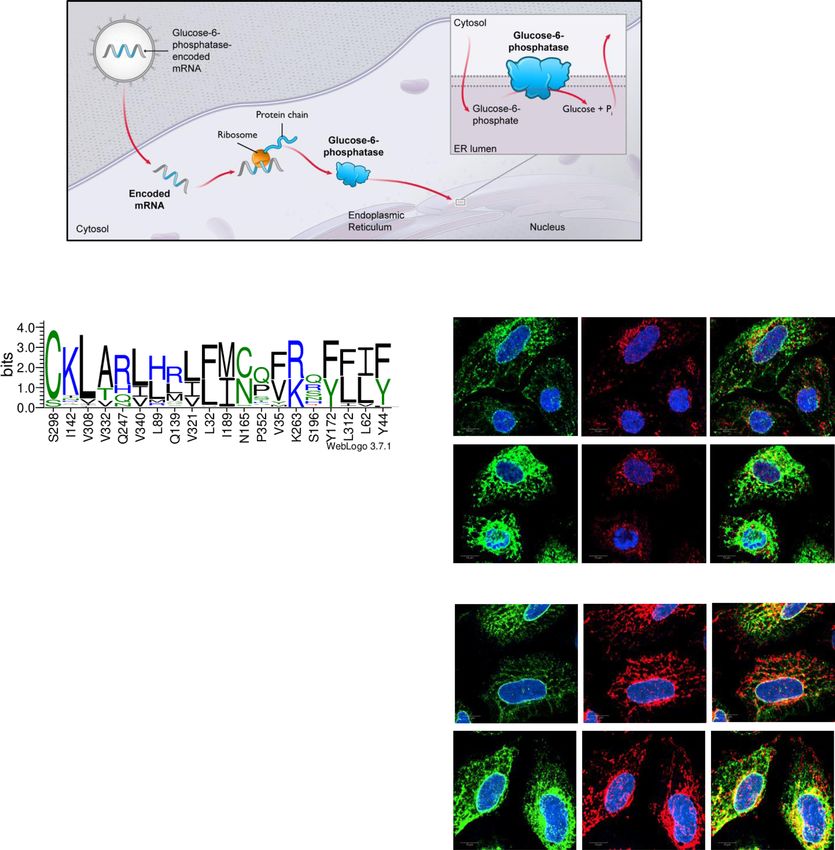
ventative benefit26–30 (Fig. 1a, example provided for G6Pase-α α_S298C protein with calnexin (an ER marker) confirmed the
enzyme). Unlike viral vector-mediated gene delivery approaches, proper ER subcellular localization of the variant (Fig. 1d, top
mRNA therapy corrects for protein function without modifying panels) and matched the co-localization pattern of the G6Pase-
the genomic DNA31,32. Furthermore, the mRNA-dependent α_WT protein indicating that the S to C substitution at position
transient protein expression mitigates the risk of unintentional 298 does not interfere with localization to the ER membrane.
overdose due to constitutive and/or prolonged activation of Also, using Mander’s colocalization coefficient analysis, we
protein function and the linear dose response observed with confirmed that the hG6Pase-α signals were significantly more
2 NATURE COMMUNICATIONS | (2021)12:3090 | https://doi.org/10.1038/s41467-021-23318-2 | www.nature.com/naturecommunicationsNATURE COMMUNICATIONS | https://doi.org/10.1038/s41467-021-23318-2 ARTICLE
a
b d ER marker
hG6Pase-α Merged
(Calnexin)
hG6PC WT
mRNA
hG6PC S298C
mRNA
relative entropy
4 consensus
human
3
2 Mitochondrial marker Merged
hG6Pase-α (Tom20)
1
hG6PC WT
0
mRNA
L32F
N165C
V35F
K263R
L312F
Y44F
P352Q
S196Q
L62I
I189M
S298C
I142K
V332A
Q247R
Q139R
V308L
V340L
L89H
V321L
Y172F
G6PC orthologous redsidues
hG6PC S298C
c
mRNA
Protein expression
G6Pase- α protein expression (% WT)
300 300
Enzymatic activity
G6Pase activity (% WT)
1.0 ER
Ratio of co-localized/total
200 200
Tom20
0.8
100 100 0.6
0.4
0 0 0.2
K
Q T
L
L
L
9R
7R
V3 I
ol
C
A
G
21
08
21
40
W
42
98
32
97
tr
0.0
13
24
V3
on
V3
V3
I1
S2
V3
S2
Q
C
WT S298C
hG6PC mRNA variants
overlapped with the ER marker (Calnexin) signals than that of the In previous work, we have demonstrated the benefit of codon
mitochondrial maker (Tom20), which was used as a negative optimization for maximizing protein expression and
control (Fig. 1d, bottom panels). Together these data suggest that activity38,40,51. We have employed a similar approach to further
the modified hG6PC S298C mRNA expresses robust levels of enhance protein expression of hG6PC mRNA sequence. As
hG6Pase-α S298C protein within the appropriate subcellular shown in Fig. 2, codon-optimized (CO) hG6PC WT and S298C
compartment (i.e., ER). mRNAs resulted in overall higher expression and enzymatic
NATURE COMMUNICATIONS | (2021)12:3090 | https://doi.org/10.1038/s41467-021-23318-2 | www.nature.com/naturecommunications 3ARTICLE NATURE COMMUNICATIONS | https://doi.org/10.1038/s41467-021-23318-2
Fig. 1 In vitro characterization of modified mRNA encoding hG6Pase-α. a Hypothetical model of hG6PC mRNA therapy. hG6PC mRNAs are delivered to
liver via lipid nanoparticles. Once the mRNA is in the cell (hepatocytes) it is translated by the cellular machinery into a functional protein that is localized to
the ER membrane (likely following a co-translational translocation model), resulting in an active G6Pase-α enzyme. b Protein consensus screening by
ortholog residue analysis. Top: WebLogo representation of the abundance of each alternative amino acid used at indicated residue positions. Bottom: The
degree of conservation of amino acids at each position was quantified as relative entropy (Kullback–Leibler divergence). c Relative hG6Pase-α protein
expression (solid circle) and hG6Pase-α enzymatic activity (solid square) in HeLa cells treated with the top ten hG6PC mRNA variants generated using
protein consensus analysis. Data were shown as percentage of wild-type (WT) group and presented as mean ± SD of n = 2 (for protein expression), 3 (for
enzymatic activity, Q247R), or 4 (for enzymatic activity, all other groups) biologically independent samples. d Subcellular localization of WT hG6Pase-α
and S298C variant in HeLa cells. Green: hG6Pase-α, Red: Calnexin, an ER marker (top); TOM20, mitochondrial marker (bottom). Scale bars are 10 µm. The
ratio of colocalized signal over total signal was calculated by Mander’s colocalization coefficient analysis (bottom panel). Data were presented as mean ±
SD of n = 2 biologically independent samples. Source data are provided as a Source Data File.
a In vitro (Hep3B cells)
(nmol/min/mg total protein)
G6Pase- expression
G6Pase- activity
Relative
b In vivo (CD-1 mice)
G6Pase- expression
Relative
Fig. 2 Effect of codon optimization on expression and activity of hG6PC mRNAs. a hG6Pase-α protein expression (left panel) and enzymatic activity
(right panel) of wild-type hG6PC (WT), codon optimized wild-type hG6PC (WT_CO), hG6PC_S298C (S298C), and codon optimized hG6PC_S298C
(S298C_CO) mRNAs evaluated in Hep3B cells. Control cells were treated with eGFP mRNA. Data were presented as mean ± SD of n = 3 biologically
independent samples. b hG6Pase-α protein expression (left panel) and enzymatic activity (right panel) of WT and codon optimized hG6PC mRNAs as
evaluated in male CD-1 mice. Control animals were treated with eGFP mRNA. Data were presented as mean ± SD of n = 4 mice. For statistical analysis, raw
values were Log2 transformed and subjected to one-way ANOVA, followed by the Dunnett’s multiple comparisons test, compared to the non-codon
optimized WT hG6PC mRNA. Statistically significant P values (p ≤ 0.05) are shown in the graphs. Source data are provided as a Source Data File.
activity both in Hep3B cells (Fig. 2a) and in livers of WT (CD-1) hG6PC S298C mRNA hereinafter) in livers, hG6PC S298C mRNA,
mice (Fig. 2b). Of note, in CD-1 mice, the combination of protein protein and activity were measured over time. WT (CD-1) mice
variant S298C and codon optimization (S298C_CO mRNA) were i.v. administered with 1.0 mg/kg of eGFP, hG6PC-WT or
resulted in a more significant improvement in both hepatic -S298C mRNA-LNP and sacrificed at 6, 24, 72, 168, or 336 h (n =
protein expression and enzymatic activity (Fig. 2b). 4). Although the hG6PC S298C mRNA (transcripts, T1/2: 20 h)
was cleared rapidly from the liver (Fig. 3a), hG6Pase-α S298C
protein expression (T1/2: 79 h) peaked at 24 h and was detectable
Hepatic hG6PC mRNA and hG6Pase protein half-lives. To up to 168 h (7 days) (Fig. 3b). Similarly, enzyme activity (T1/2: 74
evaluate the impact of the CO hG6PC S298C mRNA (referred as h) was maximum at 24 h and continued for the lifetime of the
4 NATURE COMMUNICATIONS | (2021)12:3090 | https://doi.org/10.1038/s41467-021-23318-2 | www.nature.com/naturecommunicationsNATURE COMMUNICATIONS | https://doi.org/10.1038/s41467-021-23318-2 ARTICLE
a Initially, in a dose-ranging study, four groups of L.G6pc−/−
mice (n =5 –10 per group) were injected i.v. with a single dose of
2.0 either 1.0 mg/kg of eGFP mRNA, or 0.2, 0.5, or 1.0 mg/kg of
hG6PC_WT hG6PC S298C mRNA. In addition, one control group of wild-
hG6PC mRNA hG6PC_S298C_CO
expression
1.5 type C57BL/6 J mice (WT) received phosphate-buffered saline
Relative
1.0 (PBS). Fasting was initiated immediately after administration of
the mRNAs, and blood glucose levels were monitored prior to
0.5 mRNA administration/initiation of fast (0 h) and at 2.5-, 6-, and
0.0 24-h post-mRNA administration/initiation of fast. As shown in
Fig. 4a, in contrast to eGFP mRNA treated mice, mice treated
6 24 72 168 336 with hG6PC S298C mRNA showed significant improvement in
b
fasting glycemia at all doses tested. Of note, blood glucose was
eGFP
G6Pase-α expression
8 above 60 mg/dL (therapeutic threshold based on clinical observa-
hG6PC_WT
tions) in mice that received hG6PC S298C mRNA at all doses
6 hG6PC_S298C_CO
tested. While the increase in fasting blood glucose was dose-
Relative
4 dependent at 2.5-h post-fasting, the fasting glucose levels
observed at 6- or 24-h post-mRNA administration/initiation of
2 fast did not increase with increasing doses, suggesting an
0 adequate physiological regulation of blood glucose during fasting
to maintain blood glucose around 100 mg/dL as in the WT mice
6 24 72 168 336
c (Fig. 4a). Mice were euthanized at 24-h post-mRNA administra-
tion to evaluate liver morphology (Fig. 4b, left panel), liver weight
(nmol/min/mg total protein)
eGFP (Fig. 4b, right panel), hG6Pase-α protein (Fig. 4c, left panel and
300 hG6PC_WT Supplementary Fig. 2, left panel) and enzymatic activity (Fig. 4c,
G6Pase activity
hG6PC_S298C_CO
right panel), and hepatic biomarkers including glucose-6
200 phosphate (G6P) (Fig. 4d, left panel), glycogen (Fig. 4d, middle
panel and Supplementary Fig. 3, top panel), and triglycerides
100 (Fig. 4d, right panel). As shown in representative liver images in
(Fig. 4b), livers of eGFP mRNA-treated L.G6pc−/− mice were
enlarged, pale, and steatotic in appearance as compared to livers
6 24 72 168 336 from WT mice. In contrast, livers of hG6PC S298C mRNA
Time (hours) treated L.G6pc−/− mice more closely resembled livers of WT
mice. In addition, total liver weight was reduced for all three dose
Fig. 3 Hepatic hG6PC mRNA and hG6Pase-α protein and activity half- levels (Fig. 4b, right panel) which, as expected, correlated to a
lives in wild-type mice. Wild-type (CD-1) male mice were i.v. administered dose-dependent increase in hG6Pase-α protein levels (Fig. 4c, left
with 1.0 mg/kg of eGFP, hG6PC-wild type (WT), or codon-optimized panel and Supplementary Fig. 2, left panel) and enzymatic activity
hG6PC-S298C (hG6PC_S298C_CO) mRNA-LNP and sacrificed at 6, 24, 72, (Fig. 4c, right panel) as well as, an increase in hG6PC S298C
168, 336 h (n = 4/group/sacrifice time point). a hG6PC mRNA levels mRNA in hepatocytes (Supplementary Fig. 3, bottom panel).
(hG6PC-WT and S298C mRNAs). b Hepatic protein levels in mice treated Consistent with the above observations, treatment with hG6PC
with eGFP mRNA, mRNA encoding hG6Pase-α WT, or codon-optimized S298C mRNA at all three dose levels resulted in significant
mRNA encoding hG6PC-S298C protein variant. c Hepatic enzymatic reduction in GSD1a hepatic biomarkers (glycogen, G6P, and
activity levels in mice treated with eGFP mRNA, mRNA encoding hG6Pase- triglycerides) compared to the eGFP-treated group (Fig. 4d and
α WT, or codon-optimized mRNA encoding hG6PC-S298C protein variant. Supplementary Fig. 3, top panel). Treatment with hG6PC S298C
Data were presented as mean ± SD (n = 3–4). Source data are provided as mRNA also resulted in a robust decrease in serum triglycerides at
a Source Data File. all three dose levels tested, correlating with the reduction in
hepatic triglycerides levels observed (Fig. 4e).
protein (Fig. 3c). Thus, the CO and protein engineered hG6PC Next, a duration of action study was conducted in L.G6pc−/−
mRNA sequence (S298C) resulted in higher hepatic hG6Pase-α mice to evaluate the effect of hG6PC S298C mRNA on fasting
protein levels and enzymatic activity compared to the WT mRNA. blood glucose. Blood glucose was monitored on days 0 (the day of
Despite the increase in hG6Pase-α hepatic protein levels and administration), 2, 4, 7, 10, and 14 prior to (time 0) or at 2.5- or
enzymatic activity, we did not observe any significant difference in 6-h post-fasting, following a single administration of the hG6PC
the overall rate of clearance of the WT and S298C proteins S298C mRNA. As shown in Fig. 5a, mice treated with the hG6PC
(Fig. 3b, c). S298C mRNA at doses ≥0.5 mg/kg showed statistically significant
improvement in fasting blood glucose when compared to control
mice treated with the eGFP mRNA on days 0, 2, and 4 post-
Efficacy of hG6PC mRNA-LNP in a liver-specific murine model administration. Such an improvement was also observed, at least
of GSD1a (L.G6pc−/−). In vivo pharmacology assessments were partially, on days 7 and 10 post-administration (Fig. 5a). The 2.5-
performed in the liver-specific G6Pase-α null mouse model (L. and 6-h fasting glucose levels in mice treated with hG6PC S298C
G6pc−/−) that recapitulates many of the disease hallmarks seen in mRNA were also maintained at above 60 mg/dL (therapeutic
GSD1a patients52,53. Like GSD1a patients, the L.G6pc−/− mice threshold), for at least 7 days (Fig. 5a). By day 14 post-mRNA
are unable to convert glycogen into glucose, leading to severe administration, no significant difference in fasting blood glucose
hypoglycemia upon fasting52. These mice also present with other was observed between eGFP mRNA-treated and hG6PC S298C
hallmarks of GSD1a including, hepatomegaly, hepatic steatosis, mRNA-treated groups (Fig. 5a). While the dosing regimen
hypertriglyceridemia, and as they grow older, HCAs and (weekly dosing) for maintaining euglycemia in the mouse model
HCCs53,54. Additional details pertaining to the background and (Fig. 5a; as indicated by therapeutic threshold of 60 mg/dL or
the genotype of the strain can be found in the methods section. above) may seem impractical for clinical application, our
NATURE COMMUNICATIONS | (2021)12:3090 | https://doi.org/10.1038/s41467-021-23318-2 | www.nature.com/naturecommunications 5ARTICLE NATURE COMMUNICATIONS | https://doi.org/10.1038/s41467-021-23318-2
a 300 WT L.G6pc-/- WT L.G6pc-/- WT L.G6pc-/- WT L.G6pc-/-
250
Blood glucose (mg/dL)
P=0.0001 P=0.0001 P=0.0022
200
P=0.0002 P=0.0001 P=0.0003
150 P=0.0083 P=0.0001 P=0.0014
100
50
0
eGFP
eGFP
eGFP
eGFP
0.2 0.5 1.0 0.2 0.5 1.0 0.2 0.5 1.0 0.2 0.5 1.0
PBS
PBS
PBS
PBS
hG6PC S298C hG6PC S298C hG6PC S298C hG6PC S298C
mRNA (mg/kg) mRNA (mg/kg) mRNA (mg/kg) mRNA (mg/kg)
Fasting duration (hr): 0 2.5 6.0 24.0
WT mice L.G6pc -/- mice
b WT mice L.G6pc-/- mice 12 P=0.0001
P=0.0002
P=0.0001
(% of body weight)
9
LIver weight
6
3
PBS eGFP 0.2 0.5 1.0
hG6PC S298C mRNA (mg/kg) 0
PBS eGFP 0.2 0.5 1.0
hG6PC S298C
mRNA (mg/kg)
c WT mice L.G6pc -/- mice WT mice e WT mice L.G6pc -/- mice
L.G6pc -/- mice
3 PNATURE COMMUNICATIONS | https://doi.org/10.1038/s41467-021-23318-2 ARTICLE
Fig. 4 Single i.v. dose of hG6PC S298C mRNA-LNP restores euglycemia, as well as serum and hepatic biomarkers in L.G6pc−/− mice. a Blood glucose
levels following administration of hG6PC S298C mRNA-LNP in L.G6pc−/− mice. WT, wild-type mice. (WT treated with PBS, n = 8 per group; L.G6pc−/−
treated with eGFP, n = 6, 5, 5, and 5 per group for fasting duration of 0, 2.5, 6, and 24 h, respectively; L.G6pc−/− treated with hG6PC S298C at 0.2 mg/kg,
n = 7 per group for all time points; L.G6pc−/− treated with hG6PC S298C at 0.5 mg/kg, n = 7, 6, 6, and 6 per group for fasting duration of 0, 2.5, 6, and 24
h, respectively; L.G6pc−/− treated with hG6PC S298C at 1.0 mg/kg, n = 7 per group for all time points). Data were presented as mean ± SD. b Liver
morphology (left panel) and liver weight (right panel) following administration of hG6PC S298C mRNA in L.G6pc−/− mice. Representative liver images are
shown from n = 8, 5, 7, 6, and 6 mice per group from WT treated with PBS, L.G6pc−/− treated with eGFP, and L.G6pc−/− treated with hG6PC S298C
mRNA at 0.2, 0.5, or 1.0 mg/kg, respectively. c hG6Pase-α S298C protein expression and enzymatic activity in livers of L.G6pc−/− mice. d Hepatic
biomarker analysis following administration of hG6PC S298C mRNA-LNP in L.G6pc−/− mice. Liver G6P (left panel), liver glycogen (middle panel), liver
triglycerides (right panel). e Serum triglycerides following administration of hG6PC S298C mRNA-LNP in L.G6pc−/− mice. hG6PC S298C mRNA-LNP dose
range: 0.2, 0.5, and 1.0 mg/kg. For b–e, quantitative data were presented as mean ± SD (n = 8, 5, 7, 6, and 6 mice per group for WT treated with PBS, L.
G6pc−/− treated with eGFP, and L.G6pc−/− treated hG6PC S298C mRNA at 0.2, 0.5, or 1.0 mg/kg, respectively). For statistical analysis, raw values were
Log2 transformed and subjected to one-way ANOVA, followed by the Dunnett’s multiple comparisons test, compared to the eGFP mRNA treated group.
Statistically significant P values (p ≤ 0.05) are shown in the graphs. Source data are provided as a Source Data File.
glucose level. Indeed, it has been suggested that a 5–6-h fast in transformation to HCC15. Unfortunately, while strict compliance
mice may be comparable to an overnight fast in humans58. In the to dietary therapy can address the life-threatening symptoms of
multidose study (Fig. 5b), we have chosen to monitor blood GSD1a, it is often only marginally effective at preventing HCA/
glucose at 2.5-h post-fasting on days 0, 1, 4, 7, and 10 following HCC. To evaluate the effect of hG6PC S298C mRNA on pre-
administration of the mRNA. Consistent with observations from vention of HCA/HCC, we induced HCC in L.G6pc−/− mice by
single dose studies (Figs. 4a and 5a), hG6PC S298C mRNA- feeding them a high fat/high sucrose (HF/HS) diet using the
treated L.G6pc−/− mice had a pronounced improvement in protocol we have previously published54. We then treated the L.
fasting glycemia, in comparison with control mice receiving eGFP G6pc−/− mice, with ten doses (dosed at 0.25–0.5 mg/kg) of
mRNA treatment (Fig. 5b). Importantly, the improvement in hG6PC S298C mRNA or control eGFP mRNA administered
fasting glycemia with hG6PC S298C mRNA was sustained over every 1–2 weeks. While only one WT mouse (out of a total of 21
the course of the treatment and did not diminish with repeat WT mice) developed a lesion, ~58% of the control L.G6pc−/−
dosing (Fig. 5b). mice (16 out of 26) fed a HF/HS diet developed visible (macro-
scopic) HCA/HCC lesions (Fig. 6a, left panel). Of note, several
mice within this cohort developed more than one lesion per liver
Evaluation of safety of hG6PC mRNA-LNP in a liver-specific (Fig. 6a, middle panel). In contrast, treatment with hG6PC S298C
murine model of GSD1a (L.G6pc−/−). Safety is a key con- mRNA resulted in significantly fewer mice with visible lesions (8
sideration for the development of any chronic therapy. Initially, out of 34 or ~23%) (Fig. 6a, left panel) and significantly fewer
in order to demonstrate the abrogation of immune stimulation by visible hepatic lesions per mouse (Fig. 6a, middle panel). Finally,
mRNA through the use of modified nucleotides35–37, we assessed overall tumor burden (determined by summing the area of each
serum cytokine levels for interferon gamma (IFNɣ), interleukin- HCA/HCC lesion per liver sample) was reduced in the hG6PC
1beta (IL-1β), tumor necrosis factor alpha (TNFα), and S298C mRNA treated group vs. the eGFP mRNA treated group
interleukin-6 (IL-6) (Fig. 5c, left to right) in L.G6pc−/− mice that (Fig. 6a, right panel). These observations were further confirmed
were euthanized 24 h post-mRNA treatment from our dose- by morphological (Fig. 6b, top panels) and histological analysis of
ranging study (Fig. 5c). No increase in measured serum cytokines the representative liver sections from each cohort (Fig. 6b, bottom
was observed at any dose level of hG6PC S298C mRNA tested. In panels). Moreover, HCA/HCC-related biomarkers (i.e., PKM2, β-
addition to a lack of increase in cytokine levels, we also observed a catenin, and p62)54 (Fig. 6c); and genes associated with cellular
tendency of improvement in liver enzymes (e.g., ALT) in the proliferation and HCA/HCC development (i.e., Tgfb1, Glul, and
mRNA treated mice (Fig. 5d). Of note, in the repeat dose study Ctnnb1)54 were also partially reversed with hG6PC S298C mRNA
(Fig. 5b) no significant increase in serum IFNɣ, IL-1β, IL-6, and treatment (Supplementary Fig. 4a). In addition, alpha fetoprotein
TNFα levels was observed in L.G6pc−/− mice treated with five (AFP)—a serum biomarker associated with GSD1a-related HCA/
consecutive doses of 0.5 mg/kg of hG6PC S298C mRNA (Fig. 5e). HCC development54—was also partially reduced upon treatment
In the same study, we also measured antidrug antibodies (ADA). with hG6PC S298C mRNA (Supplementary Fig. 4b). Finally, as
Importantly, no appreciable ADA response was observed in the observed in the chronic dose study (Fig. 5b), treatment with
serum of mice treated with hG6PC S298C mRNA (Fig. 5f). hG6PC S298C mRNA showed a significant positive effect on
Finally, no observed hypersensitivity (changes in body tempera- fasting glycemia throughout the course of the treatment (Sup-
ture, altered breathing and ruffled fir), mortality, body weight, plementary Fig. 4c, bottom panel). Collectively, these data suggest
and changes in behavior (i.e., loss of appetite and distress) was that chronic treatment of hG6PC S298C mRNA reduces the risk
observed in treated mice (data shown for body weight) (Fig. 5g). of HCA/HCC, a long-term complication with GSD1a by func-
While additional safety studies performed in larger animal tional restoration of hepatic G6Pase.
models (i.e., rats and nonhuman primates) are warranted for
future clinical development, the above data suggest that hG6PC
S298C mRNA may be well-tolerated under the conditions of Discussion
these studies. This is the first evidence that repeat administration in model mice
of an mRNA-based therapy for GSD1a that appears to be well-
tolerated and efficacious at improving both fasting-tolerance and
Therapeutic impact of hG6PC mRNA-LNP in long-term hepatic lesions. In this study, we engineered chemically-modified,
GSD1a pathology. Due to deregulated glucose homeostasis, CO mRNAs encoding hG6Pase-α and encapsulated them in LNPs
over 75% of GSD1a patients develop long-term liver complica- to enable delivery to the liver. We show that the engineered
tions, such as HCAs13–15. HCA presents in patients over 25 years mRNAs resulted in a hG6Pase-α enzyme with increased expres-
of age and in 10% of cases, HCA undergoes malignant sion and enzymatic activity compared to non-optimized mRNA
NATURE COMMUNICATIONS | (2021)12:3090 | https://doi.org/10.1038/s41467-021-23318-2 | www.nature.com/naturecommunications 7ARTICLE NATURE COMMUNICATIONS | https://doi.org/10.1038/s41467-021-23318-2 sequences (Fig. 1c). The protein translated from the engineered phenotypes in patients, the optimized mRNAs resulted in mRNAs was also directed to the proper subcellular compartment restoration of fasting blood glucose levels (Fig. 4a), normalization (endoplasmic reticulum) (Fig. 1d). When injected in a liver- of several hepatic and serum biomarkers associated with GSD1a specific mouse model of GSD1a that recapitulates the hepatic (Fig. 4b, d, e). Importantly, repeat administration of the mRNAs 8 NATURE COMMUNICATIONS | (2021)12:3090 | https://doi.org/10.1038/s41467-021-23318-2 | www.nature.com/naturecommunications
NATURE COMMUNICATIONS | https://doi.org/10.1038/s41467-021-23318-2                                                                        ARTICLE

Fig. 5 Repeat i.v. dose of hG6PC mRNA-LNP results in safe and effective restoration of euglycemia in L.G6pc−/− mice. a Single-dose duration of action
of hG6PC S298C mRNA-LNP (0.5 or 1.0 mg/kg) administered i.v. in L.G6pc−/− mice. Blood glucose levels were measured at fed (0 h) or fasting conditions
(2.5- or 6-h post-fasting). Data were presented as mean ± SD (n = 8, 9, 10, 10, and 10 mice per group for wild-type (WT) treated with PBS, L.G6pc−/−
treated with eGFP, hG6PC S298C mRNA at 0.5 or 1.0 mg/kg, respectively). For statistical analysis, two-sample t-test (two-sided) was performed and
corrected for multiple testing by using a Bonferroni adjusted level of 0.005. *P ≤ 0.05, **P ≤ 0.01, ***P ≤ 0.001, ****P ≤ 0.0001, comparing hG6PC S298C
mRNA 1.0 mg/kg with eGFP (p values are 0.0017 [day 0, 2.5 h], 0.0016 [day 0, 6 h], 0.0006 [day 2, 2.5 h], 0.0005 [day 2, 6 h], 0.001 [day 4, 2.5 h],
0.001 [day 4, 6 h], and 0.048 [day 7, 6 h], respectively). †P ≤ 0.05, ††P ≤ 0.01, †††P ≤ 0.001, ††††P ≤ 0.0001, comparing hG6PC S298C mRNA 0.5 mg/kg
with eGFP (p values are 0.033 [day 0, 2.5 h], 0.001 [day 0, 6 h], 0.0004 [day 2, 2.5 h], 0.00003 [day 2, 6 h], 0.002 [day 4, 2.5 h], 0.001 [day 4, 6 h], and
0.009 [day 7, 6 h], respectively) b Blood glucose levels following repeat (five doses) i.v. administrations of hG6PC S298C mRNA-LNP (0.25 mg/kg) in L.
G6pc−/− mice. Arrows indicate dose administration. Blood glucose levels were measured at 2.5-h post-fasting. Data were presented as mean ± SD (n = 8,
7, and 9 mice per group for WT treated with PBS, L.G6pc−/− treated with eGFP, and L.G6pc−/− treated with hG6PC S298C mRNA, respectively). For
statistical analysis, two-sample t-test (two-sided) was performed and corrected for multiple testing by using a Bonferroni adjusted level of 0.005. *P ≤
0.05, **P ≤ 0.01, ***P ≤ 0.001, ***P ≤ 0.0001 comparing hG6PC S298C mRNA with eGFP (p values are 0.005 [day 11], 4 × 10⁻⁶ [day 25], 0.0007 [day
28], 0.0192 [day38], 1.3 × 10⁻⁵ [day 39], 0.001 [day 42], 2 × 10⁻⁶ [day 52], and 5 × 10⁻⁵ [day 53], respectively). c Serum proinflammatory cytokines
(from left to right): IFNɣ, IL-1β, TNFα, and IL6 from the dose-ranging study. d serum ALT (mU/mL) levels from the dose-ranging study. For c and d, data
were presented as mean ± SD (n = 6, 5, 8, 7, and 6 mice per group for WT treated with PBS, L.G6pc−/− treated with eGFP, and L.G6pc−/− treated with
hG6PC S298C mRNA at 0.2, 0.5, or 1.0 mg/kg, respectively). e Serum proinflammatory cytokines (from left to right): IFNɣ, IL-1β, TNFα, and IL6 from
repeat-dose study. Data were presented as mean ± SD (n = 10, 10, and 7 mice per group for WT treated with PBS, L.G6pc−/− treated with eGFP, or hG6PC
S298C mRNA). f Antidrug antibody assay measuring anti-G6Pase-α antibodies in sera of mice treated with five doses of hG6PC S298C mRNA-LNP (0.5
mg/kg). Data were presented as mean ± SD (n = 9, 7, 7, 6 mice per group for WT treated with PBS, L.G6pc−/− treated with eGFP, L.G6pc−/− treated with
hG6PC S298C mRNA, and positive sera, respectively). g Body weight of L.G6pc−/− mice prior to each repeat i.v. dose treatment of hG6PC mRNA -LNP
(0.25 mg/kg) for repeat dose study. Data were presented as mean ± SD (n = 8, 7, and 9 mice per group for WT treated with PBS, L.G6pc−/− treated with
eGFP, and L.G6pc−/− treated with hG6PC S298C mRNA, respectively). For statistical analysis of c–f, raw values were Log2 transformed and subjected to
one-way ANOVA, followed by the Dunnett’s multiple comparisons test, compared to the eGFP mRNA treated group. P values are shown in the graphs
(c–f). Source data are provided as a Source Data File.

was well-tolerated (Fig. 5e–g), resulted in the management of life-             neutralizing antibodies against viral vectors, which are present in
threatening hypoglycemia (Fig. 5b), may reduce the risk of long-                >50% of the population (and likely higher in previously treated
term hepatic complications (e.g., HCA/HCC) (Fig. 6).                            patients), repeat administration of AVV-based gene therapy is
   A key consideration when developing a drug for GSD1a is that                 not ideal67. Thus, once treated, the patient may require a new
the drug must have a sustained therapeutic effect. This can be                  vector serotype, eventually exhausting available options.
achieved by (1) permanent gene correction (e.g., via gene editing),                 Systemic mRNA therapy offers several advantages as a ther-
(2) gene insertion (e.g., vectored gene therapy), or (3) repeat                 apeutic alternative to gene therapy, including (1) efficient protein
administration of a transient therapeutic over the course of the                expression without the need to first enter the nucleus, (2)
patient’s life. While gene editing approaches remain the holy grail             essentially no integration risk, and (3) amenability to repeat dose.
for treating monogenic diseases, they are still in the early stages of          This third advantage is key, since, unlike the reported sustained,
development and several recent studies have raised concern about                long-term expression associated with gene therapy, protein
unintended consequences59,60. Notably, early versions of gene                   expression via mRNA-mediated delivery is transient and, like
editing technology seem prone to hundreds (or even thousands)                   protein-based therapeutics (e.g., ERT), requires long-term
of unintended, off-target mutations throughout the genome61.                    chronic dosing. Here we show that our GSD1a mRNA therapy
Many of these mutations are likely to be silent and pose minimal                was well-tolerated and effective when dosed repeatedly, with
risk to the patient, however, the risk of deleterious edits cannot be           little-to-no evidence of an immune response against the human
discarded offhand, especially germ line changes.                                protein in the GSD1a mouse model (Fig. 5e–g).
   Gene therapy approaches have gained considerable momentum                        As discussed above, HCA/HCC is a long-term complication of
over the last 5 years62,63, with several approvals granted by the US            GSD1a. The ability to restore G6Pase-α activity is expected to
Food and Drug Administration (FDA) for treating various dis-                    significantly reduce the risk of developing HCA/HCC overtime.
eases, such as retinal dystrophy (LUXTURNA, Spark Ther-                         Towards this end, previous studies performed in mouse models of
apeutics, Inc.), spinal muscular atrophy (ZOLGENSMA, AveXis,                    GSD1a have shown that a recombinant adeno-associated virus
Inc.), and others64. Gene therapy has been successfully used to                 (rAAV) vector-mediated G6PC gene transfer to either 2-week-old
correct the pathologies associated with GSD1a in both                           global G6pc−/− mice or adult L.G6pc−/− mice prevented HCA
mouse19–22 and dog models65, and is currently being evaluated in                development68,69. While encouraging, the gene therapy approach
GSD1a adult patients23. However, clinical feasibility remains                   was not able to abrogate preexisting tumors due to lack of
elusive primarily due to efficacy hurdles and the inherent risks                 expression of the virus in the adenoma lesions69. The authors
associated with viral-based gene therapy. One limitation of gene                went on to show that the viral transgene was under the control of
therapy is known as the “dilution effect”, where the therapy                    glucocorticoid signaling which is impaired in the adenoma
becomes less effective over time due to the natural process of liver            lesions, resulting in suppressed gene therapy mediated G6Pase-α
cell growth and regeneration66. The dilution effect is the reason               restoration. Because mRNA therapy is not regulated at the level of
why young patients (
ARTICLE                                                                                                       NATURE COMMUNICATIONS | https://doi.org/10.1038/s41467-021-23318-2

              a                    # of tumor-bearing mice/total mice
                                           1/21     16/26        8/34                                         P=0.002 P=0.0245
                                   1.5                                                                                                                              500           P=0.0009 P=0.0002
                                               P=0.0001 P=0.0111
                                                                                                        6

                                                                                                                                               Tumor burden (mm2)
                                                                          Number of tumors
        Number of mice

                                                                                                                                                                    400
          with tumor

                                                                            per mouse
                                   1.0                                                                  4                                                           300

                                                                                                                                                                    200
                                   0.5                                                                  2
                                                                                                                                                                    100

                                   0.0                                                                  0                                                               0
                                            PBS      eGFP hG6PC                                              PBS    eGFP hG6PC                                                PBS       eGFP hG6PC
                                                          S298C                                                          S298C                                                               S298C
                                            WT            L.G6pc-/-                                          WT           L.G6pc-/-                                              WT        L.G6pc-/-

              b
                                                WT mice                                                                     L.G6pc-/- mice

                                                                                                                                                                                      hG6PC
                                                                PBS                                                        eGFP                                                       S298C
                                                WT mice                                                                     L.G6pc-/- mice

                                                                                                                                                                                    hG6PC
                                                                PBS                                                        eGFP                                                     S298C
              c
                                                                                                               P=0.0075    P
NATURE COMMUNICATIONS | https://doi.org/10.1038/s41467-021-23318-2 ARTICLE
Fig. 6 Effect of hG6PC S298C mRNA-LNP on prevention of hepatic adenomas in L.G6pc−/− mice. a Number of mice with tumors (left), number of
tumors per mouse (middle), and tumor burden/area (right). Data were presented as mean ± s.e.m (n = 21, 26, and 34 mice per group for wild-type (WT)
treated with PBS, L.G6pc−/− treated with eGFP, and hG6PC S298C mRNA, respectively). b Liver morphology (tumor-circled in yellow) (top panels) and
liver histology (bottom panels) of WT and L.G6pc−/− mice treated with either eGFP mRNA or hG6PC S298C mRNAs. c HCA/HCC biomarkers (protein
expression). Results are expressed as mean ± SD (n = 15, 27, and 35 mice per group for WT treated with PBS, L.G6pc−/− treated with eGFP, and L.G6pc−/−
treated with hG6PC S298C mRNA, respectively). For statistical analysis, raw values were subjected to one-way ANOVA, followed by the Dunnett’s
multiple comparisons test, compared to the eGFP mRNA treated group. Statistically significant P values (p ≤ 0.05) are shown in the graphs. Source data are
provided as a Source Data File.
suffering from other metabolic enzyme deficiencies of the liver nitrogen and stored at −80 °C for protein expression and enzymatic activity
that are not amenable to current treatment modalities. measurement.
Methods Protein expression analysis. hG6Pase-α protein expression levels in cell lysates or
mRNA production and formulation. Complete N1-methylpseudouridine sub- liver microsomes were measured by standard immune-blotting procedure, using
stituted mRNA was synthesized in vitro from a linearized DNA template con- LI-COR odyssey system. Total protein concentration of cell lysates or liver
taining the 5′ and 3′ untranslated regions (UTRs) and a poly-A tail, as previously microsomes were quantified by Pierce® BCA Protein Assay kit (Thermo Scientific).
described37. After purification, the mRNA was diluted in citrate buffer to the Samples were separated by 4–12 % SDS-PAGE gel and transferred to nitrocellulose
desired concentration and frozen. Complete sequence of hG6PC-S298C can be membranes by dry blotting system (iBlot2, Invitrogen). Membranes were incubated
found in the Supplementary Materials (see Supplementary Table 1). with anti-hG6Pase-α (HPA052324, Atlas Antibodies) and anti-ERP72 (D70D12,
LNP formulations were prepared by ethanol drop nanoprecipitation as Cell Signaling) followed by incubation with (IR)-labeled goat anti-rabbit secondary
previously described70. Briefly, heptadecan-9-yl 8-((2-hydroxyethyl)(8-(nonyloxy)- antibody (IRDye® 800CW, LI-COR). IR-intensity signals were detected and
8-oxooctyl)amino)octanoate, dipalmitoylphosphatidylcholine, cholesterol, and 1,2- quantified by Odyssey CLx (LI-COR Biosciences). For quantitative analysis, the
dimyristoyl-glycero-3-methoxypolyethylene glycol-2000 were dissolved in ethanol expression levels of ERP72 were used as an internal control to normalize that of
and combined with acidified mRNA (sodium acetate, pH 5) at a ratio of 3:1 G6Pase-α.
(aqueous:ethanol). Formulations were dialyzed against PBS, pH 7.4, in dialysis
cassettes for at least 18 h. Formulations were concentrated using Amicon ultra G6Pase-α activity assay. G6Pase-α enzymatic activity was measured by the
centrifugal filters (EMD Millipore), passed through a 0.22 µm filter, and stored at 4 release of inorganic phosphate from G6P using Taussky–Shorr’s method71. Briefly,
°C until use. All formulations were tested for particle size, RNA encapsulation, and in a round bottom 96-well plate, 40 µl of 200 mM G6P, 100–115 µl of 100 mM BIS-
endotoxin and were found to be suitable for in vivo use. Tris buffer (pH 6.5), and 5–20 µl of either transfected cell lysates or liver micro-
somes were added and incubated at 37 °C for 30 min. Then, 40 µl of 20% tri-
Mammalian cell culture and transfection. HeLa and Hep3B cells were obtained chloroacetic acid (TCA) solution was added to each well and incubated at room
from ATCC and were maintained in DMEM media (10% FBS) at 37 °C supplied temperature for at least 5 min to quench the reaction. Subsequently, the reaction
with 5% CO2. One day prior to transfection, 500,000 cells/well were seeded on 6- mixture was centrifuged at 1800xg for 20 min to sediment the precipitated protein
well plates, resulting in ∼70% confluency on the day of transfection. Cells were and other debris. A portion of supernatant (25–50 µl) was transferred to a new
transfected with 1 µg of mRNA using Lipofectamine 2000 or Messenger MAX™ transparent flat-bottom 96-well plate and mixed with 50–75 µl of distilled water
(Invitrogen) by following the manufacturer’s protocol. 24–48 h post-transfection, and 100 µl of premade Taussky–Shorr color reagent (1% ammonium molybdate,
cells were harvested and used for protein expression or enzymatic activity 5% Iron (II) sulfate, and 0.5 M sulfuric acid), followed by incubation at room
measurement. temperature for 5 min. Color development in reactions was measured by absor-
bance at 660 nm and the released inorganic phosphate (Pi) was determined based
on a series of Pi standards. Final G6Pase-α enzymatic activity was expressed as
Consensus sequence analysis for protein engineering. Alternative G6Pase-α amount of Pi (nmol) released per mg of total protein per minute of reaction time
protein sequences in other mammalian species (nonhuman orthologs) were ranked (nmol/min/mg total protein). The total protein concentration in cell lysates and
by a score that maximizes the difference in relative entropy between the consensus microsomes was determined by Pierce® BCA Protein Assay kit (Thermo Scientific).
substitution and the wild-type amino acid at that position. Relative entropy, also
known as Kullback–Leibler divergence, is a common measure of amino acid
conservation, defined at sequence position i for amino acid k as: Confocal immunocytochemistry analysis. HeLa cells were plated in 96-well,
plastic bottom plates (655892, GreinerBio) using recommended culturing condi-
f ik tions, at a density of 15,000 cells per well. Cells were either kept non-transfected or
Dik ¼ f ik log ð1Þ transfected with the hG6PC mRNA (50 ng/well) using Lipofectamine 2000. At 6,
qk
24, and 48 h post-transfection, the cells were fixed in 4% PFA, permeabilized in
where f_ik is the observed frequency that the amino acid k appears at position i, 0.5% Triton X-100, blocked in 1% BSA, followed by immunofluorescent staining
and q_k is the background probability for that amino acid among all proteins for a with anti- G6Pase-α rabbit Ab (HPA052324, Sigma) and anti-Calnexin mouse Ab
given species (Supplementary Table 2). Our mutation score at position i is then the (66332, Abcam) or anti-TOM20 mouse Ab (612278, BD BioSciences) to examine
difference in consensus relative entropy (D_ic) and wildtype relative entropy the subcellular localization. Secondary antibody incubation was used to amplify the
(D_iw): signal (goat anti-rabbit Alexa 488 and goat anti-mouse Alexa 647, respectively).
The cells were counter stained with DAPI for nuclei visualization. For image
Si ¼ Dic Diw ð2Þ acquisition and colocalization analysis, samples were imaged on the Opera Phenix
spinning disk confocal microscope (Perkin Elmer), using a 63 × water immersion
The homologous sequences were obtained by BLAST search. Canonical human objective (NA 1.15). Sixteen fields of view (~40 cells each) have been imaged for
glucose 6-phosphatase (hG6PC; UniProt ID: P35575) served as the query sequence each sample. The TOM20 mitochondrial marker was imaged with the 647 nm laser
to search the “UniProtKB reference proteomes plus Swiss-Prot” database (from line, and the hG6Pase-α was imaged with the 488 nm laser line and the nuclear
uniprot.org) using the BLASTp algorithm with default parameters stain was imaged with the 405 nm laser line. A z-stack of five optical sections
(BLOSUM62 similarity matrix, expect threshold 10, gap open penalty 11, gap spanning 2 µm were acquired for all three channels. Image analysis was performed
extension penalty 1, no filter) and 100 max sequences (see Source Data File). The in Harmony, using a custom script to calculate the Mander’s colocalization
resulting 100 sequences were then realigned to the parental hG6PC sequence using coefficient.
the multiple sequence alignment (MSA) software tool MAFFT v.7.407. The MSA
was “sliced” to remove gaps in the aligned hG6PC sequence. Weblogo v.3.7.1 was Hepatic hG6PC mRNA, G6Pase-α protein, and enzymatic activity analysis in
used to visualize the consensus amino acids at different positions.
wild-type mice. WT (CD-1) male mice were i.v. administered with 1.0 mg/kg of
eGFP, hG6PC-WT, or hG6PC-S298C mRNA-LNP and sacrificed at 6 h, 1, 3, 7, or
Preparation of microsomes from mouse livers. Liver tissues (0.5–1 g) were 14 days (n = 4). Subsequently, hepatic hG6PC-WT or -S298C mRNA levels were
homogenized in homogenization buffer (0.9% NaCl, 10 µl/mg liver) with Polytron measured by RT-qPCR. Briefly, total RNA was extracted from liver tissue using
homogenizer at 6000 rpm, followed by addition of microsomal buffer (4 mM NaCl, Promega Maxwell RSC simplyRNA tissue kit (Promega A1340) and quantified with
2% Glycerol, 12 ul/mg liver). The homogenate was centrifuged at 12,000xg for Quanti-IT Broad kit (ThermoFisher Scientific Q10213). In total, 10 ng of RNA was
20 min at 4 °C, followed by recentrifugation of supernatant at 105,000xg for 1 h at used in RT-qPCR reaction using ABI Quant Studio Flex7 instrument and Taqman
4 °C. The resulting pellet was resuspended in microsomal buffer (1 ul/mg liver) by assay specifically designed to measure hG6PC-specific fragments (forward primer
passing through 23 G × 1 ½ needles 20 times. Samples were flash frozen in liquid sequence: GTGGCTCCCTTTCAGACTTAG; reverse primer sequence:
NATURE COMMUNICATIONS | (2021)12:3090 | https://doi.org/10.1038/s41467-021-23318-2 | www.nature.com/naturecommunications 11ARTICLE NATURE COMMUNICATIONS | https://doi.org/10.1038/s41467-021-23318-2
GAAGCTCAGCACGTAGAACA; FAM-tagged probe sequence: AAG- protein markers (PKM2, β-catenin, and p62 were measured by standard immu-
GAGGCTTCAGGCTGTCGAAC) (see Supplementary Table 3). hG6PC-WT or noblotting procedure as described above with the following primary antibodies:
-S298C mRNA levels were calculated based on standard curves and normalized to PKM2 (D78A4) XP® Rabbit mAb (cat #4953, Cell Signaling), β-catenin (D10A8)
β-actin mRNA level quantified by Taqman assay #Mm02619580_g1 (Thermo- XP® Rabbit mAb (cat #8480, Cell signaling), and Anti-SQSTM1/p62 mouse mAb
Fisher Scientific). Hepatic hG6Pase-α WT or S298C protein expression and (cat #ab56416, Abcam).
enzymatic activity were measured as described above. Half-lives were determined
by non-compartmental analysis using Phoenix WinNonlin (Version 8.1, Certara).
For laboratory animals used in Moderna facilities, all experimental protocols were Hepatic biomarker measurements
approved by the Institutional Animal Care and Use Committees at Moderna and Liver G6P measurements. Hepatic G6P was measured with G6P assay kit
complied with all relevant ethical regulations regarding the use of research animals. (MAK014, Sigma-Aldrich) by following the manufacturer’s protocol. Briefly,
Mice were housed under the following conditions: temperature—68 to 79 °F mouse livers were homogenized in ice-cold H2O (4 µl/mg tissue), followed by
(20–26 °C), humidity—30–70%, dark/light cycle—an automatically controlled 12-h centrifugation at 13,000xg, for 10 min at 4 °C. Supernatant was filtered through 10
light:12-h dark—light cycle was maintained. KDa MWCO spin filter and centrifuged at 13,000xg for 30 min at 4 °C for removal
of insoluble materials and proteins. Samples were mixed with reaction mix and
incubated for 30 min at room temperature in the dark. Color change in reaction
Liver-specific knockout (L.G6pc−/−) mouse model of GSD1a. The development was measured by absorbance at 450 nm (A450). Amount of G6P was determined
of a liver-specific G6pc knockout mouse model (L.G6pc−/−) was previously by subtracting A450 of blanks from that of samples, interpolating values based on a
described53. Briefly, a mouse line in the C57BL/6 J background with two loxP sites G6P standard curve and normalizing by total protein amount determined by
flanking the G6PC exon 3 (B6.G6PC lox/lox) was generated and crossed with BCA assay.
transgenic mice with liver-specific expression of CRE recombinase under the
control of the serum albumin promoter fused to a ligand-binding domain of the Liver glycogen measurements. Hepatic glycogen was measured with glycogen assay
estrogen receptor (B6.SA CREERT2/w). To induce the excision of G6PC exon 3, kit (MAK016, Sigma-Aldrich) by following the manufacturer’s protocol. Briefly,
the resulting B6.G6PC lox/lox.SAcreERT2/w male adult (6–8 weeks old) mice were mouse livers were homogenized in ice-cold H2O (10 µl/mg tissue) and boiled for 5
injected intraperitoneally once daily with 100 µl of tamoxifen (1 mg/ml, min. Then, samples were centrifuged at 13,000xg for 5 min at 4 °C for removal of
Sigma–Aldrich) for 5 consecutive days, to obtain L.G6pc−/− mice. Male mice were insoluble materials, followed by addition of hydrolysis enzyme mix to samples and
housed for a minimum of 4 weeks following the tamoxifen treatment prior to glycogen standards. Hydrolysis reaction was carried out for 30 min at room tem-
enrolling in the studies. As previously reported, the 4-week period is sufficient to perature. Subsequently, samples were mixed with reaction mix and incubated for
ensure that all mice harbor the gene deletion53. Control C57BL/6 J male mice were 30 min at room temperature in the dark. Color change in reaction was measured by
also treated with similar tamoxifen injections to rule out any potential effect of absorbance at 570 nm (A570). Amount of glycogen was determined by subtracting
tamoxifen in treatment outcome. Male mice were housed in the animal facility of A570 of blanks from that of samples, interpolating values based on a glycogen
Lyon 1 University under temperature controlled (22 °C) conditions and with a 12/ standard curve and normalizing by total protein amount determined by BCA assay.
12-hour light/dark cycle. Mice had free access to water and standard chow diet.
Fasted mice were provided with continuous access to water. All the procedures
Liver triglycerides measurements. Hepatic and serum triglycerides were measured
were performed in accordance with the principles and guidelines established by the
with triglyceride assay kit (10010303, Cayman Chemical) by following the man-
European Convention for the Protection of Laboratory Animals. All conditions and
ufacturer’s protocol. Briefly, mouse livers were homogenized in NP40 substitute
experiments were approved by the University Lyon I animal ethics committee and
assay reagent (5 µl/mg tissue) and centrifuged at 10,000xg for 10 min at 4 °C.
the French Ministry of National Education, Higher Education and Research
Subsequently, the supernatant was diluted tenfold in NP40 substitute assay reagent
(Permit Apafis numbers: 20821-2019052414026539v2 and 25143-
and mixed with enzyme mixture. Enzymatic reaction was carried out for 15 min at
2020041814543626 v1).
room temperature. Color change in reaction was measured by absorbance at 545
nm (A545). Amount of triglyceride was determined by subtracting A545 of blanks
In vivo efficacy studies from that of samples, interpolating values based on a triglyceride standard curve
Dose-ranging study. L.G6PC−/− mice were given a single i.v. bolus injection (via the and normalizing by total protein amount determined by BCA assay.
caudal vein) of either eGFP mRNA (1 mg/kg) or hG6PC-S298C mRNA formulated
in LNP (0.2 or 0.5 or 1.0 mg/kg mRNA). Wild-type (C57BL/6 J) mice were treated
Safety Studies
with PBS. Immediately after the injection, fasting was induced by removal of food
Proinflammatory cytokine analysis. Proinflammatory cytokine levels were mea-
and blood glucose levels were measured at 0 (fed state), 2.5, 6, and 24 h of fasting.
sured from serum of L.G6pc−/− mice treated with hG6PC S298C-LNP at 0.2, 0.5,
Mice were euthanized at 24 h post-treatment and livers were harvested, weighed,
and 1.0 mg/kg, using a modified MesoScale Diagnostics proinflammatory panel1
photographed, and snap-frozen for downstream processing. Hepatic glycogen,
mouse kit (MesoScale Diagnostics, #K15048D) with IFNɣ, IL-1β, TNFα, and IL-6,
G6P, triglycerides, and serum biomarkers including liver enzyme (ALT) and tri-
only. Briefly, serum samples and cytokine standards were incubated on a plate pre-
glycerides were measured by commercially available kits as described below. The
coated with anti-cytokine capture antibodies for 2 h at room temperature, followed
G6Pase-α protein expression and G6Pase-α activity in liver microsomes were
by washing and incubation with detection antibodies for 2 h at room temperature.
assessed as described above.
Absorbance was read with QuickPlex SQ 120 with the addition of 150 μL 2X MSD
Read Buffer. Serum cytokine levels were calculated based on respective standard
Duration-of-action study. Wild-type (C57BL/6 J) male mice or L.G6pc−/− male curves.
mice were i.v. administered with either PBS or LNP-formulated eGFP mRNA (1.0
mg/kg) or the hG6PC-S298C mRNA (0.5 or 1.0 mg/kg). Subsequently, blood glu-
Plasma alanine aminotransferase (ALT) analysis. Plasma ALT levels were measured
cose levels were measured over 14 days (on 0, 2, 4, 7, 10, and 14 days post-
by using a commercially available kit (MAK052, Sigma-Aldrich) following the
treatment) with a glucometer (Roche Diagnostic) at 2.5 and 6 h of fasting.
manufacturer’s protocol. In this assay, ALT activity is determined by the amount of
pyruvate generated. The ALT activity is expressed as milliunit (mU)/ml, where one
Repeat-dose efficacy study. Wild-type (C57BL/6 J) male mice or L.G6pc−/− male mU of ALT is defined as amount of enzyme that generates 1 nmol of pyruvate per
mice were i.v. administered with five consecutive injections of either eGFP mRNA minute at 37 °C.
or hG6PC-S298C mRNA every 10 (second dose) to 14 days (all other doses) at 0.25
mg/kg dose level. After each treatment, blood glucose was measured at 2.5 h of
Anti-G6Pase-α antibody ELISA. Antibodies against G6Pase-α were quantified on
fasting on days 1, 4, 7, and 10.
Nunc Immuno Maxisorp plates (ThermoFisher, #442404) coated with 0.5 µg/mL
recombinant G6Pase-α protein (Viva Biotech) in 50 mM Na2CO3 for 1 h at room
Hepatocellular adenoma (HCA) prevention study. Wild-type (C57BL/6 J) (n = 21) temperature and blocked with SuperBlock (PBS) Blocking Buffer (ThermoFisher,
and L.G6pc−/− male mice (n = 60) were fed a high fat/high sucrose (HF/HS) diet #37515). Mouse serum diluted 1:20 dilution in PBS was incubated 1 h at room
throughout the course of the study (and 3 months prior to beginning treatment temperature and quantified with a standard curve using commercial rabbit anti-
with mRNAs) to accelerate/facilitate the development of HCA/HCCs54. Male mice human G6Pase-α IgG (Abcam, #ab93857) at 0–2 µg/mL. Samples and standards
were treated with 8–10 consecutive injections of either PBS, eGFP mRNA, or were incubated 1 h at room temperature with goat anti-rabbit IgG-HRP (Abcam,
hG6PC-S298C mRNA administered i.v. every 7 to 14 days at 0.25–0.5 mg/kg dose #ab6721) or goat anti-mouse IgG H + L-HRP (Fitzgerald Laboratories, #43-GM30)
level. Mice were euthanized 8 days after the last mRNA treatment and livers and secondary antibody at 1:100,000 dilution. ELISA was developed with 1-Step Ultra
tumors were harvested, weighed, counted, measured, and photographed. Liver and TMB-ELISA substrate (ThermoFisher, #34028) and Stop Solution (ThermoFisher,
tumor tissues were either, snap-frozen in liquid nitrogen and kept at −80°C, or #SS04) before reading at 450 nm.
fixed and embedded in paraffin blocks for further use. Total RNA was extracted
from liver tissue by the Promega Maxwell RSC simplyRNA tissue kit as mentioned
above, and the HCA/HCC-related mRNA markers (β-catenin, transforming Statistical analysis. All data were shown as means ± SD. For statistical analysis,
growth factor beta-1 and glutamine synthetase) were measured by custom Taqman unless otherwise stated, raw data were Log2 transformed to account for non-
assays from ThermoFisher Scientific (Supplementrary Table 3). HCA/HCC-related Gaussian distribution and means were compared by one-way analysis of variance
12 NATURE COMMUNICATIONS | (2021)12:3090 | https://doi.org/10.1038/s41467-021-23318-2 | www.nature.com/naturecommunicationsYou can also read