Mineralogical classification and crystal water characterisation of beryl from the W-Sn-Be occurrence of Xuebaoding, Sichuan province, western China
←
→
Page content transcription
If your browser does not render page correctly, please read the page content below
Mineralogical Magazine (2021), 85, 172–188
doi:10.1180/mgm.2021.13

Article

Mineralogical classification and crystal water characterisation of
beryl from the W–Sn–Be occurrence of Xuebaoding, Sichuan
province, western China
Ping Wang1, §, Thomas P. Gray2, Zhe Li3, Evan J.D. Anderson2, Julien Allaz4, Joseph R. Smyth5, Alan E. Koenig6, †,
Lijian Qi7, Yan Zhou7 and Markus B. Raschke2*
1
 College of Physics, Sichuan University, Chengdu, Sichuan, 610064, China; 2Department of Physics, Department of Chemistry, and JILA, University of Colorado,
Boulder, CO 80303, USA; 3Institute of Fundamental and Frontier Sciences, University of Electronic Science and Technology of China, Chengdu, Sichuan, 610054,
China; 4ETH Zürich, Department of Earth Sciences, Institute of Geochemistry and Petrology, Clausiusstrasse 25, 8092 Zurich, Switzerland; 5Department of Geological
Sciences, University of Colorado, Boulder, CO 80303, USA; 6United States Geological Survey, Geology, Geophysics, and Geochemistry Science Center, Lakewood,
Colorado, USA; and 7Laboratory of Gem and Technological Materials, Tongji University, Shanghai 200070, China

    Abstract
    Beryl from Xuebaoding, Sichuan Province, western China is known for its unusual tabular habit and W–Sn–Be paragenesis in a greisen-
    type deposit. The crystals are typically colourless transparent to pale blue, often with screw dislocations of hexagonal symmetry on the
    (0001) crystal faces. Combining electron microprobe analyses and laser ablation inductively coupled plasma mass spectrometry with
    single-crystal X-ray diffraction (XRD), correlated with Raman and micro-infrared (IR) spectroscopy and imaging, the crystal chemical
    characteristics are determined. The contents of Na+ (0.24–0.38 atoms per formula unit (apfu)) and Li+ up to 0.38 apfu are at the high
    end compared to beryl from other localities worldwide. Li+ substitution for Be2+ on the tetrahedral (T2) site is predominantly charge
    balanced by Na+ on the smaller channel (C2) site, with Na+ ranging from 91.5% to 99.7% (apfu) of the sum of all other alkali elements.
    Cs+ and minor Rb+ and K+ primarily charge balance the minor M 2+ substitution for Al3+ at the A site; all iron at the A site is suggested
    to be trivalent. The a axis ranges from 9.2161(2) to 9.2171(4) Å, with unit-cell volume from 678.03(3) to 678.48(7) Å3. The c/a ratio of
    1.0002–1.0005 is characteristic for T2-type beryl with unit-cell parameters controlled primarily by Be2+ substitution. Transmission
    micro-IR vibrational spectroscopy and imaging identifies coordination of one or two water molecules to Na+ (type IIs and type IId,
    respectively) as well as alkali free water (type I). Based on IR absorption cross section and XRD a C1 site water content of 0.4–
    0.5 apfu is derived, i.e. close to 50% site occupancy. Secondary crystal phases with a decrease in Fe and Mg, yet increase in Na, suggest
    early crystallisation of aquamarine, with goshenite being late. With similar crystal chemistry to beryl of columnar habit from other local-
    ities worldwide, the tabular habit of Xuebaoding beryl seems to be unrelated to chemical composition and alkali content.

Keywords: beryl, Xuebaoding, crystal chemistry, tabular habit, crystal water, infrared spectroscopy
(Received 3 December 2020; accepted 31 January 2021; Accepted Manuscript published online: 3 February 2021; Associate Editor:
Ferdinando Bosi)

Introduction                                                                                  Al3+ (A site) in planes parallel to (0001) (Aurisicchio et al., 1988,
                                                                                              1994; Černý, 2002; Groat et al., 2008). The rings form channels
Background
                                                                                              parallel to the crystallographic c axis, which in natural beryl typ-
Beryl as the most common beryllium mineral is of important                                    ically contain variable amounts of primarily alkali cations and
geochemical significance in different geological contexts. Ideally                            neutral molecules of water, CO2 and CH4 (Ginzburg, 1955;
Be3Al2Si6O18, beryl is a cyclosilicate mineral of hexagonal crystal                           Wood and Nassau, 1968; Hawthorne and Černý, 1977; Aines
structure. Six-membered rings of Si tetrahedra are linked by tetra-                           and Rossman, 1984; Artioli et al., 1993; Charoy et al., 1996;
hedrally coordinated Be2+ (T2 site) and octahedrally coordinated                              Pankrath and Langer, 2002; Gatta et al., 2006; Groat et al.,
                                                                                              2008; Fridrichová et al., 2016). The accommodation of monova-
§
                                                                                              lent alkali cations on the two channel vacancy sites charge bal-
 Present address: Institute of Regulatory Science for Medical Devices, Sichuan University,
Chengdu, Sichuan, 610064, China
                                                                                              ances the substitution of divalent or trivalent cations (e.g. Mg2+,
†
  Present address: Applied Spectra, Inc., West Sacramento, CA 95605, USA                      Fe2+/3+ or Mn2+) for Al3+ at the A site, or the substitution of pri-
*Author for correspondence: Markus B. Raschke, Email: markus.raschke@colorado.edu             marily Li+ for Be2+ at the T2 site (Folinsbee, 1941; Wood and
Cite this article: Wang P., Gray T.P., Li Z., Anderson E.J.D., Allaz J., Smyth J.R., Koenig   Nassau, 1968; Bakakin et al., 1969; Hawthorne and Černý,
A.E., Qi L., Zhou Y. and Raschke M.B. (2021) Mineralogical classification and crystal
                                                                                              1977; Aurisicchio et al., 1988). The smaller alkali Na+ occupies
water characterisation of beryl from the W–Sn–Be occurrence of Xuebaoding, Sichuan
province, western China. Mineralogical Magazine 85, 172–188. https://doi.org/10.1180/         the narrower channel site (C2/2b), while the larger K+, Cs+ or
mgm.2021.13                                                                                   Rb+ as well as H2O and CO2 prefer the wider channel site (C1/
© The Author(s), 2021. Published by Cambridge University Press on behalf of The Mineralogical Society of Great Britain and Ireland. This is an Open Access article, distributed under
the terms of the Creative Commons Attribution licence (http://creativecommons.org/licenses/by/4.0/), which permits unrestricted re-use, distribution, and reproduction in any medium,
provided the original work is properly cited.
Mineralogical Magazine 173
2a) (Aurisicchio et al., 1994; Łodziński et al., 2005; Fukuda and However, Xuebaoding mountain itself is 5.3 km to the NW of
Shinoda, 2008). Pure beryl is colourless (var. goshenite), whereas the locality, and not visible from the locality, separated by several
different substitutions give rise to distinct colours of blue high ridges and the mountain Sigenxiangfeng (5,360 m). Instead,
(var. aquamarine, Fe), green (var. emerald, Cr/V), yellow (var. the peak visible to the immediate NW (Fig. 1a, top left), is Little
heliodor, Fe) or pink (var. morganite, Mn) (Lum et al., 2016; Xuebaoding (5,443 m) and situated above the valley to the western
Tempesta et al., 2020). terminus of the locality area. The confusion between the two
Following early ultraviolet (UV), visible, and IR spectroscopy peaks, including confusion about first ascents of these mountains
(Wood and Nassau, 1967, 1968), the lattice position, molecular persisted well into the 1980s, and until today by the local popula-
orientation, bonding state and dynamic behaviour of water in nat- tion, as a reflection of the complex topography and extreme rela-
ural and synthetic beryl, and at variable temperatures, have been tive relief of up to 4000 m between the valley floors and adjacent
characterised spectroscopically (Kim et al., 1995; Charoy et al., peaks, with many of similar altitude.
1996; Kolesov and Geiger, 2000; Łodziński et al., 2005; Fukuda Tectonically, the area is situated in the Songpan–Ganzi oro-
and Shinoda, 2008, 2011). Based on these studies, water on the genic belt to the west of the Sichuan Province, near the contact
C1/2a sites has been defined as type I or type II with a molecular with the Qinling orogenic belt (north) and the western Yangtze
dipole moment orientated perpendicular or parallel with respect block (east and south-east) (Fig. 1b). The Songpan–Ganzi oro-
to the c axis, respectively. In addition the preference for each genic belt is the result of two stages of tectonic movements.
type is controlled by the channel alkali content. Following the late Indochina tectonic epoch with long-term intra-
continental convergence and associated series of magmatic and
metamorphic events, the subsequent Himalayan movement start-
Xuebaoding beryl
ing at ∼80 Ma resulted in a pronounced twist in the Songpan–
One notable occurrence of beryl is the Xuebaoding greisen-type Ganzi orogenic belt (Xu et al., 1992; Kirby and Ouimet, 2011).
W–Sn–Be deposit in the Songpan–Ganzi (or Songpan–Garzê) Along the Minshan (or Min Mountains) the active fault system
orogenic belt in Sichuan Province, western China (Zhang et al., of the N–S trending Huya fault, a steeply west-dipping reverse
2014). Explored since the 1950s, the occurrence is known for fault, contributes to the ongoing uplift of the Minshan. The
scheelite, cassiterite and beryl of exceptional size and gem quality, Huya fault separates Precambrian basement and overlying late
with quartz, fluorite and minor apatite formed in a post- Proterozoic to Permian rock units to its east, from the Triassic
magmatic hydrothermal process (Lin et al., 2000; Zhou et al., Songpan–Ganzi flysch sequences to its west (Kirby and Ouimet,
2002; Liu et al., 2005). The abundant beryl is typically transparent 2011). The numerous intruded granites in the eastern margin of
and colourless to pale blue. In contrast to the common columnar the Tibetan plateau have been dated at 220 to 188 Ma (Roger
prismatic habit of beryl parallel to the c axis, Xuebaoding beryl is et al., 2004, 2010; Xiao et al., 2007).
primarily of tabular habit parallel to the basal pinacoid.
Even though a range of studies have addressed the gemmology
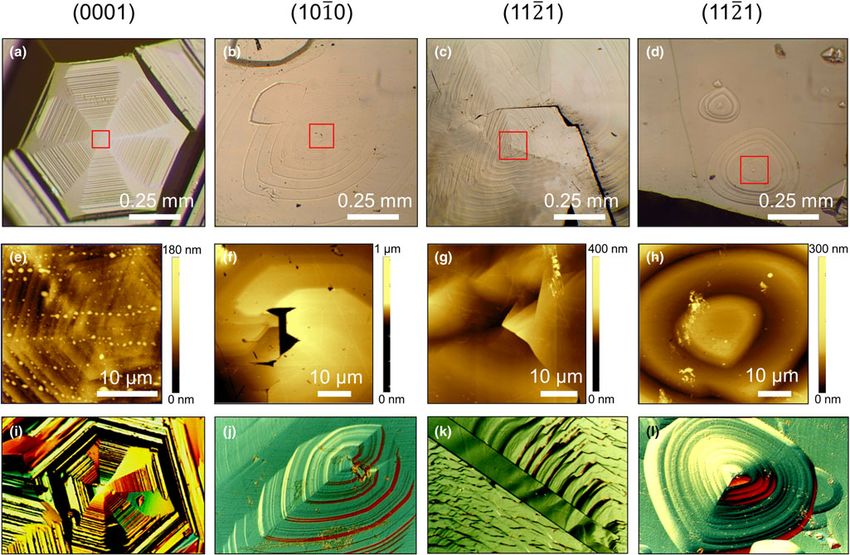
Geology of the Xuebaoding deposit
(Qi et al., 2001a, b, c, d) and mineralogy of beryl from
Xuebaoding over more than two decades (Guo et al., 2000a, b; The Xuebaoding mineralisation is associated with several
Lin et al., 2000; Ye et al., 2001; Zhou et al., 2002; Liu et al., Mesozoic leucogranite intrusions, of a few 100 m to 1 km in
2007, 2012), its crystal chemistry has not yet been well established extent in outcrop (e.g. Pankou, Pukou and Wuzhutang), of similar
with several analytical results either inconclusive or in part spatial separation, and dated at 201–194 Ma (Fig. 1c) (Ye et al.,
contradictory, leading to a confusing picture even about elemen- 2001; Zhou et al., 2002; Cao et al., 2004; Jiang et al., 2007; Li
tary questions of composition and structure. Further, contrasting et al., 2007). Whether these different outcrops are of a single
hypotheses were proposed, with crystal growth controlled by intrusion, or represent separate intrusions, and their relationship
defects and dislocations (Qi et al., 2001b) or by high alkali con- is yet unknown. However, their similarities in rock type and
tent at the Be and channel sites (Liu et al., 2012) being responsible associated mineralisation suggests at least a close magmatic
for the tabular habit. relationship.
The granites intruded into the upper Triassic Zhuwo series of
deep-marine sedimentation origin, accompanied by slate, schist
This work
and marble lenticules, as well as layers of marble of shallow meta-
The goal of this work is a systematic chemical, including trace morphism of late Indosinian orogeny to early Yanshan age (Zhou
element, and structural classification of beryl from Xuebaoding et al., 2002; Cao et al., 2004; Ottens, 2005; Li et al., 2007). The
including comparison with beryl from other localities, notably sequence of layers of sericite, quartz and carbonaceous schist,
of comparable tabular habit. Further, water in its different struc- mudstone, marble and local skarn, are overturned, with shallow
tural states and its vibrational response are quantified by correlat- dip to the west, yet steeply dipping to the east of the granite con-
ing single-crystal X-ray diffraction with Raman and IR tacts (Fig. 1c).
micro-spectroscopy and imaging.
Mineral assemblage
Geographic and geological setting
The Xuebaoding locality is a globally significant occurrence of
The sample localities are generally referred to as Xuebaoding scheelite and cassiterite, in combination with beryl, all of
(Sichuan Province, China) situated northwest of the Longmen unusually large size, gem colour, and crystal quality. It is a
Shan range, at the eastern margin of the Tibetan plateau, at eleva- greisen-type deposit of quartz and muscovite. Albeit locally vari-
tions of 3900–4200 m. The locality is named after the mountain able in relative distribution, the joint mineralisation of scheelite,
Xuebaoding (‘Snow Treasure Crown’, Tibetan name: Shar Dung cassiterite and beryl suggests that it is derived from a highly frac-
Ri, elevation 5,588 m), the highest peak of the Minshan range. tionated and evolved magma in the apical section of the granitic
174                                                                                                                                                                  Ping Wang et al.

Fig. 1. (a) Xuebaoding locality, with Little Xuebaoding (5,443 m, left) in the background. Mineralised zones along a nearly horizontal marble band (white mine
tailings) and in schist, along and below both sides of ridge to the right (mining camp at bottom right). (b) Generalised geological map of eastern margin of
Tibetan plateau with Xuebaoding (XBD) mountain west of the Huya fault and to NE of the Longmen Shan range and uplift zone defined by Yingxiu–Beichuan
(Y-B) and Wenchuan–Maoxian (W-M) faults; major peaks of Siguniangshan (4G) and Xuebaoding (XBD) indicated (modified with permission after Kirby and
Ouimet, 2011). (c) Geological map of the main locality area (pink rectangle in (b)) associated with granite body outcrops Pankou and Caodi (defining the cirques
in (a)) and Pukoupo. Legend: 1: normal fault, 2: highly mineralised quartz vein containing beryl, scheelite and cassiterite, 3: overturned dip and strike (modified
after Zhou et al., 2002). Rock units: Tzh1-(1–4) quartz schist, marble, biotite-quartz schist; Tzh1–5 ore-bearing strata, marble; Tzh1-(6–8) calcareous quartz schist, sericite
quartz schist; γA-C granite margin through transition to core zone. The W–Sn–Be mineralisation is concentrated throughout schist and marble within
Mineralogical Magazine                                                                                                                            175

                                                                                                     Fig. 2. Examples of representative Xuebaoding
                                                                                                     beryl habits: (a) cluster of tabular beryl on mus-
                                                                                                     covite matrix (largest crystal 25 mm wide); (b)
                                                                                                     individual clear tabular crystal (40 mm wide); (c)
                                                                                                     rare columnar habit (on albite, 25 mm wide),
                                                                                                     light blue, with typical dislocation texture on
                                                                                                     (0001); (d) schematic of tabular habit.

Zhou et al., 2002; Liu et al., 2012; Zhang et al., 2012), only limited   tetrahedral Be2+ site together with divalent cation substitution
field studies have been undertaken and the ore-forming processes         for Al3+ with associated charge balancing by other alkali on the
and source of the fluid are not yet clear. Further, despite several      vacancy site (Liu et al., 2012). The high alkali content (0.255–
ages reported for granite and mineralisation, some are inconsist-        0.327 apfu, not including Li+) was hypothesised to be responsible
ent, and it is unknown if they reflect the date of mineral               for the tabular crystal growth (Liu et al., 2012). In contrast, a
formation.                                                               detailed analysis of surface defects on different crystal phases in
    Xuebaoding beryl is mostly colourless, transparent and rarely        combination with a growth rate model as a function of supersat-
with a hint of blue. It typically exhibits a simple morphology,          uration (Qi et al., 2001b) suggested interstitial deformation and
yet of characteristic tabular habit shortened in the c direction,        dislocation sliding responsible for the different growth rate of
with the most common basal pinacoid (0001), prisms (1010)               basal vs. prismatic crystal faces giving rise to the tabular morph-
and (1121) faces as shown in Fig. 2. The habit is rarely columnar,      ology (Zhang et al., 2012).
and if so has a low aspect ratio (Fig. 2c).                                  Several fluid-inclusion studies have been performed for quartz,
    Numerous studies covering a wide range of techniques have            beryl and scheelite identifying homogenisation temperatures cover-
addressed selected aspects of the crystal chemistry of beryl from        ing a wide range of 214–288°C (Cao et al., 2002), 158–310°C (Zhou
Xuebaoding (Guo et al., 2000a; Qi et al., 2001b; Cao et al., 2002;       et al., 2002), 250–292°C (Chen et al., 2002), 265–315°C (Lin et al.,
Zhou et al., 2002; Liu et al., 2012; Zhang et al., 2012).                2000), 188–373°C (Zhang et al., 2012) and 266–389°C (Liu et al.,
Specifically, several studies using bulk chemical analysis, electron     2005), suggesting a shallow hydrothermal quartz vein type system.
microprobe analysis (EPMA), and laser ablation inductively               These works imply a volatile-rich pneumatolytic–hydrothermal
coupled plasma mass spectrometry (LA-ICP-MS) identified enrich-          solution derived from post-magmatic fluid as a source of the
ment in Na+ (Na2O = 0.035–1.66 wt.%) and Li+ (Li2O = 0.63–3.04           mineralisation (Cao et al., 2002; Zhou et al., 2002). Related work
wt.%) with variable amounts of Cs+ (Cs2O = 0.11–0.92 wt.%), and          suggests a temperature range of 250–292°C, at high pressures
minor K+ (K2O = 0.01–1.13 wt.%), Mg2+ (MgO = 0.03–0.13 wt.%),            (∼86 MPa) with high CO2 density (0.662 g/cm3), and low salinity
Ca2+ (CaO = 0.01–0.88 wt.%) and Fe3+ (FeOT = 0.06–0.54 wt.%)             (6.191 wt.% NaCl) during the formation of beryl (Chen et al.,
(Liu et al., 2001b, 2005, 2012; Qi et al., 2001b; Zhou et al., 2002;     2002). This is consistent with more recent work (Zhang et al.,
literature data summarised in Supplementary Table S1). While             2012) suggesting a temperature of beryl formation of ∼300°C.
some analyses are inconsistent, they confirm the trend that defines
Xuebaoding beryl as a lithium–sodium or ‘tetrahedron’ beryl
                                                                         Material and analytical methods
(Aurisicchio et al., 1988, 1994)
    A comprehensive EMPA of beryl, whole rock analysis of gra-           For this study selected single crystals and rock-forming beryl were
nite, and fluid inclusion study suggested a post-magmatic                chosen from different veins and collected in situ. The rock-forming
pneumatolytic–hydrothermal solution as the source of the beryl           sample hosted in quartz schist Tzh1-(1–4) has been extracted from
mineralisation (Zhou et al., 2002). An X-ray fluorescence and            an active mine on the east side of Pankou (thin section 1702B2,
LA-ICP-MS trace-element analysis, in combination with XRD,               for details see Supplementary Fig. S1). Further, from clefts in
and surface textural features, identified Li+ substitution at the        veins hosted in marble Tzh1–5 small single crystals of 0.5–1.5 cm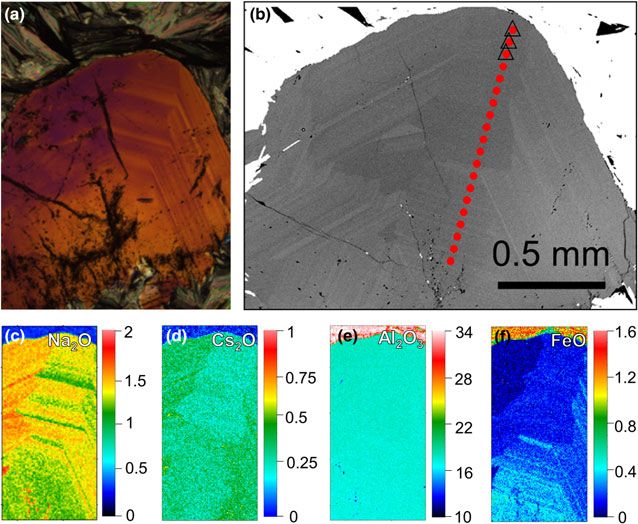
176                                                                                                                                                          Ping Wang et al.

Fig. 3. Beryl samples as cut and studied from larger single crystal specimens: (a) #Q7, (0001) faces; (b) #Q6, (1121) faces; and (c) #Q3, (1010) faces. Indicated are
positions of LA-ICP-MS transects (white arrows, Fig. 7), BSE imaging (white rectangles, Fig. 7), micro-IR transects and mapping (red dashed line and rectangles, Figs.
10–12), XRD (chips cut at dashed green triangles) and EMPA (blue dots).

in size were obtained and cut into thin sections, with two samples                          (29Si) was used as the internal standard element (using an average
cut parallel and four perpendicular with respect to the c axis                              Si wt.% content from EMPA data) for concentration calculations
(1901B1 and 1901B2, for details see Fig. S1). Lastly several single                         (Pauly, 2019).
crystals were collected from open space in veins in the northern                                For X-ray diffraction and structure refinement, fragments were
area of Pankou (#Q1–Q7, see Fig. S1). The different crystal faces                           cut from crystals #Q3, #Q6 and #Q7. Single-crystal X-ray diffrac-
were first studied by atomic force microscopy (AFM, AIST Inc.,                              tion data were acquired on a Brucker P4 four-circle diffractometer
noncontact mode, probe tips from μMasch Inc., spatial resolution                            (University of Colorado, USA) equipped with a point detector, an
∼10 nm and sample scanner resolution 2 nm), prior the prepar-                               APEX II CCD detector, and a rotating Mo-anode generator oper-
ation of slabs of 2–3 mm thickness for EMPA cut along different                             ating at 50 kV and 250 mA. Unit-cell parameters were refined
crystallographic directions perpendicular to (0001), (1010) and                            using the point-detector. The program SHELXL-97 (Sheldrick,
(1121) (#Q7, #Q3 and #Q6), as shown in Fig. 3. Subsequently                                2008) was used to analyse the site occupancies.
for IR transmission spectroscopy and imaging, the samples were                                  Micro-Raman spectroscopy on polished sections and oriented
thinned to ∼0.1 mm double sided polished slabs.                                             crystals was performed on a setup (XploRA Nano, Horiba Jobin
    Micro-scale compositional mapping and quantitative micro-                               Yvon) based on a confocal Raman microscope, using 532 nm
analyses were undertaken with a JEOL JXA-8230 electron micro-                               excitation, a 50× objective (NA = 0.5 and focus size ≈1 μm diam-
probe at the University of Colorado, USA (Department of                                     eter), with power on sample of ∼3 mW. Spectra are acquired using
Geological Sciences). It is a five-spectrometer instrument                                  a grating of 1800 grooves/mm providing for a spectral resolution
equipped with argon X-ray detectors (P-10 mixture) on spectrom-                             of 0.5 cm–1, with a thermoelectrically cooled CCD camera. The
eter 1 and 2, and xenon X-ray detectors on spectrometers 3 to                               phonon response of silicon at 520.7 cm–1 was used to calibrate
5. Analytical conditions were 15 kV and 20 nA with a 5 μm                                   the spectrometer.
beam diameter (samples XBD 19-01-B1 and 17-02-B2).                                              Unpolarised micro-IR spectroscopy and imaging was per-
Background positions were chosen to avoid interferences. In                                 formed in transmission, reflection and attenuated-total reflection
order to improve precision, a few additional analyses were per-                             mode (FTIR microscope LUMOS, Bruker Inc.). Background
formed at 50 nA and 10 μm beam diameter (samples #Q7, #Q6                                   spectra were recorded before the sample measurements in air
and #Q3). The mean atomic number background correlation                                     and subtracted to obtain absorbance spectra of the samples.
was used for all analyses (Donovan et al., 2016). Counting time                             Measurements were performed in transmission on the double-
was optimised to improve the detection limit. The ZAF matrix                                sided polished crystal slabs of 120 μm thickness or less, with
correction from Armstrong (1988) using the FFAST mass absorp-                               50 μm spatial resolution, and 2 cm–1 spectral resolution from
tion coefficient table (Chantler et al., 2005) was applied through-                         800 cm–1 to 6000 cm–1. Point spectra, line scans and images
out. Typical detection limits are ∼0.01 wt.% for main and minor                             were acquired after EMPA and LA-ICP-MS and in areas of
elements.                                                                                   close proximity to correlate the CO2 and H2O IR spectra with
    Minor and trace elements were measured by LA-ICP-MS at                                  the elemental crystal composition. For infrared peak frequencies
the USGS Denver Federal Center, USA. Three beryl crystals                                   and mode assignment see Table S2.
with representative primary and secondary crystal phases based
on the EMPA were selected. A Photon Machines Analyte G2
LA system (193 nm and 4 ns excimer) was coupled to a                                        Results
PerkinElmer DRC-e ICP-MS. Spot-lined analyses were carried
                                                                                            Surface texture
out for known locations, crossing the primary and secondary
phase zones. A wavelength of 193 nm was used. Ablation was car-                             Optical microscopy and AFM were used to study the beryl surface
ried out using an 80-μm square spot size at 12 J/cm2. Single spot                           texture, notably of the (0001), (1010) and (1121) crystal faces. As
analyses were ablated using 15 pulses/sec (15 Hz). Signals were                             established previously (Qi et al., 2001b), the (0001) face shows hex-
calibrated using USGS synthetic basalt glass GSE-1g. Silicon                                agonal protrusions representing screw dislocations (Fig. 4a, e).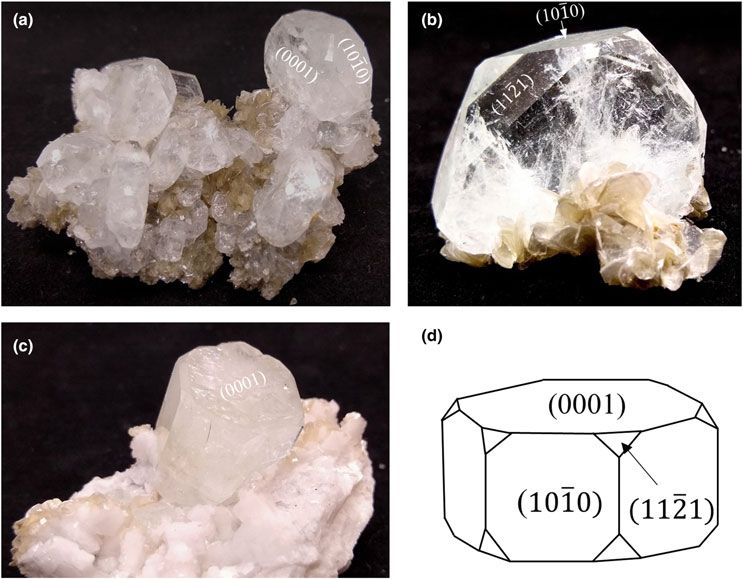
Mineralogical Magazine                                                                                                                                                    177

Fig. 4. Surface texture of different crystal faces of Xuebaoding beryl. (a–d) Unpolarised optical microscope images of #Q7, #Q3, #Q6 and #Q5, respectively. (e-f) AFM
images of areas indicated in (a–d) (red square). (i–l) Differential interference microscope images of similar defects on corresponding faces [modified after Qi et al.,
2001a]. (a, e, i) are (0001) faces, (b, f, j) are (1010) faces, and (c, d, g, h, k, l) are (11
                                                                                               21) faces.

Most of the hexagonal screw dislocations in (0001) display finely                           fluorescence). The beryl exhibits complex zoning as seen in the
spaced growth steps. The (1010) faces are dominated by                                     example of Fig. 5c (corresponding back-scattered electron (BSE)
left-handed or right-handed screw dislocations of nearly rhombo-                            image Fig. 5d). Quantitative compositional element mapping of
hedral shape with long axis approximately parallel with respect to                          Al, Na, Fe and Cs (Fig. 5e–h, in oxide wt.%) indicates the negative
(0001) (Fig. 4b, f). The screw dislocations grow from the nucle-                            correlation of Al and Fe, representing the substitution of Al3+ for
ation site in spirals outwards (Qi et al., 2001b). The lower density                        M 2+/3+ cations, and the corresponding positive correlation of Al3+
of the screw steps and kinks on (1010) compared to (0001) indi-                            with Na+ and Cs+ for charge balance.
cates a more rapid crystal growth in the (1010) lattice plane com-                             Results of EMPA of seven representative zones averaged over
pared to (0001) leading to the tabular crystal habit (Qi et al.,                            three points of 1702B2 (for details see Fig. 5 and 6: low Na+, cir-
2001b). In some (1121) lattice planes of beryl (Fig. 4c, g), the stack-                    cles; high Na+, squares; intermediate Na+, triangle), as well as ana-
ing fault defects grow layer-by-layer, until they cover the entire                          lyses of samples 1901B and #Q7 (see analysis points in Figs S2,
crystal face. Eventually, a step source that no longer disappears is                        S3) are summarised in Table 1 and cover the range of compos-
formed at the protrusion of the stacking fault. The stacking fault                          itional variations observed. SiO2 values range from 64.22 to
also acts as the nucleus of the contract twin (Fig. 4k) (Qi et al.,                         65.04 wt.% (ideal 67.07 wt.%) and Al2O3 values range from
2001b). Occasionally, dispersed heart-shaped step bunching is                               17.81 to 18.55 wt.% (ideal 18.97 wt.%). Of the minor elements,
observed. The dislocation step spirals outwards from the protru-                            Na2O dominates, ranging from 1.23 wt.% up to 2.01 wt.% and
sion and forms a closed spiral (Fig. 4d, h). A detailed future                              Cs2O up to 0.49 wt.%. Iron as FeOT (total Fe reported as FeO)
study of defects, dislocations and other structural bulk and surface                        ranges up to 0.50 wt.%, and MgO up to 0.19 wt.%. Traces of
features may possibly relate these features to crystal morphology                           K+, Ca2+, Ti4+ and Mn2+ are close to the detection limit of
and growth environment (Sunagawa, 1984; Scandale et al., 1990;                              ∼0.01 wt.%.
Scandale and Lucchesi, 2000; Tempesta et al., 2011).                                            The EMPA calculations (Table 1) are based on 18 O apfu and
                                                                                            3 [Be + Li]. LA-ICP-MS revealed a close correlation between Li+
                                                                                            and Na+, allowing for the use of Na+ as a proxy for Li+ to a
Chemical composition
                                                                                            good approximation. Be2+ is thus assumed to be 3 – Li+. For com-
Figure 5 shows optical and EMPA of the narrow vein (thin section                            parison, calculations on the basis of either 18 O and 3 Be, or 6 Si
1702B2) containing scheelite at the schist contact and beryl in                             are shown in Table S3 and S4, respectively (Groat et al., 2008;
muscovite (Fig. 5a plain light, Fig. 5b UV with scheelite grain                             Fridrichová et al., 2016; Lum et al., 2016).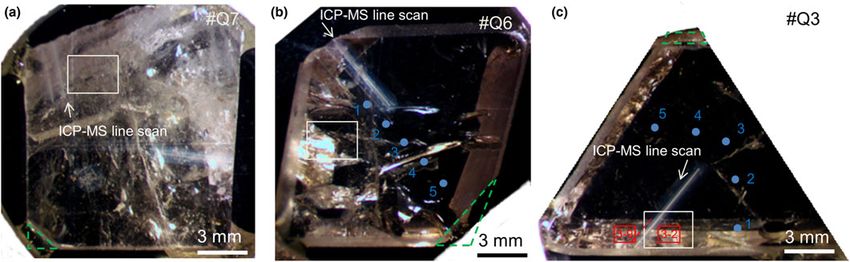
178 Ping Wang et al.
Fig. 5. Narrow vein of muscovite in schist with scheelite and beryl (thin section 1702B2): (a) plane light; (b) UV light; (c) beryl under crossed polarised light (red area
from a); (d) corresponding BSE image. Quantitative EMPA mapping (scale bar oxide wt.%) of Al2O3 (e), Na2O (f), FeO (g) and Cs2O (h) of yellow region indicated in (c)
with zoning and coupled substitution. Data for EMP point analyses (open circles and squares in (f)) in Table 1. For BSE and EMPA data of second area (green
rectangles in (a) and (b)) see Fig. 6.
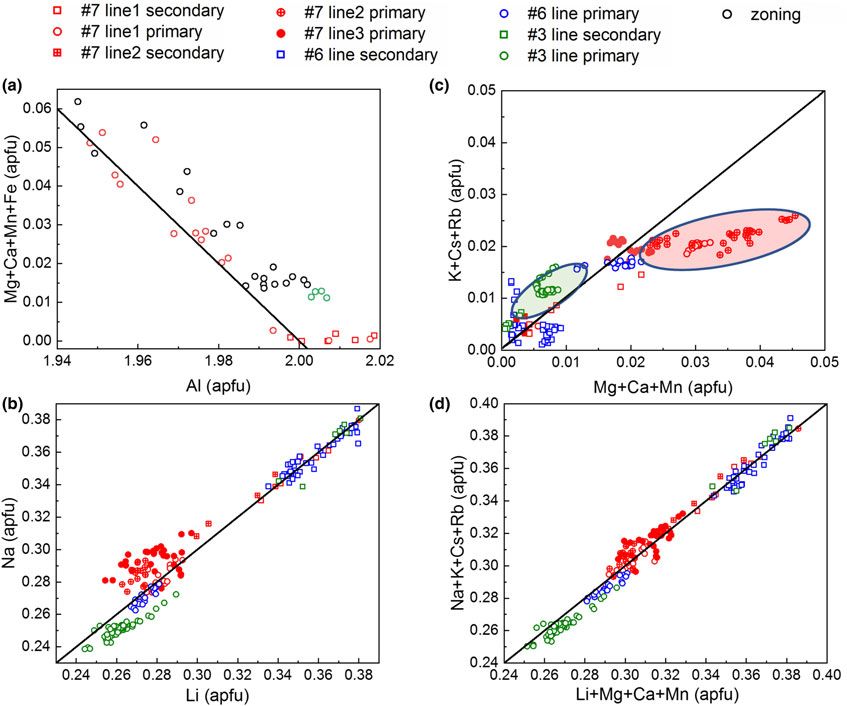
With Si4+ ranging from 5.978 to 5.994 apfu this indicates were refined from centring angles of 60 strong reflections with
almost full 6 Si T1 site occupation without Si–Al substitution. two between 10 and 28° using a point detector system on a
Na+ ranges from 0.20 to 0.36 apfu, which is much higher than Bruker P4 diffractometer. The a-axis values of the lattice range
Mg2+ (up to 0.027), K+ (0.001–0.004), Cs+ (0.004–0.019), Ca2+ from 9.2161(2) to 9.2171(4) Å, while c-axis values range from
(
Mineralogical Magazine                                                                                                                             179

                                                                                      Fig. 6. Concentric zoning of beryl of thin section sample 1702B2
                                                                                      (green rectangle in Fig. 5a and 5b). (a) Optical microscope
                                                                                      image under crossed polarisation; and (b) BSE image with EMPA
                                                                                      transect (red dots), triangles indicate the selected EMPA points
                                                                                      listed in Table 1. (c–f) Quantitative mapping of selected area for
                                                                                      Na2O, Cs2O, Al2O3 and FeO, respectively (scale bar oxide wt.%).

    Generally similar site occupancy values for the different lattice   combination of Fig. 9b and 9f confirm the expected molecular
sites are found for all three crystals analysed. The A, T1 and T2       orientation of type I and type IIs water (Hagemann et al.,
sites are almost fully occupied. The site population calculation        1990). Type I is expected to be more polarisable along the c
is in good agreement with the EMPA and LA-ICP-MS data                   axis, and thus stronger in Fig. 9b, while type II is expected to
with a significant Li+ substitution for Be2+ (T2) and minor M 2+        be more polarisable perpendicular with respect to the c axis and
substitution for Al3+ (A), charge balanced predominantly by             thus stronger in the polarisation combination of Fig. 9f, as
Na+ as the only alkali occupying the small C2 site, and the larger      observed. Polarised Raman spectra with the incident wave vector
alkali (K+, Cs+, Rb+) and Fe2+/3+ together with water and minor         perpendicular with respect to the (1010) face and unpolarised
CO2 on the C1 site.                                                     Raman spectra are shown in Fig. S4.

Raman spectroscopy                                                      Micro-IR spectroscopy and mapping of water content
Representative polarisation-resolved Raman spectra, reflecting the      A representative IR point spectrum is shown in Fig. 10 from (a)
different crystal orientations and type I and II water orientation,     transect #Q3-7 and (b) acquired parallel with respect to the
are shown in Fig. 9. Here, Einc and ER represent incident funda-        LA-ICP-MS line on #Q3 in Fig. 7 (see also inset Fig. 10b).
mental pump polarisation and Raman scattered polarisation,              Infrared peak frequencies and mode assignments are listed in
respectively. All spectra of different sample locations have negli-     Table S2 (Charoy et al., 1996; Qi et al., 2001d; Łodziński et al.,
gible background indicating high structural integrity and overall       2005; Adamo et al., 2008; Della Ventura et al., 2015;
low defect/inclusion density. The peaks below 1400 cm–1 are asso-       Mashkovtsev et al., 2016). The spectrally narrow bending
ciated with beryl lattice phonon modes (For Raman peak frequen-         (nI2 ) and asymmetric stretch (nI3 ) of type I (1600 and 3694 cm–1),
cies and mode assignment see Table S6 (Kim et al., 1995; Qi et al.,     bending (nIIs2 ) and symmetric stretch (n1 ) of type IIs water
                                                                                                                       IIs

2001b). The strong peaks at 685 cm–1 and 1066 cm–1 are due to           (1637 and 3588 cm–1), and asymmetric CO2 stretch (2358 cm–1)
Si–O vibrations. The modes at 322 cm–1 and 396 cm–1 are Al–O            modes can be discerned. The broad peak at ∼1950 cm–1 has
bands. The two bands at 524 cm–1 and 1009 cm–1 represent Be–            been assigned to the overtone absorption of a lattice phonon
O vibrations. In the water stretch region the two and only partially    mode (Charoy et al., 1996). The detailed transects for the type I
resolved peaks are due to type II (3594 cm–1) and type I (3604 cm–1)    and II stretch modes in Fig. 10b show an inversion in relative
water.                                                                  type I and II water content at the transition from primary to sec-
    The non-degenerate symmetry modes (A1g) which have the              ondary beryl. Further, the type II peak is split as seen in the mag-
                                                                                                                                          –1
strongest Raman response are shown in Fig. 9a, b. The doubly            nified region of Fig. 10c, with the main peak nIIs  1 at ∼3588 cm
degenerate symmetry modes (E1g) are presented in Fig. 9c, d.            corresponding to type IIs, and the shoulder at ∼3605 cm–1 corre-
The Raman emission of water, polarised perpendicular with               sponding probably to a combination of the symmetric stretches
respect to the c axis of beryl, is weak when the incident field is      of type I (nI1 ) and type II water (nIId
                                                                                                               1 ). The minor peak at about
polarised parallel with respect to the c axis, as expected and          3651 cm–1 is due to the antisymmetric stretch of type IIs water
shown in Fig. 9d. Doubly degenerate symmetric modes E2 g are            (nIIs
                                                                           3 ).
presented in Fig. 9e, f, in which 398 cm–1 and 684 cm–1 are due              To determine relative peak intensities, the spectra have been
to Si–O and Al–O vibrations, respectively, and with a correspond-       fitted using simple Lorentzian lineshapes, with 5-6 peaks (dashed
ing water peak (Kim et al., 1995; Hagemann et al., 1990). The           lines in Fig. 10c, see also supplement Fig. S5), with centre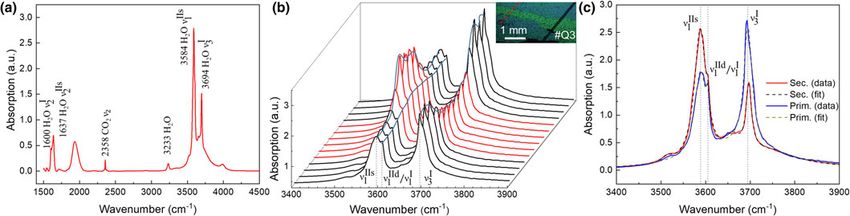
180 Ping Wang et al.
Table 1. Quantitative elements content obtained by EMPA for thin sections (TS) and single crystals (SC)*
Sample number #1702B2 #1702B2 #1702B2 #1901 #1901 #Q7 #Q7
TS TS TS TS TS SC SC
Wt.% oxide Ideal crystal Low-Na ○ High-Na □ Int.- Na △ High-Na ☆ Low-Na ◇ Low-Na High-Na
Na2O - 1.231 1.690 1.338 2.005 1.130 1.422 1.719
MgO - 0.193 0.026 0.025 0.033 0.064 0.179 0.001
K2O - 0.020 0.029 0.018 0.005 0.010 0.035 0.007
Cs2O - 0.416 0.481 0.315 0.152 0.389 0.486 0.093
CaO - 0.004 0.016 0.005 - 0.001 - -
TiO2 - 0.032 - 0.005 - 0.010 - 0.004
FeO - 0.495 0.067 0.139 0.013 0.235 0.170 -
MnO - 0.026 - 0.005 0.000 0.021 - -
SiO2 67.07 64.668 64.479 64.507 64.360 64.841 64.705 64.914
Al2O3 18.97 17.810 18.307 18.210 18.481 18.366 18.079 18.516
Li2Ocal 0.594 0.815 0.645 0.967 0.545 0.685 0.829
BeOcal 13.96 12.481 12.088 12.365 11.827 12.628 12.336 12.150
Total 100.00 97.969 97.999 97.578 97.843 98.243 98.098 98.234
apfu
Na - 0.221 0.304 0.241 0.361 0.202 0.255 0.307
Mg - 0.027 0.004 0.004 0.005 0.009 0.025 0.000
K - 0.002 0.003 0.002 0.001 0.001 0.004 0.001
Cs - 0.016 0.019 0.012 0.006 0.015 0.019 0.004
Ca - 0.000 0.002 0.001 0.000 0.000 - -
Ti - 0.002 0.000 0.000 0.000 0.001 - 0.000
Fe - 0.034 0.005 0.010 0.001 0.016 0.012 -
Mn - 0.002 - 0.000 0.000 0.002 0.000 -
Si 6 5.994 5.986 5.992 5.978 5.980 5.993 5.989
Al 2 1.945 2.003 1.993 2.023 1.996 1.973 2.013
Lifixed 0.221 0.304 0.241 0.361 0.202 0.255 0.307
Becal 3 2.779 2.696 2.759 2.639 2.798 2.745 2.693
*Every value represents the average of three analyses. The measured points for ○ and □ are shown in Fig. 5, △ is shown in Fig. 6, ☆ and ◇ are shown in Fig. S2. –: close or below the
detection limit.
Lifixed: Li set to the Na value based on correlation derived from LA-ICP-MS; ‘cal’: calculated value, Becal = 3 – Li.
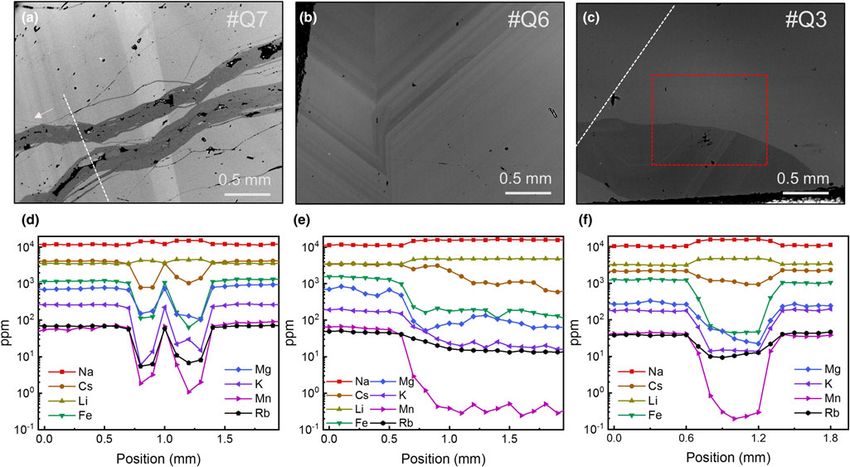
Fig. 7. Representative BSE images of single crystal samples #Q7 (a), #Q6 (b) and #Q3 (c), with LA-ICP-MS transects (d–f, dashed lines in (a) and (c)): transect (d)
location is ∼0.3 mm just left of field of view in (a) at extension of meandering secondary feature. Transect (e) is not related to (b) with location indicated in Fig. 3b.
Transect (f) shown in (c) as indicated, the full position is shown in inset of Fig. 10b. The LA-ICP-MS elemental pattern reflects primary and secondary beryl phases,
with characteristic positive correlation of Na and Li, both negatively correlated with all other trace elements. Area in (c) (red dashed rectangle) indicates micro-IR
mapping #Q3-2 as shown in Fig. 12.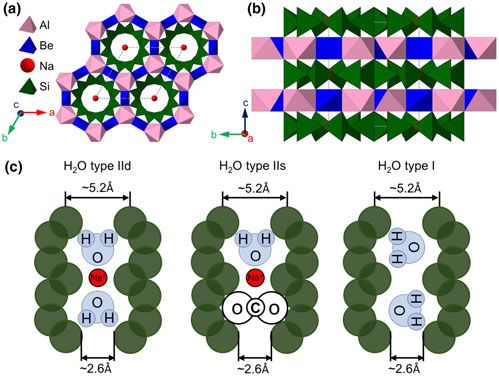
Mineralogical Magazine 181
Table 2. Representative minor- and trace-element composition of beryl determined by LA-ICP-MS.*
ppm #Q7-3 S #Q7-3 P #Q6-1 S #Q6-1 P #Q3-1 S #Q3-1 P
Li 4611.20 3498.59 4462.00 3433.05 4732.43 3264.07
Na 15,179.02 11,414.04 15,069.01 11,269.89 15,795.65 10,484.95
Mg 145.29 750.37 327.22 720.82 25.57 293.78
P 27.76 16.01 28.83 11.66 14.79 15.90
S 73.57 66.73 50.84 54.80 44.67 47.49
K 22.02 260.59 37.25 194.15 14.09 183.23
Ca 18.60 53.72 16.46 70.35 21.92 75.41
Ti 35.68 20.70 20.02 3.36 5.92 11.15
Mn 6.02 71.22 0.21 66.12 0.23 39.11
Fe 165.55 1157.46 40.43 1550.04 45.93 1167.36
Zn 6.74 54.53 1.17 49.13 13.28 58.39
Ga 11.82 29.84 15.52 14.90 29.69 10.88
Rb 10.92 67.63 11.16 49.83 11.96 37.98
Cs 1520.71 4019.28 870.63 3170.35 958.81 2080.47
Apfu
Li 0.3589 0.2723 0.3473 0.2672 0.3683 0.2540
Na 0.3566 0.2682 0.3540 0.2648 0.3711 0.2463
Mg 0.0032 0.0167 0.0073 0.0160 0.0006 0.0065
P 0.0005 0.0003 0.0005 0.0002 0.0003 0.0003
S 0.0012 0.0011 0.0009 0.0009 0.0008 0.0008
K 0.0003 0.0036 0.0005 0.0027 0.0002 0.0025
Ca 0.0003 0.0007 0.0002 0.0009 0.0003 0.0010
Ti 0.0004 0.0002 0.0002 0.0000 0.0001 0.0001
Mn 0.0001 0.0007 0.0000 0.0007 0.0000 0.0004
Fe 0.0016 0.0112 0.0004 0.0150 0.0004 0.0113
Zn 0.0001 0.0005 0.0000 0.0004 0.0001 0.0005
Ga 0.0001 0.0002 0.0001 0.0001 0.0002 0.0001
Rb 0.0001 0.0004 0.0001 0.0003 0.0001 0.0002
Cs 0.0062 0.0163 0.0035 0.0129 0.0039 0.0085
*S indicates the secondary phase of beryl while P indicates the primary phase.
Table 3. Crystal structure refinement parameters for beryl from Xuebaoding Table 4. Selected interatomic distances (Å) for beryl from Xubaoding in
(#Q7, #Q6, and #Q3) compared to reported data. comparison to reported data.
#Q7 #Q6 #Q3 Reported dataa #Q7 #Q6 #Q3 Reported dataa
a (Å) 9.2161(2)b 9.2162(2)b 9.2171(4)b 9.209(2) Be tetrahedron (T2)
c (Å) 9.2178(2)b 9.2182(2)b 9.2219(4)b 9.2221(9) Be–O2 (4) 1.6656(6) 1.6659(8) 1.6655(7) 1.6722(5)
V (Å3) 678.03(3) 678.08(3) 678.48(7) 677.4(2) Polyhedral volume (Å3) 2.0811 2.0825 2.0790 -
Space group P6/mcc P6/mcc P6/mcc P6/mcc Quadratic elongationb 1.0909 1.0908 1.0915 -
Z 2 2 2 2 Al octahedron (A)
Radiation MoKα MoKα MoKα MoKα Al–O2 (6) 1.9094(6) 1.9097(7) 1.9095(6) 1.9065(6)
2θ range (°) 0–80.77 0–80.59 0–80.76 5.1–49.98 Polyhedral volume (Å3) 9.0066 9.0111 9.0092 -
Reflections measured 41515 77872 77620 - Quadratic elongation 1.0202 1.0202 1.0202 -
Unique reflections 767 762 767 775 Si tetrahedron (T1)
R(σ) 0.0104 0.0099 0.0130 - Si–O1 1.6017(8) 1.6021(10) 1.6010(9) 1.5985(7)
Rint 0.0384 0.0350 0.0395 0.0352 Si–O1 1.6044(8) 1.6046(10) 1.6049(9) 1.6054(6)
R1 0.0249c 0.0268c 0.0295c 0.0371 Si–O2 (2) 1.6153(6) 1.6149(7) 1.6164(7) 1.6118(5)
Average Si–O 1.6092 1.6092 1.6097 1.6052
a
Guo et al. (2000). Polyhedral volume (Å3) 2.1337 2.1334 2.1359 -
b
Unit cell refinement obtained from point detector data. Quadratic elongation 1.0015 1.0016 1.0015 -
c
Using ionised atom scattering factors for cations (Cromer and Mann, 1968) and for O2–
Na channel (C2)
(Azavant and Lichanot, 1993).
Na–water (2) 2.3044(0) 2.3045(0) 2.3055(1) -
Na–O1 (6) 2.5561(10) 2.5547(12) 2.5577(11) 2.553(0)
Polyhedral volume (Å3) 26.078 26.050 26.1223 -
–1
frequencies of nIIs
1 and n3 of 3588 cm
I
and 3694 cm–1, respect- a
Guo et al. (2000); b
Robinson et al. (1971)
ively. The frequencies vary by less than ±1 cm–1 between primary
and secondary crystal phases.
The spatial variation of the relative IR peak absorption for type
I and IIs water and CO2 across the primary and secondary phase The corresponding absolute amount of water can be estimated
is shown in Fig. 11a. The increase in spectral intensity of nIIs 1 based on the Lambert–Beer law A = εcd, where A is the absorbance,
(orange) is observed in the secondary phase (1.0 to 1.7 mm), ε the molar absorption coefficient (L/mol⋅cm), c the water concen-
while n3 (brown) decreases. The mixed shoulder at ∼3605 cm–1
I
tration (mol/L), and d the sample thickness (cm) (Fukuda et al.,
(black) correlates with the nI3 intensity, suggesting that it is asso- 2009). In our case, the sample thickness of #Q3 is ∼120 μm. We
ciated primarily with nI1 . Additionally, the CO2 stretch (purple) use reported molar absorption coefficients of type I (3696 cm–1)
slightly decreases in the secondary phase. and type IIs (3588 cm–1) water modes of εI = 197 L/mol⋅cm182 Ping Wang et al.
of beryl calculated from XRD of ρ = 2.75 g/cm3, with its variation
with Na+ content negligible for our case, the amount of water
can be obtained as H2Otot (wt.%) = c×M×10–1/ρ where M is the
molar mass of water. An ideal and maximum 1 apfu water on C1
corresponds to 3.24 wt.% for an ideal beryl with M = 537.47 g/mol
(Hawthorne and Černý, 1977; Pankrath and Langer, 2002).
The resulting apfu values based on the Lambert–Beer law for
nIIs
1 and n3 from Fig. 11a and their sum are shown in Fig. 11b.
I
Type IIs water (orange) increases from 0.20 apfu in the primary
phase to 0.38 apfu in the secondary phase, correlates positively
with Na+ (red), and correlates negatively with Fe3+ (green) based
on the co-localised LA-ICP-MS transect. Meanwhile, type I water
(brown) decreases from 0.21 apfu in the primary phase to 0.12 apfu
in the secondary phase. It appears that the ∼50% decrease of type
I water in the secondary zone is more than compensated by a
corresponding increase in type IIs water, with the total water con-
tent (nIIs
1 + n3 ) (blue) increasing from 0.42 apfu in the primary
I
Fig. 8. Crystal structure of beryl. (a) Along orientation parallel with respect to the c phase to 0.50 apfu in secondary beryl.
axis; (b) perpendicular with respect to the c axis, with octahedral A (Al), tetrahedral The amount of water of 0.42 apfu determined for the primary
T2 (Be), Si, and two channel sites at the C1/2a (H2O, large alkali) and C2/2b (Na) posi- phase by IR absorption is in good agreement with the value of
tions; and (c) type IId, type IIs and type I H2O molecule configuration, with corre- 0.40 apfu derived from XRD (Table 5). The XRD result further
sponding Na+ and CO2 positions on channel sites (after Fridrichová et al., 2016).
suggests that the C1 site is almost half occupied with a combin-
ation of the trace amounts of alkali K+, Cs+ and Rb+, together
(Charoy et al., 1996), and εIIs = 256 L/mol⋅cm, respectively with water (see Table 5). The approximately equal total amount
(Goldman et al., 1977). Though the value for εIIs is for cordierite, of water in primary and secondary beryl is interesting to note,
we expect it to equally apply for beryl to a good approximation with primarily a change in ratio of type I to type II water, which
given the similarity in water structure and index of refraction in is controlled by the different Na+ content (occupying the C2 site).
the IR. Absorption peak intensity A for each mode is approximated Corresponding spatial images are shown in Fig. 12 of type I
by the ratio of fitted peak area and line width. Using a density value water (a, d), type II water (b, e) and CO2 (c, f) peak integrated
Fig. 9. Polarised Raman spectra of beryl. (a,b) k ⊥ c axis and Einc //
c axis and ER // c axis, (c,d) k ⊥ c axis and Einc // c axis and ER ⊥ c
axis, (e,f) k ⊥ c axis and Einc ⊥ c axis and ER ⊥ c axis. k is the inci-
dent wave-vector, Einc and ER are the polarisation directions of the
fundamental and Raman light, respectively. The crystallographic z
axis is parallel to optical c axis. A1 g indicates the non-degenerate
symmetric modes, E1 g / E2 g indicate the doubly degenerate sym-
metric modes. Peak assignments are listed in Table S6.Mineralogical Magazine 183
Fig. 10. IR point spectrum and micro-IR transect #Q3-7 (for location see Fig. 3c). (a) Peak assignment with type I water (1600 and 3694 cm–1), type II water (1637 and
3584 cm–1) and CO2 (2358 cm–1). (b) IR spectral transect with spectra centred on the water stretch region crossing secondary beryl zone (red) with primary beryl on
either side (black) (inset: optical micrograph, with IR transect in red and LA-ICP-MS line in black). (c) Representative spectra from primary (blue) and secondary (red)
zone with intense negative correlation of type I and type II water, with Lorentzian line fits (dashed) for type IIs (3588 cm–1), mixed type IId/I (3605 cm–1) and type I
(3694 cm–1) (for details see also Fig. S5).
Fig. 11. IR and ICPMS transect analysis of #Q3-7
(see Fig. 3c and Fig. 7c). (a) IR-absorbance from
Lorentzian peak fits showing qualitative corre-
lated and anti-correlated variations of CO2, type
I and IIs water across primary and secondary
zones. (b) Quantitative comparison of type I
and type IIs (type IId negligible) water (apfu)
derived from absolute IR absorption cross sec-
tions, in relation to Na and Fe content from
LA-ICP-MS.
values for the two crystal regions #Q3-2 (a–c) and #Q3-9 (d–f) as Summarising the data from all EMPA and LA-ICP-MS in
indicated in Fig. 3c and acquired in proximity and an either side Fig. 13 shows the corresponding correlations for A and T2 site
of the LA-ICP-MS trace (images of minor band centred at substitution and indicates only a weak coupling between the
3605 cm–1 is shown in Fig. S6 and full width at half maximum two substitution vectors.
of type I in S7). Akin to the IR line trace analysis above, the Figure 13a shows the negative correlation of 2+/3+ cations with
3+
same negative correlation of type I and type II water, and positive Al content based on sets of EMPA values from different samples
correlation of type I water with CO2 stand out. (#Q3, #Q6 and #Q7), in comparison with the theoretical behav-
iour based on equation 2 with slope –1. Here we assume that
all Fe2+/Fe3+ ions occupy the A site. The small deviation of the
data from the ideal behaviour is probably due to slightly too high
Discussion Al EMPA values, as supported by XRD suggesting Al < 2 apfu,
Coupled substitution or that Fe is dominated by Fe3+ (see also below). Overall, the
role of A-site substitution is small, with the sum of divalent
In the following we analyse the role of the two primary substitu- trace elements ranging from as low as ∼0.001 apfu to a maximum
tion vectors for the octahedrally coordinated A and tetrahedrally value not exceeding ∼0.06 apfu.
coordinated T2 site (Belov, 1958; Wood and Nassau, 1968; Figure 13b shows the positive correlation of Na+ with Li+
Bakakin et al., 1969; Hawthorne and Černý, 1977; Aurisicchio closely following the ideal behaviour with slope 1. This shows
et al., 1988; Sherriff et al., 1991) with that the substitution vector equation 1 is dominated by Na+
alone, which ranges from 91.5%–99.7% (apfu) of the sum of all
3T2 Be2+ + A (3–n)Be2+ + nT2 Li+ +nC R+ (1) alkali elements, and charge balancing for Li+ as it substitutes
for Be2+. This suggests that the remaining alkalis K+, Rb+ and
and Cs+ are primarily charge balancing the Al3+ substitution for diva-
lent cations at the A site. Note the bimodal distribution with lower
2A Al3+ + A (2–k)Al3+ + gX2+ + (k–g)Y3+ + g C R+ (2) Li+ and Na+ content in the primary, and higher Li+ and Na+
values in the secondary phases. Correspondingly this behaviour
where R+ represent alkali ions, X2+ the divalent cations, Y3+ triva- is to first order inversed for the other alkalis vs. X2+ cations
lent cations, with respective coefficients n, k, and g. (Fig. 13c). This suggests that in the secondary phase the role of184 Ping Wang et al.
Fig. 12. Micro-IR imaging on primary and secondary beryl of #Q3-2
(a–c) and #Q3-9 (d–f) (area indicated in Figs 3c, 7c), based on peak
intensities of (a and d) type I water (3694 cm–1), (b and e) type IIs
water (3584 cm–1) and (c and f) CO2 (2358 cm–1). Type I water is less
(blue area in (a and d)), while type IIs water is more in the second-
ary phases (red area in (b and e)). CO2 (c and f) correlates with type
I water.
Table 5. Site-scattering refinement with site scattering and site population assignment from single crystals #Q7, #Q6 and #Q3, compared to the results of EMPA and
LA-ICP-MS analysis.
Crystal Site scattering from Site population Site population (from average chemical composition Predicted site scattering from
sample Site refinement assignment from EMP and ICP-MS) chemical composition
(epfu) (apfu) (apfu) (epfu)
#Q7 T2 5.90(12) 2.95(6) Be2+ 0.289 Li+ + 2.711 Be2+ 6
A 19.94(11) 1.994(1) Al3+ 1.973 Al3+ + 0.022 Mg2+ + 0.008 Fe3+ 20.13
T1 59.64(2) 5.964(2) Si4+ 5.998 Si4+ 59.98
C2 3.096(2) 0.3096(2) Na+ 0.293 Na+ 2.93
C1 4.56(2) 0.456(2) H2O 0.003 K+ + 0.015 Cs+ + 0.368 H2O* 4.56
#Q6 T2 5.81(12) 2.905(6) Be2+ 0.284 Li+ + 2.716 Be2+ 6
A 19.86(13) 1.986(1) Al3+ 2.020 Al3+ + 0.010 Mg2+ + 0.009 Fe3+ 20.51
T1 60.00(4) 6.0(4) Si4+ 5.969 Si4+ 59.69
C2 3.2244(2) 0.32244(2) Na+ 0.358 Na+ 3.58
C1 4.86(2) 0.486(2) H2O 0.004 Cs+ + 0.464 H2O* 4.86
#Q3 T2 5.83(12) 2.915(6) Be2+ 0.249 Li+ + 2.751 Be2+ 6
A 19.89(12) 1.989(1) Al3+ 2.008 Al3+ + 0.003 Mg2+ + 0.009 Fe3+ 20.32
T1 59.88(2) 5.988(2) Si4+ 5.982 Si4+ 59.82
C2 2.928(2) 0.2928(2) Na+ 0.252 Na+ 2.52
C1 4.56(2) 0.456(2) H2O 0.003 K+ + 0.009 Cs+ + 0.401 H2O* 4.56
epfu – electrons per formula unit
H2O* is estimated by site scattering (epfu) except sum of K+, Cs+ and Rb+.
the T2 substitution vector (equation 1) increases, whereas the A Classification guidance (Bosi et al., 2019), this formula leads to
substitution vector (equation 2) diminishes. The deviations of cer- the end-member composition T2Be3AAl2T1Si6O18 (beryl). In sum-
tain data groups (green and red) in Fig. 13c with negative correl- mary, the sample studied can be classified as (Li, Na-rich) beryl.
ation in Fig. 13b suggests a weak coupling between the two
substitution vectors through the alkali R+ mixing.
Combining both substitutions of equations 1 and 2 in Fig. 13d Crystal structure
shows the sum of the vector Li+ for Be2+ at the T2 site, and the The Si value close to ideal 6 apfu by EMPA indicates a negligible
sum of all divalent cations to replace for Al3+ at the A site. The Si–Al substitution. The tetrahedral volumes are 2.133, 2.133 and
good agreement with the theoretical slope of 1 for all data, in con- 2.136 Å3 for #Q7, #Q6 and #Q3 (Table 4), respectively, values
trast to (b) or (c) suggests that all iron at the A site is trivalent, i.e. typical for pure Si tetrahedral sites.
not necessitating charge balancing with alkalis (Fe with other The distinct coordination of water with Na+ features a shorter
divalent cations vs. alkali elements see Fig. S8). bond length of H–O1 for type IIs compared to type IId (Fukuda
The combined results can then be expressed by the empirical and Shinoda, 2008, 2011). This results in a correspondingly larger
formula: bond strength giving rise to a higher frequency of the IR bending
mode. Our type IIs bending mode value of 1637 cm–1 agrees with
T2
(Be2.62 – 2.75 Li0.25 – 0.38 )S3.00 the range of theoretical peak positions of 1637–1639 cm–1 for type
IIs water rather than 1624–1627 cm–1 for type IId water
A
[Al1.94 – 2.00 (Mg, Fe3+ , Ca, Mn, Ti),0.06 ]S2.00 (Fridrichová et al., 2016).
Theoretical Na–O bond lengths of type IIs and IId are 2.227 Å
T1
Si6 O18 C2 [(Na0.25 – 0.36 (K, Rb, Cs),0.02 ] ·C1(H2 O0.4 – 0.5 (CO2 ),0.01
and 2.483 Å, and Na–O1 bond lengths of IIs and IId are 2.558 Å
(3) and 2.540 Å, respectively (Fridrichová et al., 2016). The IIs values
are in good agreement with our measured values of the average
In accordance with the International Mineralogical Na–O and Na–O1 band lengths of 2.305 Å and 2.556 Å, respect-
Association Commission on New Minerals, Nomenclature and ively. This indicates the Na bound water is primarily type IIs.Mineralogical Magazine 185
Fig. 13. Correlations and trends in major-element variations. (a) Linear correlation between A-site Al and corresponding X2+ (divalent ions at the A site) substitu-
ents. (b) Correlation between T2 Li+ substitution for Be2+ with Na+ charge balancing on the C2 site. (c) R+ – Na+ vs. X2+ with inversely correlated deviations of some
data groups compared to (b), indicating weak coupling between the two substitution vectors. (d) Combined A and T2 substitution expressed as R+ (monovalent
alkali ions in channel) vs. Li+ + X2+ – Fe3+ with linear correlation. (a) Based on microprobe data, (b–d) LA-ICP-MS data. Black lines represent the ideal substitution or
charge balance relationship, Al3+ + X2+ = 2 (a); Li+ = Na+ (b); R+ – Na+ = X2+ (c) and R+ = Li+ + X2+ – Fe3+ (d).
Water content H2O (in wt.%) = [0.84958×Na2O (in wt.%)] + 0.8373 (Giuliani
et al., 1997; Groat et al., 2008; Fridrichová et al., 2016), with
The water estimates based on the absolute IR absorbed intensity,
values ranging from 3 wt.%. However, these methods
consistent with the results from XRD informed by LA-ICP-MS,
configure sensitivity to the type of water, or may overestimate
indicate that the water occupancy ranges from 0.4 apfu to
including fluid inclusions or water on grain boundaries. This
0.5 apfu in #Q7, which is close to half of the maximum water occu-
highlights the value of quantitative micro-IR spectroscopy with
pation with an approximate stoichiometry of Be3Al2Si6O18⋅
spatial resolution and site specificity.
0.5H2O. Similarly, from XRD, the water occupation is close to
0.5 apfu for #Q6 (0.46), yet slightly low for #Q7 (0.37) and #Q3
(0.40). The Na+ content (C2/2b site) controls the dipole orienta-
Comparison with previous Xuebaoding beryl studies
tion and types of water on the channel site in the centre of the
Si rings (C1/2a site) with type II water correlated with Na+ content The results of EMPA and LA-ICP-MS are in agreement with
as expected. some but not all prior studies of beryl from Xuebaoding which
Few other investigations have yet addressed the water content are summarised in Table S1 and S7. In general good agreement
in Xuebaoding beryl. Only Guo et al. (2000b) and Lin et al. (2000) is found with Guo et al. (2000b), Qi et al. (2001b) and Zhou
have estimated the water content using a wet chemical method et al. (2002). Yet results from Liu et al. (2001b), republished in
and obtained values of 1.97 wt.% to 3.56 wt.% corresponding to Liu et al. (2005) are inconsistent with ours, reporting high SiO2
apfu values ranging from 0.61 to 1.13, with the later value exceed- (66.04–67.25 wt.%) and low Na2O (0.42–0.83 wt.%). A bulk
ing the maximum possible value of 1 apfu. wet-chemical analysis (Liu et al., 2001a; Qi et al., 2001c) repub-
From other localities, water content in beryl was determined lished in Liu et al. (2005) and again in Liu et al. (2007) is in gen-
by wet-chemical analyses (Charoy et al., 1996; Guo et al., eral agreement with our results, except for their third set of data
2000b; Lin et al., 2000), thermogravimetric analyses (Artioli with low Na2O (0.27 wt.%) and high FeOT (0.76 wt.%) (bolded
et al., 1993; Pankrath and Langer, 2002; Gatta et al., 2006; data in Table S7). A later analysis by the same authors using
Fridrichová et al., 2016), or based on the empirical equation LA-ICP-MS and XRF (Liu et al., 2012) is again inconsistent186 Ping Wang et al.
with implausibly high Li+ (Li2O 2.60–3.04 wt.%) that cannot be and c = 9.212 Å, and with similar composition of Si4+ = 5.996,
charge balanced by the other alkali as quantified. A single Al3+ = 2.004, but lower Li+ = 0.17 and Na+ = 0.14 matches
wet-chemical analysis (Lin et al., 2000) reports exceptionally Xuebaoding sample #Q7 closely.
high Fe (0.67 wt.%) and Ca (0.88 wt.%).
Our XRD unit-cell parameter derived data are in good agreement
Comparison with tabular beryl worldwide
with an earlier analysis of Guo et al. (2000a) with a = 9.209(2) Å and
c = 9.2221(9) Å with c/a = 1.0001. However, our results are in dis- A particular feature of Xuebaoding beryl is the tabular habit.
agreement with Liu et al. (2007) that reports implausibly short a Similar tabular habits are observed in ‘morganite’ (pink beryl)
and c values based on small number of reflections and poor R (Cook, 2011) from San Diego County, California, USA, yet crys-
value. Instead, our results are in better agreement with earlier (Liu tals exhibit dominance of A-site substitution (Mn2+) with charge
et al., 2005) and later work (Liu et al., 2012) by the same authors. balanced by Cs+ (on C1) and low water content. Clear beryl
(goshinite) from lithium-rich microcline–albite pegmatites from
Minas Gerais, Brazil (Cook, 2011) sometimes occur as tabular
Comparison with beryl of similar structure and chemistry from
crystals, with high Li+ and Na+ content and are water rich
other localities
(Fukuda and Shinoda, 2011). Similarly, tabular beryl from the
The Xuebaoding beryl is overall characterised by a simple chem- Bikita rare-element granitic pegmatite, Zimbabwe, exhibit high
istry with minor octahedral (A) site substitution with Fe3+ and Li+ content and T2-site substitution (Černý et al., 2003) with
Mg2+ and negligible Ti4+, Zn2+ or Ca2+ with charge balance alkali charge balancing, and only minor A-site substitution. The
through Cs+ and minor Rb+ and K+. Fe as Fe3+ is suggested to beryl-group member pezzottaite with maximum lithium substitu-
substitute for Al3+ on the A site (Aurisicchio et al., 1988; Neiva tion on T2 (ideally Cs(Be2Li)Al2Si6O18, Yakubovich et al., 2009)
and Neiva, 2005; Groat et al., 2008, 2010). The low Fe3+ content also exhibits a tabular habit. The crystal chemistry of the
is consistent with only a light colour trend towards blue (aqua- Xuebaoding beryl, while not deterministic with regards to the
marine) (Mihalynuk and Lett, 2003; Fridrichová et al., 2015; crystal habit, may still give some insight into the evolution of
Lum et al., 2016). Appreciable Li+ substitution for Be2+ on the the ore-forming fluids (Černý, 2002; Černý et al., 2003; Uher
tetrahedral (T2) site with Li+ up to 0.38 is on the high end com- et al., 2010; Sardi and Heimann, 2014). The alkali and ferromag-
pared to other localities worldwide (Aurisicchio et al., 1988) and nesian content can reflect the evolution and composition of the
charge balanced by Na+ incorporation on the channel site. This host fluid (Černý, 1975).
classifies the Xuebaoding beryl as ‘(Na, Li) beryl’ (Černý, 1975)
as typically associated with Li-rich pegmatites, and of the crystal-
Summary and implications
lographic ‘tetrahedral’ variety, i.e. the dominance of the T2 site Li
substitution as opposed to A-site substitution (Aurisicchio et al., Overall, the Xuebaoding beryl exhibit very similar tabular habit
1988). throughout the deposit, only rarely columnar, or etched. This sug-
Compared to beryl from other localities worldwide, the chem- gests generally similar and stable conditions during the crystallisa-
ical composition and structure of beryl from Xuebaoding do not tion of the veins. The low Fe3+ and Mg2+ content is consistent
stand out in any particular way (Hawthorne and Černý, 1977; with the low degree of Fe3+ mineralisation in general (minor pyr-
Aurisicchio et al., 1988, 1994; Sherriff et al., 1991; Artioli et al., ite). The secondary phases in crystal sections or metasomatic
1993; Černý et al., 2003; Groat et al., 2008; Lum et al., 2016). replacement with decrease in Fe3+ and Mg2+, yet increase in
The Si4+ content of most beryl is close to 6. Al3+ apfu values gen- Na+, indicate a further evolution and fractionation of the fluid
erally range from as low as 1.2 in few cases, to 2, with the majority in its late stage. This would support the hypothesis of early crys-
of data above 1.5 apfu, compared to Xuebaoding beryl with Al3+ tallisation of aquamarine with goshenite being late. These obser-
close to 2 apfu. Be2+ ranges from 2.5 to 3.0 apfu (Hawthorne and vations relate to the suggestion that goshenite is associated with
Černý, 1977; Aurisicchio et al., 1988, 1994; Sherriff et al., 1991; highly evolved fluids, e.g. in pegmatites (Černý et al., 2003;
Artioli et al., 1993; Černý et al., 2003), similar to Xuebaoding Neiva and Neiva, 2005; Wang et al., 2009) and with the limited
beryl varying between 2.62 and 2.75 apfu. Be2+ substitution for Fe3+ and A-site substitution not being of magmatic origin.
Li+ and correlated with Na+ is observed frequently with Li+ ran- These results are further consistent with the understanding that
ging from 0 to 0.5 apfu (with Xuebaoding Li+ of 0.25 to 0.4 apfu the Xuebaoding W–Sn–Be–F–P mineralisation is primarily
in the middle of that range). hydrothermal in origin and derived from a highly evolved fluid
With site substitution controlling the unit-cell parameters emerging from the Pankou and Pukouling albite leucogranites
(Pankrath and Langer, 2002), the values for the a axis range that are highly fractionated, alkali, peraluminous, Li–F-enriched
from 9.202 to 9.228 Å and the c axis from 9.185 to 9.240 Å (Zhu et al., 2020) giving rise to the beryl, cassiterite, scheelite,
(Hawthorne and Černý, 1977; Aurisicchio et al., 1988; Sherriff fluorite and apatite mineral assemblage.
et al., 1991; Artioli et al., 1993; Černý et al., 2003). The tabular habit is therefore unlikely to be related to chemical
Corresponding values for Xuebaoding beryl fall within the middle composition and alkali content. However, the factors that control
of that range. Notably similar in composition and unit-cell par- crystal habit in this and other localities remain unknown. More
ameter to Xuebaoding beryl #Q7, is beryl from the Mount Bity plausible than a chemical effect is the role of pressure and tem-
region, Madagascar (pale pink sample #18, Aurisicchio et al., perature, giving rise to anisotropy in lattice compressibility and
1988), with Si4+ = 6 and Al3+ = 2; Li+ = 0.27 substituting Be2+ at thermal expansion. That may control, not only the size of lattice
the T2 site; and Na+ = 0.18 and Cs+ = 0.02 occupying the channel sites affecting substitution, but also the free energy of and prefer-
to balance the charge – resulting in a = 9.215 Å and c = 9.218 Å, ential growth along particular crystallographic directions.
closely resembling the Xuebaoding beryl values of a = 9.2161(2) Å Understanding the relationship of crystal habit to chemical, pres-
and c = 9.2178(2) Å. The beryl from Pala, California, USA (pale sure and temperature conditions of the source fluid would be a
pink sample #28, Aurisicchio et al., 1988) with a = 9.213 Å subject of considerable general importance.You can also read