UNDERSTANDING CLIMATE CHANGE IN SAINT JOHN - 2020 Report
←
→
Page content transcription
If your browser does not render page correctly, please read the page content below

UNDERSTANDING CLIMATE                           2020 Report
CHANGE IN SAINT JOHN
                        UNDERSTANDING CLIMATE CHANGE IN SAINT JOHN   1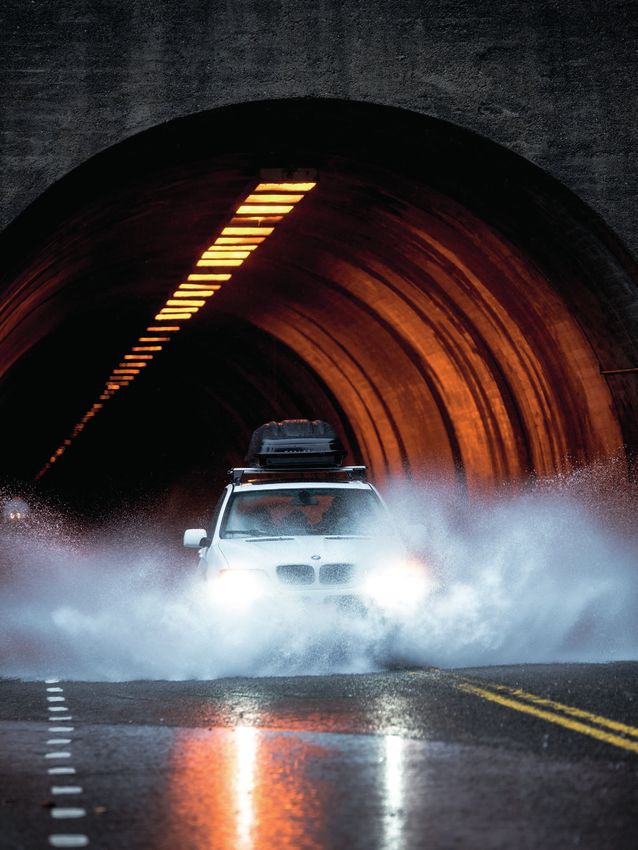
2020 Report
PUBLISHED BY:
-

ATLANTIC COASTAL ACTION
PROGRAM [ACAP] SAINT JOHN INC.
139 PRINCE EDWARD STREET, SUITE 323
SAINT JOHN, NEW BRUNSWICK
CANADA
E2L - 3S3

TEL: (506) 652-2227
FAX: (506) 801-3810
E-MAIL: OFFICE@ACAPSJ.ORG
WEB: WWW.ACAPSJ.ORG

Reproduction of this report in part or
in full requires written permission from
Atlantic Coastal Action Program [ACAP]
Saint John Inc.
    2
PUBLISHED
  BY:  INTRODUCTION

Climate Change is one of the greatest challenges facing                                        also discussed. Understanding how Climate Change will
human civilization today. It directly affects fundamental                                      affect the community is critical for developing effective
needs like food, water, and shelter. In Canada, the                                            strategies and reducing negative outcomes.
rate of warming is nearly twice the global average and                                               As a coastal city, sea level rise is of great concern for
impacts are already being felt. This report is intended to                                     Saint John. Predictions suggest that a Higher High Water
be a resource for residents, businesses, developers and                                        Large Tide (HHWLT) can be expected to be 6.2 m by 2100
Council members who are eager to learn more about the                                          for a 100 year return period. Sea level rise projection data
changing environment in Saint John, New Brunswick,                                             for various flooding scenarios are provided in this report
Canada.                                                                                        and social and environmental impacts are discussed.
      The primary challenges posed to Saint John as a                                          The largest challenge for areas impacted by sea level
result of Climate Change include increasing temperature,                                       rise is the high economic cost associated with damage,
sea level rise, and higher intensity precipitation events.                                     relocation, or long-term monitoring. Strong partnerships
These result in severe inland and coastal flooding,                                            between multiple stakeholders will be required to protect
accelerated rates of coastal erosion, and loss of land. This                                   public and industrial spaces against rising sea level.
report introduces Climate Change science and describes                                               Climate Change compounds reoccurring challenges
the predicted weather changes for Saint John. These                                            experienced in Saint John around water: changes in
changes include warmer annual temperatures, warmer                                             seasonal riverine flooding, overflow from precipitation
winters, increases in rainfall events, rising sea levels, and                                  events, and sea level rise. This report discusses challenges
changes to storm frequency and intensity.                                                      around freshwater availability and quality. Supporting
      Inland flooding, a historical climate-related challenge                                  healthy communities requires actions to ensure a safe
for Saint John, is discussed as the result of changing                                         water supply is available.
seasonal temperature and precipitation patterns.                                                     The City of Saint John must develop adaptation
The benefits of green infrastructure or low impact                                             strategies to reduce the negative impacts associated with
development strategies are investigated as a solution                                          Climate Change. In Spring 2020, ACAP Saint John will
to reduce the risk of property damage from flooding.                                           release the Climate Change Adaptation Plan for Saint
The impacts of extreme weather events, including post-                                         John, which will provide recommendations to reduce
tropical storms, ice storms, and wildfires in Saint John are                                   risks and increase the resilience of the community.

TABLE OF CONTENTS
1..................................................................................................................................................................Table of Contents

2.................................................................................................................................................................................Glossary

3...................................................................................................................................................................List of Acronyms

5..............................................................................................................................................Climate Change in Saint John

9..........................................................................................................................................................................Temperature

13........................................................................................................................................................................Precipitation

15.................................................................................................................................................................Extreme Weather

19.............................................................................................................................................................Sea Level Rise (SLR)

25...............................................................................................................................................................................Flooding

29.....................................................................................................................................Urban Water Quality and Security

32...........................................................................................................................................................................Next Steps

33...........................................................................................................................................................................References

35............................................................................................................................................APPENDIX A: CLIMATE DATA

                                                                                                                          UNDERSTANDING CLIMATE CHANGE IN SAINT JOHN                 1
GLOSSARY

Adaptation                     Coastal Squeeze                to have a GWP of 1 over       predicted water levels over
Initiatives and measures       A form of coastal habitat      a 100-year time period,       a 19 year period.
that reduce the                loss, where intertidal         methane is estimated to
vulnerability of human and     habitats such as salt          have a GWP of 28-36 over
natural systems to actual      marshes, mudflats or           100 years and nitrous oxide   Inland Flooding
or anticipated Climate         sand dunes are lost or         is estimated to have a        Flooding experienced
Change effects.                deteriorated due to high       GWP of 298 (United States     as a result of heavy
                               water levels. In response      Environmental Protection      precipitation events or
                               to sea level rise, defence     Agency, 2017).                high river flows occurring
Aquifer                        structures (i.e. a sea wall)                                 in natural and built
A subsurface layer of          can prevent the inward                                       environments.
rock that holds water. The     migration of land.             Greenhouse Gas (GHG)
pores and cracks in the                                       Compounds that can
rock allow water to be                                        absorb infrared radiation     Low Impact Development
stored until it is pumped to   Ecosystem                      and trap heat in the          (LID)
the surface for use.           A system of living             atmosphere, contributing      Urban infrastructure
                               organisms interacting          to The Greenhouse Effect.     installed with an emphasis
                               with each other and their                                    on conservation of
Blue Infrastructure            physical environment                                         natural features with
Landscape elements linked      ranging from very small        Green Infrastructure          the intention to reduce
to water bodies, such as       spatial scales to entire       Development that utilizes     urban challenges around
pools, ponds, artificial       regions, i.e. coastlines and   and promotes the benefits     stormwater management.
buffer basins or water         watersheds.                    of ecosystem services
courses.                                                      including stormwater
                                                              management, water             Mitigation
                               Flood                          filtration, carbon storage,   Any policy, regulation, or
Climate                        A significant rise of water    enhanced biodiversity, and    project-based measure
The average weather            level in a stream, lake,       community well-being.         that contributes to the
measured by the                reservoir or a coastal                                       stabilization or reduction
statistical description        region from excessive                                        of greenhouse gas
of mean variability of         rain, severe storms, rapid     Grey Infrastructure           concentrations including
wind, precipitation,           snow or ice melt, blocked      Engineering and building      renewable energy
temperatures etc. over         watercourses, failure of       projects that are made        programs, and energy
time ranging from months       dams, land subsidence          from concrete and/or          efficiency plans.
to thousands or millions of    or storm surges that           steel and are typically
years.                         inundates natural or built     impervious in urban
                               landscapes within city         settings.                     Resilience
                               boundaries.                                                  The capacity of a system,
Climate Change                                                                              community or society
The long-term changes in                                      Harmful Algal Blooms          exposed to hazards
climate variables, such as     Flood Risk                     (HABs)                        to adapt, by resisting
precipitation, temperature,    The combination of             Occur when colonies of        or changing in order
sea level, lake levels, and    hazards and vulnerability      algae grow to produce         to reach and maintain
changes in the frequency       to floods that have a high     toxic or harmful effects      an acceptable level of
and intensity of extreme       probability to occur and/      on people, fish, shellfish,   functioning and structure.
weather events.                or have significant impact     marine mammals, and
                               on property, health, or        birds.
                               livelihoods.                                                 Saltwater-Freshwater
Coastal Erosion                                                                             Interface
The process of removal                                        Higher High Water Large       The boundary beneath
and transport of soil and/     Global Warming Potential       Tide (HHWLT)                  the Earth’s surface
or rock from shorelines as     (GWP)                          A representation of the       where saltwater and
a result of weathering by      A ratio of how much heat       storm surge impacts           freshwater meet as a
streams, glaciers, waves,      a gas traps in a specific      associated with the moon      gradual transition zone
or high winds.                 time frame relative to CO2     cycle on the high tide. It    where water becomes
                               (IPCC, 2014). For instance,    is determined by taking       more saline as it moves
                               where CO2 is estimated         the average of highest        seawards.

 2
Saltwater Intrusion                           or snowmelt that flows                        Vulnerability                                 Watershed
The process of seawater                       across the landscape and                      The likelihood of a system                    An area delineated
infiltrating coastal                          is not stored or taken up                     suffering an adverse                          topographically were all
groundwater systems,                          by plants. This can be rain,                  impact of Climate Change                      precipitation drains to one
mixing with a local                           melting snow or ice that                      when exposed to extreme                       point or outlet.
freshwater supply.                            washes off hard surfaces.                     weather.

                                                                                                                                          Urban Heat Island (UHI)
Storm Surge                                   Stakeholders                                  Water Security                                The warming effect of
A localized, temporary                        A party, including                            The capacity of a city                        built urban spaces on air
rise in water occurring                       residents, businesses,                        to protect urban water                        temperature in comparison
during specific weather                       developers, First Nations,                    quality and availability to                   to surrounding rural areas.
conditions.                                   NGOs, academics, and                          sustain livelihoods, well-
                                              City staff and Councillors                    being and socio-economic
Stormwater Runoff                             who have an interest in a                     development.
Water from precipitation                      specific issue.

       LIST OF ACRONYMS

AR5..........................................................................................................................................IPCC Fifth Assessment Report

AR6......................................................................................................................................... IPCC Sixth Assessment Report

DFAA................................................................................................................. Disaster Financial Assistance Arrangements

ECCC...................................................................................................................Environment and Climate Change Canada

FTC......................................................................................................................................................... Freeze-Thaw Cycles

GCMs.......................................................................................................................................... General Circulation Models

GHG..............................................................................................................................................................Greenhouse Gas

GNB....................................................................................................................................... Government of New Brunswick

GWP............................................................................................................................................... Global Warming Potential

HABs.................................................................................................................................................... Harmful Algal Blooms

HHWLT................................................................................................................................... Higher High Water Large Tide

IPCC................................................................................................................. Intergovernmental Panel on Climate Change

LID.................................................................................................................................................. Low Impact Development

NBDELG...................................................................... New Brunswick Department of Environment and Local Government

NB EMO................................................................................................ New Brunswick Emergency Measures Organization

RCP...........................................................................................................................Representative Concentration Pathway

UHI..............................................................................................................................................................Urban Heat Island

                                                                                                                      UNDERSTANDING CLIMATE CHANGE IN SAINT JOHN              3
4
1. CLIMATE CHANGE IN SAINT JOHN

Climate Change has            by The Greenhouse
become a regular focus        Effect, which acts to
of media across the world     regulate temperature           What is the difference between
and more so than ever         by trapping greenhouse         adaptation & mitigation?
there is positive action      gases (Figure 1). This
being taken by local          natural process controls
communities, nations,         the Earth’s temperature        Adaptation:
and municipalities to         and has allowed for            Process of adjustment to actual or expected climate
prepare and adapt to          ecosystems to develop          and its effects. In human systems, adaptation seeks
changing conditions. The      and diversify. GHG             to moderate harm or exploit beneficial opportunities.
City of Saint John has        emissions come from            In natural systems, human intervention may facilitate
an opportunity to adapt       both natural and man-          adjustment to expected climate and its effects.
to the changing climate       made sources and include
and continue to develop       carbon dioxide (CO2),          Mitigation:
as a thriving community.      methane, water vapour,         Human intervention to reduce the sources or enhance
This chapter is intended      nitrous oxides, ozone,         the sinks of GHGs. (IPCC, n.d.)
to introduce Climate          hydrofluorocarbons,
Change science including      perfluorocarbons and
greenhouse gases              sulphur hexafluoride.
(GHGs), climate modelling     Each of these gases has
terminology and the           a specific capacity for
changes projected for         warming the atmosphere
Saint John.                   called the global warming
                              potential (IPCC, 2001).
                                                                                                   CO₂ and other gases
                              While CO2 is often the
                                                                                                   in the atmosphere
1.1 Introduction to           focus of Climate Change                                              trap heat, keeping the
Climate Change                conversations, each                                                  earth warm.
Science                       of these gases play a
                              significant role in The
The Intergovernmental         Greenhouse Effect.                                                   Some sunlight that
                                    In the atmosphere,                                             hits the earth is
Panel on Climate Change
                              GHGs can be transformed                                              reflected.
(IPCC), established in                                                                             Some become heat.
1988, is a United Nations     by chemical processes
scientific body and           and released beyond
the foremost authority        the atmosphere, but
on Climate Change             most are trapped, left to
science. In 2014, the Fifth   absorb incoming solar
Scientific Assessment         energy and keep the
Report (AR5) was              planet’s surface warm.
released emphasizing the      The dramatic increase
severity of our warming       in GHG emissions by
climate system. The           humans, or anthropogenic
Sixth Assessment Report       sources, has enhanced
(AR6), scheduled to be        The Greenhouse Effect,
released in 2021, will        trapping heat in the
provide stakeholders with     atmosphere and resulting
modern solutions and          in warmer temperatures
updates about successful      that alter atmospheric
strategies to reduce          and hydrologic processes.
Climate Change impacts.       Higher concentrations
                              of GHGs in the
                              atmosphere have led to
1.1.1 The Greenhouse          2016 being the world’s
                              hottest year on record
Effect
                              (World Meteorological
                              Organization, 2020). This   Figure 1: The Greenhouse Effect, where the sun’s heat is trapped in
The global climate                                        the atmosphere by higher quantities of greenhouse gas emissions
                              aligns with a trend in
system is maintained                                      (Mathematics of Planet Earth, 2012).
                              global warming that has
                                                                                UNDERSTANDING CLIMATE CHANGE IN SAINT JOHN   5
been observed over the          2001). For this report,
last 60 years confirming        the climate data was
athat our climate is            generated using outputs         Weather is defined as the fluctuating
changing with abnormal          from 24 climate models          state of the atmosphere characterized
rapidity (Figure 2).            by national weather             by temperature, wind, precipitation, and
                                services and research           clouds, and can only predictable over hours,
                                organizations from              days, or weeks. Climate is the average
1.1.2 Climate Modelling         nine countries (Roy and         variability of these elements (or weather)
                                Huard, 2016). To generate       over time. Climate can be observed over
The components and              realistic projections,          different scales, ranging from months to
interactions of the             an emission scenario is         thousands or millions of years.
climate system can be           applied during climate
studied and simulated           modelling to represent the
using climate models.           concentration of GHGs
The General Circulation         that will be involved in
Model (GCM) is the              the system. The data in
starting point for scientists   this report is based on the
who will use numerous           highest emission scenario
models to generate              (RCP 8.5), which is closest
accurate data (IPCC,            to current trends.

                                                              NASA Goddard Institute    NOAA National Center for
                                                              for Space Studies         Environmental Information

 Temperature Anomaly (ºC)                                     Hadley Center/Climatic    Japanese Meteorological
                                                              Research Unit             Agency

 Figure 2: Temperature trends from 1880-2020 (National
 Aeronautics Space Agency, 2017).

 6
What is
                    a Baseline?

                    To generate future
                    climate, a baseline
                    of historical
                    data is required.
                    Reports will refer
                    to this baseline
                    when discussing
                    the anticipated
                    changes. For
                    example: 1.5
                    degrees Celsius of
                    warming compared
                    to 2005 levels,
                    where 2005 levels
                    represent the
                    historical data. The
                    baseline period
                    should be the same
                    length of time as
                    the projected term
                    and is most often a
                    30 year period.

                1.2 Conclusion

                Chapter One has provided
                a brief overview of Climate
                Change science and
                modelling. The subsequent
                chapters will describe the
                climate projections for
                Saint John and discuss the
                associated impacts.

UNDERSTANDING CLIMATE CHANGE IN SAINT JOHN   7
8
2. TEMPERATURE

The average annual temperature in New Brunswick,                   2071-2100 (Figure 4 A & B). Average winter temperatures
relative to 1990 levels has increased by 1.1°C over the            will increase from -5.4°C up to -1°C by 2071-2100 resulting
last 30 years (NBDELG, 2018a). Compared to the same                in more freeze-thaw days (Figure 4 C & D). The projection
1990 baseline, annual temperatures in the province are             data shows the annual number of freeze-thaw days
expected to increase 3.5°C by 2080 (Roy and Huard,                 will peak mid-century (2011-2040) and then decline as
2016). In the Greater Saint John Area, hotter summers              mean winter temperatures approach zero in the late
and shorter, warmer winters can be expected in the                 century (Roy and Huard, 2016). Winter temperatures
future decades. Temperature projections are displayed in           hovering around zero degrees can be dangerous due to
Figures 3 and 4 and climate data is available in Appendix          the threat of freezing-rain events which are challenging
A (Table 1). The annual temperature in the Greater Saint           to predict. Weather alerts provided by Environment and
John Area is expected to rise from 5.7°C up to 9.1°C by            Climate Change Canada (ECCC) are critical for ensuring
2071-2100 (Figure 3). Mean summer temperature could                communities are prepared and safe during periods of
rise 3.4°C by 2071-2100 with an increase in the number of          unpredictable weather conditions.
hot days (above 25°C) from 9.5 in 1971-2005 to 70 days in

Average Annual Temperature
Change For Saint John

   Figure 3: Average annual temperature change for Saint John up to the year 2100 by the Atlantic Climate Adaptation Solutions
   Association (ACASA) New Brunswick Climate Futures Projections (Roy and Huard, 2016).

                                                                                      UNDERSTANDING CLIMATE CHANGE IN SAINT JOHN   9
Temperature Changes For Saint John Up To The Year 2100 10
Figure 4: Temperature changes for Saint John up to the year 2100. (A) Average summer temperature projections. (B) The number
   of hot days where temperatures exceed 25°C. (C) Average winter temperature projections. (D) The number of freeze-thaw days
   where temperatures hover around zero degrees.

   Did you know?

    Freeze-thaw days occur when the daily maximum temperature is greater than 0°Cand the daily
    minimum temperature is less than 0°C. These freeze-thaw cycles (FTCs) are associated with ice
    and slush conditions which can directly result in damage to built infrastructure. Indirect impacts are
    challenging to predict and include increased use of road salt and changes to ecological cycles. FTCs are
    significant for plants or animal species that require stable temperatures for dormancy or are sensitive
    to cold spells. The production of maple syrup is an example of an industry that relies on FTCs and will
    need to adapt to these changing climate conditions (Roy and Huard, 2016).

In urban spaces, concrete infrastructure and dark                    experiencing dangerous extreme heat events. In Saint
surfaces absorb heat resulting in higher air temperatures            John, the UHI effect is moderated by the coastal setting.
when compared to the surrounding rural areas. In climate             As temperatures increase, monitoring and education
science, this is known as the Urban Heat Island (UHI)                around heat related illness will be necessary to avoid
effect (Figure 5). Residential and commercial heating and            hazards associated with heat and the UHI effect.
cooling systems, vehicles and other appliances generate                   As the average annual temperature increases,
heat and contribute to the UHI. In combination with                  Saint John will experience earlier snowmelt, mid-winter
increasing annual temperatures, many large cities are                thaws, and ice breakups which can lead to significant

The Urban Heat Island Effect

Figure 5: The Urban Heat Island effect: heat is absorbed and
held by concrete and asphalt in cities. Tall buildings and lack of
vegetation prevent heat from dissipating and diminish natural
shade and evaporative cooling (Warren and Lemmen, 2004).

infrastructure damage when combined with intense                     Brunswick communities are beginning to adjust to the
rainfall (NBDELG, 2014). In 2018 and 2019, Saint John                impacts of warmer temperatures, however education and
experienced extensive inland flooding due to the                     awareness about adaptation will be needed to reduce the
combination of spring freshet and extreme rainfall. New              health risks of warmer temperatures in Saint John.

                                                                                      UNDERSTANDING CLIMATE CHANGE IN SAINT JOHN   11
12
3. PRECIPITATION

Precipitation trends tend to vary more than temperature,      6; NBDELG, 2018a, Roy & Huard, 2016). This means that
making patterns of rainfall in the Greater Saint John area    more precipitation will be falling during shorter periods,
difficult to predict. Climate models project that New         increasing the amount of stormwater that will be running
Brunswick will experience an extension of dry periods         through sewer infrastructure and into nearby waterways.
and an increase in heavy precipitation events resulting             The type of seasonal precipitation (rain, snow, sleet,
in a net increase in mean annual precipitation (Figure        hail, etc.) in the Greater Saint John area is expected to

 Projected changes to precipitation
 in Saint John

 change. As temperatures rise, the annual number of
 snow days will decrease which correlates to an increase       Figure 6: Projected changes to precipitation in Saint John.
 in rain days and may result in more flooding than             An increase in annual precipitation is anticipated (A) and
 historically observed (Roy and Huard, 2016). River flows      changes in the annual number of rain days and snow days
 will become more variable as spring peak flow will occur      are shown (B) and (C). Precipitation projections up to the
 earlier and summer minimal flows will be lower. During        year 2100 by the Atlantic Climate Adaptation Solutions
 summer months, rivers may experience an increase in           Association (ACASA) New Brunswick Climate Futures
 periods of very low or zero flow that can have significant    Projections (Roy and Huard, 2016).
 ecological impact (NBDELG, n.d.). Climate data is
 available in Appendix A (Table 2).

                                                                                UNDERSTANDING CLIMATE CHANGE IN SAINT JOHN   13
14
4. EXTREME WEATHER

Extreme weather events are controlled by changes in        communities. Most notable were damages in 2008, 2018,
atmospheric temperature, pressure and moisture. They       and 2019 when heavy rain events coincided with the
are expected to become more frequent and intense           melting of record-breaking snowfall (NBDELG, n.d.).
as a result of changing climate. For every 1°C rise in          Projection trends show an increase in the annual
temperature the amount of moisture in the atmosphere       temperature and precipitation in Saint John, however
increases by 7% or more (Daigle, 2012). In response to     emphasis must be placed on the extremes of each
increased moisture, New Brunswick can expect 10 to 20%     variable, for example days of extreme heat or heavy
more extreme rainfall events per year (Canadian Center     precipitation events. The impacts of extreme wind,
for Climate Modeling and Analysis, 2017). Historically,    including power outages and fallen trees are already
extreme rainfall events (50 millimetres or more over       experienced throughout the City. Preparedness is
a 24-hour period) have caused millions of dollars in       essential to avoid injury and respond quickly as extreme
flood damage in Saint John, as well as within outlying     wind events will continue to be experienced.

 Natural disasters recorded in                                  Figure 7: Natural disasters recorded in Atlantic Canada from
                                                                1900-2005, retrieved from Atlantic Climate Adaptation Solutions
 Atlantic Canada from 1900-2005                                 Association (2011).

From 1900-2005, Atlantic Canada experienced                In 2017, a survey was conducted by the Conservation
approximately 53 flooding events, 16 hurricanes, and       Council of New Brunswick after post-tropical storm
13 winter storms (Figure 7). With shifting hydrological    Arthur, which hit the Maritimes in July 2014. The
conditions and warming temperatures, Saint John            responses highlighted gaps in emergency preparedness
can expect an increase in the intensity and frequency      that should be addressed in all New Brunswick
of heavy precipitation, high winds, storm surges,          municipalities (Comeau, 2017). The biggest concerns
summer convective storms (thunderstorms, hail storms,      for the citizens who participated were power loss, food,
hurricanes), and severe winter storms. These events        water, downed trees, and blocked roads. Municipal
are often associated with high damage and recovery         staffing and a lack of qualified contractors to conduct
costs, emphasizing the importance of preparedness and      cleanup was also recognized as a significant issue.
adaptation. Learning from past extreme weather events
can provide insights necessary to lessen future impacts.

                                                                              UNDERSTANDING CLIMATE CHANGE IN SAINT JOHN     15
4.1 Frequency and Despite a general trend trend in more severe compounded by higher sea
Economic Costs of increased frequency, weather events. Over six levels these events can lead
anticipating extreme years (2009-2015) the total to power outages, flooding,
Canadian municipalities weather events continues of DFAA costs associated and isolation which
have experienced significant to be a challenge. Unlike with extreme weather was can result in significant
increases in the costs overall temperature and greater than the previous economic and public
associated with property precipitation trends, 39 fiscal years combined. health risks (NBDELG,
damage and emergency windstorms, heavy In those years, flooding n.d.). During the winter, ice
response caused by precipitation, heat waves, accounted for 75% of all storms create hazardous
more frequent extreme forest fires, drought, expenditures (Moudrak conditions for citizens
weather events (Moudrak and ice storms are not and Feltmate, 2017). travelling throughout
and Feltmate, 2017). accurately represented the City. As the winter
Public Safety Canada has through climate models, temperature increases
found that the number especially on a regional 4.2 Post-tropical closer to zero degrees
of incidences where scale (Université Virtuelle Storms, Hurricanes and Celcius more freezing rain
provinces and territories Environnement et Ice Storms and ice accumulation is
have required or obtained Développement Durable, anticipated.
Disaster Financial Assistance 2016). Without an accurate The City of Saint John is
Arrangements (DFAA) model, the statistics from at risk to damages from Figure 8: Number of
significantly increased DFAA and the Insurance natural disasters in
post-tropical storms and
Bureau of Canada highlight Canada requiring DFAA
between 1970 and 2015, hurricanes which bring
the need for municipalities from 1970-2015
well in excess of population strong winds and heavy (Moudrak and Feltmate,
growth (Figure 8). to prepare for an increasing precipitation. When 2017).
Number of Tropical Storms,
Number of Hurricanes and Sum Number of Tropical
Storms
Number of Hurricanes Sum
Figure 9: Frequency of tropical storms and hurricanes in the North Atlantic region since 1850 displaying cyclic variations but an
overall increase (ACAP Saint John, 2016).
164.2.1 Tropical storms, 4.2.2 Ice Storms 4.3 Drought and Increased fire hazard
hurricanes and post- Wildfires in New Brunswick will
tropical storms As a result of increased threaten infrastructure and
temperature and Climate Change is ecosystems and reduce
A tropical storm describes precipitation, freezing expected to impact air quality. To adapt, the
a storm system with a rain, and ice storm events temperature and Government of New
low-pressure centre that will create new challenges precipitation extremes in Brunswick recommends
develops over tropical for municipalities. During the Greater Saint John maintaining air quality
or subtropical waters in January of 2017, a multi-day area. This means that tracking and advisory
the Atlantic Ocean. If ice storm along the coast warmer temperatures programs, increasing the
temperature conditions are of New Brunswick led to may be experienced in number of health studies
suitable, a tropical storm road closures, downed combination with periods to better understand the
can develop into a tropical trees and powerlines, of heavy precipitation or risks of forest fire smoke,
cyclone, commonly resulting in power outages with periods of minimal and to promote appropriate
known as a hurricane. A for over 300,000 residents. precipitation. These forest fire risk prevention
post-tropical describes Extended power outages changes will have severe or mitigation behavior on a
a storm that maintains from ice accumulation on impacts such as increased municipal level (NBDELG,
strong winds and heavy power lines and fallen trees drought stress on crops n.d.). In Saint John, similar
precipitation but does not are especially dangerous and shortages of drinking wildfire adaptation is
qualify as a tropical storm during cold temperatures. water (NBDELG, n.d.). The necessary for properties
as it no longer exists in Following this event, City of Saint John is at with large woodlots and
tropical regions. the Government of New low risk to these impacts park spaces.
This type of storm Brunswick developed a due to the availability
system develops when sea series of recommendations of drinking water from
surface temperatures are to reduce vulnerability surface reservoirs. 4.4 Conclusion
above 25°C (NOAA, 2019). during these types of
As a result of increases storms (GNB, 2017). As the frequency and
in both annual surface In Saint John, winter The IPCC defines severity of extreme
temperatures and sea temperatures will increase drought as a weather events increases,
surface temperatures, creating ideal conditions period of dry adaptation strategies must
more frequent and severe for freezing rain events weather that leads be taken to reduce negative
storms are predicted and ice storms. When to an abnormal impacts on municipalities.
around the world. Trends in combined with poor Results from the public
balance of water
the North Atlantic support visibility, low temperatures survey conducted by the
and high winds, the
in the system
this prediction showing Conservation Council of
presence of ice can be (IPCC, n.d).
an increase in the number New Brunswick provides
of tropical storms and extremely hazardous for several recommendations
hurricanes compared to residents (NOAA, n.d.-a). Drought conditions create for municipalities to reduce
historical events a(Figure Adaptation strategies dry and warm forested vulnerability to extreme
9). This trend emphasizes to reduce the hazards regions, providing fuel weather. Some adaptations
the need for adaptation associated with ice storms for wildfires to break out. include: cyclical tree
and preparedness in the include tree trimming Occurrence of wildfires trimming around power
Greater Saint John area. around power lines in Canada’s boreal forest lines to reduce potential
and education around is the highest observed in power outages; backup
emergency preparedness. human history, resulting power options with
in evacuations and stress the capacity to sustain
on remote communities residents for 3 to 7 days;
(WMO, 2019). Recent and training for emergency
studies suggest that the officials to handle mental
number of forest fires in health impacts that may
Canada will increase by require additional support
25% by 2030 and by 75 (Comeau, 2017). Exploring
to 140% by the end of the response and recovery from
century (Wotton, Nock, more recent storm events
& Flannigan, 2010). By the including post-tropical
year 2040, wildfires in storm Dorian (September
Canada may last an average 2019) can help identify
Figure 10: The conditions of 30 days and burn 1.5 where support is required
after an ice storm can times more forest area to build resilience to these
be extremely hazardous compared to the late 1990’s types of extreme weather.
for pedestrians and (Government of Canada,
motorists (Photo: ACAP 2018).
Saint John).
UNDERSTANDING CLIMATE CHANGE IN SAINT JOHN 1718
5. SEA LEVEL RISE (SLR)

Global sea level is predicted
to rise by a maximum of
0.98 metres by 2100 (Daigle,
2012; IPCC, 2014). Between
1911 to 2000, sea level
increased by approximately
30 centimetres
(International Council
for Local Environmental
Initiatives Canada, n.d.).
Research suggests the
levels will continue to
rise by approximately
86 centimetres (+/- 38
centimetres) by the end of
the century (Daigle, 2014).
As a result, New Brunswick
will face more frequent and
permanent coastal flooding.

5.0.1 Why is the sea level
rising?

The rising sea level in Saint
John can be attributed to
a combination of melting
polar ice, warming ocean
temperatures and vertical
crustal movement. The
addition of freshwater
from melting ice caps
has a direct effect on sea
level. An increase in ocean
temperatures results in the
thermal expansion of water,
meaning water molecules
will take up more space
and contribute to rising
water levels. Lastly, the
geologic setting of Saint
John has a large role in
understanding sea level
rise. During the last ice-
age, the weight of glaciers
located over Quebec and
the St. Lawrence River put
pressure on Earth’s crust.
This resulted in crustal uplift
throughout Nova Scotia
and southeastern New
Brunswick (Koohzare et al.,
2007). When the pressure
of the ice was removed,
the crust began to subside        Figure 11: The process of crustal subsidence being experienced in Saint John due to the pressure
to its original position.         from glaciers during the most recent ice age (Henton et al, 2006).

                                                                                       UNDERSTANDING CLIMATE CHANGE IN SAINT JOHN    19
Saint John experiences return periods (Figure 12). 2017). Sea level rise data average. The cost of
a gradual subsidence Total sea level is the sum of can be found in Appendix A damages to homes in New
of approximately 0.4 Higher High Water Large (Table 3). Brunswick are expected
millimetres per year Tide (HHWLT), anticipated Sea level rise has to reach $730 to $1,830
(Daigle, 2014) (Figure 11). regional sea level rise, many impacts including per resident per year by
and highest storm surge coastal erosion, coastal the year 2050 (NBDELG,
amplitude. Using different squeeze, changing tidal 2014). To adapt to Climate
5.0.2 SLR Predictions return periods provides a amplitude, and increased Change, the City of Saint
for Saint John range of severity that can storm surge. Ultimately, John must take action to
be anticipated depending these can result in protect coastlines and
Flooding scenarios up to on the intensity of storm significant flooding events reduce the hazardous
the year 2100 have been events. The flooding and the permanent loss of impacts of sea level rise.
projected for coastal scenarios also include the land and habitat. The costs
communities in southeast glacial collapse of the West of coastal flooding are 100 Year
New Brunswick (Daigle, Antarctic ice sheet, which higher in New Brunswick 50 Year
2017). This research could result in further sea than any other Atlantic
level rise of approximately province and five times 5 Year
provides values for total
sea level over different 65 cm (Figure 12B; Daigle, higher than the Canadian 1 Year
Figure 12: (A) Flooding Scenarios for Saint John from 2010 to 2100, expressed as the total sea level for various return periods.
(B) Flooding scenarios include the collapse of the West Antarctic ice sheet which by the year 2100, would cause sea levels to
rise substantially more than projections suggest (Daigle, 2017). In both (A) and (B), an increase in sea level is observed.
20Return periods
express the
probability of a
flood or storm
event. For example,
a 1 in 100-year
event has a 1%
chance of occurring
in any given year;
a 1 in 5-year event
has a 20% chance
of occurring; and
a 1-year or annual
event is likely to
occur every year.
Return periods are
calculated based
on current weather
patterns and do not
include changes in
future climate. A 1
in 100-year event
could become a 1 in
50-year event as the
climate changes.
Figure 13: Shoreline erosion at Sand Cove Road in West Saint John (Photo: ACAP Saint John).
5.1 Coastal Erosion of an area. Red Head 14). Each strategy will increased risk of coastal
Road, Sand Cove Road, have different risks and erosion, flooding and
Sea level rise will not Bayshore Beach, Sheldon costs specific to the rate infrastructure damage
only lead to more severe Point Road and Lorneville of erosion. The expense (NBDELG, n.d.). Properties
flooding but will also Cove have already been of accommodation and in high risk erosion zones
increase erosion of identified as experiencing protection strategies are vulnerable to seawater
coastline areas. Coastal coastal erosion in Saint may also deter property contamination in drinking
erosion can threaten John (Figure 13). New owners, leaving retreat as wells and permanent loss
homes, businesses, Brunswick coastlines are the only option. of land. Ultimately, coastal
bridges, roads, and eroding at 0.59 to 0.88 Grey infrastructure in erosion, exacerbated
historic sites in coastal metres per year due to sea Saint John was designed by sea level rise and
zones. Roads and railways level rise and sensitivity to accommodate a 0.7 increased storm surge,
built near shorelines are to storm surges (O’Carroll metre rise in sea level. leads to negative impacts
now recognized to be and Bérubé, n.d.). In areas However, with sea level on harbours, native
vulnerable to coastal that experience instability, rise projected to reach species, and nearby homes
erosion and flooding. slope movement can be 0.86 metres rise by and businesses (NBDELG,
Repairs and consolidation hazardous depending on the year 2100, the City 2014; Lemmen et al., 2016).
of embankments, bridges, the amount of material needs to recognize the
abandoning old roads, being shifted. Monitoring
and relocating routes are of areas experiencing high
expensive adaptation erosion is of significant Hard protection infrastructure includes
responses (Université importance, in order to
dykes, seawalls, rock armouring, or
Virtuelle Environnement et warn residents about
high risk areas that geosystems that consolidate retreating
Développement Durable,
2016). Aside from the may pose danger to coastal zones. Soft infrastructure can be
high costs of damage, commuters, residents, or measures such as heightened conservation
coastal erosion can cut recreationists. efforts or reinstating vegetation
off essential supply In critical areas, the (bioengineering) that will buffer shoreline
chains, limit opportunities City has the option to protection for beaches and wetlands (i.e.
in tourism, curb new protect, accommodate planting willows, maintaining mangroves, or
development, and increase or retreat and accept beach renourishment).
ecological sensitivity the loss of land (Figure
UNDERSTANDING CLIMATE CHANGE IN SAINT JOHN 21Flood Mitigation Strategies
For Sea Level Rise
Figure 14: Flood mitigation strategies for sea level rise (Lemmen et al., 2016). Sea level rise
describes the
average increase
5.2 Coastal Squeeze marshes, mudflats, and 2018). These corridors in water due to
sand dunes from migrating control the migration melting glaciers,
Coastal squeeze is a term inward (Pontee, 2013). of displaced species, increasing water
that describes the inland Figure 15 shows three reducing the risk of wildlife temperature and
movement of coastal coastal squeeze situations in urban spaces. Educating geologic setting.
wetlands as sea level rises. including (a) where there is homeowners and Storm surge is
As environmental factors, no obstruction, (b) where developers about coastal a temporary
such as wind or waves, a barrier to migration is squeeze can help prevent rise in water
alter the landscape, coastal in place, and (c) where habitat loss by transitioning
occurring during
habitat will naturally a natural obstruction to commercial and residential
landward migration exists. lawns into natural coastal specific weather
reestablish further inland as
an extension of the existing Available plantings (Powell, 2018). conditions.
habitat. The progression of conservation techniques to By monitoring species Problematic
coastal squeeze depends protect ecosystems include movements and coastal situations arise
on the presence of hard coastal restoration and erosion, the negative when these two
infrastructure or natural development of migration impacts of coastal squeeze are combined.
barriers can prevent salt corridors (Borchert et al., can be reduced.
225.3 Storm Surge that have caused severe flood water storage, 5.4 Conclusion
damage to communities storm surge buffering and
Storm surge describes around the Bay of Fundy, coastal erosion control. Adaptations to protect
the temporary rise of such as the Saxby Gale of Research indicates that urban areas or relocate
water levels instigated by 1869 and the Groundhog storm surge amplitude infrastructure due to
severe weather conditions. Day Storm of 1976 where can be reduced by sea level rise are often
Often, a strong onshore tides rose up to 2.5 approximately one foot expensive and involve
wind combined with a metres above predicted for every 1.6 kilometres of collaboration between
low atmospheric pressure levels (Desplanque and vegetated wetland that multiple stakeholders.
system will intensify wave Mossman, 1999). When exists between a coast The challenges created by
amplitudes resulting in high water is experienced and urban development coastal erosion, coastal
shoreline flooding (Natural in combination with (NOAA, n.d.-b). In squeeze, and storm
Resources Canada, 2007). heavier annual situations where natural surge are site specific
Storm surge events pose precipitation the likelihood conservation will not and require long term
a significant financial risk of a 1 in 100-year flooding accommodate projected monitoring. As the water
to the City due to flood event from storm surge storm surge levels, levels rise, the City will
damage, road closures, increases (Public Health the City can use hard have to evaluate and
loss of property, habitat Agency of Canada, 2018). infrastructure (i.e. dykes prioritize the options for
loss, landslides, and debris Conservation of coastal and sea walls) to prepare maintaining the coastline
flow. habitats is a Climate for the coastal impacts. and relocating at-risk
There are several well Change adaptation infrastructure.
documented storm surges strategy that can provide
Predicting storm surge levels can be difficult, but there are tools available for early warning. For
instance, the Smart Atlantic Saint John Inshore Weather buoy has collected meteorological and
oceanographic data since 2015. The buoy enhances public safety and operational efficiency of
harbour activity by providing online access to real-time weather and directional wave data.
No Seawall Present - Saltmarsh Can Migrate Landward
Landward erosion of
seaward edge due to New marsh created
rising sea level
Seawall Present - Landward Migration Prevented
Sea wall Reclaimed land typically
prevents migration used for agriculture
Landward erosion of
seaward edge due to
rising sea level Habatat squeezed
Saltmarsh Sea wall
Naturally rising land - Landward migration prevented Naturally rising land prevents migratio n
Landward erosion of
seaward edge due to
rising sea level Habatat squeezed
Figure 15: Habitat migration scenarios under sea level rise: (a) No seawall is present and new marsh land is created, (b) A seawall
prevents migration and habitat is lost, (c) Naturally rising land prevents migration and habitat is lost (Savard et al, 2016).
UNDERSTANDING CLIMATE CHANGE IN SAINT JOHN 2324
6. FLOODING

Flooding is the most              6.1 Damage to Urban             naturally soak back into           least 30 cm below the
frequent natural disaster         Built Environment               the surface. This makes            lowest building openings,
in Atlantic Canada.                                               urban environments                 ensuring backup power is
Between 2007 and 2017             As discussed in Chapter         especially vulnerable to           available for wastewater
the Government of                 3, Climate Change is            flooding and puts pressure         pumping stations, building
New Brunswick spent               expected to increase            on stormwater systems              driveways to slope away
$185 million on disaster          precipitation resulting in      to transport the water             from homes and garages,
recovery primarily from           more frequent and severe        elsewhere. In Saint John,          installing backwater valves
flooding events. The Flood        flooding in Saint John.         facilities vulnerable to           in basements, and having
Risk Reduction Strategy           Adaptive approaches to          flooding include residential       heating, ventilation, and
for New Brunswick                 planning, development           and commercial buildings,          air conditioning (HVAC)
aims to build resilience          and infrastructure              sewage treatment,                  systems installed above
through accurate hazard           management can reduce           water services, power              grade to avoid destruction
identification, old               the damage associated           generation, industrial             or damage to property
infrastructure retrofits,         with flood events.              activity, communications,          (Moudrak and Feltmate,
new infrastructure                                                and healthcare services.           2017).
regulations, and informed                                               The City of Saint
mitigation practices                                              John can plan to reduce
                                  6.1.1 Grey Infrastructure
(GNB, 2014b). In Saint                                            flooding risks by adjusting
John, there are two types                                         building standards to
                                  The term grey
of flooding that can be                                           account for 1 in 100-year
                                  infrastructure is used to
expected: inland flooding                                         storm water levels. The
                                  describe infrastructure
from heavy precipitation                                          Intact Center on Climate
                                  that has low infiltration
and high river flows; and                                         Adaptation provides
                                  capacity and easily
coastal flooding due to sea                                       recommendations for
                                  becomes flooded
level rise or storm surge.                                        municipalities and
                                  during periods of high
This chapter will discuss                                         homeowners to reduce
                                  runoff (Depietri and
inland flooding in Saint                                          flooding in urban
                                  McPhearson, 2017).
John.                                                             spaces. A few of their
                                  Municipal infrastructure
                                                                  suggestions include:
                                  is mostly impermeable,
                                                                  designing roads to be at
                                  meaning water does not

Figure 16: Road closure during the 2019 spring freshet flooding   Figure 17: Grey infrastructure in Saint John includes roads,
of the St. John River (Photo: ACAP Saint John).                   bridges, railways, buildings, stormwater drainage, and sewers.
                                                                  These images depict the low infiltration capacity in urban areas
                                                                  (Photo: ACAP Saint John).

                                                                                     UNDERSTANDING CLIMATE CHANGE IN SAINT JOHN   25
6.1.2 Green Figure 18: In 2019, ACAP
Infrastructure Saint John installed a
rain garden on Queen
Square West as a pilot
Green infrastructure, also project for the City.
known as Low Impact Green infrastructure can
Development (LID), include implementing
refers to stormwater rainfall capture systems,
management methods permeable pavement,
that promote infiltration green roofs, bioswales,
and retention rather than and rain gardens (Photo:
methods that focus on ACAP Saint John).
directing surface runoff
into water treatment
facilities, storage ponds, or natural asset restoration 6.1.3 Hybrid Approach infrastructure) to be the
natural systems (Buckland- can be more cost most effective at reducing
Nicks, 2016). Studies effective to maintain then risk in complex urban
The value of grey and
have shown that green engineered structures systems. An example of
green climate adaptation
infrastructure significantly (Depietri and McPhearson, this hybrid approach is
solutions has been
mitigates flooding risk in 2017). Besides the cost, a wetland restoration
assessed by researchers
urban spaces (Depietri the co-benefits of natural coupled with engineering
Depietri and McPhearson
and McPhearson, 2017). In assets include a range of measures (i.e. a small
(2007), who highlight
watersheds with greater ecosystem services that levee, bioswales, rain
the dependence of cities
than 25% impermeable provide flood and erosion gardens, green roofs, or
on natural ecosystems
surfaces, the likelihood control, heat moderation, street trees) to enhance
for urban disaster risk
of a 1 in 100-year flood is pollination, carbon dioxide flood protection while
reduction. The findings
increased to a likelihood of storage, and enhancement taking advantage of low
suggest a hybrid approach
1 in 5 (Trice, 2017). of community well-being. impact development
(green infrastructure
For municipalities, (Table 1).
integrated with grey
green infrastructure and
Hybrid or mixed
Grey Green and Blue
approaches
Blend of biological- Biophysical,
Hard, engineering physical and Ecosystems and their
structures engineering structures services
Allows for some Mainly relying on
Very limited role of ecosystem functions existing or restored
ecosystem functions mediated by ecosystem fuctions and
technological solutions water bodies
e.g. biowales; porous e.g. wetlands
e.g. canals, pipes and pavement; green restoration; installation
tunnels of the drainage roofs; rain gardens; of grass and riparian
system; dikes; constructed wetlands; buffers; urban trees;
wastewater treatment Sustainable Urban stream restoration;
plants; water filtration Drainage Systems rivers, lakes, ponds,
Table 1: Grey, hybrid,
plants or green and blue
(SUDS) oceans and seas infrastructure adaptation
options (Depietri and
McPhearson, 2017).
266.2 Planning for result including property
Flooding damage or contamination
from combined sewer
Flood risk mapping overflows. Green or hybrid
technologies can be used infrastructure approaches
to estimate the extent are recommended as
of potential flooding proactive adaptation
under different scenarios. practices.
These resources are
extremely useful for
emergency preparedness
and adaptation planning.
The Climate Change
Adaptation Plan for Saint
John by ACAP Saint John
will use flood risk mapping
to identify roadways,
residential and commercial
lots, industrial sites, and
other areas at risk for
flooding. These maps can
be used by the City to limit
development in at-risk
areas.
Aside from
development restrictions
in flood-prone areas,
early warning systems
play an increasingly
important role in flood risk
preparedness. The New
Brunswick Emergency
Measures Organization
(NB EMO) has developed
a River Watch program to
alert residents to potential
flooding events and
provide a flood forecasting
system to predict high
water levels on the
Wǝlastǝkw (St. John River)
up to two days in advance.
6.3 Conclusion
In the coming century,
Saint John will experience
higher river flows and
heavier precipitation
creating flooding
challenges that we are not
currently prepared for.
Flood risk mapping will
play a significant role in
restricting development
and building awareness
for homeowners living in
floodplains. Adaptation
is required to reduce the
negative impacts that can
UNDERSTANDING CLIMATE CHANGE IN SAINT JOHN 2728
7. URBAN WATER QUALITY AND SECURITY

The quality and availability   world (Giudice & Broster,     in precipitation patterns       7.2.1 Cyanobacteria
of drinking water is of        2006). This has a direct      can diminish freshwater
primary concern for            effect on human health        supplies (Government            Cyanobacteria, sometimes
municipalities who rely        and industrial sectors        of New Brunswick,               referred to as blue-green
on local aquifers and          (including agriculture,       n.d.). Warmer annual            algae, has been observed
surface ponds to sustain       forestry, and fisheries)      temperatures and lower          in New Brunswick
residential needs. In Saint    resulting in increased        summer river levels             waterways, and can
John, drinking water is        demand on freshwater          can alter water quality,        release cyanotoxins which
sourced privately from         resources. In Saint           creating more favourable        are toxic to both humans
wells or through Saint         John, surface reservoirs      conditions for bacterial        and animals. Exposure
John Water, which is           for drinking water are        growth and harmful algal        can result in itchy
sourced from surface           monitored for saltwater       blooms (HABs). As well,         eyes and skin, rashes,
reservoirs in Spruce Lake      intrusion.                    increased stormwater            blisters, nausea, fever,
and Loch Lomond.                     Various strategies      runoff can introduce            vomiting, gastrointestinal
                               can be employed by local      pollutants, viruses, and        issues, headaches, and/
                               governments in areas          sewage backup into              or dizziness (NBDELG,
   According to the            impacted by saltwater         drinking water reservoirs       2018b). If drinking
   United Nations,             intrusion. Desalination       (Fann et al., 2016).            water reservoirs are
                               plants are facilities where         In Saint John,            contaminated by
   water security is
                               salt and minerals are         flooding of stormwater          cyanobacteria, the water
   the capacity of             removed from saline           systems can cause               is unsafe for consumption
   a population to             water. City planners may      combined sanitary and           until the bloom has
   ensure sustainable          favour relocation and         stormwater systems to           subsided. Using water
   access,                     changes to zoning laws        backup and contaminate          contaminated with
   availability and            over desalination because     waterways. After a              cyanobacteria to bathe,
   quality of water            of its costliness which       heavy rainfall, faecal          wash clothes, or clean
   necessary to                is estimated to $0.25 to      coliform levels are             is not recommended.
   “sustaining                 $0.50 per resident per        commonly observed above         In addition, fish from
   livelihoods,                day in Canada (Université     recommended guidelines          contaminated waters
                               Virtuelle Environnement       (ACAP Saint John,               should not be consumed.
   human well-
                               et Développement              2017). Increased effort         Monitoring and education
   being, and                  Durable, 2016). Saltwater     to separate combined            around cyanobacteria is
   socio-economic              intrusion is a growing        sewer infrastructure and        necessary to ensure the
   development,                concern in Saint John,        monitoring of waterways         safety of residents in Saint
   for ensuring                specifically the West Side    are actions required to         John.
   protection against          drinking water supply. By     improve water quality in
   water-borne                 observing invasive species,   Saint John. Processing
   pollution and               groundwater quality, and      water through a treatment       7.3 Ocean Warming and
   water-related               changes in coastal habitats   facility can reduce             Acidification
   disasters, and              and species, City officials   hazards in municipal
                               could be alerted about        drinking water sources.         Similar to the atmosphere,
   for preserving
                               changes in the saltwater-     However, when detected,         Earth’s oceans absorb
   ecosystems”                 freshwater interface          toxins can be costly to
   (United Nations                                                                           CO2 from the atmosphere.
                               before the most severe        remove (United States           As a result of increased
   Water, 2013).               impacts are felt.             Environmental Protection        GHG emissions, excess
                                                             Agency, 2018). Routine          CO2 dissolves in oceans
                                                             monitoring is undertaken        where it breaks down to
7.1 Saltwater Intrusion        7.2 Water Quality and         by Saint John Water to          carbonic acid, carbonates
                               Availability                  reduce health hazards that      and bicarbonate. Higher
Saltwater intrusion occurs                                   can result from exposure        CO2 quantities have
when seawater enters into      Other than saltwater          or consumption.                 caused ocean acidity to
the coastal groundwater        intrusion, changing climate                                   rise by 30% since the
system and is a recognized     conditions pose significant                                   beginning of the industrial
hazard to coastal              risk to urban water quality                                   revolution (Université
communities around the         and availability. Changes                                     Virtuelle Environnement et

                                                                             UNDERSTANDING CLIMATE CHANGE IN SAINT JOHN   29
You can also read