Revealing time's secrets at the National Theatre of Costa Rica via innovative software for cultural heritage research
←
→
Page content transcription
If your browser does not render page correctly, please read the page content below
www.nature.com/scientificreports
OPEN Revealing time’s secrets
at the National Theatre of Costa
Rica via innovative software
for cultural heritage research
M. D. Barrantes‑Madrigal1,2, T. Zúñiga‑Salas3, R. E. Arce‑Tucker4, A. Chavarría‑Sibaja2,5,
J. Sánchez‑Solís6, J. Mena‑Vega5, K. Acuña‑Umaña2,5, M. Gómez‑Tencio1, K. Wang‑Qiu3,
F. Lizano‑Sánchez1, C. Marín‑Cruz7 & O. A. Herrera‑Sancho2,5,8,9*
Establishing affordable, efficient, accessible, innovative, and multidisciplinary methodologies to
the diagnosis of the conservation state of an artwork is key to carry out appropriate strategies of
conservation and consequently to the creation of modern public policies on cultural heritage. Limited
access to large-format paintings is a challenge to restoration scientists seeking to obtain information
quickly, in a non-destructive and non-invasive manner, and identify regions of interest. Therefore, we
put forward two unique software tools based on multispectral imaging techniques, with the long-term
aim to assess the artist’s intentions, creative process, and colour palette. This development paves
the way for a comprehensive and multidisciplinary understanding of the mysteries encompassed in
each pictorial layer, through the study of their physical and chemical characteristics. We conducted
the first ever study on Musas I and Musas II, two large-format paintings by Italian artist Carlo Ferrario,
located in the National Theatre of Costa Rica. In this study, we used our novel imaging techniques to
choose regions of interest in order to study sample layers; while also assessing the works’ state of
conservation and possible biodeterioration. We explored the applications of our two versatile software
tools, RegionOfInterest and CrystalDistribution, and confirmed paint stratigraphies by means of
microscopy and spectroscopy analyses (OM, SEM-EDX, Fluorescent microscopy, FTIR-ATR and micro-
Raman). In a pilot study, we identified the artist’s main colour palette: zinc white, lead white, chrome
yellow, lead read, viridian, along with artificial vermilion and ultramarine pigments. We were able to
identify artificial vermilion and ultramarine and distinguish them from the natural pigments using
CrystalDistribution to map the average size and diameter of the pigment crystals within the paint
layers. This study demonstrated that software-based multidisciplinary imaging techniques are novel
in establishing preventive and non-invasive methods for historical painting conservation studies, in
addition, this study provides tools with great potential to be used in the future in applications such as
virtual restoration.
Art opens a window into the historical context in which it was created. Studying the paintings of a popula-
tion offers insight into its culture, history and origins. In order to protect these expressions of individual and
collective identity, scientists have set about conserving and restoring works of art. In the case of large-format
paintings, today’s conservation efforts demand affordable, effective, accessible, innovative, and multidisciplinary
methodologies1,2. Typically, conservation studies involve chromatography, microscopy, spectroscopy and electro-
chemical techniques2,3, alongside biological analyses to identify: material c omposition4, painting technique, and
1
Escuela de Química, Universidad de Costa Rica, 2060 San Pedro, San José, Costa Rica. 2Centro de Investigación
en Ciencias Atómicas Nucleares y Moleculares, Universidad de Costa Rica, 2060 San Pedro, San José, Costa
Rica. 3Escuela de Artes Plásticas, Universidad de Costa Rica, 2060 San Pedro, San José, Costa Rica. 4Facultad de
Microbiología, Universidad de Costa Rica, 2060 San Pedro, San José, Costa Rica. 5Escuela de Física, Universidad
de Costa Rica, 2060 San Pedro, San José, Costa Rica. 6Escuela de Ingeniería Eléctrica, Universidad de Costa Rica,
2060 San Pedro, San José, Costa Rica. 7Teatro Nacional de Costa Rica, San José 5015‑1000, Costa Rica. 8Centro
de Investigación en Ciencia e Ingeniería de Materiales, Universidad de Costa Rica, 2060 San Pedro, San José,
Costa Rica. 9Instituto de Investigaciones en Arte, Universidad de Costa Rica, 2060 San Pedro, San José, Costa
Rica. *email: oscar.herrerasancho@ucr.ac.cr
Scientific Reports | (2021) 11:8560 | https://doi.org/10.1038/s41598-021-88066-1 1
Vol.:(0123456789)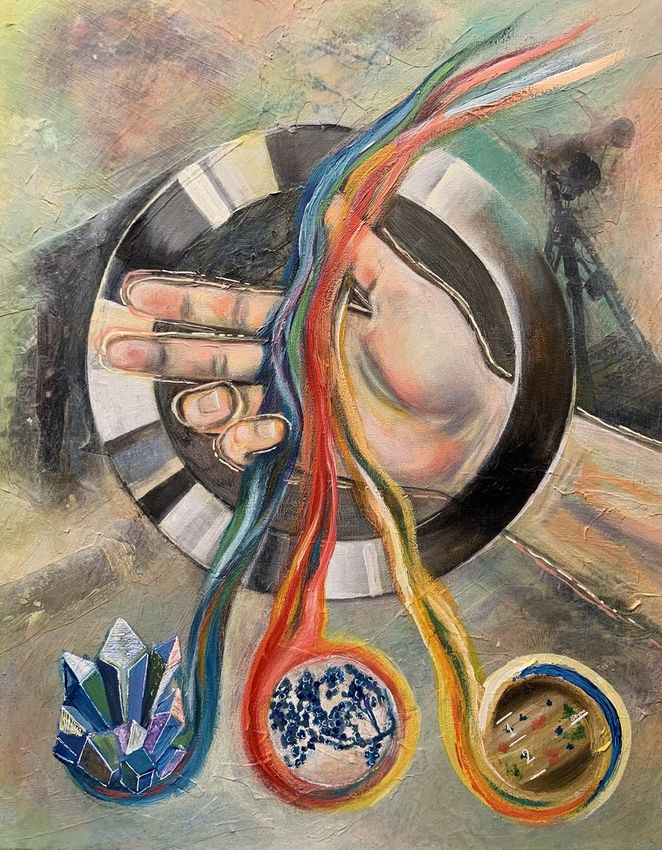
www.nature.com/scientificreports/
microscopic damage1,3. Microscopy and spectroscopy techniques have been widely used to examine the stratig-
raphy and composition of materials2,4 in small painting samples5. These techniques are efficient and accurate, but
the equipment is very costly2, opportunities for sample acquisition are limited, and results obtained for specific
samples cannot be applied to the painting as a whole in large-format works6. Limited access represents a further
drawback, as restoration scientists are challenged to obtain sufficient information quickly, in a non-destructive,
and non-invasive manner, when identifying regions of interest.
Optical imaging is a major area of development in artwork diagnostics. Novel imaging tools such as pho-
toacoustic imaging7 and CT-scanning8 have recently been used to study otherwise inaccessible features of art
objects. In this study we used Multispectral Imaging (MSI), an affordable, non-invasive and non-destructive
technique which relies on a photography system to map and identify pigments, binders, and retouched areas of
the paintings9. MSI allowed us to verify the painting technique and evaluate the current state of the paintings,
including damage and possible r estorations1,10. In order to quantitatively examine the colours, most studies
have recreated reflectography spectra for a selected painting region using MSI; however, the main drawback of
this technique is that it requires many filters and it is very time-consuming9,10. Nowadays, MSI can be coupled
with computational tools, although in most cases, this is used to simulate r estoration11 and improve the image
quality12,13. Nonetheless, there is still an evident need for new quantitative MSI techniques to assess the artist’s
intentions, creative process, and colour palette used in the artworks.
This paper presents two novel computational tools: RegionOfInterest and CrystalDistribution, which we believe
to be versatile and accessible elements for non-invasive conservation studies worldwide, particularly in the case
of historical paintings and virtual restoration. With these advanced computational tools we are able to gather
otherwise hidden information on works of art; such as the number and size of pigment crystals in a given area.
This analysis reveals specific characteristics of the pigments in a work; for example, if they are of natural or arti-
ficial origin. Using these multispectral imaging techniques, we are also able to obtain quantitative luminosity
data from MSI. The RegionOfInterest program can accurately calculate luminosity intensity within user-selected
regions in a photo of the painting, and can outline all the areas of the painting that present a given intensity
value. This should prove to be a useful tool for artistic and heritage studies with both micro and macroscopic
approaches, since it can identify the pigments used in a simple sample and then identify all regions of interest in
the artwork where that pigment may be present. More specifically, we believe these tools represent an important
step forward in restoration efforts and preventive methods, since they allow for guided microbiological sampling,
even before fungi have caused visible damage. Using these computational tools in a pilot study, regions of interest
were isolated from the rest of the artwork in order to study stratigraphies of individual samples and carry out
microbiological sampling, alongside environmental monitoring of the painting’s surroundings, as these are key
factors for efficient modern public policies in cultural h eritage1.
Art conservation is a complex process that has traditionally relied on both micro and macroscopic techniques,
involving a comprehensive and multidisciplinary understanding of a work’s physical and chemical characteristics.
Figure 1 outlines our vision of how to systematically tackle the complexity of large-format works. This investiga-
tion approaches large-format paintings through a multi-analytical study (MAS) which includes MSI analyses,
microscopic, spectroscopic, microclimate and microbiological analyses, coupled with novel computational tools.
Thus, the main objective of the present study is to establish a baseline diagnostic of the state of conservation of
paintings Musas I and Musas II by painter Carlo Ferrario, located in the National Theatre of Costa Rica (NTCR),
using advanced computational imaging techniques to carefully choose regions of interest.
A multidisciplinary approach has been used to great effect on previous art conservation studies. For instance,
a study in Linares, Spain combined the use of Energy Dispersive X-ray Fluorescence (µEDXRF), surface map-
ping and single-spot micro-Raman spectroscopy to identify the chemical composition of pigment layers in wall
paintings at the Cóstulo s ite14. Another MAS was carried out on the large-format painting Marriage at Cana by
Italian artist Luca Longh, located in Ravenna, Italy, to identify its technique and state of conservation1. This study
revealed the materials used in the work, and that it was executed using the dry painting technique. This MAS
shed light on how restoration had been conducted, and biological analyses identified the Eurotium halophilicum
fungus damaging the painting. This information was vital to the cleaning and restoration processes. Our study
has similar objectives: to contribute significantly to the conservation of the paintings Musas I and Musas II, by
another Italian painter; the essential difference being that target regions were precisely knitted within the artworks
which are located in Central America.
Historical context. The construction of the National Theatre of Costa Rica (NTCR) (begun in 1891 and
completed in 1897) stood as a symbol of the growing coffee oligarchy in Costa R ica15, for its building, were hired
engineers, architects, painters, sculptors, and decorators from Europe, particularly from Italy16. The subjects of
this study are Musas I (2.96 m (w), 6.17 m (h)) and Musas II (2.96 m (w), 6.17 m (h)), two large-format paintings
by artist Carlo Ferrario, emplaced on the ceiling roughly 3.5 m above the ground and originally located in the
men’s canteen inside the theatre16, see Fig. 2a (top) and Fig. 2a (bottom). Born in Milan in 1833, Ferrario had
extensive experience as a designer, decorator, and painter of scenery and curtains in prestigious Italian theatres.
Although he painted Musas I and Musas II in his workshop in Italy16, he came to Costa Rica to assist in the
decoration of the NTCR and settled in once he finished the work at the NTCR16. There are reports that Musas I
and Musas II have been previously restored, however there are no descriptions or documentation of the type of
work performed. In previous studies of artwork at the NTCR, we were able to examine only a limited number of
samples, without first identifying areas of interest17,18. This is the first time we have had the opportunity to take
a comprehensive, multidisciplinary approach.
Tropical countries raise different challenges about the conservation and restoration of paintings. Art pieces
imported into Latin America are more likely to be affected by the effects of temperatures and humidity of the
Scientific Reports | (2021) 11:8560 | https://doi.org/10.1038/s41598-021-88066-1 2
Vol:.(1234567890)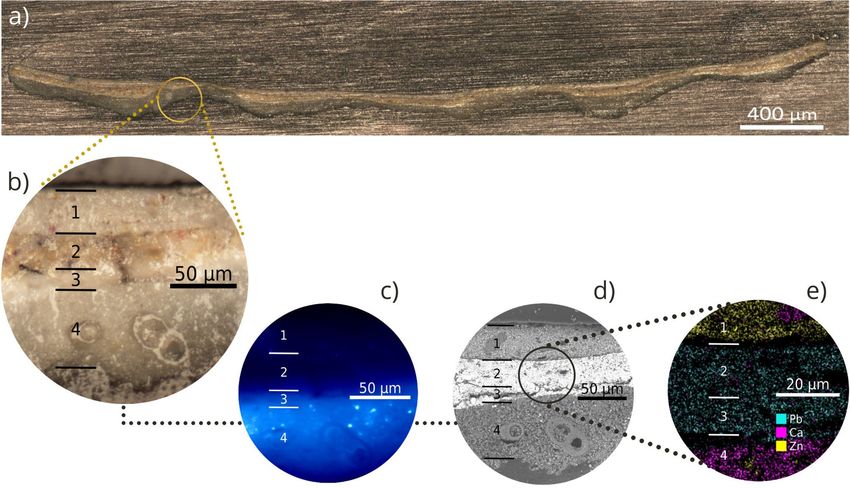
www.nature.com/scientificreports/
Figure 1. In the flow of time. This original painting tells the story of the study, describing our journey as we
delve into the hidden secrets behind large-format artworks. A fluctuating and changing process, our multi-
analytical study’s use of novel software tools and multispectral imaging allowed us to fantasize, even for a
second, that we could stop the passage of time and capture the artist’s creative process, both materially and
conceptually. As the colours flow through our fingers, we perceive individual pigment crystals, sense the damage
caused by the passage of time, understand the materials and layers that come together to form the painting, and
almost hear the artist’s voice as we unveil his intentions. Although created using contemporary techniques such
as acrylic and collage on canvas, this piece was inspired by Carlo Ferrario’s creative process. His colour palette
influenced our own, as we selected pigments found in Musas I and Musas II such as ultramarine blue, vermilion,
and white. Our painting is structured similarly to Ferrario’s, with two layers of ground, two layers of paint, and
a final layer of varnish. Art, like history and time, slips inexorably through our fingers. Today, we capture in this
study an instant of that flow, gaining new perspectives and revealing some of the hidden secrets behind large-
format paintings.
tropics. There are many studies on the conservation and restoration of large-format artworks, involving the
techniques discussed above, but they took place in Europe1,19–22 and did not address tropical factors. There are
even fewer restoration protocols suited to the works in question. Deterioration caused by tropical conditions is
still largely unstudied, underscoring the importance of the present investigation.
This article describes the study of paintings Musas I and Musas II through a multi-analysis approach that
includes: (1) MSI coupled with novel computational tools for image analysis, (2) microscopy and spectroscopy
analyses with the development of custom software to identify the size of pigment crystals observed in stratigra-
phies of the samples, (3) microbiological analysis for fungi identification in previously defined regions of interest,
and (4) monitoring of environmental conditions in the paintings’ surroundings, in order to present a general
diagnostic of the paintings.
Results
Carlo Ferrario painted Musas I and Musas II 123 years ago. Today, we contemplate our heritage and wonder:
what story is woven into these paintings? What secrets lurk in each brushstroke, pigment, fiber and crack in the
canvas? Why did the artist choose each material? Figure 1 symbolizes our multi-disciplinary approach to these
questions, as we draw on diverse fields of study, tools and techniques to better understand the paintings’ history
and assess their current state of conservation. It is important to note that restoring large-format paintings does
not seek to turn back time or erase h istory23, but rather to preserve it for future generations.
More than meets the eye: multispectral imaging. Multispectral imaging (MSI) reveals information
difficult or impossible to see with the naked eye, especially useful with large-format paintings, where exhaustive
in-person examination may not be practical. Figure 2 (top) and Figure 2 (bottom) show multispectral images of
Scientific Reports | (2021) 11:8560 | https://doi.org/10.1038/s41598-021-88066-1 3
Vol.:(0123456789)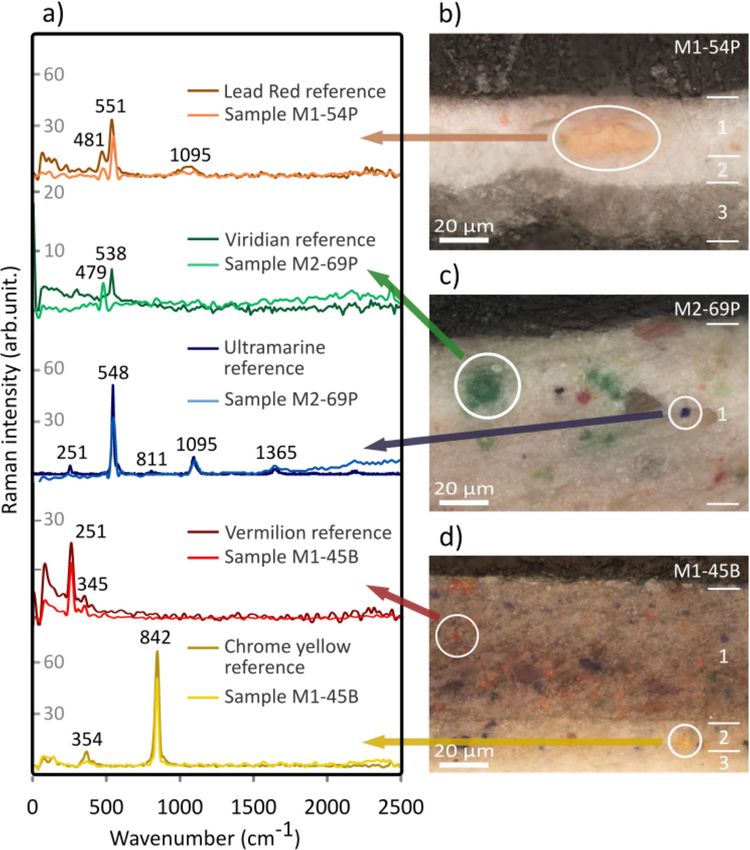
www.nature.com/scientificreports/
Figure 2. Six views at once: multispectral imaging of Musas I (top panel) and Musas II (bottom panel), (a)
Visible (VIS), (b) infrared (IR), (c) infrared false colour (IRFC), (d) ultraviolet fluorescence (UVF) and (e)
ultraviolet reflectance (UVR) multispectral images of Musas I and Musas II and (f) sample locations on the grid.
The M1-XXY codification of sample names indicates: M1 = Painting Musas I, M2 = Painting Musas II, XX =
location on the grid, Y = visible colour of the sample (B = blue, R = red, P = pink, W = white).
Musas I and Musas II, respectively. Five spectral regions are shown: visible (VIS) in Fig. 2a (top) and Fig. 2a (bot-
tom), infrared (IR) in Fig. 2b (top) and Fig. 2b (bottom), infrared false colour (IRFC) in Fig. 2c (top) and Fig. 2c
(bottom), ultraviolet fluorescence (UVF) in Fig. 2d (top) and Fig. 2d (bottom), and ultraviolet reflected (UVR)
in Fig. 2e (top) and Fig. 2e (bottom). VIS images show that Musas I and Musas II are complex systems of detailed
artistry, including myriad colours, glazes, textures and brushstrokes, some of which may be a product of restora-
tion efforts. The materials interact with one another and with environmental factors over time, as the paintings
have been mounted on a wooden ceiling for more than 120 years. We can observe some damage in Fig. 2a (top)
and Fig. 2a (bottom). Infrared images in Fig. 2b (top) and Fig. 2b (bottom) show inner layers of the paintings,
because some external layers do not absorb infrared radiation, rendering them transparent1. Other materials
Scientific Reports | (2021) 11:8560 | https://doi.org/10.1038/s41598-021-88066-1 4
Vol:.(1234567890)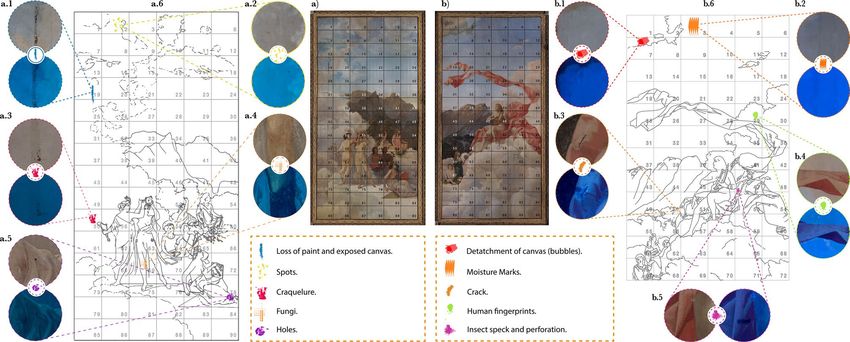
www.nature.com/scientificreports/
Figure 3. A closer look: Execution of RegionOfInterest software. (a) The program opens the image for general
user inspection. (b) In the first stage, the user zooms in on a region of interest. (c) The user hand-draws a
contour to select the area for analysis. (d) The program converts the selected pixels from HSV to Intensity space
and automatically generates a “Counts vs Intensity” histogram indicating pixel intensity distribution ranging
from 0 to 255. (e) In the second stage, the user chooses the range from the first histogram. (f) Pixels in the full
image that fall within this intensity range are displayed in a new colour image. (g) A second intensity histogram
is generated, comparing the intensity distribution of all pixels in the original image (blue line) with that of the
selected pixels in the new image (orange line). Note that the y-axis shows different scales for the blue and orange
curves, left and right, respectively.
appear dark, such as the dress of the Muse holding the Earth in Musas I, see Fig. 2b. Pigments in this area absorb
infrared radiation24, while the reflective pigments opposite them look b
righter24. IRFC images combine channels
from both VIS and infrared images, revealing particle pigment behaviours.
UVF shows the fluorescence of each material. Varnish usually fluoresces strongly, overshadowing pigment
fluorescence25. This effect is not observed in Musas I and Musas II (Fig. 2d (top) and Fig. 2d (bottom)) because
the varnish was removed with ammonia in 1997, according to NTCR reports. The UVF pictures also show: the
exposed canvas; brighter areas of the clouds may indicate the use of different binders; stains caused by insects or
microorganisms; and possible areas of restoration, such as the white cloud behind the head of the main character
on Fig. 2d (top). Meanwhile, UVR (Fig. 2e (top) and Fig. 2e (bottom)) provides information on the outermost
layers24 and biological staining. UVR was used primarily to identify white p igments1,2. Titanium and zinc white
2
appear dark, while lead and lithopone appear bright , so we can infer that the bright regions in Fig. 2e (top) and
Fig. 2e (bottom) correspond to lead white or lithopone.
Deeper secrets in heritage research: developing software for closer analysis. Further MSI anal-
yses are needed to reveal underlying layers, sketches and corrections, possible previous restoration and other
regions of interest. We believe software based on multispectral imaging can offer a new perspective in the study
of art. We developed RegionsOfInterest to classify colour luminosity, showing chromatic distributions in large-
format works. This is relevant to art history, art restoration, and even an artist’s creative process.
Figure 3 illustrates the RegionsOfInterest tool, developed specially for restoration scientists:
• The user uploads an image of the artwork in .jpg, .png, etc, see Fig. 3a.
• The user selects a sample area. The colours from this area will be mapped to the artwork as a whole, in order
to determine the spatial distribution of areas of interest such as colour, pigment and other zones (see Fig. 3b
and Fig. 3c).
• The histogram in Fig. 3d shows this region’s intensity values.
• RegionsOfInterest displays regions in the specified intensity range on the artwork as a whole, see Fig. 3f.
• Lastly, Fig. 3g shows an increase in the number of pixel intensity counts for this region.
Scientific Reports | (2021) 11:8560 | https://doi.org/10.1038/s41598-021-88066-1 5
Vol.:(0123456789)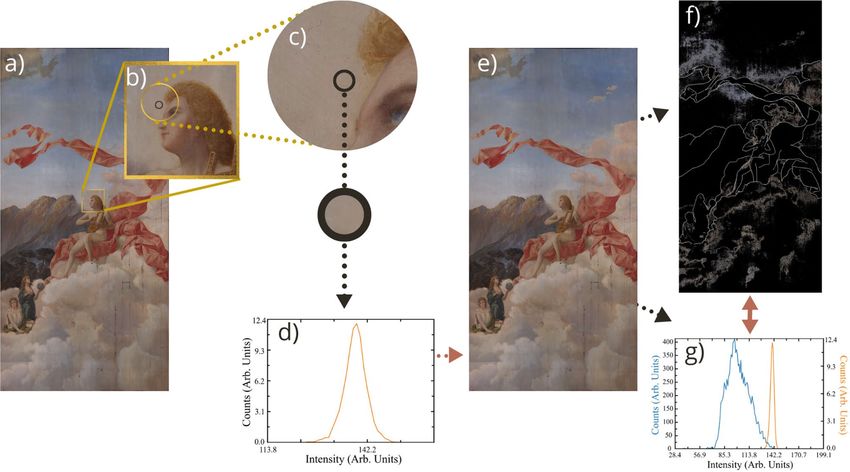
www.nature.com/scientificreports/
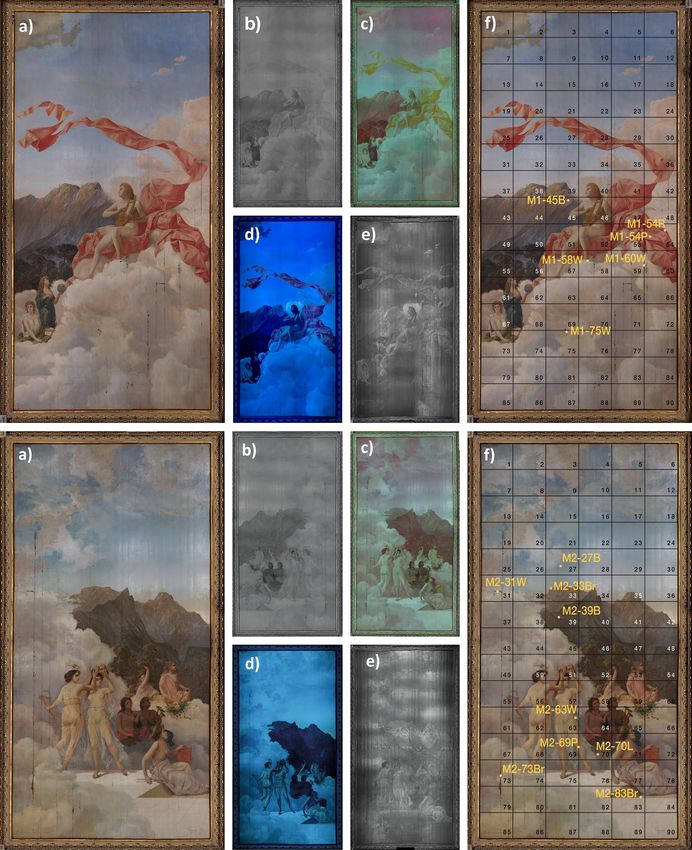
Figure 4. Through the lens: Stratigraphy of a 120-year-old large-format painting. (a) Panoramic Optical
Microscopy (OM) image of the cross-sectioned sample M1-75W, observed by reflected visible light at 5X. (b)
Detail of the sample observed by MO at 20X showing the main layers: (1) Top paint layer, (2) Intermediate paint
layer, (3) Second ground layer, (4) First ground layer. (c) Fluorescence Microscopy showing fluorescent particles
in layer 4. (d) Scanning Electron Microscopy (SEM) showing the area analyzed by SEM-EDX using the mapping
tool. (e) The main elements in each layer.
The software can be used to systematically select regions of interest for comprehensive and efficient non-invasive
sampling, for conservation diagnostics. This novel and time-saving tool has three applications:
1. Comparing colour intensity behaviours
Firstly, we characterized a range of whites, which appear to be the most abundant colour in the artwork.
Analysis of 11 regions in Musas I using RegionsOfInterest resulted in a pixel intensity value of approximately
132 ±12. Since similar values are obtained for white regions containing similar compounds, intensity analy-
sis software is a useful tool during the composition stage of the creative process. For instance, the artist
can establish a more complete and complex colour palette based on colour saturation by analyzing colour
intensity distribution with RegionsOfInterest.
2. Revealing the colour palette
Secondly, following visual analysis of the painting and colour palettes prevalent at the time, we hypoth-
esized that all colours in the paintings were obtained by mixing approximately 12 original pigments. As a
proof-of-principle, we observe the work in detail and focus on finding the different colours and places where
it would be most likely to find them, after that we analyzed the paintings with the RegionsOfInterest program
to identify colour distributions that could provide insight into the artist’s palette. We examined six colour
intensities (yellow, red, blue, green, brown, and white). On average, yellow was the most prevalent, at about
20% abundance, while green was the least, at only 1%. The single most striking observation was that these
colour intensities make up 50% of Musas I and 30% of Musas II. This application could be useful in other
case-studies, to identify an artist’s main palette and the agents responsible for deterioration.
Figure 4 illustrates stratigraphies of the sample M1-75W (for sample information, please refer to Table 1),
collected from Musas I using our software to identify regions of interest, and analyzed through microscopy
and spectroscopy (OM, SEM-EDX, and fluorescent microscopy). A total of 15 samples analyzed (6 from
Musas I and 9 from Musas II) displayed similar structures made of up of four l ayers26, see Fig. 4b, which we
identified as: (1) top paint layer, (2) intermediate paint layer, (3) second ground layer, and (4) first ground.
We further analyzed the first ground using FTIR-ATR and identified distinctive bands of calcite from calcium
carbonate: C–O symmetric stretching (at 2523 cm−1, 1802 cm−1), C–O asymmetric bending (at 1627 cm−1),
C–O asymmetric stretching (at 1392 cm−1), C–O symmetric stretching (at 1090 cm−1), C–O asymmetric
bending and C–O symmetric bending (at 712 cm−1)27. This compound was widely used as a ground material
during the nineteenth c entury26. We were also interested in a unique morphology of foraminifera: prehistoric
marine invertebrates which turned out to be an important source of calcium carbonate, CaCO326. Addition-
ally, Fig. 4c shows fluorescent particles observed through inverted fluorescence microscopy, discussed in the
Scientific Reports | (2021) 11:8560 | https://doi.org/10.1038/s41598-021-88066-1 6
Vol:.(1234567890)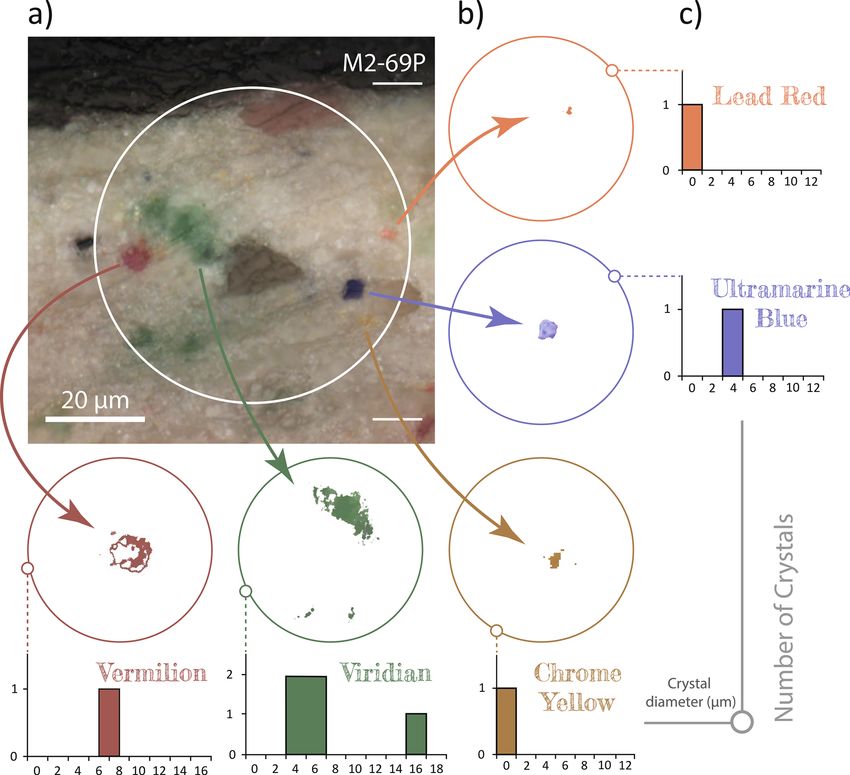
www.nature.com/scientificreports/

                                  Figure 5.  Between particles: measuring crystals with CrystalDistribution software. (a) The user opens a
                                  microscope image and select the region containing crystals of interest. (b) The program applies masks or “cuts”
                                  identifying the crystals and saves the images. Each image shows the crystals of a specific colour. (c) The program
                                  calculates the crystals’ area and diameter, and generates a histogram for each colour.

                                      forthcoming section. The elemental composition of each layer identified by SEM-EDX is shown in Fig. 4d,
                                      e, respectively. We found that, generally, the top paint layer contains an important amount of zinc; layers 2
                                      and 3 contain mostly lead; and the first ground consists of calcium from calcium carbonate, as expected. As
                                      we found about 44% of zinc in some regions of the ground layer, we hypothesize that the ground contains
                                      zinc white pigment mixed with calcium carbonate.

                                      To the best of our knowledge, there has been no systematic study of the colour palette used by Carlo Ferrario.
                                  In order to contextualize his creative process, we studied the pigments from both the pictorial and ground layers.
                                  The density of crystals in an area of approximately 2000 µm 2 was arbitrarily categorized as follows: fewer than
                                  4 crystals was considered low density, 4–20 crystals medium density, and more than 20 crystals high density.
                                  The average diameter of the crystals was calculated using our custom CrystalDistribution software, see Fig. 5,
                                  which shows how each colour was analysed individually to determine crystal size and quantity. We employed
                                  micro-Raman spectroscopy to identify the chemical composition of these pigments, see Fig. 6a. The measured
                                  spectra were compared to reference pigments from the Cultural Heritage Science Open Source Pigments Checker
                                  (CHSOS).
                                      Lead red
                                      Lead red pigment in Musas I was likely used in areas that appear light red, such as the cloak and other red-
                                  dish–pink clothing and ornaments. Microscopically, large light red with some orange hue crystals were found
                                  in the paint layer of sample M1-54P which is located in one of the lighters sections of the mantle, see Figure 2g
                                  (top). The cross-section of this sample shows a low density of crystals with an average diameter of about 21 µm,
                                  see Fig. 6b. Lead red, applied over other base colours, such as vermilion, has been commonly used since the

Scientific Reports |   (2021) 11:8560 |                https://doi.org/10.1038/s41598-021-88066-1                                                  7

                                                                                                                                             Vol.:(0123456789)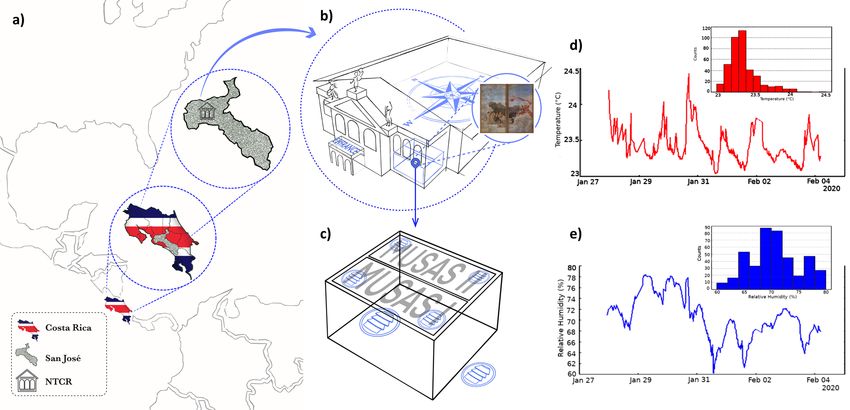
www.nature.com/scientificreports/
Figure 6. In low frequency: Raman spectroscopy of the pigments. (a) Comparison of Raman spectra for
reference pigments and those of the samples. (b) Orangey–pink crystal from sample M1-54P corresponds to
lead red, (c) Green and blue crystals from sample M2-69P correspond to viridian and ultramarine, respectively.
(d) Red and yellow crystals from sample M1-45B correspond to vermilion and chrome yellow, respectively.
middle-ages to give the effect of silk cloth28. Ferrario may well have used this technique. Figure 6a presents
Raman spectra of this crystal, showing characteristic components of lead red, in particular the Pb–O vibrational
modes29 at 550 cm−1.
Viridian
Viridian pigment could be found in green tones in the mountains, background and forest area. Interestingly,
among all the samples under study, only M2-69P shows green crystals in its paint stratigraphy, see Fig. 6c. Low
density of these crystals was observed in the paint layer, with an average diameter of roughly 5.1 µm, see Fig. 5c.
Michelangelo used an underlayer of green earth and viridian to create the effect of light30. Ferrario may have used
the related verdaccio method, in which a neutral colour, usually green, is applied in underpainting for outlining
and shading31. Raman analyses identified the green crystals as viridian, with a reference signal at 538 cm−1 for
chrome III oxide, Cr 2O332, see Fig. 6a. However, the samples’ spectra showed a signal at 479 cm−1 generated by
the Cr(VI)–O stretching m ode33 of dihydrated chrome III oxide Cr 2O3.2H 2 O, the major component of viridian.
Developed in 1 83834, this pigment was very expensive until a French chemist devised an alternate production
method in 1859, making it more accessible to contemporary a rtists34.
Scientific Reports | (2021) 11:8560 | https://doi.org/10.1038/s41598-021-88066-1 8
Vol:.(1234567890)www.nature.com/scientificreports/
Ultramarine
Blue pigment is most evident in the sky areas of both Musas I and Musas II as well as a glimpse of blueish
highlights in the mountain areas. Most of the samples contain low density of blue crystals. Figure 2f (top) shows
the sample with the bluest colour, dark violet, with medium density of blue crystals in layers 1 and 2. The aver-
age diameter of these crystals is approximately 2.0 µm, see Fig. 5c. The average size of the crystals indicates that
Ferrario most likely worked with synthetic low-cost ultramarine rather than the expensive natural pigment. As
expected, the Raman spectra for these crystals coincides with the spectra of both natural and artificial ultra-
marine pigments of the CHSOS, see Fig. 6a. The mineral lazurite is an aluminosilicate of approximate formula
(Na,Ca)8(AlSiO4) 6 (SO4,S,Cl) 235, which is often associated with other silicate minerals like calcite (CaCO 3 ) and
pirite (FeS 2)36. The spectra of natural and synthetic reference pigments are not different enough to distinguish
them because both have bands of the S− 3 ion at 548 cm (symmetric stretching vibration), 258 cm (bending
−1 −1
vibration) and 1096 cm−1 (stretching vibration)35. What is interesting in this data is that our CrystalDistribution
software identified uniform particle distribution in both size and roundness, as reported in recent s tudies35,
revealing the pigment to be artificial ultramarine with its smaller crystal size (0.5-5.0) µm36.
Vermilion
The purest and most saturated red, seen in the book in Musas II, is likely vermilion red. The same pigment
may have been washed or mixed with other colours to create the pinkish tones in the textiles. In fact, red crystals
were found in samples of light brown, pink and red areas. The redder the colour, the higher the density of crystals
in the cross-section. For instance, in samples M1-54P and M2-69P, red crystals of approximately 1.4 µm and
3.0 µm, respectively, are found in low density in the paint layer, see Fig. 5c. It is well-known that Italian schools
commonly used a triad of vermilion, greenish–yellow and violet–blue to achieve chromatic equivalents37. Another
reliable technique involving vermilion was to underpaint thin transparent touches of vermilion with another
white pigment to achieve a pink tone for the rosy and ruddy portions of flesh and skin38. Ferrario likely used both
of these techniques. Raman spectra of red crystals were associated with natural and artificial vermilion pigments
due to similar composition of mercury (II) sulfide, with characteristic signals at 251 cm−1 and 345 cm−120 (see
Fig. 6a and Fig. 6d). The particle size, fineness and uniformity of the vermilion crystals suggests the presence of
artificial vermilion in these s amples36. It is interesting to note that even though vermilion itself does not fluoresce,
the UVF picture of Fig. 2d (top) shows slight pink fluorescence in the red mantle. This pigment can exhibit visible
fluorescence induced by UV light due to the organic binder, if mixed with lead white or exposed to a mmonia39.
Chrome yellow
Yellow colours can be seen in elements like the harp in Musas I, and ornaments including clothing details in
both paintings. Yellow pigments washed or mixed with other colours is subtly perceptible in clouds, highlights,
hair and skin tones. Chrome yellow was commonly used in artworks of the period. Yellow crystals at different
density levels were found in all samples observed through OM. For instance, sample M1-75W has high density
of yellow and orange crystals in the paint layer, see Fig. 4b. We measured average crystal diameter of around
7.7 µm, see Fig. 5c. Chrome yellow provided artists with a heavy saturated yellow pigment that balanced out
other intense colours like red and blue. Ferrario may have chosen this pigment due to its reliability and popu-
larity in the nineteenth and early twentieth centuries. The use of this pigment may have caused parts of the
paintings to darken over time. Raman spectra show the characteristic bands of chrome yellow, also obtained for
the CHSOS reference pigment. Chrome yellow consists of lead chromate with the following chemical formula:
PbCrO428 along with Raman signal around 842 cm−1 caused by the Cr(VI)–O stretching32, see Fig. 6a and Fig. 6d.
A similar spectrum was obtained for the orange crystals observed in the samples. However, instead of the signal
at 842 cm−1, a doublet is observed at 828 cm−1 and 848 cm−1. Likewise, the observed signal at 361 cm−1 of the
chrome yellow becomes four signals within roughly 337 cm−1. The latter is caused by the presence of oxidized
lead (II) chromate, PbCrO4.Pb(OH)2 , which is usually called chrome o range40. We hypothesize that the presence
of this compound is evidence of chrome yellow degradation, due to its sensitivity to l ight28. Chrome yellow was
introduced as a pigment in 1 80428 and production increased in 1 82041. It was rather expensive in the first half of
the nineteenth c entury34, but the price had come down by the time Ferrario was working on Musas I and Musas
II. Nowadays the pigment is seldom used due to its dangerous toxicity28.
Zinc and lead white
White is a predominant colour in both Musas I and Musas II, most apparent in the clouds in both composi-
tions. Lead white was the main white pigment on the market in Ferrario’s time, although zinc white was being
developed as a safer a lternative42. The fluorescent microscope revealed medium density of fluorescent particles
in the first ground layer, see Fig. 4c. However, in the optical microscope image, the fluorescent particles are
indistinguishable from the rest of the components of the ground. Therefore, a white pigment with fluorescence
characteristics24, such as zinc white, must have been used in the preparation of the ground layer43. The average
diameter calculated for those particles was 5 µm. The evidence that zinc white may be present includes its cold,
flat tone34, poor oil drying and low pigment d ensity42. Manufacturers began adding zinc white to other pigments
as a lightening a gent . Although zinc white was not a very popular pigment, a few artists were fond of it34. Fer-
28
rario may have been one of them, but there is evidence that he might have used a mixture of zinc white with
another white, or a pigment mixed with zinc white. Micro-Raman analysis was performed on these fluorescent
particles. The spectra obtained allowed us to identify zinc white, comparing it to the CHSOS reference pigment.
The Raman spectra correspond to bands at approximately 447 cm−1 and 610 cm−130 which agrees with the
fluorescence microscopy because ZnO fluoresces when exposed to ultraviolet light43. As mentioned above, the
second ground layer is homogeneous white, without coloured pigments. Measurements using SEM-EDX taken
on a specific region reveal the following percentages: 27% of carbon, 14% of oxygen, 2% of calcium, 53% of lead
and 4% of zinc. This significant amount of lead, carbon and oxygen could indicate the presence of lead white
pigment (PbCO 3) 2 .Pb(OH) 2 44. We recommend additional studies to corroborate this hypothesis. Zinc white
Scientific Reports | (2021) 11:8560 | https://doi.org/10.1038/s41598-021-88066-1 9
Vol.:(0123456789)www.nature.com/scientificreports/
Figure 7. Traces of time: Categorising damage observed in the paintings. Visible photographs of (a) Musas II
and (b) Musas I with the working grid. (a.6) Musas II and (b.6) Musas I diagrams showing locations of the ten
most significant types of damage, with visible and UVF images of each: (a.1.) Loss of paint and exposed canvas.
(a.2.) Spots. (a.3.) Craquelure. (a.4.) Fungi. (a.5.) Holes. (b.1.) Detachment of canvas (bubbles). (b.2.) Moisture
marks. (b.3.) Cracks. (b.4.) Human fingerprints. (b.5.) Insect specks and perforation.
was developed to reduce the incidence of lead poisoning28,34. However, at 8 French francs per pound, it was four
hite28, so in many cases artists were slow to adopt the newer product.
times the cost of lead w
3. Mapping of damage
Thirdly, intensity analysis can be a first step towards identifying deterioration agents and selecting possible
restoration techniques. Multispectral Imaging (MSI), combined with RegionsOfInterest, shows the type and
severity of damage on artwork, allowing us to select areas of interest with visual atypical behaviours. The
main observations are shown in Fig. 7. Panels Fig. 7a, b show the paintings themselves. Panels Fig. 7a.6, b.6,
show a schematic of the paintings for easier reference. We identified ten categories of damage: (1) moisture
marks Fig. 7b.2, (2) detachment of canvas (bubbles) Fig. 7b.1, (3) cracks Fig. 7b.3, (4) craquelure, Fig. 7a.3,
(5) loss of paint and exposed canvas Fig. 7a.1, (6) human fingerprints Fig. 7b.4 (see supplementary informa-
tion Fig. S1), (7) spots Fig. 7a.2, (8) holes Fig. 7a.5, (9) insect specks and perforation Fig. 7b.5 and (10) fungi
Fig. 7a.4.
Moisture marks are among the most prevalent types of damage45 caused by leaks, dampness or floods
which can weaken and detaches the adhesive layer bonding the canvas to the wood s upport45. Possible
effects include bulges or air bubbles as observed in Fig. 7b.1) and even cracks, Fig. 7b.3). The glue binding
the ground to the canvas may detach in relative humidity above 80 %. As the canvas shrinks paint layers may
separate, leaving the canvas exposed, Fig. 7a.1. Craquelure may also cause paint loss46. This cracking in the
paint layer reflects the materials and technique used by the artist and its pattern can even provide informa-
tion on the creative p rocess46. The location of the craquelure on Musas I and Musas II suggests it was caused
by moisture inside the paintings.
Three predominant types of deterioration on Musas I and Musas II are: moisture marks Fig. 7b.2, craquelure
Fig. 7a.3, and loss of paint and exposed canvas Fig. 7a.1. We also observed human-caused damage, such as fin-
gerprints Fig. 7b.4 (see supplementary information Fig. S1), deep holes Fig. 7a.5 and spots Fig. 7a.2. Finally, with
the help of software and multispectral images, we identified regions with insect specks, perforation and fungi
colonization. Temperature and humidity cycles cause mechanical stress that may result in structural damage,
such as fracturing and fl aking47. While assessing the risk of biodeterioration in a tropical climate, Bhattachar-
yya et al. found that higher relative humidity and temperature leads to higher fungal load48. The data collected
at the NTCR, see Fig. 8, revealed temperatures between 22.7 ◦ C and 25.1 ◦ C, with an average of 23.3 ◦ C, see
Fig. 8d. Meanwhile, relative humidity ranged from 60.2 % to 78.5 %, with an average of 70.3 %, see Fig. 8e. These
conditions are considered very high-risk for biodeterioration. Air pollution and radiation levels are also known
to contribute to the deterioration process49–52; ergo, we recommend monitoring these parameters in the future.
Fungi can cause severe aesthetic and structural deterioration, since composite materials provide a number of
substrates for microbial g rowth53. Most fungi penetrate the fiber lumen where they grow a m ycelium54,55, and
some have been found to secrete cellulolytic enzymes that dissolve cellulose fibers, causing loss of strength,
elasticity, structure, and ultimately damaging the c anvas56. Additionally, a number of fungi and bacteria are
known to produce pigments or discoloration on artwork57,58. Identifying possible areas of biodeterioration with
MSI-coupled software tools in a great advantage, since fungal proliferation is often only noted once it has caused
significant damage59.
Scientific Reports | (2021) 11:8560 | https://doi.org/10.1038/s41598-021-88066-1 10
Vol:.(1234567890)www.nature.com/scientificreports/
Figure 8. Conservation in the tropics: Monitoring the paintings’ environment. (a) National Theatre of Costa
Rica in San José (NTCR), Costa Rica, Central America. (b) Musas I and Musas II are located on the ceiling, at a
height of about 3.5 m in the men’s canteen on the ground floor of the Theatre. (c) Location of the environmental
sensors. (d) Temperature and (e) humidity variations in the paintings’ microclimate.
Conclusions
This research aimed to provide a baseline diagnostic of the conservation state of the paintings Musas I and Musas
II using comprehensive and multidisciplinary methodologies. In particular, this multi-analytical study (MAS)
focused on the challenges of painting conservation in a tropical climate, and sought to provide fundamental
knowledge to prevent and slow down this decay. Novel software allowed us to gather data in a non-destructive
manner. One of the most significant outcomes of this study, made possible by our RegionsOfInterest software,
was the identification of areas of particular interest and assessment of the artist’s colour palette through mini-
mally invasive sampling. We found that zinc white, lead white, chrome yellow, lead red, viridian, vermilion,
and ultramarine blue pigments make up approximately 50% of the total pigment composition in the artwork,
demonstrating one of the ways this innovative technology can be applied to conservation, restoration and even
art history research on large-format paintings. Our second major development was the CrystalDistribution soft-
ware, which scans sample cross-sections and calculates pigment crystal number and size distributions. Using this
tool, we were able to identify synthetic vermilion and ultramarine blue in the paintings, as opposed to natural
pigments. This finding has important implications in developing affordable, efficient, accessible, and innovative
non-destructive laboratory analyses, especially given the current limited access to cultural heritage sites. The third
significant finding of this study was the ability to map damaged areas on the works, using RegionsOfInterest to
guide future restoration efforts. The results in this study have demonstrated the importance of a MAS approach
to large-format paintings and the value of our two novel software tools for art conservation studies. In further
research, we believe that further software tools could be developed to reveal the artist’s intentions and creative
process, for example, using machine learning techniques similar to deep neural n etworks60.
Materials and experimental
Multispectral imaging: photography acquisition. We generated visible (VIS), infrared (IR), infrared
false colour (IRFC) and ultraviolet (UV) photographs. VIS photos show possible superficial damage and suggest
the colours used by the artist, which may have changed with age or restoration61. IR imaging shows background
layers; such as underlying sketches, drawings and corrections by the a rtist62,63. UV imaging shows deeper dam-
age and compounds that fluoresce when excited with UV radiation, like certain pigments, binders and g lues63,64.
Photography acquisition was based on the procedure described by Cosentino24. Due to the large dimensions
of the paintings (2.97 m (w), 6.17 m (h)), a set of 30 pictures was obtained for each spectral region: VIS, IR,
ultraviolet fluorescence (UVF) and ultraviolet reflectance (UVR). Since the artworks are located on the ceiling,
the photographic equipment was placed on a grid marked on the floor roughly 3.0 m below. Both sets of pictures
were obtained using a modified camera (Nikon D7200) with the following filters: XNiteCC1 M52 (VIS), IR (IR),
XNiteCC1 M5 and B+W 52 mm 403 (Ultraviolet fluorescence), XNiteCC1 M5 and Baader UV/IR Cut/L-Filter
2” RISE(UK) 52 mm-48 mm (Ultraviolet reflected). Camera settings were adjusted for high quality photographs
(24 megapixels)24,62–65. The camera’s experimental conditions were: f5, ISO 100 and exposition time of 41 s (for
VIS and IR), f4, ISO 100 and exposition time of 4 s (for UV)24,62–65.
Two 500 W halogen lamps were used for visible and infrared photography (situated approximately 2.0 m
under the paintings) and four fluorescent lamps were used for ultraviolet photography (situated approximately
Scientific Reports | (2021) 11:8560 | https://doi.org/10.1038/s41598-021-88066-1 11
Vol.:(0123456789)www.nature.com/scientificreports/
1.5 m under the paintings). The white reference in the RMI Conservation Target (2017 Robin Myers Imaging
)66 used for the white balance was placed on one border of the painting. We used Cultural Heritage Open Source
Pigments Checker (CHSOS) pigment reference for the photos in every region; and Lightroom Classic and Pho-
toshop for lens corrections and generation of Infrared False colour (IRFC) pictures, respectively. We generated
panoramic images in each spectral region using PTGUI Software. For IRFC we used Adobe Photoshop to
overlay VIS and IR images. Both must align precisely to exchange their red, green and blue channels as follows:
in VIS the blue channel was suppressed and substituted with the green one, then the red channel substituted the
green channel, and the IR red replaced the VIS ex-red c hannel61,62.
Software development. Given the importance of digital image processing in painting analysis67,68, we
developed two novel software tools, RegionOfInterest and CrystalDistribution, written in Python3 using the
OpenCV library69,70 for pixel colour management in the HSV (Hue-Saturation-Value) colour s pace71. Both are
available for free at the GitHub repository https://github.com/andress5990/16_Intensity_Analysis and are open
to modification and improvements.
RegionOfInterest program for luminosity analysis of paintings. RegionOfInterest has two stages to quantify pixel
intensity value. The first takes a user-created, hand-drawn image region of any shape and size. The second sepa-
rates all pixels in the image with an intensity value within a user-selected range based on the stage one results.
These two execution routines use the OpenCV colour to gray transformation and classify pixels in a range from
0 (black or null intensity) to 255 (white or full intensity)71,72. The program then generates histograms of “Count
vs intensity”, according to the distribution of the intensity values. The second stage generates a colour image
containing only pixels with intensity values within the selected range, showing their location on the original
image. Intensity measurement uses the OpenCV cv2.colour_BGR2GRAY library f unction68,72. It was compared
with BT.601 and BT.709 colour to gray transformation methods73,74, with uncertainties of ±0.2 % and ±2.1 %
respectively. Program execution time was approximately 1 s. It is important to note that processing time depends
on image format and size and computer processing power. These analyses are also heavily dependent on image
quality and lighting conditions.
CrystalDistribution software tool to measure pigment crystals. CrystalDistribution identifies the number, diam-
eter and area of crystals of a selected colour in 50x magnified images. A code change is required to use this
software on other magnifications; this particular feature is not user-selectable. The code has three functions: (1)
image analysis, (2) numerical calculations, and (3) crystal counting. The first consists of slicing a microscopic
image. User made cuts allow both specific region and layer by layer analyses. We established hue, saturation
and component ranges to create a mask for each colour layer. Each mask is applied to the cuts and saved as an
image. We then calculate the area of the crystals by applying a mask of the corresponding colour to identify their
contour, and finding their center. This information is used to generate “Crystal count vs diameter” histograms
(in ranges of 2 µm from 0 µm to 25 µm).
Sampling along with microscopy and spectroscopy analysis.
Under the supervision of the Manager of the NTCR Conservation Department we collected 15-millimetric
samples (0.5 mm 2 - 3 mm 2 ) with a scalpel from already-damaged regions, so as to minimize risk of further
damage. Table 1 presents an overview of the main characteristics of these samples. We used a scaffold, since the
paintings are located on the ceiling. Figure 2f (top) and Figure 2f (bottom) show the grid for sample collection
and labeling. To set up the samples, cross-sections were embedded in epoxy resin (Fibrocentro ® ) and polished
with water sanding sheets (3M ® ) of 9.2 µm, 6.5 µm, 3 µm and 1 µm grit. Samples were sanded for approximately
3 min with each sheet, in descending order. We then used a polisher (EcoMet 30, Buehler ® ) for two 10-min cycles
with 15 µm and 3 µm alumina abrasive (Allied High Tech Products ® ), and the following conditions: 150 rpm for
stage and 150 rpm and 40 N force for the support arm, which rotated opposite to the stage. Cross-sections were
examined by Optical Microscope, SEM-EDX and Raman.
Optical microscopy. Cross-sections were examined with optical microscopy at 5x, 10x, 20x and 50x magnifica-
tions, using a Nikon Eclipse LV100ND light microscope equipped with a Nikon DS-fi3 digital camera. Micro-
scopic images with reflected light reveal the paintings’ stratigraphy and the colour of individual pigment g rains5.
10x magnification showed that cross-sections were composed typically of 2 to 4 layers, see Fig. 4b. At 20x and
50x magnifications we observed pigment crystals in the painting layer ranging from about 3 µm to 18 µm, and
fossils of 20 µm to 50 µm in the ground layer. Fluorescent crystals in the ground layer were observed through
Leica DMi8 Invert fluorescence microscope and images were capture at 5X, 10X and 100X. The signal was meas-
ured with a DAPI LP filter, with a range of (420 ± 20) nm for the excitation band pass filter and a range of (457 ±
20) nm for the suppression band pass filter.
Scanning electron microscope‑energy dispersive X ray spectroscopy (SEM‑EDX). We measured the paint stra-
tigraphy of 8 samples with EDX to determine elemental composition of the layers. Mapping and single point
analysis was conducted using a scanning electron microscope HITACHI S-3700n coupled with an IXRF Systems
Detector Energy-Dispersive X-ray spectrometer. The samples were uncoated with gold and analysed in low vac-
uum conditions and backscattering electron mode, under the following analytical conditions: 15 kV accelerating
voltage, 80 µA beam current, working distance ranging from about 5.5 mm to 10.9 mm and collection time for
mapping measurements was typically 30 min.
Scientific Reports | (2021) 11:8560 | https://doi.org/10.1038/s41598-021-88066-1 12
Vol:.(1234567890)www.nature.com/scientificreports/
Crystal average
Painting Sample name Visible colour Grid location Pigments density diameter (µm) Analysis
Layer 1: Ve(h), U(m),
M1-45B Dark blue 45 C(m) Ve(4.7), U(2.0), C(1.2) MO, R, EDX
Layer 2: C(m), U(m)
M1-54P Pink 54 Layer 1: Ve(m), L(l) Ve(1.4), L(21) MO, R
M1-54R Red 54 Layer 1: Ve(h), C(m) MO, R, SEM, UV
Musas I
M1-58W White 58 Layer 1: C(l) MO, R, EDX
Layer 1: C(l)
M1-60W White 60 MO, R
Layer 2: U(l), C(l)
Layer 1: Ve(l), C(l) MO, R, SEM, EDX,
M1-75W White 75 C(7.7), U(3.4)
Layer 2: C(h), U(m) FTIR-ATR, UV
Layer 1: U(m)
M2-27B Light blue 27 MO, R, UV
Layer 2: U(m), C(m)
Layer 1: Ve(l) MO, R, EDX, FTIR-
M2-31W White 31
Layer 2: U(h), C(h) ATR, UV
Layer 1: Ve(m), U(l),
M2-33Br Brown 33 C(l) MO, R, EDX, UV
Layer 2: U(m), C(m)
Layer 1: U(m), C(m),
M2-39B Dark blue 39 U(4.7), C(1.4), Ve(2.3) MO, R, EDX, UV
Ve(l)
Musas II
M2-63W White 63 Layer 1: C(h), U(h) R
Layer 1: Vi(l), Vi(5.1), Ve(3.0), L(0.6),
M2-69P Pink 69 MO, R
Ve(l),L(l), U(l),C(l) U(2.5), C(0.6)
Layer 1: Ve(m), U(m),
M2-70L Light purple 70 C(l) R
Layer 2: C(h), U(h)
Layer 1: U(m), C(m)
M2-73Br Brown 73 C(4.8), U(4.13) MO, R
Layer 2: U(m), C(m)
M2-83Br Brown 83 FTIR-ATR
Table 1. Paint stratigraphy samples. Pigment density, observed through optical microscopy, is categorized
as l = low, m = medium or h = high, for each type of pigment: L = lead red, Vi = viridian, U = ultramarine,
Ve = vermilion and C = chrome yellow. The average diameter of the crystals, in micrometers, is indicated
in parenthesis next to the pigment symbols. Analysis symbology: OM = optical microscopy, R = Raman
spectroscopy, EDX = energy dispersive X ray spectroscopy, UV = fluorescence microscopy and FTIR-ATR =
Fourier transform infrared - attenuated total reflectance spectroscopy. For FTIR-ATR analysis, samples were
not embedded. The rest of the analyses were carried out on cross-sections of samples.
Fourier transform infrared‑attenuated total reflectance spectroscopy (FTIR‑ATR). We used FTIR-ATR to iden-
tify the chemical composition of the ground layer. Three samples (see Table 1) not embedded in resin were ana-
lyzed by placing their inner layer in direct contact with the ATR crystal. We used a spectrometer (PerkinElmer
Frontier ® ) equipped with an ATR detector. Spectra were collected in transmittance mode, with 16 scans, in the
wavenumber range from 4000 cm−1 to 650 cm−1, at 1 cm−1 spectral resolution.
Micro‑Raman spectroscopy. We used micro-Raman Spectroscopy to identify the pigments in 16 samples, using
a WiTec alpha 300R micro-Raman Spectrometer with a diode laser of 532 nm and operating power ranging from
0.06 mW to 0.18 mW. Sample irradiation diameter of the laser was approximately 1 µm. Spectra were measured
from 0 cm−1 to 3000 cm−1. Measurement conditions to provided a low signal/noise ratio were: 100x magnifica-
tion, 50 cycles of accumulation and 0.5 s of integration time. Spectra were compared with reference pigments
from CHSOS.
Analysis of the environmental and biological factors. MSI in VIS and UV, coupled with our compu-
tational tools, identified regions of possible biodeterioration. These regions were sampled for fungi and bacteria.
Samples were collected using sterile cotton swabs from quadrants 54, 59 and 60 on Musas I and 50, 56, 59 and 69
on Musas II. They were transported in Phosphate Buffered Saline75 and inoculated for culture in Potato Dextrose
Agar (PDA) medium around 23 ◦ C. Over the next three months, fungi were isolated and observed through opti-
cal microscopy at 100X in lactophenol cotton blue and Gram stain. In order to measure periodically environ-
mental variables at the NTCR, six portable stations were developed with a lithium-ion polymer (LiPo) battery,
and an Internet of Things (IoT) microcontroller device. The sensors used are the following: SHTC3 (Sensirion)
to measure temperature and relative humidity, SGP30 (Adafruit) breakout board was used to monitor the vari-
ation of CO 2 concentration, and finally TSL2591 (Adafruit) breakout board was used to measure illuminance
levels.
Scientific Reports | (2021) 11:8560 | https://doi.org/10.1038/s41598-021-88066-1 13
Vol.:(0123456789)www.nature.com/scientificreports/
A description with the time required on-site and off-site the place where the paintings are located at the NTCR
for each method is given in Table S1 (see Supplementary Information).
Received: 30 September 2020; Accepted: 7 April 2021
References
1. Fiorillo, F. et al. Learning from the past, intervening in the present: the role of conservation science in the challenging restoration
of the wall painting marriage at Cana by Luca Longhi (Ravenna, Italy). Herit. Sci. 8, 1–13. https://doi.org/10.1186/s40494-020-
0354-y (2020).
2. Madariaga, J. M. Analytical chemistry in the field of cultural heritage. Anal. Methods 7, 4848–4876. https://d oi.o
rg/1 0.1 039/C
5AY0
0072F (2015).
3. Ortiz Miranda, A. Development of analytical methods for the characterization of tempera paintings at micro-and nano-scale and
their deterioration and biodeterioration processes. Ph.D. thesis, Universitat Politècnica de València (2017).
4. Artesani, A. et al. Combined photoluminescence and Raman microscopy for the identification of modern pigments: explanatory
examples on cross-sections from Russian Avant-Garde paintings. Herit. Sci. 7, 1–13. https://doi.org/10.1186/s40494-019-0258-x
(2019).
5. Mahmoud, H. H. M. Investigations by Raman microscopy, ESEM and FTIR-ATR of wall paintings from QASR El-Ghuieta temple,
Kharga Oasis, Egypt. Herit. Sci. 2, 1–11. https://doi.org/10.1186/s40494-014-0018-x (2014).
6. Delaney, J. K. et al. Visible and infrared imaging spectroscopy of paintings and improved reflectography. Herit. Sci. 4, 1–10. https://
doi.org/10.1186/s40494-016-0075-4 (2016).
7. Tserevelakis, G. et al. Photoacoustic imaging reveals hidden underdrawings in paintings. Sci. Rep. 7, 747. https://doi.org/10.1038/
s41598-017-00873-7 (2017).
8. Sallam, A. et al. CT scanning and MATLAB calculations for preservation of Coptic mural paintings in historic Egyptian monaster-
ies. Sci. Rep. 9, 3903. https://doi.org/10.1038/s41598-019-40297-z (2019).
9. Cosentino, A. Panoramic, Macro and Micro Multispectral imaging: an affordable system for mapping pigments on artworks. J.
Conserv. Mus. Stud. 13, 1–17. https://doi.org/10.5334/jcms.1021224 (2015).
10. Liang, H. & Liang, H. Advances in multispectral and hyperspectral imaging for archaeology and art conservation. Appl. Phys. A
106, 309–323. https://doi.org/10.1007/s00339-011-6689-1 (2011).
11. Barni, M., Pelagotti, A. & Piva, A. Image processing for the analysis and conservation of paintings: opportunities and challenges.
Signal Process. Mag. IEEE 22, 141–144. https://doi.org/10.1109/MSP.2005.1511835 (2005).
12. Ribes, A., Pillay, R., Schmitt, F. & Lahanier, C. Studying that smile. IEEE Signal Process. Mag. 25, 14–26. https://doi.org/10.1109/
MSP.2008.923091 (2008).
13. Paviotti, A. & Forsyth, D. A. A lightness recovery algorithm for the multispectral acquisition of frescoed environments. In 2009
IEEE 12th International Conference on Computer Vision Workshops, ICCV Workshops, 970–977. https://doi.org/10.1109/ICCVW.
2009.5457599 (IEEE, 2009).
14. Tuñón-López, J. et al. The Colours of Rome in the walls of cástulo (Linares, Spain). Sci. Rep. 10, 12739. https://doi.org/10.1038/
s41598-020-69334-y (2020).
15. Marín Cruz, C. E. Metodología teórica aplicada al proceso de restauración en obra pictórica en patrimonio construido: el caso del
Salón Anexo de la cafetería del Teatro Nacional de Costa Rica (Universidad de Costa Rica, 2012).
16. Fischel V. A. La Caja Mágica (Editorial Teatro Nacional, 1997).
17. Morice, J. et al. A brief insight into the secrets of the 120-year-old main curtain of the National Theatre of Costa Rica through
non-destructive characterization techniques. J. Conserv. Mus. Stud. 17, 4. https://doi.org/10.5334/jcms.172 (2019).
18. Conejo-Barboza, G., Libby-Hernández, E., Marín-Cruz, C. & Herrera-Sancho, O. A. Discovery of Vespasiano Bignami paintings
at the National Theater of Costa Rica trough technical photography and UV-Vis spectroscopy. Herit Sci 8, 125. https://doi.org/10.
1186/s40494-020-00470-4 (2020).
19. Marras, S., Pojana, G., Ganzerla, R. & Marcomini, A. Study and characterization of mural paintings from XIX Century in a noble
Venetian (Italy) palace. Microchem. J. 96, 397–405. https://doi.org/10.1016/j.microc.2010.07.003 (2010).
20. Petrova, O. et al. Pigment palette study of the XIX century plafond painting by Raman spectroscopy. J. Cult. Herit. 37, 233–237
(2019).
21. Paradisi, A. et al. Domus aurea, the ‘sala delle maschere’: chemical and spectroscopic investigations on the fresco paintings.
ARCHAEOM 54, 1060–1075. https://doi.org/10.1111/j.1475-4754.2012.00678.x (2012).
22. Gil, M. et al. Old masters under the microscope technical and material comparison of a 17th c. mural and panel painting assigned
to José de Escovar in southern Portugal. Microchem. J. 153, 104396. https://doi.org/10.1016/j.microc.2019.104396 (2020).
23. Brandi, C. Theory of Restoration (Instituto centrale per il restauro, 2005).
24. Cosentino, A. Identification of pigments by multispectral imaging; a flowchart method. Herit. Sci. 2, 8. https://doi.org/10.1186/
2050-7445-2-8 (2014).
25. Cosentino, A. Practical notes on ultraviolet technical photography for art examination. Conserv. Património 123, 53–62. https://
doi.org/10.14568/cp2015006 (2015).
26. Stoner, J. H. & Rushfield, R. Conservation of Easel Paintings (Routledge, 2013).
27. Xu, B. & Poduska, K. M. Linking crystal structure with temperature-sensitive vibrational modes in calcium carbonate minerals.
Phys. Chem. Chem. Phys. 16, 17634–17639 (2014).
28. Feller, R. L. (ed.) Artist’s Pigments: A Handbook of Their History and Characteristics Vol. 1 (National Gallery of Art, 1986).
29. Edwards, H. G., Farwell, D. W., Newton, E. M. & Perez, F. R. Minium; FT-Raman non-destructive analysis applied to an historical
controversy. Analyst 124, 1323–1326 (1999).
30. Cardeira, A. et al. Analytical characterization of academic nude paintings by Jose Veloso Salgado. Spectrochim. Acta A Mol. Biomol.
Spectrosc. 153, 379–385 (2016).
31. Mayer, R. The Artist’s Handbook of Materials and Techniques (Viking, 1991).
32. Maslar, J. E. et al. In situ Raman spectroscopic investigation of chromium surfaces under hydrothermal conditions. Appl. Surf. Sci.
180, 102–118 (2001).
33. Brown, D., Cunningham, D. & Glass, W. The infrared and Raman spectra of chromium (III) oxide. Spectrochim. Acta A Mol.
Spectrosc. 24, 965–968 (1968).
34. Ball, P. Bright Earth: The Invention of Colour (Vintage, 2008).
35. Osticioli, I. et al. Analysis of natural and artificial ultramarine blue pigments using laser induced breakdown and pulsed Raman
spectroscopy, statistical analysis and light microscopy. Spectrochim. Acta A Mol. Biomol. Spectrosc. 73, 525–531 (2009).
36. Roy, A. (ed.) Artists’ Pigments: A Handbook of Their History and Characteristics Vol. 2 (National Gallery of Art, 1993).
37. Vanderpoel, E. N. Color Problems: A Practical Manual for the Lay Student of Color (The Cicardian Press, 2018).
38. Mayer, R. The Painter’s Craft: An Introduction to Artists’ Methods and Materials (Viking Press, 1975).
Scientific Reports | (2021) 11:8560 | https://doi.org/10.1038/s41598-021-88066-1 14
Vol:.(1234567890)You can also read