Towards timing and stratigraphy of the Bronze Age burial mound royal tomb (Königsgrab) of Seddin (Brandenburg, northeastern Germany) - EGQSJ
←
→
Page content transcription
If your browser does not render page correctly, please read the page content below

Research article
E&G Quaternary Sci. J., 70, 1–17, 2021
https://doi.org/10.5194/egqsj-70-1-2021
© Author(s) 2021. This work is distributed under
the Creative Commons Attribution 4.0 License.

Towards timing and stratigraphy of the Bronze Age burial
mound royal tomb (Königsgrab) of Seddin (Brandenburg,
northeastern Germany)
Moritz Nykamp1 , Jacob Hardt1 , Philipp Hoelzmann1 , Jens May2 , and Tony Reimann3,4
1 Institute of Geographical Sciences, Freie Universität Berlin, Berlin, Germany
2 Brandenburgisches   Landesamt für Denkmalpflege und Archäologisches Landesmuseum, OT Wünsdorf, Zossen, Germany
3 Soil Geography and Landscape group & Netherlands Centre for Luminescence dating, Wageningen University,

Wageningen, the Netherlands
4 Institute of Geography, University of Cologne, Cologne, Germany

Correspondence:        Moritz Nykamp (m.nykamp@fu-berlin.de)

Relevant dates:        Received: 15 April 2020 – Revised: 13 November 2020 – Accepted: 26 November 2020 –
                       Published: 12 January 2021

How to cite:           Nykamp, M., Hardt, J., Hoelzmann, P., May, J., and Reimann, T.: Towards timing and stratigraphy
                       of the Bronze Age burial mound royal tomb (Königsgrab) of Seddin (Brandenburg, northeastern Ger-
                       many), E&G Quaternary Sci. J., 70, 1–17, https://doi.org/10.5194/egqsj-70-1-2021, 2021.

Abstract:              This study uses an integrated multi-method geoarcheological and geochronological approach to con-
                       tribute to the understanding of the timing and stratigraphy of the monumental burial mound royal
                       tomb (Königsgrab) of Seddin. We show that the hitherto established radiocarbon-based terminus post
                       quem time frame for the construction of the burial mound of 910–800 BCE is supported by optically
                       stimulated luminescence (OSL) dating. The radiocarbon samples were obtained from a substrate di-
                       rectly underneath the burial mound which supposedly represents the late glacial/Holocene soil that
                       was buried below the structure. We use sedimentological (grain-size analyses) and geochemical anal-
                       yses (element analyses, carbon, pH, and electric conductivity determinations) to reassess and confirm
                       this hypothesis. In addition to the burial age associated with the last anthropogenic reworking during
                       construction of the burial mound, the OSL dating results provide new insights into the primary deposi-
                       tion history of the original substrates used for the structure. In combination with regional information
                       about the middle and late Quaternary development of the environment, our data allow us to provide
                       a synoptic genetic model of the landscape development and the multiphase stratigraphy of the royal
                       tomb of Seddin within the Late Bronze Age cultural group “Seddiner Gruppe” of northern Germany.
                       Based on our initial experiences with OSL dating applied to the sediments of a burial mound – to the
                       best of our knowledge the first attempt in Europe – we propose a minimal invasive approach to obtain
                       datable material from burial mounds and discuss related opportunities and challenges.

Kurzfassung:           Diese Studie nutzt einen integrativen geoarchäologisch-geochronologischen Ansatz, um einen Beitrag
                       zum Verständnis der Chronologie und Stratigraphie des monumentalen Grabhügels „Königsgrab“ von
                       Seddin zu leisten. Wir zeigen, dass der bislang etablierte, auf Radiokarbondaten basierende, post
                       quem Zeitrahmen von 910–800 BCE für die Errichtung des Grabhügels durch optisch-stimulierte
                       Lumineszenz (OSL) Alter unterstützt wird. Die Proben für die Radiokarbondatierung stammen aus

Published by Copernicus Publications on behalf of the Deutsche Quartärvereinigung (DEUQUA) e.V.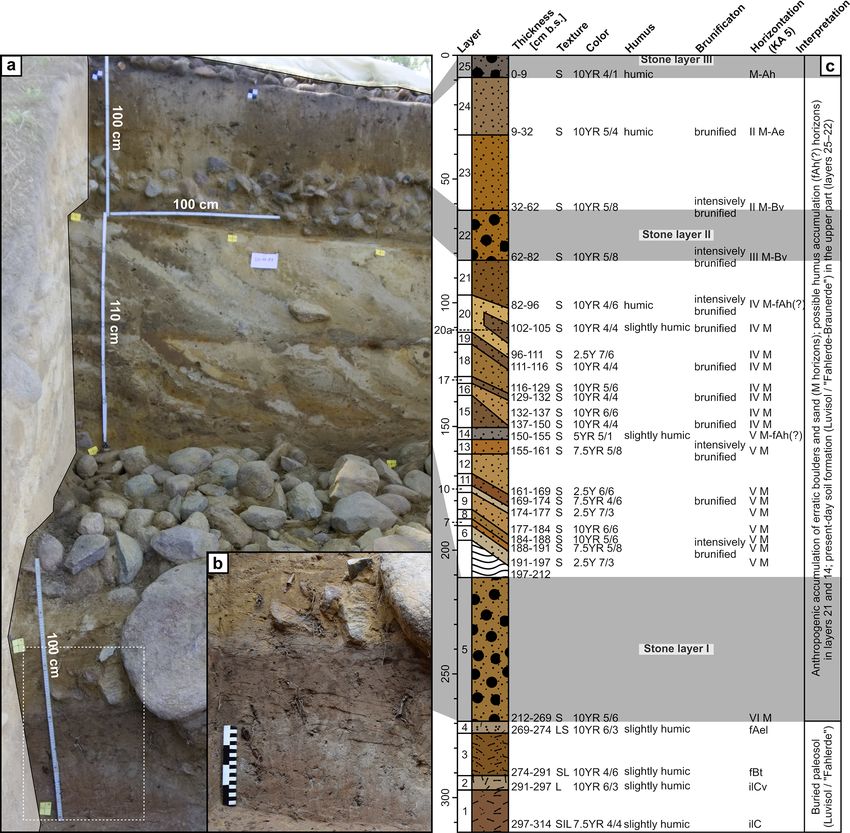
2                                               M. Nykamp et al.: Towards timing and stratigraphy of the royal tomb of Seddin

                           einem Substrat unterhalb des Grabhügels, das den vermeintlich begrabenen spätglazialen/holozänen
                           Boden repräsentiert. Wir nutzen sedimentologische (Korngrößenanalysen) und geochemische Analy-
                           sen (Elementanalyse, Kohlenstoffbestimmung, pH- und elektrische Leitfähigkeitsmessung), um diese
                           Annahme zu evaluieren und zu bestätigen. Ergänzend zu dem Alter der Überdeckung des spät-
                           glazialen/holozänen Bodens, das mit der letzten anthropogenen Materialumlagerung während der
                           Konstruktion des Grabhügels assoziiert wird, geben die Ergebnisse der OSL-Datierungen einen Ein-
                           blick in die ursprüngliche Ablagerungsgeschichte des Ausgangssubstrates, das für die Errichtung des
                           Grabhügels verwendet wurde. In Kombination mit Informationen zur regionalen mittel- bis spätquar-
                           tären Landschaftsgenese, lässt sich aus unseren Daten ein genetisches Übersichtsmodell der Land-
                           schaftsentwicklung und der mehrphasigen Stratigraphie des „Königsgrabes“ von Seddin als Teil der
                           spätbronzezeitlichen Kulturgruppe „Seddiner Gruppe“ von Norddeutschland ableiten. Auf Grundlage
                           unserer ersten Erfahrungen mit der OSL-Datierung von Sedimenten eines Grabhügels, nach unserem
                           Wissen der erste Versuch in Europa, schlagen wir einen minimalinvasiven Ansatz vor, um datierbares
                           Material aus Grabhügeln zu gewinnen und diskutieren damit verbundene Möglichkeiten und Heraus-
                           forderungen.

1   Introduction                                                     of the mound. Sand-sized quartz grains suitable for optically
                                                                     stimulated luminescence (OSL) dating, in contrast, can be
Burial mounds form part of the most important monuments              regarded as ubiquitous in most (if not all) burial mounds lo-
of European prehistory, and many thousands of these archi-           cated along the European sand belt. However, to the best of
tectural elements are still visible in the landscapes of Europe      our knowledge, OSL dating has not yet been performed on
(Doorenbosch, 2013). Furthermore, new technologies such              burial mounds in Europe, unlike examples from archeolog-
as high-resolution lidar-derived digital elevation models that       ical mound structures (e.g., tells and burial mounds) in the
are more and more available will likely increase the number          USA, Israel, and Jordan (e.g., Feathers, 1997; Porat et al.,
of newly discovered monuments significantly.                         2012; Pluckhahn et al., 2015; al Khasawneh et al., 2020).
   Generally, burial mounds are an important form of burial             A precisely dated burial mound and thus an ideal test ob-
practice as they serve as a permanent marker of a dead per-          ject for OSL dating of mound sediments is the royal tomb
son, keeping them in the memory of those who live on (Hard-          (Königsgrab) of Seddin (federal state of Brandenburg, north-
ing, 2012). In northern Central Europe, they occur from the          eastern Germany). It dates to the 9th century BCE and is
Neolithic to the Slavic period/Viking age.                           considered one of the most important tombs of the Nordic
   Although archeologists from the different European re-            Bronze Age and an excellent example of an elite or chief
gions and specialists for certain cultural epochs are usually        tomb (May, 2018). The mound was piled up in layers con-
able to date newly discovered burial mounds based on their           sisting of alternating strata of erratic boulders and sand (May
external appearance, numerical age control is often still re-        and Hauptmann, 2012; May, 2018). A stone pavement fol-
quired to reliably relate a burial mound to a specific cultural      lowed by a sand layer form the lowermost layers. The con-
epoch. This mostly requires excavation for either archeolog-         struction continues with a second stone pavement and an-
ical artifacts or macroscopic remains of organic matter suit-        other sand layer. A third stone pavement forms the uppermost
able for 14 C dating – the former is undesirable in many cases       deposit. During archeological excavations, at several loca-
for the purposes of cultural heritage preservation and the lat-      tions a layer of either dark substrate or pale solidified sand
ter is often difficult to obtain (Kristiansen et al., 2003). Kris-   was identified directly underneath the basal stone pavement,
tiansen et al. (2003), therefore, propose an approach with           i.e., in stratigraphically identical positions. The dark mate-
minimal disturbance to obtain samples for 14 C analysis of           rial was interpreted as a paleosol that was buried during the
soil organic matter fractions. They demonstrate that augering        initial construction phase by the boulders of the first stone
through the mound can provide suitable samples from former           pavement (May, 2018). However, geoscientific analyses to
surface soils buried by the mound and that 14 C dating of soil       support the interpretation of a buried paleosol underneath the
organic matter fractions can yield good results. Their results       royal tomb including the pedological horizon designation of
show that the humic acid fractions in 7 out of 10 mounds             the dark substrate and the pale sand are currently lacking.
are in good agreement with the reference ages (Kristiansen           The additional information can provide important insights
et al., 2003). Relying on the presence of a buried organic-          into the conditions and processes immediately preceding the
rich topsoil horizon alone can, however, be problematic: it          initial construction phase of the burial mound, e.g., potential
might be lacking as a consequence of soil erosion after veg-         erosion by water or wind of the organic-rich topsoil horizon
etation clearance or surface leveling prior to the construction      after vegetation clearance or possible leveling of the founda-

E&G Quaternary Sci. J., 70, 1–17, 2021                                                  https://doi.org/10.5194/egqsj-70-1-2021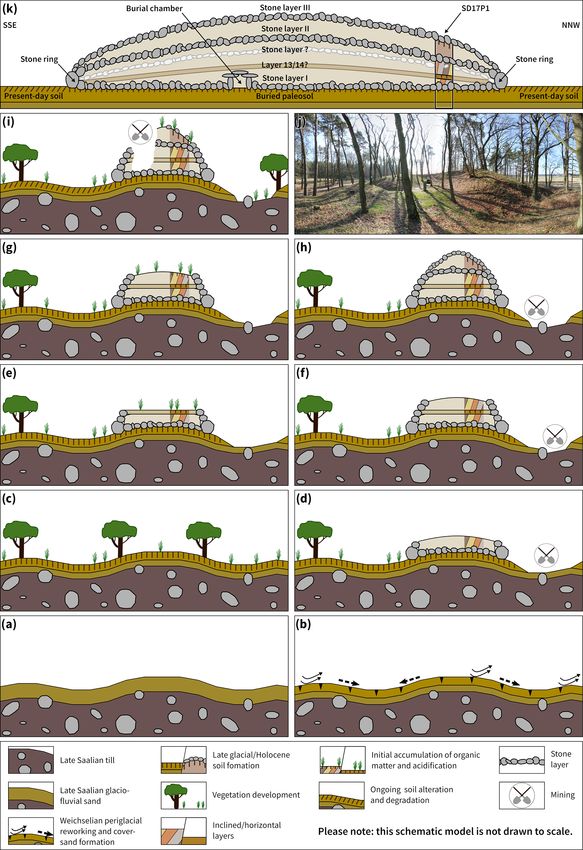
M. Nykamp et al.: Towards timing and stratigraphy of the royal tomb of Seddin 3
tion soil. The pedological characterization of the buried soil
horizons also helps to assess their potential for additional pa-
leoenvironmental studies such as pollen analyses from fossil
organic-rich topsoil horizons (e.g., Kaiser et al., 2020).
Radiocarbon ages obtained from pieces of charred wood
from the dark layer provide a rather precise terminus post
quem time frame for the construction of the burial mound
ranging from 910 to 800 BCE (May and Hauptmann, 2012;
May, 2018). These ages provide a maximum age estimate for
the construction of the burial mound but are completely de-
coupled from the construction process (cf. Pluckhahn et al.,
2015). Thus, even though the age range is precise, indepen-
dent numerical age control obtained by a dating technique
that is capable of recording the construction process itself
such as OSL dating is useful.
Therefore, the aims of this contribution are to provide (i)
independent numerical age estimates to verify the terminus
post quem time frame of the construction period by applying
OSL dating to capture the construction process and (ii) sedi-
mentological and geochemical analyses to further investigate
and classify the suggested buried paleosol.
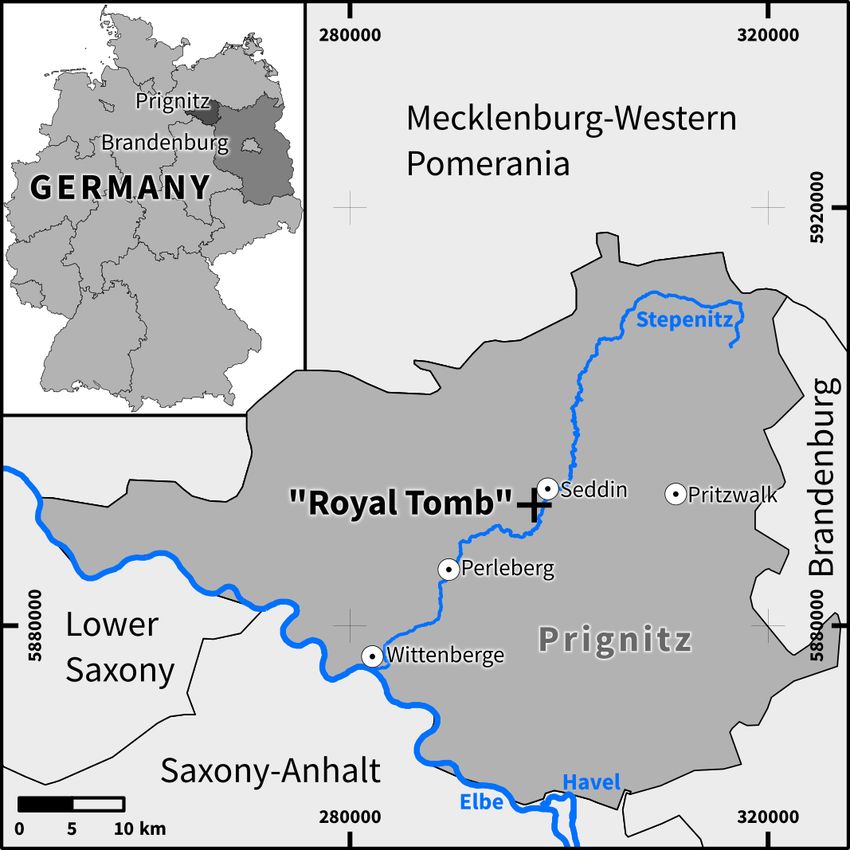
We present a compilation of radiocarbon and OSL ages Figure 1. Overview map showing the Prignitz region in north-
west Brandenburg (northeast Germany) and the location of the royal
and thereby contribute to the chronology of the royal tomb of
tomb of Seddin (reference system: WGS84; projection: UTM33N;
Seddin by applying two dating methods that are independent data sources: Naturalearthdata, 2020; Offenedaten, 2020; Geofab-
of each other. Moreover, our OSL datings also provide im- rik, 2020).
portant insights into the Quaternary history of the construc-
tion material itself. We combine the local chronological and
sediment/soil data with regional information on the middle
and late Quaternary environmental history to set up a genetic (Fig. 2a). The smoothly undulating topography of the area is
model of the landscape development and possible construc- a result of periglacial reworking processes, e.g., gelisolifluc-
tion phases of the royal tomb of Seddin. Furthermore, we tion, and coversand formation. This landscape type is char-
discuss opportunities and challenges of a minimally invasive acterized as old morainic landscape (Lippstreu et al., 1997;
approach – following Kristiansen et al. (2003) – in combi- Nagel et al., 2003; Lippstreu et al., 2015). Direct numerical
nation with luminescence dating techniques to provide initial ages of the late Saalian sediments are generally rare in the re-
numerical age estimates for newly discovered burial mounds. gion and are lacking for the wider surroundings of the burial
mound. OSL ages of Saalian glaciofluvial deposits from the
south of Brandenburg (Beelitz, ca. 120 km southeast of Sed-
2 Regional setting and archeological background din) yielded an age range of 150–130 kyr (Lüthgens et al.,
2010). This is in agreement with previous age estimates that
2.1 Regional setting
were based on stratigraphic and morphostratigraphic corre-
The royal tomb (Königsgrab) of Seddin is located in the Prig- lations (Litt et al., 2007; Böse et al., 2012). Coversand for-
nitz region approximately 2 km southwest of the village of mation probably took place starting at the end of the Weich-
Seddin, in the northwest of the federal state of Brandenburg, selian Pleniglacial, as was shown at different sites within the
northeast Germany (Fig. 1). European sand belt (Kasse, 2002; Koster, 2005; Kaiser et al.,
The monumental burial mound is situated in the middle 2009). Coversands at Beelitz were dated to ∼ 15 ka by means
reaches of the Stepenitz river, a smaller lowland tributary of of OSL (Lüthgens et al., 2010).
the Elbe river discharging into the North Sea. The area is “Fahlerde” or “Braunerde-Fahlerde” (according to Ad-
part of the old morainic glacial landscape that was initially Hoc-AG Boden, 2005, and MLUV, 2005), i.e., Luvisols (ac-
formed by the Scandinavian Ice Sheet (SIS) during the penul- cording to IUSS Working Group WRB, 2006), have devel-
timate Saalian glaciation (∼ late MIS 6, marine isotope stage; oped in the sandy to loamy-sandy substrates (Fig. 2). These
Ehlers et al., 2011; Lippstreu et al., 2015) and afterwards al- soils form one of the typical soils in the Prignitz region
tered by periglacial processes during the last Weichselian ice (MLUV, 2005; GeoBasis-DE/LGB, 2012) and are predom-
age (mainly MIS 4 and MIS 2). inant in the surroundings of the royal tomb (Fig. 2b).
The late Saalian deposits in the vicinity of the burial The onset of soil formation in the region was in the Late
mound comprise till, as well as glaciofluvial sand and gravel Glacial, as shown by micromorphological analyses (Kühn,
https://doi.org/10.5194/egqsj-70-1-2021 E&G Quaternary Sci. J., 70, 1–17, 2021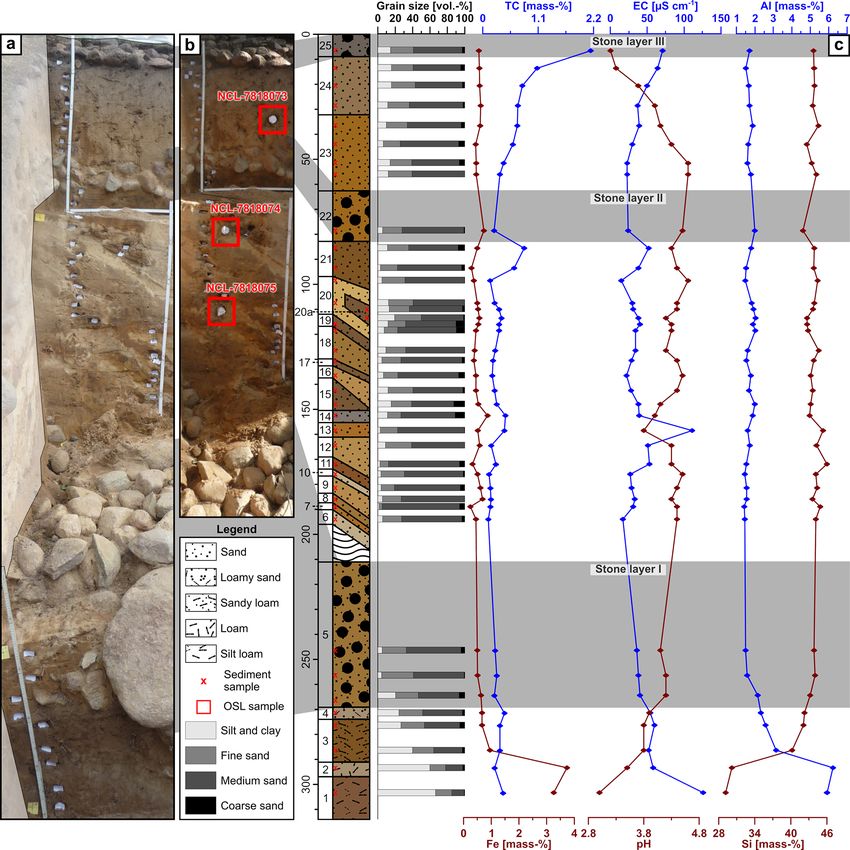
4                                               M. Nykamp et al.: Towards timing and stratigraphy of the royal tomb of Seddin

Figure 2. Simplified overview maps showing (a) the geology and (b) the dominating soil types and textures in the surroundings of the royal
tomb (reference system: WGS84; projection: UTM33N; data sources: Schulte and Wahnschaffe, 1905; GeoBasis-DE/LGB, 2012; LBGR
Brandenburg, 2020).

2003) and a review of available geochronological data on soil          of the royal tomb is dominated by arable land, pastures, and
formation in northeast Germany (Kappler et al., 2019).                 forests (European Environment Agency, 2020).
   Palynological evidence from different archives in Bran-                The study site is located at the transition from a temper-
denburg show a simultaneous increase in human activity in              ate oceanic climate in the west to a humid continental cli-
the Late Bronze Age compared to the Early and Middle                   mate in the east (i.e., west–east transition from Cfb to Dfb
Bronze Age. Increasing frequencies of cereal-type pollen and           according to the Köppen–Geiger classification; Beck et al.,
secondary anthropogenic indicators document the strong hu-             2018). The weather station Marnitz (German Meteorologi-
man impact on the vegetation; strongly decreasing arboreal             cal Service, DWD; station ID: 3196) is located ca. 20 km
pollen points to large-scale clearings of woodland (Jahns,             north of the study area at an elevation of 81.0 m above sea
2015, 2018). The pollen diagram from the Bergsoll, i.e., a             level. This station recorded a mean annual air temperature
small wetland area ca. 7.2 km northeast of the royal tomb,             of 8.2 ◦ C (range: 7.1–9.9 ◦ C) and a mean annual precipita-
provides evidence for extensive deforestation in ca. 800 BCE           tion of 660 mm a−1 (range: 460–816 mm a−1 ) for the period
(Jahns, 2018). Also, a distinct decline of Quercus pollen at           1961–1990 (DWD Climate Data Center, 2020a, b).
the Sacrower See lake in ca. 800 BCE suggests the intensive
use of oak lumber that resulted in a shift of the forest com-
                                                                       2.2   Archeological background
position (Jahns, 2015). These results from archives in Bran-
denburg are in agreement with results of pollen and char-              The locality of the royal tomb of Seddin was eponymous for
coal analyses from fossil soils in south Mecklenburg-Western           the cultural group “Seddiner Gruppe” in southwest Meck-
Pomerania indicating the first human impacts on the vegeta-            lenburg and northwest Brandenburg (May and Hauptmann,
tion during the Neolithic and an intensification during the            2012) in the Late Bronze Age (1100 to 530 BCE). It is con-
Bronze Age; fire events started to increase roughly around             sidered one of the most important tombs of the 9th century
the transition from the Bronze Age to the Iron Age (Kaiser             BCE in northern Central Europe and an excellent example of
et al., 2020). The present-day land cover in the surroundings          an elite or chief tomb at the transition from the Late Bronze
                                                                       Age to the Iron Age (May and Hauptmann, 2012). Its isolated
                                                                       position, as well as the presence of other richly equipped

E&G Quaternary Sci. J., 70, 1–17, 2021                                                      https://doi.org/10.5194/egqsj-70-1-2021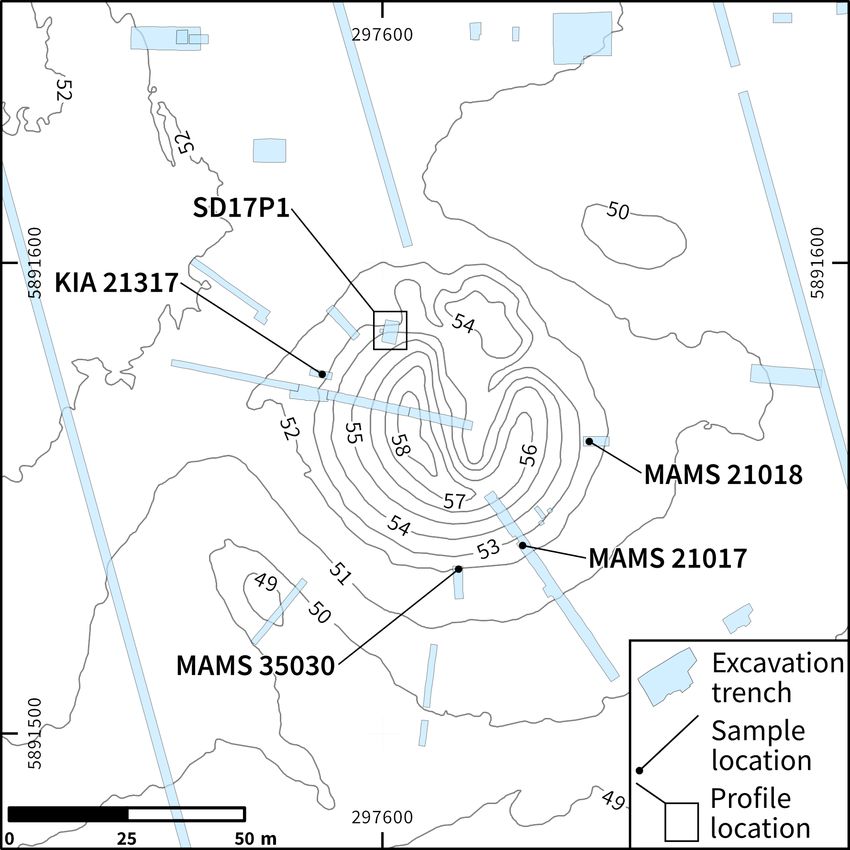
M. Nykamp et al.: Towards timing and stratigraphy of the royal tomb of Seddin                                                     5

graves in the area, indicates the existence of an elite during     man remains from Danish graves and thereby suggest that
the Late Bronze Age at the southern margin of the Nordic           period V covers the time span from 950/920 to 800 BCE.
Bronze Age cultural groups (May, 2018).                               In the course of archeological investigations, four radio-
   The burial mound has a diameter of ca. 61.5 m, and its          carbon dates were obtained from charcoal fragments recov-
original height was ca. 9 m. Erratic boulders form a circle        ered from four different trenches in close proximity to the
around the foot of the grave mound. This circle has a circum-      inner side of the stone ring of the burial mound of Seddin
ference of ca. 193.5 m surrounding an area of ca. 3000 m2          (Fig. 3). Each of these radiocarbon samples originates from
(May, 2018). It is likely that the stone ring was built before     a substrate which most likely corresponds to layer 3 of pro-
the mound was erected. The mound itself was built of alter-        file SD17P1 (Fig. 4). Three of the obtained charcoal pieces
nating strata of stones and sand, and it was piled up in layers.   were dated to 910–800 BCE (at 2σ range; Table 2). This
Due to its monumental dimensions it was visible from all di-       agrees well with the abovementioned estimation of the du-
rections over several kilometers, at least during periods of       ration of period V. These ages also provide a terminus post
sparse vegetation (May, 2018). Palynological analyses at the       quem for the construction of the burial mound since the con-
Bergsoll near Seddin point to widespread deforestation in the      struction of the burial mound rests directly on layer 3 (Fig. 4).
area during the Bronze Age, and thereby it seems likely that       The fourth radiocarbon sample (MAMS 35030; Fig. 3) was
the burial mound represented a landmark at this time (Jahns,       obtained from a stratigraphic position that is identical with
2018). In combination with the surrounding grave mounds            layer 3 of profile SD17P1 (Fig. 4). However, while layer 3
and grave mound fields, it exemplifies the ritual use and re-      of profile SD17P1 consists of dark organic-rich material (see
organization of the area (May, 2018).                              below), sample MAMS 35030 (Fagus charcoal) was taken
   A large burial chamber made of stones is located in-            from a layer consisting of white, strongly solidified sand and
side the mound. This chamber is situated ca. 9 m to the            is dated to 1740–1620 BCE (at 2σ range; Table 2). This age is
southeast of the center of the stone circle and was built on       roughly 790 years older than the oldest dating of the grave.
level ground (May, 2018). The chamber contained painted            At the current state of research, it remains unclear whether
clay plasters and rich burial equipment consisting of 41 ob-       this indicates a previous use of the area where the burial
jects and the cremated remains of three individuals. A 30–         mound was erected later on or if the sample is affected by
40-year-old man was buried together with two presumably            the “old wood effect” as is the case for other radiocarbon
younger women (Kiekebusch, 1928; May and Hauptmann,                samples obtained from locations close by (May, 2018).
2005, 2011).
   The royal tomb of Seddin was initially dated based on the       3     Material and methods
archeological findings from the burial chamber. Researchers
agree that the youngest objects of the burial equipment date       3.1    Field work
to period V based on Montelius (1885). Period V is, ac-
cording to Montelius (1885), one out of six (I–VI) relative        Profile SD17P1 (5891584 N, 297601 E; UTM 33N) was
chronological periods for the Nordic Bronze Age. Stratigra-        recorded in August 2017 during archeological excavations
phy, typology, and coincident findings (geschlossene Funde),       on the northwestern slope of the Bronze Age burial mound
such as all objects obtained from a grave or hoard for which a     (Fig. 3). The profile was excavated in three ca. 1 m deep sec-
coincident laying down is assumed, form the basis for the rel-     tions separated by ca. 1 m wide steps. It was cleaned and doc-
ative chronological periodization of the archeological find-       umented by photographs (Fig. 4a) before the sediment suc-
ings. Therefore, the exact timing and duration of the peri-        cession was described and sampled. The macroscopic sed-
ods is controversial among archeologists. In the case of the       iment description was carried out according to the German
royal tomb of Seddin, it is agreed upon that the burials belong    manual for soil mapping (KA 5; Ad-Hoc-AG Boden, 2005)
to Montelius’ period V, but there is no consensus regarding        and includes texture, humus content, redoximorphic features,
its placement within this period. While Wüstemann (1974)           layer boundaries, and signs of pedogenic processes. The En-
dates the burial equipment to an early phase of period V,          glish terminology follows Schoeneberger et al. (2012). Col-
Kossinna (1910) argues that the equipment rather points to         ors were recorded using the Munsell soil color charts and
a late phase of period V, i.e., dating to ca. 800 BCE. Thus,       converted to RGB values to allow realistic colorization of
both ends of the temporal assignment of the burial equip-          the profile drawing. A total of 39 sediment samples were
ment within period V are covered by these opinions. Owing          extracted for more detailed particle size and geochemical
to numerical dating techniques, e.g., radiocarbon dating, the      analyses (Sect. 3.2). Additionally, three samples for lumi-
timing and duration of the periods become more precise. One        nescence dating and bulk samples for gamma spectrometry
of the most recent advances in providing accurate numeri-          measurements were obtained; OSL samples were extracted
cal dates of coincident findings is the radiocarbon dating of      with metal tubes (25 cm length, Ø 5 cm) that were covered
cremated human remains. Such an example is provided by             with aluminum foil and plastic caps (Sect. 3.3).
Hornstrup et al. (2012) who radiocarbon dated cremated hu-

https://doi.org/10.5194/egqsj-70-1-2021                                                E&G Quaternary Sci. J., 70, 1–17, 2021
6                                               M. Nykamp et al.: Towards timing and stratigraphy of the royal tomb of Seddin

                                                                     3.3    OSL dating
                                                                     OSL dating was used to determine the time of burial of three
                                                                     sand-sized quartz samples from profile SD17P1. The analy-
                                                                     ses were carried out at the Netherlands Centre for Lumines-
                                                                     cence dating at Wageningen University. To calculate an OSL
                                                                     age, two quantities need to be measured: (i) the paleodose
                                                                     (in Gy), which is the amount of dose that was received by
                                                                     the sample since it was last exposed to sunlight, and (ii) the
                                                                     amount of ionizing radiation that the sample is exposed to
                                                                     during burial, which is termed the dose rate (in Gy kyr−1 ).
                                                                        Purified quartz-rich extracts of 212–250 µm grain size
                                                                     were used for paleodose determination. For equivalent dose
                                                                     measurements, the SAR protocol of Murray and Win-
                                                                     tle (2003) was applied to small 1 mm aliquots (∼ 15–50
                                                                     grains per aliquot). The most light-sensitive OSL signal of
                                                                     quartz grains is selected using the early background approach
                                                                     (Cunningham and Wallinga, 2010). The performance and
                                                                     heat treatment of this protocol was tested by dedicated dose
                                                                     recovery experiments. The most optimal dose recovery ra-
                                                                     tio (1.01 ± 0.05, n = 13) was obtained with a combination of
Figure 3. Topographic plan of the close vicinity of the royal tomb   220, 200, and 230 ◦ C for preheat, cut-heat, and hot-bleach,
of Seddin (in the center) showing the locations of the excavation    respectively. To obtain meaningful single-aliquot equivalent
trenches, the radiocarbon-dated charcoal fragments (Table 2), and    dose (De ) distributions, we measured 96 aliquots per sam-
profile SD17P1 (reference system: WGS84; projection: UTM33N;         ple with around 50 % of the aliquots providing a sufficient
contour lines were derived from lidar-based 1 m elevation data;      OSL signal. The De distributions derived from the acceptable
GeoBasis-DE/LGB, 2020).                                              single-aliquot De values revealed significantly more scatter
                                                                     than we would expect for a well-bleached and unmixed sam-
                                                                     ple. To obtain the paleodose that can be associated with the
3.2   Sediment analyses
                                                                     youngest single-aliquot population, the bootstrap version of
Sediment analyses comprise particle size analyses, pH, elec-         the minimum age model (bootMAM; Galbraith et al., 1999;
tric conductivity, and total carbon (TC) measurements, and           Cunningham et al., 2012) was applied. This model was run
Fe, Al, and Si determinations to characterize the sediments          with a sigma_b input parameter of 15 ± 5 % (van der Meij et
and to identify potential paleosurfaces within the profile.          al., 2019).
Sample preparation included drying at 105 ◦ C in a drying               To obtain the activity concentration associated with the
cabinet, crushing aggregates, separation of coarse compo-            decay of 40 K and the uranium and thorium decay chains,
nents with a 2 mm sieve, and homogenizing the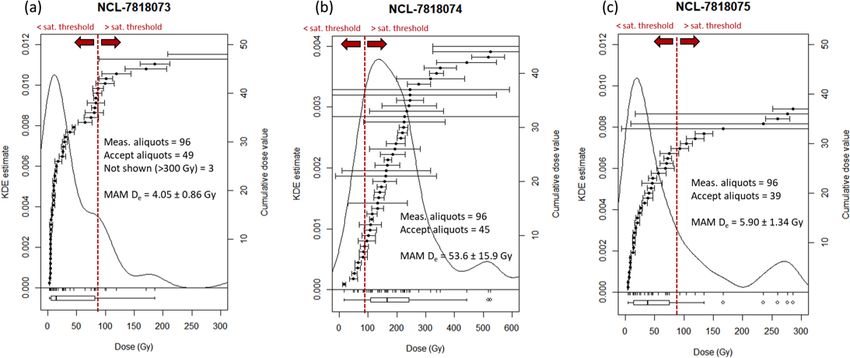
M. Nykamp et al.: Towards timing and stratigraphy of the royal tomb of Seddin                                                                        7

Figure 4. Composite illustration of (a) photograph of profile SD17P1 after cleaning (the white box in a marks the approximate extent of b);
(b) detailed photograph of the lowest part of the profile; and (c) schematic drawing according to the field description, including summarized
sediment characteristics (texture: S is sand, LS is loamy sand, SL is sandy loam, L is loam, SIL is silty loam) and pedological horizon
designation according to KA 5 (Ad-Hoc-AG Boden, 2005). Designation of soil horizons includes the naming of the horizons (A is topsoil
horizon, B is subsoil horizon, C is parent material, M is anthropogenic accumulation; prefixes: f is fossil, i is siliceous, l is loose; suffixes: e is
leached-out, h is humus rich, l is depleted in clay, t is enriched in clay, v is weathered, brunified) and the counting of the main sand and stone
strata (roman numerals are main strata of the anthropogenic accumulation). The gray shaded areas in (c) represent the three stone layers that
structure the profile. For reference to the texture symbology, see Fig. 5.

https://doi.org/10.5194/egqsj-70-1-2021                                                             E&G Quaternary Sci. J., 70, 1–17, 2021
8                                              M. Nykamp et al.: Towards timing and stratigraphy of the royal tomb of Seddin

The section is characterized by three artificial stone layers at   4.2   Grain size distributions and geochemical
0–9, 62–82, and 212–269 cm b.s. (below surface) that consist             characteristics
of glacial boulders with up to 80 cm edge length. Accord-
                                                                   The grain size distributions of the upper 21 layers are rather
ing to May (2018), the three stone layers are numbered I to
                                                                   uniform, ranging between 79.6 vol % and 98.5 vol % sand
III from the bottom to the top. The indication below surface
                                                                   (x̄ = 90.9 vol %; σ = 5.1 vol %; n = 34) with only minor silt
refers to the surface of the burial mound at the location of
                                                                   and clay contents (Fig. 5). In these sediments, medium sand
the excavation trench, and the layers are counted from 1 to
                                                                   is the major grain size fraction. The material below becomes
25 (including the stone layers) from bottom to top. Between
                                                                   increasingly fine. Layers 4 and 3 show decreasing sand
the stone layers, loose, sandy material was deposited during
                                                                   (x̄ = 69.7 vol %; σ = 8.4 vol %; n = 3) and increasing silt
the construction of the burial mound (May, 2018). The upper
                                                                   and clay contents. The loamy material of the two lowermost
21 layers, between 0 and 269 cm b.s., represent material that
                                                                   sections (2 and 1) show the lowest sand (x̄ = 36.9 vol %;
was piled up during the construction of the burial mound.
                                                                   σ = 4.6 vol %; n = 2) and the highest silt and clay contents.
   Layer 25 (0–9 cm b.s.) represents the uppermost stone
                                                                       The sediments of layer 25 (0–9 cm b.s.) show the highest
layer (III) that covers the burial mound. The stones are em-
                                                                   concentration of total carbon (TC = 2.14 mass %), interme-
bedded in a dark gray (10YR 4/1) humic matrix consisting
                                                                   diate electrical conductivity (EC = 71 µS cm−1 ) values, and
of sand. Layers 24 (9–32 cm b.s.) and 23 (32–62 cm b.s.) be-
                                                                   strong acidity (pH = 3.2). With depth, the TC and EC con-
tween stone layer III and II consist of sand and show grad-
                                                                   centrations decrease towards the bottom of layer 22 (62–
ual to diffuse layer boundaries. The color is yellowish brown
                                                                   82 cm b.s.; TC = 0.23 mass %; EC = 24 µS cm−1 ), while the
with an increasing chroma towards the bottom (layer 24 is
                                                                   pH values markedly increase to 4.5. At the top of layer 21
10YR5/4; layer 23 is 10YR 5/8). The humus content de-
                                                                   (82–96 cm b.s.), the TC concentrations (0.82 mass %) and, to
creases with depth, while brunification increases. Layer 22
                                                                   a lesser extent, the EC values (52 µS cm−1 ) increase abruptly,
(62–82 cm b.s.) represents stone layer II. The stones are em-
                                                                   and the pH values show a slight decrease to 4.3. Between
bedded in brunified, yellowish brown (10YR 5/8) sand. Be-
                                                                   96 and 150 cm depth (layers 20–15), the TC concentrations
tween stone layer II and stone layer I (82–212 cm b.s.), two
                                                                   and the EC values show little variation; the pH values vary
packages of inclined layers (layers 21–15 and layers 12–6)
                                                                   slightly more. The sediments of layers 14 (150–155 cm b.s.)
are present. These two packages are separated by two hor-
                                                                   and 13 (155–161 cm b.s.) show slightly increased TC con-
izontally running layers (layers 14 and 13). The inclined
                                                                   centrations (x̄ = 0.44 mass %) compared to the layers above
and the horizontal layers between stone layers II and I con-
                                                                   and below. The EC shows a strong increase in layer 13
sist of sand, show varying humus contents and brunifica-
                                                                   (111 µS cm−1 ), whereas the pH value decreases to 3.8. Be-
tion intensities, and mostly have clearly defined layer bound-
                                                                   tween layers 12 (161–169 cm b.s.) and 5 (212–269 cm b.s.),
aries. Layer 5 (212–269 cm b.s.) represents stone layer I. The
                                                                   the TC contents slightly vary in the lower range of values; the
stones, mostly cobble to stone size and partly up to boul-
                                                                   EC values slightly decrease and then slightly increase with
der size, are embedded in slightly brunified yellowish brown
                                                                   depth, and the pH values slightly vary around 4.3. The sedi-
(10YR 5/6) sand.
                                                                   ments of the lowermost layers 4 to 1 (269–314 cm b.s.) show
   Layer 4 (269–274 cm b.s.) consists of pale brown (10YR
                                                                   slightly increased TC concentrations compared to the layers
6/3) loamy sand with occasional fine gravels and horizontal
                                                                   above. This part of the profile shows markedly increasing EC
dark yellowish brown (10YR 3/4) bands; the boundaries with
                                                                   values (54 µS cm−1 at 271.5 cm depth), reaching the high-
layers 5 and 3 are abrupt. Layer 3 (274–291 cm b.s.) is char-
                                                                   est values (126 µS cm−1 at 303.5 cm depth) in the lowermost
acterized by dark yellowish brown (10YR 4/6), slightly mot-
                                                                   layer 1 (297–314 cm b.s.) and showing a distinct decrease in
tled sandy loam and shows a clear to gradual wavy boundary
                                                                   the pH values to 3.0, which is comparably acidic to layer 25.
with layer 2 (291–297 cm b.s.), which consists of pale brown
                                                                       The concentrations of the elements Al, Si, and Fe gen-
(10YR 6/3) loam. The boundary of layers 2 and 1 is grad-
                                                                   erally show minor variation in the upper part of the pro-
ual and wavy, and the lowermost layer 1 (297–314 cm b.s.) is
                                                                   file (between layers 25 and 5) and major shifts in the lower
composed of brown (7.5YR 4/4) silt loam.
                                                                   part. The upper part of the profile is characterized by low
   Based on this detailed description, profile SD17P1 is sub-
                                                                   Fe (x̄ = 0.5 mass %; σ = 0.1 mass %; n = 34) and Al (x̄ =
divided into the base representing the remnants of a buried
                                                                   1.7 mass %; σ = 0.2 mass %; n = 34) contents, while the Si
paleosol developed from glaciofluvial loamy sand (layers 4
                                                                   contents are high (x̄ = 43.8 mass %; σ = 0.8 mass %; n =
and 3) above till (layers 2 and 1) and alternating layers of
                                                                   34). The Si concentration starts to slightly decrease at the
anthropogenically heaped up stones and sand (layers 5–25)
                                                                   bottom of layer 5 and shows strongly decreased contents in
forming the upper part of the sequence (Fig. 4c).
                                                                   layers 2 and 1 (x̄ = 29.7 mass %; σ = 0.7 mass %; n = 2).
                                                                   Generally, the Al and Fe contents of the lower profile show
                                                                   the opposite course of the Si concentrations; the highest val-
                                                                   ues are reached in layers 2 and 1 (Al: x̄ = 6.1 mass %; σ =

E&G Quaternary Sci. J., 70, 1–17, 2021                                                https://doi.org/10.5194/egqsj-70-1-2021
M. Nykamp et al.: Towards timing and stratigraphy of the royal tomb of Seddin 9 Figure 5. Composite illustration of (a) photograph of profile SD17P1 after description and sampling (the white labels in the photograph show the sampling spots); (b) profile photograph of the upper profile part highlighting the OSL sampling locations and sample IDs; and (c) schematic drawing with grain size composition and geochemical sediment parameters (TC is total carbon contents, EC is electrical conductivity, Al is aluminum, Fe is iron, Si is silicon). https://doi.org/10.5194/egqsj-70-1-2021 E&G Quaternary Sci. J., 70, 1–17, 2021
10                                             M. Nykamp et al.: Towards timing and stratigraphy of the royal tomb of Seddin

0.2 mass %; n = 2; Fe: x̄ = 3.5 mass %; σ = 0.3 mass %; n =        and the archeological evidence, i.e., the suggested time span
2).                                                                for period V (Hornstrup et al., 2012). Additionally, the three
                                                                   radiocarbon ages from the fossil soil layer below the basal
                                                                   stone layer I yield a similar age range and a terminus post
4.3    OSL ages
                                                                   quem time frame for the construction of the burial mound of
The results of paleodose and dose rate determination are           910–800 BCE (Table 2).
listed in Table 1. The dose rates of the three samples vary be-        The age error that we had to assign to both ages is rel-
tween 1.11 ± 0.04 Gy kyr−1 to 1.30 ± 0.05 Gy kyr−1 , which         atively large (∼ 22 %) compared to OSL ages from well-
is in the normal range for this kind of sediment. The paleo-       bleached and unmixed samples that typically show smaller
dose of samples NCL-781873 and NCL-7818075 are signif-             age errors between 5 to 10 %. These large errors reflect the
icantly smaller than of NCL-781874. This suggests that the         complexity of the corresponding De distributions of samples
former two samples contain sand grains that can be associ-         NCL-7818073 and NCL-7818075, more precisely the small
ated with recent, thus most likely anthropogenic, reworking        fraction of De values that were used to calculate the paleo-
while sample NCL-78118074 shows a large paleodose (and             dose associated with the anthropogenic reworking. However,
thus age) that is most likely associated with the primary de-      it should be noted that the youngest age components in the
position of the sediments.                                         uppermost and lowest samples both fall into the radiometric
   The corresponding ages indicate for the uppermost and           age of the construction site even though the OSL ages reflect
the lowermost samples that the anthropogenic reworking oc-         rather large error bars. We assume that the construction of the
curred between 4.5 ± 1.0 and 3.1 ± 0.7 kyr ago. The errors         sediment packages between the stone pavements was done
associated with both samples are relatively large because the      within a rather short time frame and material was taken from
youngest dose population modeled by the bootMAM only               continuously used pits. However, based on the OSL ages and
represents a fraction of the total De distribution (see distri-    due to non-calculable factors such as the number of individ-
butions in Fig. 6). It should be noted that OSL ages are re-       uals involved in the construction or the equipment they used,
ported with their 1σ uncertainty and range between 3520 and        it is not possible to provide a time estimate for the duration
420 BCE. Based on the 2σ confidence interval, the youngest         of the construction process.
age components of NCL-78118073 and NCL-7818075 that                    Sample NCL-7818074 (layer 20) contains no young grains
are again most likely associated with anthropogenic rework-        in its De distribution, suggesting that during anthropogenic
ing range between 4520 BCE and 320 CE.                             reworking no or too few sand grains were surfaced, and thus
                                                                   this reworking event was not able to leave an imprint on the
                                                                   corresponding De distribution.
5     Discussion                                                       Interestingly, anthropogenic reworking of the sediment
                                                                   packages only produced incompletely mixed samples pre-
5.1    Chronological framework
                                                                   sumably linked to the corresponding construction technique.
The sediment layers bracketed by the stone pavements con-          While we can use the paleodose of the youngest dose pop-
tain sand-sized quartz well suited for OSL dating. With OSL        ulation to estimate the timing of the anthropogenic distur-
dating, we ideally determine the time when these sediments         bance (outlined above), we can use the number of aliquots in
were last reworked (presumably by humans). The idea is that        this population, which is assumed to be proportional to mix-
during this anthropogenic reworking some grains were ex-           ing intensity (Reimann et al., 2017), as a fingerprint of the
posed to light. Using OSL dating we are able to determine          construction technique that produced the disturbance. From
the burial age associated with this last reworking event (e.g.,    the De distribution shown in Fig. 6, it appears that the up-
van der Meij et al., 2019). OSL samples NCL-7818073 and            permost sample NCL-7818073 (at ∼ 0.52 m depth) contains
NCL-7818075 (layer 23 and layer 12, respectively) show             more grains in the younger population than that of the lowest
large variations in their corresponding small aliquot De dis-      sample NCL-7818075 (at ∼ 1.68 m depth). This may point to
tributions (Fig. 6) with (i) large De values likely representing   a different way of constructing the upper part of the section
the original deposition of glaciofluvial or coversand deposits     presumably characterized by more intensive grain surfacing.
and (ii) very small De values (of
M. Nykamp et al.: Towards timing and stratigraphy of the royal tomb of Seddin 11
Table 1. OSL dating results (n/a is no answer). See Sects. 3.3 and 4.3 for details.
NCL Sample Depth Paleodose Dose rate Age Date (BCE) Systematic Random Reliability Comments
Code ID (m) (Gy) (Gy kyr−1 ) (ka)
NCL- SD17P1 0.52 4.1 ± 0.9 1.29 ± 0.05 3.1 ± 0.7 1120 ± 700 0.12 0.67 Likely OK
7818073 53
NCL- SD17P1 1.22 153 ± 11 1.11 ± 0.04 138 ± 11 n/a 5.29 10.09 Inaccurate Not
7818074 125 bleached
NCL- SD17P1 1.68 5.9 ± 1.3 1.30 ± 0.05 4.5 ± 1.0 2520 ± 1000 0.17 1.04 Questionable Too few
7818075 170 young aliquots
Figure 6. (a) to (c) De distribution of the three OSL samples shown as kernel density plots (KDEs). Dashed red line represents the average
lower threshold of OSL signal saturation (2D0 value is sat. threshold) which was estimated based on the dose response curves to ∼ 90 Gy.
For De values to the right of this dashed line, it is not possible to calculate an accurate age. Although the face value of these large De values
needs to be taken with caution, they provide insights into (i) the approximate age and (ii) the fraction of grains that have not been surfaced
since approximately the early Weichselian. Note that the x axis for (b) is different from (a) and (c).
sibly associated with the reworking of the sediment pack- posits (Fig. 7a) that form part of the slightly undulating till
age during the early to middle Weichselian related to either plains in the old morainic area of the Prignitz region (Lipp-
periglacial processes (cryoturbation) or soil mixing (biotur- streu et al., 1997; Nagel et al., 2003; Lippstreu et al., 2015;
bation) during interstadials. The uppermost and the lower- Fig. 2a). Next to the till plains, late Saalian glaciofluvial
most samples (NCL-7818073, NCL-7818075) also seem to sand plains (Fig. 7a) form a major landscape component in
recover the late Saalian and Weichselian aliquot populations. the surroundings of the royal tomb (Königsgrab) of Seddin,
and the overlying layers 3 and 4 correspond to the sandy to
loamy-sandy deposits that commonly cover the till deposits
5.2 Interpretation of the site and landscape context
(GeoBasis-DE/LGB, 2012; Fig. 2a). Periglacial reworking of
Our results are in good agreement with previous studies re- these deposits and coversand formation occurred during the
garding the prevailing substrates and their middle to late Weichselian (Kasse, 2002; Nagel et al., 2003; Koster, 2005;
Quaternary history of deposition and reworking. The silty Kaiser et al., 2009; Lüthgens et al., 2010; Fig. 7b) and soil
loam and loam deposits of layers 2 and 1 have substantially formation, in conjunction with the development of the veg-
reduced sand contents in favor of increased silt and clay con- etation cover, during the late glacial and Holocene (Kühn,
tents. This is also supported by the substantially increased 2003; Kappler et al., 2019; Fig. 7c).
Fe and Al contents, together with the considerably decreased During the Bronze Age, the landscape in Brandenburg
Si values within these layers compared to the top layers that opened substantially due to large-scale woodland clearings
generally show minor variations for these elements (Fig. 5c). especially during the Late Bronze Age (Jahns, 2015, 2018).
These layers are regarded as presenting late Saalian till de-
https://doi.org/10.5194/egqsj-70-1-2021 E&G Quaternary Sci. J., 70, 1–17, 202112 M. Nykamp et al.: Towards timing and stratigraphy of the royal tomb of Seddin
Table 2. Comparison of 14 C and OSL ages.
Laboratory ID Material 14 C age (years BP) Uncertainty Age Age Reference
(years) (2σ ; from–to cal. a BP) (2σ ; from–to BCE)
KIA 21317a Salix/Populus/Quercus 2694 31 2851–2754 902–805 May (2018)
MAMS 35030a Fagus 3375 22 3688–3570 1739–1621 This study
MAMS 21017a Pinus 2719 19 2855–2769 906–820 May (2018)
MAMS 21018a Corylus 2725 19 2859–2773 910–824 May (2018)
Paleodose Dose rate Age Age
(Gy) (Gy kyr−1 ) (1σ ; ka) (1σ ; BCE)
NCL-7818073b Purified quartz-rich 4.1 ± 0.9 1.29 ± 0.05 2400–3800 420–1820 This study
extracts (212–250 µm)
NCL-7818075b Purified quartz-rich 5.9 ± 1.3 1.30 ± 0.05 3500–5500 1520–3520 This study
extracts (212–250 µm)
a Radiocarbon ages were obtained from charcoal pieces recovered from layers that stratigraphically correspond to layer 23 of profile SD17P1 yielding the terminus post quem time frame for
the construction of the burial mound; b OSL ages from the deposits of the burial mound providing direct age estimates for the construction phases.
The charcoals obtained from the substrate below the burial gests that the soil profile is truncated and that a fAh horizon
mound (Table 2) suggest that the local forest composition at is missing below stone layer I. The missing fossil, organic-
the construction site prior to the initial construction phase in rich topsoil horizon (fAh horizon) was already recorded at
the Late Bronze Age included pine (Pinus), hazel (Corylus), several locations below the mound; it was pointed out that
and either willow (Salix), poplar (Populus), or oak (Quercus). either a “dark substrate” or a “pale solidified sand” occurs
A comparison of the grain size distributions of the layers directly underneath the lowermost stone pavement, i.e., in
that form the burial mound (layers 5–25) and the geological, stratigraphically identical positions (May, 2018). Based on
soil type, and texture maps (Fig. 2) indicate that the mound the present results, we assume that the “dark substrate” from
most likely was exclusively constructed from glaciofluvial the archeological descriptions represents the fBt horizon and
sand – except for the erratic boulders forming the three stone the “pale solidified sand” the fAel horizon showing an ir-
layers. The first stone pavement is regarded as representing regular occurrence below stone layer I. On the one hand, the
the first material that was deposited during the initial con- absence of the fAh horizon and partially also of the fAel hori-
struction phase of the alternating stone and sand strata, and zon may be the result of soil erosion by water or wind after
May (2018) suggests that the substrate below stone layer I the surface of the construction site was cleared of vegeta-
represents a fossil soil that was buried during this initial con- tion; the sandy material of the fAh and fAel horizons is more
struction phase (Fig. 7d). The dark material that was recorded susceptible to erosion compared to the loamy material of the
during several archeological excavations underneath stone fBt horizon below. On the other hand, intentional leveling
layer I (May, 2018) stratigraphically corresponds to layer 3 of the construction ground after vegetation clearance but be-
in profile SD17P1. Our geochemical sediment analyses sup- fore the deposition of stone layer I might have caused the re-
port the assumption of May (2018) as the TC values very moval of the topsoil horizon(s). Both scenarios are supported
slightly increase below layer 5, the pH values are reduced by the archeological observation that pieces of charcoal and
in layers 4 and 3 compared to layer 5, and the electric con- ceramic are incorporated into the fAel and the fBt horizons
ductivity is concurrently increased (Fig. 5c). However, the below the mound, indicating that the soil surface was dis-
increased EC values might result from a grain-size effect as turbed during the Late Bronze Age construction of the burial
the texture becomes finer towards the base of the profile. As mound. It seems very likely that the erosion or removal of
these characteristics roughly resemble the horizon character- the topsoil horizon(s) occurred closely before the initial con-
istics of a typical Fahlerde or Braunerde-Fahlerde in this part struction phase of the royal tomb, but at present, we have no
of the Prignitz–Brandenburg region (MLUV, 2005), we in- evidence to favor either of these scenarios.
terpret layer 4 as the fAel horizon and layer 3 as the fBt At a Bronze Age burial mound site in Denmark (Lejrskov),
horizon (according to Ad-Hoc-AG Boden, 2005). According Holst et al. (1998) also describe a buried soil beneath the
to the soil classification system of the IUSS Working Group mound structure. The fossil A horizon at their site has a lit-
WRB (2006), this corresponds to a Luvisol with layer 4 be- tle more than 0.5 % of organic matter. They argue that the
ing the fossil albic horizon and layer 3 being the underlying organic matter content could have been higher but might be
fossil argic horizon. This soil horizon designation also sug- subjected to decomposition since burial.
E&G Quaternary Sci. J., 70, 1–17, 2021 https://doi.org/10.5194/egqsj-70-1-2021M. Nykamp et al.: Towards timing and stratigraphy of the royal tomb of Seddin 13 Figure 7. Schematic genetic model of the late Saalian to Holocene landscape development, possible construction phases of the burial mound, and its present-day schematic concept according to the state of the art (cf. locations of the excavation trenches in Fig. 3). During the late Saalian, till was deposited and partly covered by glaciofluvial deposits (a). Periglacial reworking and cover sand formation occurred during the Weichselian (b). During the late glacial and Early Holocene, a denser vegetation cover developed, and soil formation occurred (c). With the start of the construction of the burial mound, the soil was truncated, and its remaining fAel and fBt horizons were buried underneath the first stone pavement; the overlying sand packages show late Saalian and Weichselian, as well as Holocene, OSL ages, the latter being linked to anthropogenic reworking (d). After the first construction phase, weedage may have occurred that would allow for the initial accumulation of organic matter (e). The sand package of the second construction phase solely shows a late Saalian OSL age (f). Weedage and initial accumulation of organic matter may also have occurred after the second construction phase (g). The second stone pavement, the uppermost sand package, and the surface-covering stone pavement were presumably deposited during a third construction phase; the sand packages show late Saalian and Holocene OSL ages (h). The paleosol recorded underneath the burial mound is not preserved in the area around, but soil development continued, and the soil was modified and degraded by land use such as plowing and sediment extraction. Gravel mining in the late 19th century partially destroyed the burial mound (i), but heritage protection measures preserved the archeological remains until the present day (j). The presented schematic genetic model (d–i) is based on the results of profile SD17P1 and is simplified compared to the schematic concept according to the state of the art (k). The manifestation of particular characteristics such as the two packages of inclined layers or the two horizontal layers in between vary locally. Also, some of the excavation trenches yielded indications for an additional stone layer between stone layers I and II (k). Please note that the location(s) of the sand pit(s) that were exploited to construct the burial mound have not been identified and are presented idealized here. https://doi.org/10.5194/egqsj-70-1-2021 E&G Quaternary Sci. J., 70, 1–17, 2021
14                                             M. Nykamp et al.: Towards timing and stratigraphy of the royal tomb of Seddin

   Other studies carried out in the context of Bronze Age          Late Bronze Age burial mound, also as a consequence of
burial mounds focused on paleosols as a proxy for pa-              post-Bronze-Age vegetation development on top of the burial
leoenvironmental conditions during the times of usage of           mound. Intensive exploitation of rock and sand in the course
the mounds. At a site in northern Germany (Bornhöved),             of the late 19th century led to the partial destruction of the
Dreibrodt et al. (2009) suggest that the surrounding area was      burial mound (Fig. 7i) and ultimately to its discovery in the
probably forested during the time. In contrast, at a burial        year 1899 (May, 2018). Restoration and the planting of trees
mound site in southern Sweden (Bjäre peninsula), a signif-         started at the beginning of the 20th century (May, 2018), pre-
icant decrease in forest coverage was reconstructed for the        serving the remains of the monumental burial mound royal
respective time of usage (Hannon et al., 2008).                    tomb (Königsgrab) of Seddin (Fig. 7j).
   The particular geochemical properties as described above
(i.e., layers with increased TC contents, high electric con-
                                                                   5.3   Opportunities and challenges of a minimal invasive
ductivity values, and decreased pH values) also occur in lay-
                                                                         approach for OSL dating of burial mounds
ers 14–13, 21, and 25–24. These characteristics may point to
phases when humic acids, together with a higher availabil-         As shown by Kristiansen et al. (2003), augering through
ity of soluble salts, may have occurred in conjunction with        burial mounds can yield material from buried organic-rich
humus accumulation. This interpretation is supported by the        topsoil horizons suitable for the 14 C analysis of soil or-
particular signature of the values, i.e., the TC values decrease   ganic matter fractions. An absent or fragmentarily preserved
with increasing depth, which is a typical feature of soil de-      organic-rich topsoil horizon below the mound – as is the case
velopment. The results of Haburaj et al. (2020) support this       for the profile presented here – would cause problems. Sand-
interpretation, too. They study the upper part of the same ex-     sized quartz grains, in contrast, are ubiquitous in the Euro-
cavation trench and combine data from RGB and multispec-           pean sand belt, and probably most, if not all, burial mounds
tral cameras, visible and near-infrared hyperspectral data,        contain it as a fraction of their construction material. There-
and geochemical data. Their image classifications show that        fore, we propose to modify the approach of Kristiansen et
soil organic carbon is mainly increased in layers 24, 21, and      al. (2003) and suggest to rather use engine-driven vibracor-
14 (according to the layer counting presented here) and that       ing techniques instead of augering to obtain undisturbed sed-
these layers run more or less horizontally along the entire        iment cores from the body of the burial mound and the (pos-
width of the excavation trench (Haburaj et al., 2020). Even        sibly) underlying buried soil in plastic tubes. In doing so,
though these arguments support the interpretation of initial in    datable material for 14 C analysis from a possibly present
situ accumulation of organic matter, inherited sediment prop-      buried organic-rich topsoil horizon and sand-sized quartz
erties from reworked material cannot be excluded.                  grains from the burial mound itself suitable for OSL dating
   These characteristics occur three times in our profile          can be obtained. It has been shown that samples for OSL dat-
(Fig. 5). First, it (Fig. 7e) occurs in the horizontally bed-      ing can be obtained from plastic liners that were driven into
ded layers 14 and 13 that overly the lowermost package of          the subsurface by means of steel probes (e.g., Reimann et al.,
inclined layers (12–6). The upper package of inclined lay-         2010, 2012).
ers (15–21) bury the two horizontal layers (Fig. 7f). Within          Our first attempt to use OSL dating of sand-sized quartz
the sediments of layer 21, which represents the final stage        grains to determine the construction period of a burial mound
of sand accumulation below stone layer II (Fig. 7g), the ini-      generally shows good applicability of this approach but also
tial accumulation of organic matter, increasing acidity, and       reveals challenges (cf. also Porat et al., 2012; Pluckhahn et
higher availability of soluble salts occur again. We interpret     al., 2015; al Khasawneh et al., 2020). One of the main chal-
this as an indication for phases when the construction works       lenges is the relatively large error of ca. 22 % compared to
possibly were interrupted for a short, yet not further defin-      errors of 5 %–10 % that are typical for well-bleached and un-
able, period of time. Such an interruption of the construction     mixed samples. Therefore, the clear temporal association of
process likely would have allowed the development of an ini-       a burial mound to a specific cultural epoch can be problem-
tial vegetation cover due to weedage and as a consequence          atic. One solution to reduce this error and thus possibly date
the accumulation of organic matter. The inclined structure of      newly discovered burial mounds more accurately would be
layers 12–6 and 21–15 are clearly visible in section SD17P1.       the use of single-grain feldspar luminescence instead. Sand-
This is not necessarily the case throughout the entire burial      sized feldspar grains typically occur in various Quaternary
mound as other sections that were opened did not display           deposits along the European sand belt (e.g., Füchtbauer and
this structure so distinctly. Such locally varying characteris-    Elrod, 1971; Saye and Pye, 2006; Kalińska-Nartiša et al.,
tics are also documented for other burial mounds (e.g., Holst      2015; Kalinìska et al., 2019), and Reimann et al. (2017) have
and Rasmussen, 2015). These sediments are buried by the            shown that this novel method holds important advantages
second stone pavement, the uppermost sand package (lay-            over quartz single-grain OSL in settings with a complex his-
ers 23–24), and stone layer III (Fig. 7h). The properties of       tory of reworking. In a burial mound setting as presented in
layers 25–23 presumably represent the result of ongoing soil       this study, it might be possible to reduce the age error to 6 %–
formation processes that started from the completion of the        7 % using single-grain feldspar luminescence.

E&G Quaternary Sci. J., 70, 1–17, 2021                                                https://doi.org/10.5194/egqsj-70-1-2021
You can also read