INSIDE THIS ISSUE www.dairygoldagri.ie - Dairygold Agri Business
←
→
Page content transcription
If your browser does not render page correctly, please read the page content below
INSIDE THIS ISSUE
                                        PAGE      Dairygold Dry Cow
                                        04        Nutrition Programme
                                        PAGE      The Financial Benefits
                                         11       Of Sustainable Farming
                                        PAGE      Taking The Guess Work
                                         18       Out Of Slurry
                                        PAGE      Fertility & Breeding
                                        24

ISSUE 94 - DECEMBER 2020   www.dairygoldagri.ie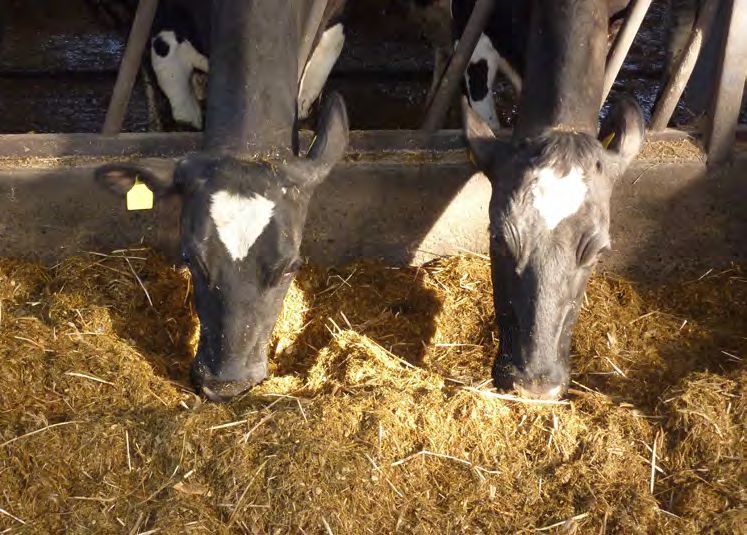
Welcome to the December edition of

    MILK MATTERS
    DAIRYGOLD’S DAIRY ADVISORY BULLETIN

Firstly, a Merry Christmas and Happy
                                                                    CONTENTS
New Year from all involved in the
                                                                    The Year To Date ................................ 03
production of Milk Matters.
                                                                    Dairygold Dry Cow
2020 has given us all sorts. We had                                 Nutrition Programme ......................... 04
challenging ground conditions in late
February/early March, a small touch                                 Mineral Feeding For
of a drought in June and again a wet                                Pre-Calving Cows ............................... 06
August.
                                                                    The Financial Benefits Of
                                                                    Sustainable Farming............................. 11
Grass growth has been reasonable, mirroring the 5-year
average. Milk yield per cow and milk solids produced per cow        Dairygold Agri Business Your
are c.3% ahead of 2017 to 2019 average.                             Partner In Sustainable Farming........ 13

It is the goal of this publication to provide you with correct,     Dairygold Milk Replacer Range....... 15
timely and relevant technical advice, to challenge the way
                                                                    Leanfarm................................................. 16
you do things, to highlight what the best 10% are doing and to
drive efficiency and profitability on your farm. I trust we have    Taking The Guess Work Out
achieved these goals in 2020 and we welcome your feedback           Of Slurry.................................................. 18
on anything that can improve our publication going forward.
                                                                    Dairygold / Teagasc Joint
Is your total farm growing enough grass to meet your farms          Programme 2018-2020...................... 19
feed demand? Within Grass Matters John Maher examines
                                                                    Grass Matters........................................ 21
how we can critically asses our farms performance.
                                                                    Fertility And Breeding......................... 24
Doreen Corridan looks at a plan for 2020 drying off, while
also planning for the best herd fertility performance in 2021.      CHFC Matters........................................29
Dry cow management will have a big impact on your 2021              AHI Notes............................................... 30
calving and breeding season. A successful dry cow period
should culminate in a healthy calf on the ground with few
metabolic disorders.

This month in Nutrition Matters we
highlight the importance BCS has at
calving and we examine the interaction
between pre-calving minerals and
metabolic disorders.

Yours Sincerely,                                                   To contact the editor of

                                                                   MILK
                                                                   MATTERS
                                                                                                                                                                  INSIDE THIS ISSUE
                                                                                                                                                         PAGE      Dairygold Dry Cow
                                                                                                                                                         04        Nutrition Programme

Liam Stack M.Agr.Sc
                                                                                                                                                         PAGE      The Financial Benefits
                                                                                                                                                         11        Sustainable Farming Of
                                                                                                                                                        PAGE       Taking The Guess
                                                                                                                                                         18        Slurry
                                                                                                                                                                                    Work Out Of

                                                                                                                                                        PAGE      Fertility & Breeding
                                                                                                                                                        24

RUMINANT TECHNICAL MANAGER,
                                                                                                              ISSUE 94 - DECEMBER
                                                                                                                                    2020
                                                                                                                                           www.dairygoldagr
                                                                                                                                                           i.ie

DAIRYGOLD AGRIBUSINESS                                                  email: lstack@dairygold.ie

2        www.dairygoldagri.ie
ISSUE 94 - DECEMBER 2020
THE YEAR TO DATE
By LIAM STACK, M.Agr.Sc, Ruminant Technical Manager
THE YEAR TO DATE
By LIAM STACK, M.Agr.Sc, Ruminant Technical Manager
Grass Growth
Grass Growth:
Milk Protein
Milk Protein % (weeks
% (weeks 1-47) 1-47)
Protein
Protein %%
4.30 2017 2018
2019 2020
4.10
3.90
3.70
3.50
3.30
3.10
1 3 5 7 9 11 13 15 17 19 21 23 25 27 29 31 33 35 37 39 41 43 45 47 49 51
Protein % Milk Butterfat % (weeks 1-47)
M4.30
ilk production to w eek 47 (figures based on IC B F cow num bers):
Milk Protein % (weeks 1-47)
2017 2018 Butterfat %
Milk production to week 201947 (figures
2020
2017
based
2018
YTD
on
2019
ICBF2020
cow numbers): 2017 2018
4.10
Protein % 5433
Total annual milk Yield per cow in dairygold (kg) 5338 5472 5565
4.95
2019 2020
4.30annual Milk Solids per cow (kg)
Total 2017 2018416 409 421 432 2017 2018 2019 2020
4.75
3.90Average Protein %
YTD 2019 20203.51 3.53 3.52 3.57
YTD Average Fat %
4.10
4.16 4.15 4.18 4.18 YTD
YTD Average Lactose % 4.85 4.87 4.76 4.74 4.55
Total
3.70
3.90
annual Milk Yield per cow in Dairygold (kg) 5433 5338 5472 5565
4.35
Total annual Milk Solids per cow (kg)
3.50 416 409 421 432
3.70 4.15
YTD Average Protein %
3.30
3.51 3.53 3.52 3.57
3.50 3.95
YTD Average Fat % 4.16 4.15 4.18 4.18
3.10
3.30 3.75
YTD
1 3Average
5 7 9 11 Lactose
13 15 17 19 21%23 25 27 29 31 33 35 37 39 41 43 45 47 49 51 4.85 1 3 5 7 4.87 4.76 4.74
9 11 13 15 17 19 21 23 25 27 29 31 33 35 37 39 41 43 45 47 49 51
3.10
1 3 5 7 9 11 13 15 17 19 21 23 25 27 29 31 33 35 37 39 41 43 45 47 49 51
Milk Lactose % (weeks 1-47)
Milk
MilkButterfat
Butterfat% (weeks 1-20)1-47)
% (weeks
Milk Butterfat % (weeks 1-47) Milk Lactose % (weeks 1-47)
Butterfat %
Butterfat
Butterfat % % 5.10
Lactose
Lactose %%
4.95 2017 2018
2017
2019 20202018 5.00
4.95 2019 2020
4.75
4.90
4.75
4.55
4.80
4.55
4.35
4.35 4.70
4.15
4.15 4.60 2017
2018
3.95 2019
3.95 4.50 2020
3.75 W I T H C O M P L I M E N T S
3.75 1 3 5 7 9 11 13 15 17 19 21 23 25 27 29 31 33 35 37 39 41 43 45 47 49 51 4.40
1 3 5 7 9 11 13 15 17 19 21 23 25 27 29 31 33 35 37 39 41 43 45 47 49 51 1 3 5 7 9 11 13 15 17 19 21 23 25 27 29 31 33 35 37 39 41 43 45 47 49 51
Reply to: West End, Mallow, Co. Cork, P51 R593, Ireland. T +353 (0)22 21592 info@dairygold.ie www.dairygold.ie
Milk Lactose % (weeks 1-20)
Milk Lactose % (weeks 1-47)
3
DAIRYGOLD DRY COW
                        NUTRITION PROGRAMME
                        By LIAM STACK,            M.Agr.Sc, Ruminant Technical Manager

           The 2 most stressful times in a cows life are:
  1. Weaning       2. The weeks leading up to and after calving

                       KEY POINT: 50% of dairy                    Correct dry cow management
                       cow metabolic problems
                       occur within three weeks
                                                                  and preparation for this period
                       of calving.                                of stress is critical

                                                                         Body Condition Score Target:
 FOUNDATION for success: Correct                                  DRY COW TARGET: 3.25 • HERD RANGE: 3 - 3.5
 Body Condition Score (BCS) at Calving

 Without a strong foundation, your dry cow
 programme has little chance of success. Calving
 your herd down in the correct BCS (individual cow
 range 3.0 > 3.25) delivers this sound foundation;
 with proven benefits for fertility, milk yield and
 cow health (reduced metabolic problems e.g. milk
 fever).

How to Body Condition Score
To condition score your herd properly you need to run your cows
through the crush and handle them. However an overall visual
inspection is also important. Apply firm pressure on the three primary
reference points:

          P
           ins and Tail Head: Use fingers to score by feeling for the
          amount of fat around the tail-head and the prominence of
          the pelvic bones.

          S
           hort Ribs/Loin: Use a flat hand to refine the score by
          feeling the boney projections and the amount of fat in-between.

          Ribs: Use flat hand to refine the score by feeling the boney projections and the amount of fat in-between.

  4         www.dairygoldagri.ie
ISSUE 94 - DECEMBER 2020

Feeding Dry Cows This Winter:
Your cows will only gain weight for 6 of their 8 weeks                              KEY POINT: Cows in the wrong
                                                                                    body condition score (BCS)
dry. During the 1st and last week they won’t gain any
                                                                                    need to have this rectified 2-3
weight. For the mid 6 weeks if a cow is gaining 1kg per                             weeks before calving starts.
day, 40% of this is going on her back with the remainder
used to grow the calf. During this 6 weeks your cows
therefore has the potential to increase her liveweight by
c. 20kg or c.0.5 BCS.

Assuming your cows don’t have to gain any body condition it is relatively easy to meet your dry cows energy
requirement in month 7 and 8. However, in the final few weeks before calving your cows intake drops, as her dry
cow energy demand is peaking. An all grass silage diet will not meet her energy requirement then. During this
phase concentrates are required to limit the degree of negative energy balancing at calving.

What are the consequences of the wrong BCS at
                                                            ENERGY REQUIREMENTS (UFL) OF DRY COWS
calving:
                                                                          MONTH 7 MONTH 8 MONTH 9
Too Thin:
  1. Poor subsequent fertility performance                      0 BCS           7                7.5            8.5
  2. Low milk yield, milk protein % and milk fat %           PROPORTION OF THE COWS ENERGY REQUIREMENT
  3. Increase incidence of lameness                         MET BY ALL GRASS SILAGE DIET (ASSUMING 0 BCS CHANGE)
  4. Increase degree of immune suppression
                                                                          MONTH 7 MONTH 8                    MONTH 9
Too Fat:
                                                             60 DMD            95%             88%             67%
  1. H
      igher degree of negative energy balance at
     calving will result in:                                 65 DMD           100% +           100%            83%
        a. A 4-fold increased risk of milk fever
                                                             70 DMD           100% +         100% +            95%
        b. A n 80% increased risk of retained cleansing
        c. Increased risk of fatty liver, ketosis and
            displaced abomasums
        d. Lower milk yield and milk protein %
        e. Poor subsequent fertility performance
        f. Increase degree of immune suppression

It is preferential to avoid both scenarios.

     BCS AT CALVING DEPENDS ON:
 1. BCS when dried off              3. Q
                                        uantity and quality
 2. Length of dry period                 of feed.

Concentrates Required By Dry Cows
                                                    Very Poor           Poor            Average              High
                                                     55 DMD         62 DMD              68 DMD             72 DMD
   Dry Cows - BCS 3-8 week dry period                 2Kg               1Kg          Silage to appetite Restricted Silage

   Dry Cows - BCS 2.75-10 week dry period             3Kg               2Kg                1Kg         Silage to appetite

   Dry Cows - BCS 2.5-12 week dry period              4Kg               3Kg                2Kg                1Kg

                                                                                                                      5
MINERAL FEEDING FOR
PRE-CALVING COWS
By LIAM STACK, M.Agr.Sc, Ruminant Technical Manager
DRY COWS SHOULD RECEIVE A HIGH QUALITY
FORMULATION, PRE-CALVING MINERAL MORNING AND
EVENING FROM 6 - 8 WEEKS BEFORE CALVING
The main aim of this feeding is to
• Prevent milk fever, and retained cleansings,
• Produce a healthy calf,
• Ensure the cow calves down in the correct mineral status.
Milk Fever
Sub clinical milk fever is a gateway disorder, with When assessing your herds risk of milk fever be
these cows being more susceptible to retained wary of:
cleansings, metritis, ketosis, lower production, poor 1. Herd body condition score, with fat cows being 4
fertility performance. times more likely to suffer from milk fever.
2. Herd age, with cows on their third and greater
KEY POINT: A single case of milk lactation being more likely to suffer.
fever is estimated to costs c.€300; 3. Calcium status. Where low, milk fever risk is very
with sub-clinical cases being high.
estimated to cost >€100. 4. History, a cow that had a milk fever in the previous
lactation is 10 times more likely to have it in the
current lactation.
MILK FEVER
Research
MILKLiam FEVER
Liam Stack demonstrates that for every clinical milk
Stack
feverretained
Suboncleansings,
farm
clinical milk feverthere metritis,are
is a gateway disorder,alower
further
with production,
these sixfertility
poor
cows being sub-clinical
Sub clinical milk fever is a gateway disorder, with these cows being more susceptible to
retained cleansings, ketosis, more performance.
susceptible
metritis, ketosis, lower production, poor fertility performance.
to cases Calcium supply and demand
that KEY
gosuffering
undetected.
KEY POINT: If your herd is showing 5% clinical milk fever then 33% of your herd are
POINT: If your herd is showing 5% clinical milk fever then 33% of your herd are
Grass silage generally supplies an excess of calcium
from sub clinical milk fever.
for a dry cow but a deficit of calcium for milking cows.
suffering from sub clinical milk fever.
During the dry period the cows stores this excess.
Once she starts to bag up, her diet cannot meet
her requirements and she needs to draw calcium
from her body reserves. This switch from storing to
drawing calcium requires a hormonal change, which
is controlled by the cows’ magnesium and vitamin D
nutrition.
The Potassium Effect:
Successful prevention of Milk fever will substantially An excess of potassium limits magnesium absorption,
reduce the
When riskyour
ofyour
assessing many other milkproblems.
delaying the release of stored calcium and increasing
When assessing herdsherds
risk ofrisk of fever
milk fever be wary
be wary of: of:
1. body
1. Herd Herd condition
body condition
score, score,
with fatwith
cowsfatbeing
cows 4being
times4more
timeslikely
moretolikely tofrom
suffer suffer from
milk milk fever.
fever.
2. age,
2. Herd Herdwith
age,cows
with on
cows onthird
their theirand
third and greater
greater lactation
lactation beinglikely
being more moretolikely to suffer.
suffer.
3. Calcium
3. Calcium status.status.
WhereWhere low,fever
low, milk milkrisk
fever risk ishigh.
is very very high.
4. History,
4. History, a cowathat
cowhad
thata had
milk afever
milkinfever in the previous
the previous lactation
lactation is 10more
is 10 times timeslikely
moretolikely
havetoit have it
in the in the current lactation.
6 current
www.dairygoldagri.ie
lactation.
Calcium
Calcium supply
supply andand demand
demand
ISSUE 94 - DECEMBER 2020

the incidence of milk fever. Grass silage with greater     Dry Matter Intake At Calving Down:
than 1.5% potassium can cause such issues. Grazed
grass can contain 2-2.5 times the level of potassium
compared to grass silage leading to higher levels of
milk fever from cows calved off grazed grass.

The Importance of
Grass Silage Analysis:
You cannot feed for a desired outcome without
knowing the energy and protein content, the intake
potential or the mineral profile of your grass silage.
Within Dairygold we offer silage sampling and analysis
for straight quality or for quality and mineral profile.   Dairy cows intake naturally declines as “she”
Please contact our inside sales team on 022-31644 or       approaches calving. This decline comes as her pre-
your local area sales manager for more information.        calving energy demand is peaking. Silage only diets
                                                           will struggle to meet the cows’ energy requirement
Milk Fever Check List:                                     in the final 3 weeks pre-calving. Ask about Transition
1. B
   ODY CONDITION SCORE: CALVE COWS AT                     GOLD cubes for these 3 weeks (fed regardless of
   CONDITION SCORE 3.0                                     BCS).
2. FORAGE: GRASS SILAGE
Organise through your Dairygold area sales manager         Retained Cleansing
or our inside sales department to have your grass          Retained cleansings can be a secondary issue from
silage tested for potassium, magnesium and calcium         sub-clinical milk fever and are therefore controlled by
content and the interaction between these 3 critical       similar management to milk fever.
minerals.
                                                           When assessing your herds risk of retained cleansings
Potassium and Magnesium.                                   be wary of:
A high level of potassium of greater than 1.5% is a        Body condition score / Energy balance. Fat dry cows
concern. A low level of magnesium is also of concern.      dry matter intake can be 30% lower at calving down
A potassium to magnesium ratio of greater than 10:1        than cows in the correct condition score. Lower dry
increases the risk of milk fever. In these scenarios you   matter intake means lower energy intake and increased
should:                                                    negative energy balance at the point of calving down.

   a. D
       ilute the grass silage potassium levels with       Cows in a high degree of negative energy balance at
      straw, hay, maize silage, wholecrop. While doing     calving are at an increased risk (by 80%) of suffering
      this you need to ensure that the cows UFL and        from retained cleansings.
      PDI requirements are being met. If not colostrum
      yield and quality will be negatively affected.       Feeding 2-3 kg of transition gold in the last 10 days
   b. E
       nsure your dry cow is supplying enough             before calving will help fill the energy gap and ensure
      magnesium and vitamin D.                             your cows are calving down in a positive energy status.

Calcium                                                    Mineral and vitamin feeding to help
A dry cow has a requirement for 50grms of calcium.         eliminate retained cleansing
Silage calcium percentages of greater than 0.5% are        1. C
                                                               a status: It’s important to control cows calcium
over supplying calcium (grass silage only diets). Do not      status using the same mineral nutrition as plan as
feed additional calcium in minerals. Feed adequate            with milk fever.
Mg and vitamin D to overcome.

                                                                                                              7
2. S
    elenium: Pre-calving needs to supply between 3-5mg (dependent on
   silage Se status). The form of the mineral is also important. Organic forms of
   the minerals like Selplex are more bio-available to the cow and give better                                  Immunity
                                                                                                               Mineral & Vitamins
                                                                                                                Energy Balance

   results.                                                                             Challenge
                                                                                          Bacterial
                                                                                          Infection
                                                                                          Disease

3. Vitamin A: Pre-calving needs to supply approx 40000iu per day

Healthy Calves:
Limiting calf mortality and morbidity is influenced by getting 3 litres of good quality colostrum into new born
calves within the first 2 hours of birth. Pre-calving nutrition can influence the quality of colostrum.

For good quality colostrum ensure:
• Your cows energy and protein requirements are being met

• Y
   our pre-calver minerals contain between 3-5mg/day of selenium and that c.30% of this selenium is in the
  organic form.

• Y
   our pre-calver minerals contains greater than 800iu/day of vitamin E. In the US up to 2000 iu of vitamin E are
  feed per day.

• Your pre-calver minerals contain 50-60 mg of iodine. Calf thrive is influenced by iodine nutrition.

Choosing a dry cow mineral for your farm
WHEN TO FEED?
Start feeding dry cow minerals a minimum of six and preferably eight weeks prior to calving.

FEEDING OPTIONS?
Fixed rate feeding of well-balanced minerals is the cheapest and best way to guarantee an
adequate mineral supply. This can be done by:

1. P
    owdered minerals - divide the allowance into two parts and top-dress evenly over
   silage twice a day (allows all animals the opportunity to take in the correct allowance of
   minerals) or as part of a TMR.

2. Including the correct daily allowance in concentrates (where BCS is below target)

                                                                          Total Daily Cost (€/hd/day)

 Beef Feed + Pre-calver gold mineral                                                  c0.66

 Pre-calver gold cube                                                                 c0.69

3. Other options
  - Liquids, boluses etc. are useful where options one and two are impractical but inferior due to limited specification
     i.e. they can supply:
          • 0 Mg
          • 0 vitamins
          • 0 organic minerals etc.

  8         www.dairygoldagri.ie
ISSUE 94 - DECEMBER 2020

     - Free
          access supplementation (e.g. mineral buckets and licks) is not as reliable as fixed rate feeding as there is
       variation in intake between animals and should only be used where it is impractical to use fixed rate feeding.
       Again they are often low in Mg content.

The objectives of a Dry Cow Management Program are for the cow to calve:

1.    In an optimum calcium status,
      This is a function of the silage mineral status and the level of Magnesium and Vitamin D3 in the mineral.

2.    With reduced metabolic disorders,
      This is influenced by the minerals Magnesium, Iodine, Selenium and Vitamin E & A levels

3.    In an optimum immune status,
      This is influenced by the minerals, vitamins and trace elements (Selenium and Vitamins A & E)

4.    Producing high quality colostrum,
      This is influenced by the mineral and vitamin supplementation.

                                                       2020 PRE-CALVER GOLD
                                                          MINERAL OFFER

                                                                         BUY 10
                                                                           and
                                                                          GET 1
                                                                          FREE
                                           www.dairygoldagri.ie
               For more information contact your local Area Sales Manager, call Inside Sales 022 31644
                                       ororLombardstown
                                            LombardstownMillMillon
                                                                 on022
                                                                    02247275
                                                                        47275                                       9
10 www.dairygoldagri.ie
ISSUE 94 - DECEMBER 2020

     THE FINANCIAL BENEFITS
    OF SUSTAINABLE FARMING
                                                               By CIARA DONOVAN,
                                                  Farm Sustainability Advisor, Supply Chain Division

IFAC’s 2020 report showed that in 2019 the top 25% of dairy farmers earned on average €1,735/Ha compared
to the average who earned €948/Ha net profit. This in not a new trend. The National Farm Survey shows that
consistently over the past 10 years in dairy farming, the top 10% of dairy farmers produced almost 40% more
than the average but at a cost of 15% more than the average. These top farmers are certainly more financially
sustainable, and they are also likely to be more socially and environmentally sustainable as well!

Some Factors that Affect Farm Finances and Sustainability:

 Management type              Action taken                   Unit Value/gain                    In a 100-cow herd

 Milk Recording               Milk record and use            Produce 50kg Milk                  Worth €23,650
 		                           the data to reduce             Solids per cow per
 		                           SCC levels                     year more

 EBI                          €10 EBI gain in                €20 more earned                    Worth €2,000
 		                           herd average                   per cow per year

 Extended Grazing             10 days increase in            €27 per cow per                    Worth €2,700
 		                           Grazing                        year more

Milk Recording & Animal Health
Herds which milk record have been shown to produce 50kgs Milk Solids/Cow/year more than herd that don’t.
This also equates to a significant reduction in carbon footprint. Farmers using milk recording data are better able
to manage their herd and treat mastitis quickly and effectively. Animal Health Ireland (AHI) have shown that in a
100-cow herd, financial loss from SCC due to production loss, discarded milk, treatment cost, vet costs, culling
and penalties are on average €15,200 in a herd with SCC of 200 to 300,000; €18,500 in a herd with SCC of 300
to 400,000 SCC, in excess of €30,000 if SCC is ≥ 400,000. Given the potential financial loss or gain here, milk
recording should be made a priority on every farm!

EBI (Economic Breeding Index)
Latest work by Teagasc indicates that for each €10 gain in herd EBI there has been a gain of €20 in terms of
additional net profit per cow per year which also equates to a 2% reduction in the carbon emissions. While this
might not sound like a significant gain, remember it is possible for a herd to increase their herd EBI each year,
while many other factors are ‘once-off’ benefits.

Extended Grazing
A 10 day increase in grazing season can lead to 1.7% reductions in carbon footprint and a €27 increase in profit
per cow. Extended grazing can only be achieved if all facets of grassland management are excellent and if
the weather is favourable. Attempting to extend grazing by applying fertilizer/slurry when soil temperature or
conditions are not suitable could result in nutrient losses (especially to water). None the less, improved grassland
management, included extended grazing is financially beneficial and if carried out correctly, will not affect water
quality and will reduce your carbon footprint.

                                                                                                                     11
Management type Action taken Unit Value/gain In a 100-cow herd
Soil Fertility Go from low to Grow 2 ton extra of Worth €4,895
optimum soil Grass/Ha
fertility
Clover Usage Incorporate clover Increased milk yield Worth €12,413
and reduce N by & solids - increase
100kg N/Ha Net Profit by
€305/Ha
Soil fertility
While there has been signs of improvement in recent years, in 2018 only 10% of Irish soils were shown to be
at optimum soil fertility. Teagasc carried out studies and found that to bring a farm with low soil fertility up to
optimum (correct P, K & lime) would cost approx. €120/ha but should result in increasing growth by 2 ton per
Ha, valued at €361/Ha making a profit of €241/Ha. Lime alone can release €50 euros worth of N providing a
return on investment of 1 to 7. Achieving optimum soil fertility by using a targeted approach to fertilizer and slurry
applications should result in less losses to water and reduced long-term fertilizer usage.
Clover
White clover established in a pasture can deliver a 10% reduction in carbon footprint (3% due to increased milk
yield; 7% due to reduction in chemical N fertilisation) that’s assuming 100kgs N/Ha reduction. In Moorepark, trials
showed that a grass only sward receiving 250 kg N/Ha grew the same amount of herbage as a clover/grass
sward receiving 150kg N/Ha and both milk yield and milk solids were higher. Over 4 years of trials there was an
increased net profit per Ha of €305 in clover grass swards compared to grass only swards. This is a massive
financial benefit and given that clover is now compulsory for all reseeding done by derogation farmers, clover is
worth getting right!
Some Honourable Mentions:
• By converting from CAN to protected Urea, you will save 10% on your fertilizer bill with no difference in grass
production and up to 71% reduction in emissions of the greenhouse gas nitrous oxide (N2O)
• By spreading slurry (3000 gal/ac) in the spring (when conditions are suitable), using trailing show or dribble
bar, you are saving an equivalent of €21 per Ha in N compared to applying with splash plate in the summer.
(By using Low Emissions Slurry Spreading technology (LESS) you save €840 per 100 ac farm)
• By feeding Dairygold Hi-Pro Eco Lac Range with Agolin Ruminant added, you can reduce methane emissions
by 10% per cow per day and increase cow production and fertility performance
• By installing a plate cooler and precooling milk to within 5°C of incoming water, you can reduce milk cooling
costs by up to 40%
• H eat recovery systems in bulk tanks can meet 40 to 50% of water heating energy requirements
• V ariable speed controls can reduce milking machine running costs by up to 60%
• Finally, if you leave a water heater leak which drips once per minute, after a year that slow drip will have cost
you approx. €300. It is important to fix leaks and save energy and water!
WITH COMPLIMENTS
Reply to: West End, Mallow, Co. Cork, P51 R593, Ireland. T +353 (0)22 21592 info@dairygold.ie www.dairygold.ie
12 www.dairygoldagri.ieISSUE 94 - DECEMBER 2020
DAIRYGOLD AGRI BUSINESS YOUR
PARTNER IN SUSTAINABLE FARMING
By LIAM STACK,
M.Agr.Sc, Ruminant Technical Manager
Within Dairygold, we have always offered the best due to ammonia release during hot drying weather
quality, latest innovation and best value within our conditions. Moving from CAN to an unprotected urea
product range. We also believe it is our responsibility fertiliser decreases the risk of nitrous oxide losses but
to be your partner in sustainable farming. increase the risk of ammonia losses. Protecting the
urea fertiliser decrease this risk of ammonia losses.
1. Sustainable Soil and Fertiliser Planning Service:
Within Dairygold we are dedicated to working with you Within Dairygold, we have shown leadership in driving
to improve your soil’s fertility and your farm’s nutrient sales of protected urea and in partnership with you
use efficiency. We have a team of soil samplers available our customers we are now one of the biggest users of
to sample your farm, our analytical service laboratory protected urea nationally.
in Lombardstown, Co. Cork, is INAB accredited and we
have a team of Area Sales Managers that are trained Protected Urea Fertilisers:
in the nutrient requirements of your crops and that are a. Decrease the ammonia losses versus urea, by 84%
compared to urea
available to develop a bespoke fertiliser pan for your
b. Decrease the nitrous oxide emissions versus CAN,
farm.
by 73% when compared to CAN
3. C lover use within our Gold Assure Grass Seed
Mixtures:
All our premium Gold Assure Grass Seed Mixtures
contain premium grass seed varieties that are the top
performers on the PPI list. These varieties maximise
spring growth and quality, allowing your cows to be
at grass for as long as possible through the year. All
our premium Gold Assure Grass Seed Mixtures are
available with clover. Clover is featuring in c.50% of
the grass seeds we sold in 2020, up from c.40% in
2. Protected Urea Fertilisers: 2018.
Until 2015, the nitrogen market in Ireland was dominated Benefits of clover:
by Urea and CAN. Both these forms of Nitrogen - Improved Nitrogen Use Efficiency and Grass growth
have considerable limitations in our changeable Grow the same amount of grass from the less fertiliser
and somewhat inclement weather conditions. Past - Animal performance
experience shows us that one of the problems with Grass clover swards produced 33kg extra milk solids
using untreated Urea is the risk of nitrogen loss per cow per year.
134. Slurry Additives: We use additives within our feed range that are
carbon trust accredited to lower greenhouse gases:
- The Yea-Sacc® from Alltech used within post calver
gold has been certified by the Carbon Trust as
Dairygold Agri Business have recently introduced
capable of reducing greenhouse gas emissions per
DIGEST-IT, a biological slurry additive designed to
kg fat/protein corrected milk. Yea-Sacc is the only
increase nutrient recovery from slurry while also
yeast culture designed for use in ruminant diets
reducing ammonia emissions.
that has been awarded this certificate
Benefits of Digest-it® in the field:
- The Agolin, used within our Hi Pro Ecolac range is
- D
igest-IT treated slurry grows more, better quality
a natural rumen modifier that the Carbon Trust has
grass
has concluded can reduce methane emissions in
- D
igest-IT treated slurry reduces odour when
dairy and beef cattle and sheep.
spreading
- D
igest-IT treated slurry improves soil health by Meta-analysis of Agolin Trials :
supplying “good” microbes to the soil
- D
igest-IT treated slurry is kinder to the soil organisms
living in your soil, including worms
- D
igest-IT treated slurry has a lower Biochemical
Oxygen Demand (BOD) than untreated slurry
5. Sustainable Concentrates Formulations
Our feed range is formulated with only the best
quality raw materials maximising:
- t he energy content and protein quality of our feeds.
- m ilk production and fertility performance of your
herd
High levels of production couple with good fertility
performance increases your nitrogen use efficiency
and lowers the carbon footprint of your milk.
We use high levels of native cereals and beans within
our range minimising the “air miles” of the feeds we
produce. Our Gold Farm Beef range is made from all
Irish raw materials.
Hi Pro EcoLac Autumn Extend
A high UFL nut maximising milk yield response
from every kg of concentrates fed
Including high levels of cereal, maximising rumen
friendly starch levels. With autumn grass low in
sugars, a high level of starch is ideal for driving
milk yield and protein
Trace minerals and vitamins included at high
levels with CalMag, ensuring your cows are dried
off in a n adequate mineral status while lowering
the risk of grass tetany
Agolin, a natural rumen modifier, is included
delivering c.5% increase on the typical yield
response while reduce methane emissions
Milk Solids
Conception
Rate
Lamenesss Milk Yield
Body
Methane Condition
Emission Score
www.dairygoldagri.ie
14 www.dairygoldagri.ie For more information contact your local Area Sales Manager,
or call Inside Sales 022 31644ISSUE 94 - DECEMBER 2020
DAIRYGOLD MILK
REPLACER RANGE
By ROISIN O'DONNELL,
Calf Milk Replacer Specialist, Mob: 086 7938408
Dairygold agribusiness has a complete range of whey and skim based milk replacers available for the coming
season. The Dairygold Prime Elite range are whey based containing the highly concentrated bio-active milk
complex Imunopro®. We are also offering a range of specialised skim based products that provide the right blend
of fats to energise calf growth.
Whey Skim
Prime Elite 25+ Prime Elite 23 Transformula Compumate Shine once-a-day
Protein % 25 23 23 21 20
Oil % 18 18 22 18 17
Prime elite Range: designed to fit specific feeding scenarios on farm.
The Prime elite range
contains Imunopro®. Transformula - is designed for use after colostrum
Imunopro® is made of a feeding. Made with over 60% skim milk and
highly concentrated whey buttermilk along with 5 plant oils and whey protein it
protein and is carefully is easily digested by the baby calf. Dried under low
balanced to ensure the temperatures it ensures the calf is not exposed to high
optimum level of amino bacterial counts found in stored raw cow’s milk. These
acids, fatty acids and milk reducebad bacteria
the number of daysremove the
it takes calves effect
to recover ofscour.
from antibody in milk
These combined give and
the calf
sugars for growth, health and development of the the best chance for growth and high performance.
can also have pathogenic effects. In addition, it also
calf. contains
Specialised ultra-high
skim based products: levels of plants extracts, probiotics,
Our range of specialised skim based products are designed to fit specific feeding scenarios on
The right gut bacteria are vital for young calves. It acts farm.prebiotic and egg protein. These improve gut health
as a barrier against invading pathogens and infections in the calf which is important to maintain good growth
while also aiding digestion of nutrients. and thrive.
Transformula is designed for use after colostrum feeding. Made with over 60% skim milk and
buttermilk along with 5 plant oils and whey protein it is easily digested by the baby calf. Dried
under low temperatures it ensures the calf is not exposed to high bacterial counts found in
There are two gut aids within the Prime Elite Range: storedCompumate
raw cow’s milk. These- isbad
designed specifically
bacteria remove for computerised
the effect of antibody in milk and can also
Gardion - which is derived from garlic, can enhance have calf feeding systems. To reduce the stress
pathogenic effects. In addition, it also contains ultra-high levels ofon calves
plants extracts,
probiotics, prebiotic and egg protein. These improve gut health in the calf which is important
the immune system as garlic is linked to having being
to maintain goodingrowth
large groups of differing ages, Compumate
and thrive.
antibacterial, antiviral and antifungal properties. This contains anti-bacterial agents and immunostimulants
all helps to improve gut health in the calf which is to minimise
Compumate health problems.
is designed specifically for computerised Itcalfisfeeding
made with
systems. wheythe
To reduce
important to maintain good growth and thrive. stress on calves being in large groups of differing ages, Compumate contains anti-bacterial
protein and skim and butter milk as well as 5 plant oils
agents and immunostimulants to minimise health problems. It is made with whey protein and
skim and natural
and butter sweeteners
milk as well to natural
as 5 plant oils and maximise
sweeteners digestibility and
to maximise digestibility
Digesterom - which is a plant-based feed additive, and calf performance.
contains a unique blend of herbs, essential oils calf performance.
Shine Once-a-day
and functional flavours which help to increase the
palatability of the milk replacer, increasing intakes. Shine Once-a-day - is a 20%
Digesterom has been shown to reduce the incidence milk protein powder made of a
of scour in calves and reduce the number of days it wide range of highly digestible
takes calves to recover from scour. These combined ingredients including butter and
give the calf the best chance for growth and high skim milk powder. It can be fed
performance. with water or milk to reduce your
workload but not compromise the
Specialised skim based products: calf.
Our range of specialised skim based products are
Shine once-a-day is a 20% milk protein powder made of a wide range of highly digestible
ingredients including butter and skim milk powder. It can be fed with water or milk to reduce
your workload but not compromise the calf.
15DAIRYGOLD GO-TO FARM INITIATIVE
FARMER PROFILE: Anthony Carroll, Burncourt, Cahir, Co. Tipperary
Anthony, Mags and family milk 93 cows at the Carroll farm, Raheenroe, Burncourt near Cahir in Tipperary.
The Carrolls’ have all completed the Dairygold Leanfarm training and joined the Leanfarm Go To Programme
in 2018 hosting waste walks and implementing changes to save time, effort and money. Anthony says
“Make time to save time.”
Leanfarm measures on the Carroll Farm
• Feeding the stock indoors takes time so Anthony has streamlined the process. The diet feeder (photo
1) saves time as he can load silage bales or pit at point of use and add meal from the split bin auger
indoors. The concrete barriers reduce waste and save time pushing in silage (photo 2).
• T
he milking process has been improved by creating a new exit out of the collecting yard. The cows no
longer need to wait until after milking to go to grass which has reduced time spent cleaning after milking
and improved cow performance. The idea was born at a waste walk and Anthony wishes to thank his
fellow Dairygold suppliers for their help when they were on Leanfarm training. The roller door keeps the
birds out of the parlour and protects again frost in winter (photo 3).
• A
dosing programme is now in place which includes vaccines and routine fluke, worms and lice treatment.
This has reduced vet calls and improved performance.
1 2 3
Leased Land
The Carroll’s leased extra land which required a plan of action to upgrade the additional grazing and
silage ground. Anthony formulated a plan of the time required to be set aside and the materials needed.
The improvements included better access, reseeding, fencing and water. Great care was taken to protect
the natural biodiversity of the land.
Time Saver Tools
• Toolbox spares time looking for tools and can be carried in the jeep to breakdowns (photo 4).
• C
ompressor reel safe location for the cable of compressor and can easily reach any wheels to be
pumped (photo 5).
16 www.dairygoldagri.ieISSUE 94 - DECEMBER 2020
• G
enerator wheels were fitted for ease of movement and safe storage. Anthony says “cows are our
income generators so we are lost without power” (photo 6).
• M
obile cattle crush was custom made and can be easily moved to the outfarm and any land rented. Safety
was a major priority and the cage at the front of the crush means that stock can be easily restrained.
• C
alf trainer speeds up training young calves to suckle milk and has reduced labour and improved
performance (photo 7).
• F
ront Loader Multidock connection which means the loader on the tractor can be unattached safely in
two minutes (photo 8).
4 5 6
8
7
The Carroll’s view on the BENEFITS of Leanfarm
“The Carroll’s love their farming and Anthony says Lean to him is using the lean tools to
fix what bugs him. He plans to fit a line to hang the temporary posts and map the farm
water pipes which were both ideas he took from a recent Milk Matters issue. The Carroll
family drive continuous improvement and efficiencies that utilise less time, effort and
resources to achieve better work life balance and returns.”
Benefits Delivered on the Carroll Farm
✔ Time saved.
✔ Point of use.
✔ Reduced transport of goods.
17TAKING THE GUESS WORK
OUT OF SLURRY
By WILLIAM BURCHILL,
PhD., Teagasc/Dairygold Joint Programme
Slurry on many farms is the primary source of P and K for silage production but to a certain extent we are only
taking an educated guess regarding what’s actually in our slurry and if we are getting the right application of P
and K for our 1st, 2nd and even 3rd cut silage.
Take the example in Table 1. Slurry 1 has a nutrient content that is delivering all the required P and K for 1st cut
silage at 3,000 gallons/acre. The P and K in Slurry 2 is relatively low and is undersupplying the 1st cut silage
particularly for K at 3,000 gallons/acre. Slurry 3 has a high P and K content so an application of 2,500 gallons/acre
instead of 3,000 gallons/acre will provide a better match to the nutrients required for 1st cut silage.
Table 1: Examples of N, P & K (units/acre) delivered from slurry depending on slurry nutrient content and application rate.
Slurry Application N* P K
(N:P:K units/1,000 gal) rate (Units/acre) (Units/acre) (Units/acre)
N:P:K Slurry 1 (7:6:34) 3,000 gal/acre 21 18 102
N:P:K Slurry 2 (5:3:22) 3,000 gal/acre 15 9 66
N:P:K Slurry 3 (7:7:38) 3,000 gal/acre 21 21 114
N:P:K Slurry 3 (7:7:38) 2,500 gal/acre 17.5 17.5 95
1st cut silage requirement 100 16 100
*N units/acre are based on using a trailing shoe or dribble bar.
Testing your slurry for its N, P and K content is relatively easy and cheap (€50-70 per sample). It will provide you
with valuable information so you know what N, P and K you are applying in your slurry. Another great thing about
the results is that they can be representative of your slurry nutrient content for a number of years. The nutrient
value of slurry won’t change much over time particularly if winter diets and the amount of rain/dairy washings
entering slurry tanks remain relatively constant year to year.
Steps to taking a slurry sample
• Your own health and safety is the first most important aspect. Be aware of safety guidelines around PTO guards
and slurry gases.
• January/February i.e. the first time slurry is being spreading after the winter is the best time to test slurry
• The slurry must be well agitated so that all crust and water are completely mixed before taking the sample
• Suck up a load of slurry from the slurry pit using the slurry tanker
• Get the slurry sample from the fill point of the slurry tanker
• Place 0.5 litres of slurry into a sealed screw-capped container
• Keep the sample cool and post to a lab within a couple of days of taking
Many of the labs which test soil samples also test slurry.
Ask for the standard test which generally includes; dry matter, total nitrogen,
Ammonium-Nitrogen, total P and total K.
Your local Teagasc advisor or Dairygold Area Sales Manager can help
you to review the slurry test results and make decisions regarding slurry
applications.
18 www.dairygoldagri.ieISSUE 94 - DECEMBER 2020
DAIRYGOLD / TEAGASC
JOINT PROGRAMME 2018-2020
By GRAINNE HURLEY,
Dairygold Teagasc Joint Programme
Dairygold Monitor Farmers Breeding Summary 2020
heifers. After the 11 week breeding season there was
10.5% of the cows not in calf and this ranged from 3.5
– 18%. The target should be less than 10% empty over
a 12 week breeding season. The 6 week in calf rate
was high at 75% but with wide variation again ranging
between 55 - 88%. Along with the genetic potential of
cows, there are an array of factors that contribute to
cow infertility such as heat detection, animal nutrition,
and disease burden and it was factors such as these
that affected the breeding performance of some of
the monitor farmer herds. At times it can be difficult
to control a new disease burden or nutrition at grass
if weather is challenging – however, by continuously
As we near the end of another year we reflect on selecting for higher EBI bulls we know we will produce
some of the key performance indicators of our dairy more robust and more profitable cows.
business. One of the most important drivers of
profitability and sustainability on our dairy farms is On average the EBI of the replacement heifers of the
the continuous improvement of genetic gain in our monitor farmers is €25 higher than the main herd
herds. The EBI is a measure of the genetic potential which means that each of these heifers will make €50
of an animal. Teagasc research has shown us that more profit per lactation than their herd counterparts.
for every €1 increase in EBI will result in a €2 gain in The average empty rate in the heifers was 4% and the
net profit/ cow. Teagasc have also recently published six week in calf rate was high at 85% with again large
technical papers on the Teagasc Marginal Abatement variation across the farms. With the cost of rearing a
Cost Curve (MACC) on both GHG and ammonia replacement heifer calculated by Teagasc at €1486 it
emissions which clearly show that if we can produce is crucial to get as many of these animals calved down
food with fewer inputs, then this reduces emissions between 22-24 months old to make a return on their
to the atmosphere and costs to the farmer. Every €10 investment.
increase in EBI reduces the carbon footprint by 2%.
Increasing EBI is one adoption method by breeding So now is a good time as any to sit down and reflect
more efficient and robust animals. Higher EBI cows on your own figures. Did you hit your breeding targets
last longer in our herds, have shorter calving intervals during the year? Was there a disease burden on your
leading to lower replacement rates and lower body herd that you can discuss with your vet? Did you have
weight whilst increasing milk solid production per kg enough bull power or was the bull compromised – see
liveweight. how many held to a stock bull if you had one. Look
how your herd is performing in terms of fertility and
The Table below summaries the breeding performance milk solid output and have a chat with your breeding
of the Dairygold monitor farmers herds for 2020. The advisor or Teagasc advisor about what you need to
average breeding season length for the cows and focus on next year to improve the fertility in your herd
heifers was 11 weeks of which 9 weeks were AI bred and hence increase your profitability and sustainability
with the cows and 4 weeks of AI in the replacement of your farm.
19Table 1. Breeding summary of the Dairygold Monitor Farmers 2020
COW DATA HEIFER DATA
EBI Fertility Weeks Empty 6 week EBI Fertility Weeks Empty 6 week
€ € Breeding rate in calf € € Breeding rate in calf
(of which AI) % rate % (of which AI) % rate %
DLR Deane 159 56 13 (4.5) 14 68 173 62 13 (3) 5 90
John Galvin 160 53 12 (9) 8 88 183 59 12 (2)* 0 91
Jimmy Cotter 172 60 10.5 (10.5) 12 76 201 74 9 (3)* 3 100
John Walsh 154 74 10.5 (10.5) 6 84 185 82 10 (3) * 19 46
Sean Barry 140 56 10 (10) 14 83 197 66 10 (10) * 0 94
Mark Lonergan 160 66 12 (9) 12 70 172 71 12 (3) * 5 73
Sean Moher 158 67 10 (10) 18 71 187 78 10 (3) 0 82
Pat Mulcahy 127 47 12 (8) 7 55 130 48 9 (0) 1 90
Tom O Connell 158 62 14 (9) 3.5 78 183 66 11 (2) * 3 95
Average 154 60 11 (9) 10.5 75 179 67 11 (4) 4 85
*synchronized heifers
6 week in calf rate = % of cows/heifers confirmed in calf as a proportion of all cows/heifers intended for
breeding at Mating Start Date
MINDING YOUR HEAD
ON THE FARM
.............................................
This Virtual Classroom Training Course
looks at the mental health risks facing
farmers as lone workers and includes the
following topics:
Dealing with Stress Looking after your Mind
Loneliness & Isolation issues for Lone Workers
Signs of deteriorating mental health
Learning to control the things you can control
How to Reach Out for Help
Staying Socially Connected Accessing Supports
Added Pressure of COVID-19
.............................................
Dates: 26th November,
3rd and 8th of December
2020 for 2.5 hours
Email info@icosskillnet.ie to book a place
Contact Billy Goodburn, Head of learning – 087-126-5542
Breeda Flood, ICOS Operations Manager – 087-827-7814
This programme is offered FREE of charge to Farmer
Members of Co-operatives and is funded 100% by skillnet
in support of industry
20 www.dairygoldagri.ieJohn Maher ISSUE 94 - DECEMBER 2020
Teagasc, Moorepark
GRASS MATTERS Review of grass production on your farm:
Outlined below are 5 steps that will enable you the farmer to review grass production on
The first 3 steps are required if you want to review grazing management which has a huge
on the level of grass production. Steps 4 and 5 will increase grass production if tackled pro
Grass Matters
By JOHN MAHER, will require financial
Grass10, investment.
Teagasc,Steps 1 to 3 only require your enthusiasm!!
Moorepark
John Maher, Teagasc, Moorepark
A the
o Start REASONABLE GRAZING YEAR BUT WHAT CAN WE LEARN?
Grazing Season!!!!
Step 1: Grass production
Walking the farm 30 times or more during the year and measuring grass production in the
Data from PastureBase Ireland shows that grass grass cover in the paddock. The farm needs be walked
will enable you gain a very good picture of the level of grass produced on the farm by ent
production looks like being similar to other years in once in February, twice in March, twice in September,
data onto PastureBase Ireland www.pbi.ie. Primarily this involves walking the farm almos
image “2018
terms of grass grazing season starts
DM production
A REASONABLE GRAZING YEAR BUT WHAT CAN WE LEARN?
with some now” difficulties weektwice in October,
between twice31inst and
April 1st and August November
measuring theand onof Dec
level 1st to
grass cover in the padd
along the way. A wet February, a short drought in June gain the full picture.
farm needs be walked once in February, twice in march, twice in September, twice in Oct
and
Data from some
PastureBase heavy
Ireland rain
shows that grassin the back
production looks likeend were
being similar some
to other of
years in in November and on Dec 1st to gain the full picture.
ry terms
farmer
of grasswill
these. undertake
As a
DM production
result over
with some
grass the next the2way.
production
difficulties along months is is
about to
A wet February, aensure
5% lowerthat
short drought
Outlined below is the grass production for an example
in June and some heavy rain in the back end were some of these. As a result grass production is Outlined below is the grass production for an example farm in the Dairygold co-op region
have
about 4%than
an average.
adequate
lower than supply of grass early next spring.
average. farm in the Dairygold co-op region.
allenging during September. Reports I get back on grass supply on
rms are swamped in grass which makes grazing out very difficult.
t have enough grass available for October and will require
. Irrespective of grass supply on the farm, we must focus on the
ht.
tumn grazing management of dairy cows.
uately fed using the cheapest available feed which is grazed
rth €1.80/cow/day additional profit.
e farm up for spring grass. Many farmers do not realise that
he autumn and that autumn management of grazed grass is
the supply of grasslevel
The average available in spring
of grass on any
production farm.
on PastureBase
Ireland dairy farms will be about 13 tons DM/ha,
The average level of grass production on PastureBase Ireland dairy farms will be about 13 tons DM/ha, An assessment of grass production on each
achieved with just under 7 grazings /paddock for the year and the average level of grass grazed was An assessment of grass production on each paddock needs to be carried out. Some paddo
achieved with just under 7 grazings /paddock for the
1550 kg DM/ha.
paddock needs to be carried out. Some paddocks
perform better than others. Primarily though the underperforming paddocks need to be e
year and the average level of grass grazed was 1550 will perform better than others. Primarily though the
and questions asked as to why they are at the lower end of grass production scale. Quest
kg DM/ha. underperforming paddocks need to be examined and
paddock wetness, their soil fertility status, level of ryegrass, were they grazed by heifers/
questions
Sometimes asked
problems as to
with grass why they
production are atthat
are identified the lower
need end
to be addressed.
Review of grass production on your farm: of grass production scale. Questions such as paddock
Outlined below are 5 steps that will enable you the wetness, the soil fertility status, level of ryegrass,
farmer to review grass production on the farm. The were they grazed by heifers/calves etc.? Sometimes
first 3 steps are required if you want to review grazing problems with grass production are identified that
management which has a huge influence on the level need to be addressed.
of grass production. Steps 4 and 5 will increase grass
production if tackled properly but will require financial Step 2: No. of grazings
investment. Steps 1 to 3 only require your enthusiasm!! The aim of the Grass10 campaign is to achieve close
(see webinar advert on page 22). to 10 grazings/paddock/ year. The average number
of grazings being achieved/paddock on dairy farms
Step 1: Grass production nationally is about 6. PastureBase Ireland average is
Walking the farm 30 times or more during the year 7. Maximising the number of grazing’s achieved on
and measuring grass production in the paddock will each paddock is a very effective method of increasing
enable you to gain a very good picture of the level grass production and utilisation. Every extra grazing/
of grass produced on the farm by entering the data paddock achieved increases annual grass DM
onto PastureBase Ireland www.pbi.ie. Primarily this production by 1.4 t DM/ha. PastureBase Ireland
involves walking the farm almost every week between enables the farmer to keep track of grass growth
April 1st and August 31st and measuring the level of per paddock, the number of grazing’s per paddock
21and the quantity of grass being consumed at each in fertiliser input (particularly Nitrogen) on dairy farms
grazing. This highlights poor performing paddocks over the next few years. For the record, it takes about
and deficiencies in grazing management. 250 kg N/ha (200 units of N/acre) from a combination
of fertiliser and slurry sources to grow 14 tons DM/ha.
Step 3: The average pre-grazing yield. The PastureBase Ireland average in grass production
This needs to be 1500 kg DM/ha. This figure is got is 13 tons DM/ha and with a lot more N fertiliser input.
by dividing the grazing tonnage by the number of However N fertiliser input can be reduced if:
grazings.in 2020 the average level of grass grown
was 13 tons with 11 tons produced for grazing and 2 1. L
ime Application is increased (we are only applying
tons produced for silage on average. Therefore the 50% of what is required). About 25% of Fertiliser N
11 tons divided by about 7 grazings is about 1500 to is lost to the atmosphere if the soil pH is too low.
1600 kg DM/ha. The average pre-grazing yield has 2. F ertiliser P and K application increases
being decreasing overtime. This means that farmers 3. Sulphur application is carried out and starts in April
are getting better at having cows enter right cover (March on drier soil types)
of grass. This means cows will perform better as the 4. More grass measurement takes place
grass is higher quality and it is easier for the cows to 5. Better use of slurry and soiled water is made. Slurry
graze out the paddock properly. & soil water are a source of N and this should be
counted and utilsed. LESS technology is part of
Step 4: Soil Fertility: that solution. (Dribble bar / trailing shoe).
Having the soil with adequate P, K and lime is a huge 6. Recording fertiliser & slurry application on
driver of grass growth on dairy farms. Soil sampling is PastureBase Ireland to find out what N fertiliser is
the only reliable way of establishing where soil fertility being used
is at. The reality is that soil sampling should be carried 7. Avoiding spreading fertiliser on soiled areas of the
out for agricultural purposes (i.e. to grow more grass). paddocks during the 2nd half of the grazing season
Completing soil sampling every 2 years will inform 8. Using GPS to spread fertiliser.
you about the level of soil fertility improvement and 9. Having the fertiliser spreader set at the right height
increase (in most cases) the level of P fertiliser allowed above the ground (75cm above ground level to the
on farm. National figures suggest that only about 20% base of the plate/spout for most models).Replacing
of the soils on dairy farms have adequate P, K and lime worn veins/spouts on the fertiliser spreader.
status. 10. Making use of clover. (This will be a greater focus
Step 5: Reseeding by Teagasc in 2021).
If steps 1-4 above are tackled, increasing grass A 10% reduction in Nitrogen fertiliser input is possible
production through reseeding is the final step. It is on most farms. A simple solution is reducing fertiliser N
costly (€700/ha) but even still the return on investment application by about 4 units/acre per grazing rotation
is high and the return is very fast. from mid-April to mid-August!
What’s coming down the line? Finally, I would like to wish all the Grass Matters
Signals from the EU, Government and the Department readers a happy and safe Christmas and a better
of Agriculture, Food and the Marine indicate a reduction grass growing year for 2021.
22 www.dairygoldagri.ieDairy Farming on Diff
ISSUE 94 - DECEMBER 2020
DAIRY FARMING ON
DIFFICULT / HEAVY LAND
BY JOHN MAHER, GER COURTNEY & TOMAS CONDON
Heavy Soils Programme, Teagasc.
The year 2020 was a bit of a roller coaster in terms of weather pattern and grass production. Broadly, it was a
good year for those who farm on heavy land as the grazing conditions were much more favourable across most
John
of the year. The grass production figures in Table 1 confirm that. While February came very wet, Maher,
this was ofGer
little Cour
significance for those on heavy land as it is more important that the main grass and milk production months
are drier. This was the case with very favourable weather during the spring and summer period mostly. There
Heavy Soils Programm
was some weather challenges at the backend of the year but the grass production figures show that the farms
in the heavy soils programme produced similar levels so grass as those on PastureBase Ireland www.pbi.ie
(countrywide figures). The average level of grass production on PastureBase Ireland dairy farms will be about 13
tons DM/ha, achieved with just under 7 grazings /paddock for the year and the average level of grass grazed was
About 30%
1550 kg DM/ha. These figures are almost identical to the average of the heavy soils programme of outlined
farms milk produced
in Table 1. Heavy soils add complexitie
Table 1.
Table 1. Grass
Grass production
productionfor
forHeavy
HeavySoils
SoilsProgramme farms
Programme in Munster
farms from
in Munster Pasturbase
from Ireland
Pasturbase 2020 2020
Ireland up to Nov
up to conditions,
1st.Nov 1st. similar to those
milk production on heavy s
FARMER
NO. OF
GRAZINGS
NO. OF SILAGE
CUTS
PreGrazing
Covers
GRAZING (kg
DM/ha)
SILAGE (kg
DM/ha)
TOTAL (kg
DM/ha)
The level of Nitrogen fertiliser
silage
and Nitrogen fromreserves are essential
slurry spread
Athea 6.9 0.9 1467 10122 2000 12122
Macroom 8.4 0.5 1427 11987 1196 13183 to achieve demonstration
this was 253 kgdairy
N/ hafarms l
Doonbeg 6.5 1 1490 9685 1784 11469
Listowel 4.3 1.3 1768 7604 6157 13761
(about 200Doonbeg.
units N/acre). There
Rossmore 7.8 0.8 1500 11702 1404 were about 45 units of P applied/
13106
Castleisland
Kiskeam 6.9
8.7
0.9
0.5 1450
1329 9172
12614
1907
1194
11079
acre and 100 units of K applied/
13808
Average 7.1 0.8 1490 10412 2235 12647 acre in total from fertiliser and
slurry sources.
Farm About 15 units of P
Performance
The level of Nitrogen fertiliser and Nitrogen from slurry spread to achieve was 253 kg N/ ha (about 200 units N/acre).
and
There30
wereunits
aboutof45Kunits
are ofrequired to grow
P applied/acre this
and 100 level
units of Kof grass butin soil
applied/acre total fertility needs
from fertiliser andto improved
slurry sources. so that is why there is
more P units
About 15 & K applied
of P and 30than
units required for grass
of K are required to growproduction.
this level of grass but soil fertility needs to improved so thatA marked increase in costs
is why there is more P & K applied than required for grass production.
poor milk price is reflected
Grass production in 2020 was similar to 2019 and higher in the last 2 years compared
Year production
Grass Tonnes Grass
in 2020 was Dry
similarwith previous
to 2019 and higheryears. The2 years
in the last farmscompared
in the heavy soilsyears.
with previous programme
The farmshave being measuring
in the heavy soilsMatter/Ha
programme have being measuring grass production for the last 10 years. As can be observed from
Table 2. below, this was the first timegrass
that theproduction
12 ton of grassfor the barrier
DM/ha last 10hasyears. As can
being broken be observed
consistently. from Table 2. below, this
Obviously
2011
the weather is a 10.6
greater barrier to was the
increasing first
grass time that
production the
compared12 ton
to of grass
other farms DM/ha
given thebarrier
nature has
of the being
soils broken consistently.
but soil fertility improvement has also been a constant focus but difficult to achieve in the short term.
Obviously the weather is a greater barrier to increasing grass production Soil sampling Table 1: Heavy Soils Program
compared
2012 7.8
to other farms given the nature of the soils but soil fertility improvement has also
2013 10.3 been a constant focus but difficult to achieve in the short term. Soil sampling took
k for space: Include
2014 this table with
11.0 only theplace
“addressonand all the
totalfarms
inches”incolumn
late 2019 and improvement in the Shane fertility status
if stuck forof the Include
space: farms this ta
was noticed. Our aim in this programme though is to keep trying to improve grass Herd
2015 11.3 production and the level of grass eaten. Table 3. size
2016 11.3 Monthly
F
The average level of rainfall for 2020 is outlined in the
2017 11.9 Rainfall
Table 3 below. ThisMay is recorded by an on farm weather total total
2018
Nov 19 Dec 19 Jan 20 Feb 20 station.
11.7 Mar 20 While
Apr 20farming20 on Jun
heavy
20 land
Jul 20is challenging
Aug 20 Sep in 20 Oct 20 mm Nov
inches
19 Dec 19
189.4 207.0 118.8 248.6 itself,
122.4often 59.6
these farms
41.0 are located
98.6 in high rainfall
144.4 158.6 areas.
69.4 Kiskeam 1802.8
205.2 71.0
189.4 207.0
2019 12.5
191.8 153.4 120.0 226.0 A huge
96.4 variation
57.2 in 62.0
the level of rainfall
127.8 103.8exists across60.6
186.4 the Macroom1713.6
161.6 67.5
191.8 153.4
2020 est.
161.8 142.4 13.0
104.8 274.6 farms.
113.8There is also31.0
58.0 sizeable variation
109.8 in monthly
166.2 158.6 rainfall
67.0 Athea 1669.0
163.8 65.7
161.8 142.4
to
154.8 164.8 114.2 238.5 with February
93.2 41.4quite23.1
high and April 125.0
96.0 & May quite
204.0 low.90.0
On Castleisland
185.2 1670.0 65.7
154.8 164.8
Dec.
122.2 31st.
109.2 102.0 227.4 average,
75.8 rainfall
42.8 for18.6the last 12 months
67.0 121.4 is 134.4
higher than
64.4 Listowel 1337.0
148.0 52.6
122.2 109.2
Table 2. Grass Production (Tons
120.8 111.2 114.8 212.8 normal
80.0 by almost
32.2 15%.
23.0 70.2 186.8 137.4 64.4 Doonbeg1431.4
169.0 56.4
120.8 111.2
DM/ha) on the Heavy Soils
138.8 133.4
Programme farms 64.0 219.8
over 2011 to 119.4 54.4 10.8 98.2 133.4 124.2 54.2 Rossmore
113.8 1389.4 54.7
138.8 133.4
2020. Table 3. Rainfall
m) 143.9 128.8 94.4 235.2 96.3 43.4 29.0 101.9 131.1 149.8 62.5 161.1
Average (mm)
1500.7 143.9 128.8
Average 23
5.7 5.1 3.7 9.3 3.8 1.7 1.1 4.0 5.2 5.9 2.5 6.3
(inches) 59.1 5.7 5.1You can also read