Feeding efficiency gains can increase the greenhouse gas mitigation potential of the Tanzanian dairy sector - Nature
←
→
Page content transcription
If your browser does not render page correctly, please read the page content below
www.nature.com/scientificreports
OPEN Feeding efficiency gains can
increase the greenhouse
gas mitigation potential
of the Tanzanian dairy sector
James Hawkins1*, Gabriel Yesuf1, Mink Zijlstra2, George C. Schoneveld3 & Mariana C. Rufino1
We use an attributional life cycle assessment (LCA) and simulation modelling to assess the effect of
improved feeding practices and increased yields of feed crops on milk productivity and GHG emissions
from the dairy sector of Tanzania’s southern highlands region. We calculated direct non-CO2 emissions
from dairy production and the CO2 emissions resulting from the demand for croplands and grasslands
using a land footprint indicator. Baseline GHG emissions intensities ranged between 19.8 and 27.8
and 5.8–5.9 kg CO2eq kg−1 fat and protein corrected milk for the Traditional (local cattle) and Modern
(improved cattle) sectors. Land use change contributed 45.8–65.8% of the total carbon footprint of
dairy. Better feeding increased milk yields by up to 60.1% and reduced emissions intensities by up to
52.4 and 38.0% for the Traditional and Modern sectors, respectively. Avoided land use change was
the predominant cause of reductions in GHG emissions under all the scenarios. Reducing yield gaps
of concentrate feed crops lowered emissions further by 11.4–34.9% despite increasing N2O and CO2
emissions from soils management and input use. This study demonstrates that feed intensification has
potential to increase LUC emissions from dairy production, but that fertilizer-dependent yield gains
can offset this increase in emissions through avoided emissions from land use change.
Tanzania is a low-income country of East Africa characterized by relatively low agricultural productivity and a
national greenhouse gas (GHG) emissions profile dominated by the land use sector. Land use change (LUC) is
the largest contributor to national GHG emissions, representing 66.0% of its estimated 319 Mt of annual CO2eq
emissions, with agricultural emissions (excluding LUC) accounting for 18.8% of these emissions1. About 55% of
Tanzania’s land area is occupied by woodlands and forests, and these areas are under increasing pressure from
anthropogenic activities, especially a griculture2. The expansion of land areas for crops and grazing are the two
largest causes of deforestation in the country3. The country has committed to reduce emissions by 10–20% relative
to the business as usual scenario by 2030 under the Paris Agreement4, although to date, the agricultural sector is
not included in Tanzania’s nationally determined contribution (NDC). The implementation of climate change
mitigation initiatives in the land and agriculture sectors is hampered by conflicts with economic development
objectives5 and by the lack of foresight analyses linking the impact of proposed GHG mitigation strategies to
changes in emissions and p roductivity6.
In the coming years, growth in demand for milk and dairy products caused by rising urban consumption is
expected to lead to a national milk supply gap of 5600 Mg year−1 by 20307. The Tanzanian Livestock Master Plan
(hereafter LMP) is a development program that, amongst others, aims to close this milk supply gap in order to
alleviate poverty and raise rural i ncomes8. There is potential for concurrently including Tanzania’s dairy sector
in the NDC and the development initiatives in the LMP; this, because the LMP prioritizes productivity growth
as a means to closing the projected supply gap. Such measures, via their effect on improving feed conversion effi-
ciency, could result in reductions in GHG emissions intensities (Herrero et al.9), potentially producing win–win
outcomes should these two initiatives be combined. To increase the likelihood of success of these mitigation
policy initiatives, a framework is required for quantifying the GHG emissions reductions possible in reference
aseline10, for which no such analysis has been done.
to a b
From a practice point of view, better livestock diets are widely viewed as essential to improving productiv-
ity and reducing GHG emissions from d airy11. Tanzania’s dairy sector is constrained by lack of adequate feed
1
Lancaster Environment Centre, Lancaster University, Lancaster, UK. 2Plant Production Systems, Wageningen
University, Wageningen, The Netherlands. 3Center for International Forestry Research (CIFOR), Bogor,
Indonesia. *email: jameshawkins702@gmail.com
Scientific Reports | (2021) 11:4190 | https://doi.org/10.1038/s41598-021-83475-8 1
Vol.:(0123456789)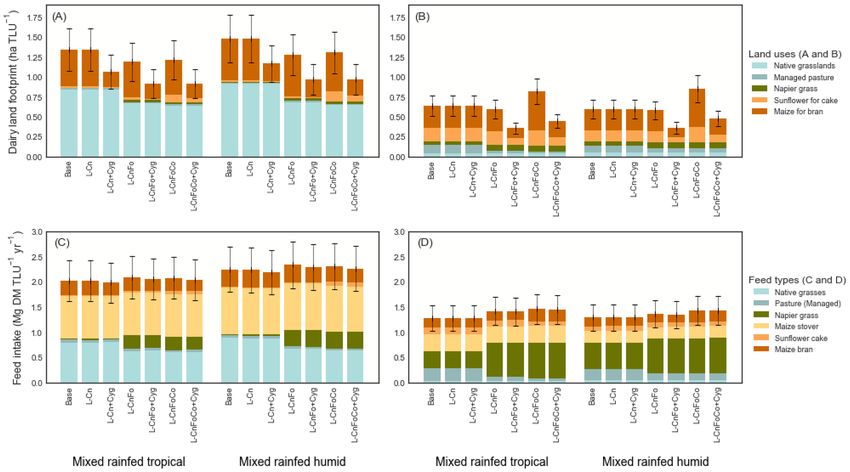
www.nature.com/scientificreports/
resources, associated with a widespread degradation of grasslands, land shortages in some regions, poor uptake of
better forage production and conservation practices, and a poorly developed animal feed processing i ndustry8,12.
Such factors lead to significant seasonal variations in milk production and offtake13. Dry season feed deficits
and the low genetic potential of much of the herd limits milk productivity growth, and lead to a high national
average emissions intensity of 19.9 kg CO2eq kg−1 FPCM (fat and protein corrected milk)14. Kenya and Ethiopia
emit 3.8 and 24.5 kg CO2eq kg−1 FPCM, respectively15,16, indicating that there is room for improvement. Feeding
management can influence productivity and GHG emissions in multiple ways. Adding more nutrient-dense feeds
to diets can improve milk yields and reduce methane (CH4) emissions intensity17. However, higher total energy
content of diets can also increase methane production per a nimal18. Other risks include increasing C O2 emissions
from expanding cropland a reas19 and N 2O emissions from intensification of feed crop p roduction19. Changes in
feeding practices can also lead to land sparing by substituting low yielding grass and forages with higher yield-
ing feed crops, for which regional and global studies have suggested can reduce grassland r equirements20 and
reduce deforestation21. As an estimated 96% of cattle in Tanzania are reared in extensive grazing s ystems22, we
hypothesized that land sparing is a leading strategy for reducing dairy GHG emissions.
This study assessed the effect of improved feed management in Tanzania’s dairy sector on GHG emissions in
relation to the output growth targets of the LMP. The analysis sought evidence for the merits of linking the LMP
to climate change mitigation initiatives, such as a dairy sector Nationally Appropriate Mitigation Action (NAMA).
We used a life cycle assessment (LCA) to quantify GHG emissions adding on previous work by Mottet et al.23,
Brandt et al.24,25 and Notenbaert et al.26. While all these studies accounted for the role of improved productivity
in reducing direct dairy sector emissions, to date no study has evaluated specifically the role of land sparing and
the potential for avoided land use change emissions to contribute to reductions in the dairy carbon footprint for
Tanzania’s dairy. For this purpose, we employed a land footprint indicator, which has been used previously for
assessing GHG emissions and productivity indicators of ruminant livestock systems in sub-Saharan Africa27,28.
This indicator helps assess the implications of crop and grassland expansion on LUC emissions and is consist-
ent with the IPCC Guidelines for National Greenhouse Gas Inventories29,30. The objective was to quantify the
impact of improved feeding management on milk output and sectoral emissions by 2030. The study focussed on
high-productivity systems of the southern highlands regions of Njombe, Mbeya, and Iringa and the Morogoro
region. This region is well suited agro-ecologically for dairy production, and is increasingly attracting private
and public sector investments in order to secure milk production for growing urban centres such as Mbeya and
Dar es S alaam31.
Methods
Modelling approach and data sources. The analytical framework involves coupling the Livestock Simu-
lation model (LivSim) (Rufino et al.32), an algorithm to calculate the land footprint of the dairy sector, and a
greenhouse gas quantification protocol based on principles of life cycle assessment (Fig. 1). LivSim is a dynamic
model that simulates the lifetime productivity of dairy cows based on feeding and genetic potential32,33. LivSim
was used to simulate individual cohorts of dairy animals (cows, bulls, juvenile males, heifers, calves) across
their lifetime, and the milk production and GHG emission estimates are aggregated to the production system
level. These form the basis for defining a baseline of milk production, emissions, and land use, and for assessing
the impact of feeding efficiency gains. The model was coded in the Python programming language34 as a shell
program that runs LivSim (also coded in Python) with additional code to define the land footprint and conduct
the LCA (Fig. S1).
The land footprint indicator includes all land directly used for providing feed biomass: cultivated and graz-
ing land, and land use ‘upstream’ from the farm for production of concentrate feeds. This framework allows an
assessment of the impact of changes in diets, or in productivity gains through higher crop yields, to the changes in
land use and milk productivity. The dairy land footprint, expressed as hectares per tropical livestock unit (250 kg
liveweight), is as forth defined as all crop and grassland directly used for feeding dairy cattle:
C
F Feed on offers,b,c,f
Dairy land footprintb,s ha TLU−1 =
f =1 Yieldf
(1)
c=1 × Use efficiency f
where b represents the cattle breeds, s represents the livestock production systems, C represents the cattle cohorts,
F represents the feeds included in the model, Feed on offer is the annual feed provision per TLU for a given breed,
cohort and for a specific feed (Mg TLU−1 year−1), Yield the annual yield of the given feed (Mg ha−1 year−1), and
Use efficiency the fraction of biomass that is either harvested or grazed. Feed on offer includes all feed available
from grazing, harvested on-farm, or purchased from the market.
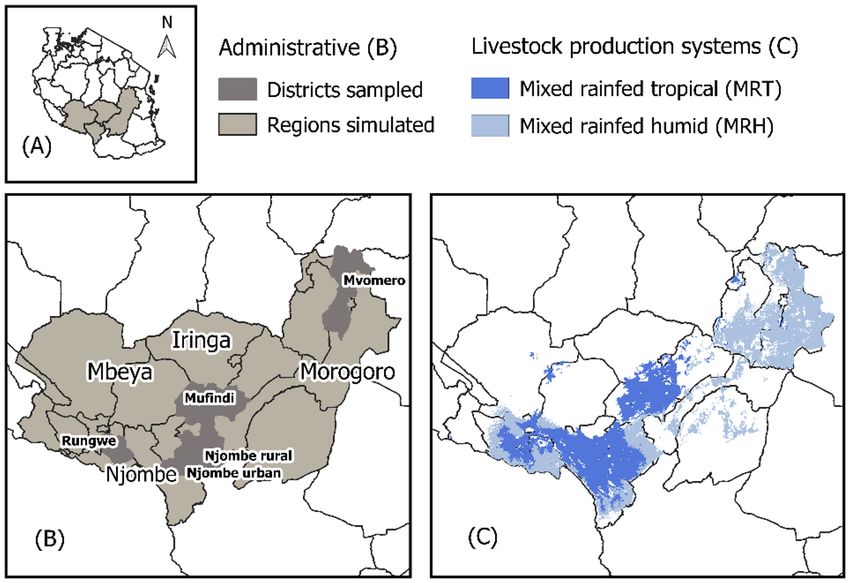
The model was parameterized with data from a survey of 1199 smallholder dairy farms conducted in south-
ern Tanzania from November 2017 to August 2018. Surveying activities, performed as part of the IFAD-funded
Greening Livestock project, were informed by a stratified random sampling protocol, capturing diversity in dairy
farming households (by cattle breed, and socioeconomic factors) among mid to high potential systems across four
sampled districts (Fig. 2). Baseline indicators characterizing existing feeding practices were developed, which
in turn represent diets within the livestock simulations. For the remainder of this paper this survey dataset will
LS35.
be referred to as G
Livestock systems and milk production in south and eastern Tanzania. This study focussed on
mixed (M) crop-livestock production, rainfed (R), tropical (T) humid (H) systems (hereafter MRT, MRH), fol-
lowing the Robinson et al.37 classification. MRT and MRH systems comprise a total of 43,400 km2 (18,500 km2
MRT; 24,900 km2 MRH) across the four regions. In these regions, rainfall is unimodal; the rainy season stretches
Scientific Reports | (2021) 11:4190 | https://doi.org/10.1038/s41598-021-83475-8 2
Vol:.(1234567890)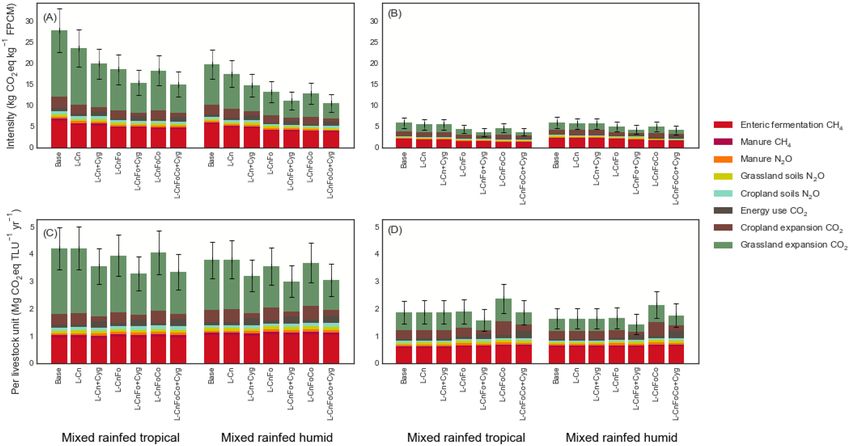
www.nature.com/scientificreports/
Figure 1. Analytical framework. A dynamic livestock simulation model (LivSim) is linked to an attributional
life cycle assessment (LCA) and a spatial aggregation procedure to quantify GHG emissions per kilogram of fat
and protein corrected milk (FPCM).
from November to April, followed by a 6-month dry p eriod38. Feed sources within these systems depend, to var-
ying degrees, on biomass consumed from grazing, crop residues, cultivated forages, and concentrates acquired
off farm. Seasonal variation in feed quantity and quality leads to different grazing and feeding practices across
seasons. During the dry season residues from crops form a larger percentage of diets due to the lower availability
of natural and planted forages. Concentrates are available from the market year-round but they are generally
used sparingly to improve productivity of cows and to maintain nutrient availability during periods of feed
scarcity39. Protein-dense concentrates, especially sunflower cake, are used to improve milk yields of cows, while
maize bran is commonly used as a supplement to maintain energy availability throughout the year22. Both of
these feeds are produced and processed locally22,40. The baseline diets in the present study, including the seasonal
biomass intake from cut-and-carry feeding systems, market purchases, and grazing, were specified using G LS35
41,42
and supplementary data sources (described in SI 1). Feed nutrient properties used in livestock simulations
were derived from FAO43 and literature44–46 (Table S4)
The land footprint was disaggregated based on the dominant sources of feed biomass, and the corresponding
land uses (Table 1). This allows the impact of changes in croplands and grasslands to land use change emissions to
be linked, as per the IPCC29 Guidelines. The main feed categories used were: primary crop products (sunflower
cake and maize bran), secondary crop products (maize stover), and grass. Grasslands are further divided into
native (unmanaged) and sown (managed). The nutritional value and biomass yield of native grasslands were
based on the literature on predominant native grass species in the region. Two types of grasses were distinguished
based on their yields and nutrient contents: low quality species of grasses were referred to as ‘Pasture’, which are
either harvested or grazed, while ‘Napier grass’ (Pennisetum purpureum), which is the most common improved
forage produced in the region ( GLS35), is considered a high quality, high yielding forage used primarily in cut-
and-carry systems.
The fraction of feed available from the total biomass yield, which takes into account the use efficiency, har-
vesting and manufacturing ratios (e.g. the ratio of bran or cake obtained from the grain or seed portion of the
crop) are shown in Table 1. The biomass available from crop residues was calculated using a harvest index of
0.3550. For concentrates the ratio of processed feed products (bran from maize or cake from sunflower) were
obtained from l iterature51,52. The use efficiency ranges from 0.50 to 0.95, and were set to 0.50 for grass and pas-
ture, consistent with values that have been used in previous assessments such a s53. These values reflect the high
stocking rates among highland grazing systems in T anzania54, which result in 0.39–0.61 forage use e fficiency55.
The use efficiency for Napier grass was set at 0.75 based on harvesting ratios reported from field experimental
Scientific Reports | (2021) 11:4190 | https://doi.org/10.1038/s41598-021-83475-8 3
Vol.:(0123456789)www.nature.com/scientificreports/
Figure 2. Geographic focus of study. (A) Shows the region within which the study focusses. (B) Shows the
administrative regions (Mbeya, Njombe, Iringa, Morogoro) for which the model simulations were run and the
districts (Rungwe, Njombe urban and rural, Mufindi, and Mvomero) the survey sampled from. (C) Shows the
livestock production systems within which the simulations were conducted. Figure generated in QGIS 3.8.236
(https://www.qgis.org/en/site/).
Available feed
Annual yield biomass Use efficiency Nitrous oxide flux Carbon density
Mg C ha−1
Land use Feed Mg DM ha−1 Mg DM ha−1 year−1 Fraction kg N2O ha−1 year−1 Soilsb Other poolse Total
d 0.44 (bran) 0.73 (stover)
Maize 1.46 0.95
Croplands 2.18 (stover) 1.03 (bran) 38.0 3.5 41.5
d
Sunflower 1.03 0.36 (cake) 0.95 0.90
Napier grass 13.04a 13.10 0.75 0.51
Grasslands Pastures 10.00c 3.04 0.50 0.08 48.0 4.5 52.5
Grasslands 3.00c 1.50 0.50 0.13
Wetlands 42.0 4.4 46.4
Shrubland 41.0 16.6 57.6
Forest 69.0 37.8 106.8
Table 1. Biomass productivity, nitrous oxide fluxes, and carbon density parameters for feed and land use
categories in model. Sources: a47, b48, c7, d40, e49.
trials in sub-Saharan A frica56. The use efficiencies for maize and sunflower were set at 0.95 which are consistent
with the nationally reported harvesting efficiency of FAO S tat40. The feed biomass yields per feed type, land use
classifications, baseline soil N2O fluxes (see “SI” for how these were estimated) and C densities of these land use
types are shown in Table 1.
Dairy cattle populations and milk production. The dairy sector included all milking cows, replacement
females (heifers and female calves), and reproductive cohorts (bulls, juvenile males, and male calves) which
are required for maintaining the stock of cows. Between 90 and 98% of the cows milked in the study areas were
indigenous (Bos indicus) cattle, while the other 2–10% were crossbred (Bos indicus × Bos taurus) or purebred
(Bos taurus)57,58. Studies indicate that milk production by improved dairy cattle breeds ranges from 1350 to
2200 L lactation−157,59 and calving intervals range from 400 to 520 days59,60. For indigenous cattle, milk yields
are typically 500–600 L lactation−1, and calving intervals range from 450 to 600 days59,60. Due to the difference
in productivity between local indigenous and improved cattle, this study disaggregated the dairy sector (and
the dairy land footprint) by breed, resulting in two sectors: the Traditional (local cattle) and Modern (improved
Scientific Reports | (2021) 11:4190 | https://doi.org/10.1038/s41598-021-83475-8 4
Vol:.(1234567890)www.nature.com/scientificreports/
cattle) sectors. Livestock simulations for cattle in the respective sectors were conducted with breed parameters
derived from literature61–68 (Table S1).
Quantification of greenhouse gas emissions. The dairy sector’s GHG emissions were calculated using
an attributional life cycle a ssessment69. The LCA boundary was defined as ‘cradle to farm gate’; all major GHG
emissions sources from resource extraction through to the farm gate were included. Post-farm gate emissions
such as for transporting and processing raw milk were not considered. Emissions sources were expressed in rela-
tion to a functional unit of one kilogram of fat and protein corrected milk (FPCM) which is calculated as milk
production standardized to 4% fat and 3.3% protein (IDF)70. The inventory of GHG emissions sources (Fig. 1)
included enteric fermentation (CH4), manure (CH4 and N2O), organic and inorganic N inputs into crop and
grassland soils (N2O), energy use from manufacturing and transport of feed and fertilizer inputs (CO2), and
land use change emissions (CO2) from changes in crop and grasslands driven by the direct changes resulting
from increased demand from dairy cattle. A mass allocation factor was used to allocate the total GHG emissions
from the dairy herd to production of milk and meat, and this value ranged from 0.85 to 0.95. Meat production
was calculated using culling rates for each sex (7.7 and 14.0% for female and male cattle, respectively) and a
dressing percentage of 52%57,71. Methane and nitrous oxide were converted to CO2 equivalents using global
warming potentials of 28 kg CO2eq kg−1 of CH4 and 265 kg CO2eq kg−1 of N2O72. The GHG emissions from
enteric fermentation, manure, and soils were calculated in line with IPCC29 guidelines taking emission factors
derived from literature73–75 or estimated using equations from literature76 (SI 2). In cases where local emission
factor data were not available, default IPCC (Tier 1) values were used. CO2 emissions from energy used during
the manufacturing of fertilizer inputs, feed processing, and the transportation of feed and fertilizer to the farm
were included by linking fertilizer and concentrate feed use to C O2 emissions using embodied emission factors
obtained from the literature77–80 (SI 2). Sources of GHG emissions omitted include those from cattle respiration,
farm machinery, electricity, inputs other than feeds and fertilizers, and the construction of farm structures, as
these are generally considered minor especially in a low-income context53. The results of the baseline values of
N2O fluxes modelled from IPCC equations (SI 2) from crop and grassland soils are shown in Table 1.
Carbon dioxide emissions from land use change. Land use changes attributed to changes in feed demand were
categorized into one of two transitions: (1) cropland expansion: grasslands being converted to croplands, and (2)
grassland expansion: other native ecosystems being converted to grasslands. Native ecosystems in this context
included wetlands, shrubland, and forests. Indirect land use change from feed crops replacing grasslands is
accounted for via the ‘competition effect’81. As croplands displace grasslands, a proportional increase in grass-
land expansion must take place to meet forage requirements. Thus, because grassland expansion can result in
native ecosystems being displaced, cropland expansion (via the displacement of grasslands) can also indirectly
lead to the conversion of native ecosystems.
The CO2 emissions from these land use changes were estimated using the stock change method29,82. Under
this framework, the flux of C (Mg C ha1 year−1) resulting from the conversion of land is related to the difference
in C densities between the current and the previous land use. The C densities for a given land use category are
equal to the sum of the five following pools: soils, below and above ground biomass, coarse woody debris, and
litter29. Following the practice of LUC accounting in dairy LCA, the CO2 emissions after land use change were
amortized over a 20-year period71,83. The transition coefficient for cropland expansion was based on the differences
between grassland and cropland C stocks reported in Table 1. This resulted in a difference of 11.0 ± 2.0 Mg C ha−1
between crop and grasslands.
Estimating CO2 emissions from conversion of native ecosystems to grasslands. The extent of grassland expansion
was calculated based on the relative availability and utilization of grassland for both LPS based on the density of
dairy cattle and availability of grassland per grid cell (see “SI” for details), following an approach similar to that of
Havlik et al.84. Thus, native ecosystems were converted to grasslands when the demand for grasslands exceeded
availability. To calculate the transition coefficient, native ecosystem C stocks were estimated using spatially-
explicit land cover data at a 100 × 100 m pixel r esolution85. The C stock density of native ecosystems was esti-
mated as a weighted mean of the shrub, forest, and wetland categories. The C densities of these land categories
(for the non-soil C pools) were based on national carbon stock inventory d ata49 and for soils, based on a topsoil
dataset compiled from 1400 locations across T anzania48 (Table 1). The weights were based on the proportion of
shrub, forest, and wetland in a given grid c ell85. This data was up-scaled to the same spatial resolution as the LPS
data and then aggregated to derive a C stock difference between grasslands and native ecosystems representative
of both MRT and MRH systems in the study region. The resulting values were 31.5 ± 6.3 and 30.9 ± 6.2 Mg C ha−1
for MRT and MRH systems, respectively. These values are in agreement with the estimates provided by Carter
et al.86. LUC emissions from grassland and cropland expansion at LPS level were calculated based on the total
amount of land undergoing the given transition in any 1 year, and the amount of CO2 emitted, after amortiza-
tion, per unit of land for that LUC transition.
Scenarios. This study explored three scenarios of improved feeding practices with and without feed crop
yield improvements suitable to the agroecological conditions of southern and eastern Tanzania and for each
dairy population (indigenous and improved). Similar scenarios were tested previously for Kenya by Brandt
et al.24,25. This study modifies the scenarios to the policy context and priorities and to the best practice recom-
mendations for the dairy sector in Tanzania (Table 2).
Under the strategy ‘Conservation’ (Cn), urea-molasses treated maize stover was fed to cows in place of
untreated maize stover. A urea-molasses treatment is proposed to enhance the nutritional quality of s tovers12.
Scientific Reports | (2021) 11:4190 | https://doi.org/10.1038/s41598-021-83475-8 5
Vol.:(0123456789)www.nature.com/scientificreports/
Sector Cattle population Feeding strategy Scenario abbreviation Description
Conservation L-Cn All maize stover fed to cows is treated with urea-molasses
L-Cn with Napier grass increased to 25% of feed on offer,
Conservation plus forage quality L-CnFo
replacing grass and pasture
Traditional Indigenous
L-CnFo with 2 kg d ay−1 of concentrates fed during early lac-
tation, and 0.5 kg day−1 during other periods. Concentrate
Conservation plus forage quality with supplementation L-CnFoCo
intake is comprised of 67% maize bran and 33% sunflower
cake
Conservation I-Cn All maize stover fed to cows is treated with urea-molasses
I-Cn with Napier grass increased to 50% of feed on offer,
Conservation plus forage quality I-CnFo
replacing grass and pasture
Modern Improved I-CnFo with supplement feeding involving
5.0 kg day−1 of concentrates during early lactation, and
Conservation plus forage quality with supplementation I-CnFoCo 1.5 kg day−1 during other periods
Concentrate intake is comprised of 67% maize bran and
33% sunflower cake
Table 2. Definitions of scenarios examined and their target populations of cattle.
Therefore, in the dry season when availability and nutrient quality of forages is reduced, feeding treated maize
stover can increase protein intake. The ‘Forage’ strategy (Fo) evaluated the role of higher rations of Napier feed-
ing, in place of grass and pasture. For the ‘Concentrate’ strategy (Co), supplemental concentrates were provided
to cattle according to supplementing regimes aimed at optimizing milk yields for local and improved cattle31,87.
The choice of concentrate was based on Bwire and Wiktorrson87 who evaluated the effects of supplementing 67%
maize bran and 33% sunflower cake rations on the performance of crossbred cattle in Tanzania. The concentrate
and forage rations for improved cows were higher to meet their higher feed conversion e fficiency88 (Table 2). All
three of these strategies were evaluated additively by first implementing the conservation strategy, then assessing
the additional effect of Fo and Co. This is because feeding greater concentrates was not found to be effective in
improving milk yields unless seasonal feed deficits were first reduced (e.g. by using feed conservation and greater
forage quality). For the results of additional scenarios, and the seasonal variation in nutrient availabilities for
the cow simulations, see SI Sect. 6.
The Tanzanian Grazing-Land and Animal Feed Resources Act89 seeks to catalyse the development of Tan-
zania’s commercial feed processing industry. The simulations therefore focussed on yield gains in maize and
sunflower for concentrate production, which are the two most common sources of concentrate feeds in the
region22. Current yields of these crops (Table 1) are significantly below their potential, with water limited yield
potential having been reported up to as high as 6.0 (maize) and 3.0 (sunflower) Mg ha−1 year−190,91. Data from
field experiments in Western Kenya92 were used to estimate the effect of higher N fertilizer application on yields
and N2O emissions of maize and sunflower used in concentrate production. The yield gains were set as 50% of
the yield gap based on the values reported above and in Table 1. The fertilizer requirement used to achieve these
yields were based on an N-yield response of 14 kg ha−1 kg N−1, with an emission factor of 0.015 kg N2O kg N−192.
These scenarios were implemented in addition to the above feeding strategies, and denoted with a ‘+ Cyg’ (‘Crop
yield gains’). The results of the yield gap and N
2O calculations used for these simulations are shown in SI 4.
Baseline production growth and greenhouse emissions. A baseline provides a reference level against which a miti-
gation goal can be established10. The production practices used in the baseline represent those in the absence of
specific mitigation interventions93. The dairy herd population for 2020 was established using spatially-explicit
data on livestock population densities94 and annual growth rates in herd size. Feeding practices were obtained
from GLS33 (SI 1). Model parameters for the Baseline were thus set by extrapolating historical values over the
10-year timeframe of the assessment. Throughout the 10-year simulation period, the herd size was assumed
to grow by 5.5% and 4.5% annually for local and improved cattle, respectively73. No changes were assumed for
feeding or other herd management practices that would otherwise affect productivity or herd compositions. The
yields of feed crops were assumed to grow consistently with historical averages of 3.4% and 4.1% annually for
maize and sunflower, respectively40. The scenarios were run modifying the availability of feeds, with and without
yield improvements. For these scenarios, the populations and herd structures remained constant. The scenarios
described above for both Traditional and Modern systems were thus run to compare to the Baseline scenario. This
resulted in a total of 14 runs (2 baselines + 2 sectors × 3 feeding scenarios × 2 crop yield variants) for each LPS.
Uncertainty assessment. Uncertainty in GHG emissions was quantified in line with the IPCC29 Guide-
lines. In the baseline, the sources of uncertainty were dairy cattle numbers per LPS, feed on offer per head,
biomass yields, and emission factors (including coefficients on LUC transitions). For subsequent simulations the
dairy herd and feed intakes were specified in relation to the baseline, and therefore for all other scenarios the
only sources of uncertainty were in emission factors and biomass yields. Monte Carlo (MC) simulations were
run for the baseline and each subsequent scenario to estimate the GHG emissions error range at a confidence
interval of 95%. The standard error in emission factors were specified based on I PCC29 Guidelines. The uncer-
tainty in the emission factor for enteric fermentation (Ym), which was calculated using Tier 3 guidelines, was
set at 10%, consistent with previous studies estimating Y m using Tier 3 g uidelines95. The coefficients for LUC
were calculated from country specific inventory studies and thus were either Tier 2 or 3 emission factors48,49.
Scientific Reports | (2021) 11:4190 | https://doi.org/10.1038/s41598-021-83475-8 6
Vol:.(1234567890)www.nature.com/scientificreports/
Figure 3. Greenhouse gas emissions for Traditional (A, C) and Modern (B, D) dairy sectors.
Moreover, because these coefficients were highly dependent on the C density data reported by Mauya et al.49,
who report relatively low uncertainty (0.9% for forest and 1.8% for non-forest land), the standard errors for such
were set at 20%. Because this study included simulations for greater N-fertilizer application, which may result
in highly variable and uncertain changes in N 2O emissions, the standard error of this emission factor ( EF1 soil
N inputs) was set at greater than double the required upper range for Tier 1 emission factors, taking a value of
± 66%. All other emission factors ranging from Tier 1 to 3 were set based on IPCC guidelines, thus ranging from
7 to 30% (SI 5).
Results
Evaluation of the baseline. Direct emissions intensity (excluding LUC emissions) for the baseline were
9.3 ± 1.7 (95% confidence interval) and 7.8 ± 1.4 kg CO2eq kg−1 FPCM (MRT and MRH, respectively) for the Tra-
ditional sector. For the Modern sector, these emissions were 2.8 ± 0.62 and 3.2 ± 0.72 kg CO2eq kg−1 FPCM (MRT
and MRH, respectively) (Fig. 3A,B). Emissions from LUC, expressed as emissions intensities, were 18.5 ± 4.1
and 12.0 ± 2.6 kg CO2eq kg−1 FPCM (MRT and MRH, respectively) for the Traditional sector and 3.0 ± 0.81 and
2.6 ± 0.57 kg CO2eq kg−1 FPCM for the Modern sector. The CO2 emissions from LUC (cropland and grassland
expansion) throughout the simulation period (2020–2030) contributed between 45.8 and 65.8% of the total
GHG emissions from milk production. Of the total LUC emissions, 7.7 and 29.2% (2.6 and 2.4 for MRT and
MRH Traditional, and 0.98 and 0.81 kg CO2eq kg−1 FPCM for MRT and MRH modern sector, respectively) were
from cropland expansion. The remaining 70.8–92.3% (18.5 and 12.0 for MRT and MRH Traditional, and 2.0
and 1.60 kg CO2eq kg−1 FPCM for MRT and MRH Modern sector, respectively) were from grassland expansion.
The difference in LUC emissions between MRT and MRH is attributable to (a) a higher percentage of grassland
expansion in MRT resulting in the conversion of native ecosystems, and (b) a larger land footprint for the dairy
sector in MRT, owing to the larger herd overhead (i.e., the larger proportion of unproductive male and female
cohorts in the herd, see herd composition by system in SI Table S1).
Since this study is the first quantitative assessment of GHG emissions that includes C
O2 emissions from LUC
from the Tanzanian dairy sector, these emissions estimates cannot be compared directly with other literature.
However, using the Global Livestock Environmental Assessment Model (GLEAM), FAO New Z ealand14 estimated
direct emissions in Tanzania’s dairy sector, which included emissions from enteric fermentation, manure, N 2O
emissions from managed soils, as well as CO2 from feed and fertilizer production/transport. FAO New Zealand
estimated emissions intensities from these sources within the range of 20–28 and 2–3 kg CO2eq kg−1 FPCM
for the Traditional and Modern sectors respectively (including from both MRT and MRH systems). This latter
study, which is a nationally representative study of Tanzania, estimated lower milk yields for local cattle (200 L
per lactation). In the present study focussing specifically on mid to high productivity (i.e. excluding pastoral)
systems in the southern highlands and Morogoro, yields were estimated at significantly higher levels (582 and
538 L lactation−1 for the MRT and MRH baselines, respectively). Hence, the direct emissions intensities were
estimated to be 53.5–61.0% lower than those estimated by FAO New Zealand. The emissions intensities for the
Modern sector of the present study are comparable to those of FAO New Zealand and those of neighbouring
countries with a high proportion of crossbred dairy cattle (e.g., Kenya). In Kenya, emissions intensities have been
estimated to be 2.2–3.0 kg CO2eq kg−1 FPCM24,96.
Scientific Reports | (2021) 11:4190 | https://doi.org/10.1038/s41598-021-83475-8 7
Vol.:(0123456789)www.nature.com/scientificreports/
Mixed rainfed tropical Mixed rainfed humid
Milk yield Milk yield
Lactation Annual Change Lactation Annual Change
Scenarios Feeding practices (kg FPCM cow−1 lactation−1) (kg FPCM cow−1 year−1) (%) (kg FPCM cow−1 lactation−1) (kg FPCM cow−1 year−1) (%)
Traditional sector (local cattle)
Base Baseline 582 358 538 331
L-Cn Feed conservation 689 424 + 18.4 611 377 + 13.9
Feed conservation, for-
L-CnFo 823 507 + 41.6 758 466 + 23.6
age quality
Feed conservation, for-
L-CnFoCo 858 528 + 47.4 813 501 + 51.4
age quality, concentrates
Modern sector (improved cattle)
Base Baseline 1413 932 1326 875
I-Cn Feed conservation 1458 991 + 6.3 1387 915 + 8.3
Feed conservation, for-
I-CnFo 1833 1264 + 35.6 1580 1059 + 25.3
age quality
Feed conservation, for-
I-CnFoCo 2163 1492 + 60.1 1965 1355 + 54.9
age quality, concentrates
Table 3. Effects of feeding scenarios on milk yield for the Traditional sector (local cattle) and Modern sector
(improved cattle).
Impact of feeding intensification on direct non‑CO2 GHG emissions. Direct emissions intensities
were reduced by up to 28.2 ± 5.1 and 29.2 ± 5.3% for local cattle in MRT and MRH, respectively (Fig. 3A). For
improved cattle, the scenarios led to declines in direct emissions intensities of up to 28.0 ± 6.2 and 26.7 ± 5.9%
(MRT and MRH) (Fig. 3B). The scenarios resulting in the largest declines in emissions intensities were the forage
quality plus concentrates scenarios (L-CnFoCo and I-CnFoCo), and for the simulations without yield gains in
feed crops. Since the diets for scenarios with and without yield gains were identical, the slightly higher value for
direct emissions intensities for the yield gains scenarios was caused by an increase in soil N 2O emissions from
croplands by 16–40%, and in energy use CO2 by between 220 and 242%.
All the scenarios assessed for all systems led to greater intake of metabolizable energy and protein, which
led to 18–52% and 6–63% gains in milk yields for cows in the Traditional and Modern sectors, respectively
(Table 3). All the scenarios resulted in greater annual gross energy intake per cow, and while these represent
modest declines in Ym, up to a maximum of 7.5%, the impact on CH4 emissions from enteric fermentation were
negligible. Changes in enteric C H4 ranged between − 3.8 and + 8.7%. Manure C H4, also because of higher gross
energy intake, increased by up to 15.4%. Manure N2O increased by up to 40.5%, because of the higher protein
concentration of the diets and consequently higher N excretion in manure. The only scenarios that did not lead
to higher manure CH4 was Conservation (Cn). In summary, the scenarios therefore resulted in modest increases
in absolute GHG emissions from enteric fermentation, manure and soils, by between 0.0 and 14.1% (Traditional)
and 0.0–33.1% (Modern) (Fig. 3C,D). However, through their impacts on milk yields, these scenarios had sig-
nificant impacts in reducing emissions intensities, up to 29.2% (Traditional) and 28.0% (Modern). The scenarios
thus improved emissions efficiency (emissions per unit FPCM), but they did not actually reduce direct non-CO2
emissions in absolute terms (i.e. per TLU).
Land use effects of changes in feed mixes (not including crop yield gains). The scenarios resulted
in 4.6–45.0% greater cropland area and 17.6–28.9% less grassland area under use as part of the dairy land foot-
print (Fig. 4A,B). The scenarios L-Cn and I-Cn were exceptions as they did not result in LUC because this
strategy only involved the treatment of available maize stover fed to cows. For the Traditional sector, dedicating
greater area to feed crops under L-CnFoCo resulted in between 410.0 and 557.0% greater land under sunflower
and 3.0–7.0% less land under maize (for concentrate production). For the Modern sector (I-CnFoCo), between
15.0 and 37.0% greater maize and 75.2–82.2% greater sunflower areas resulted from the increase in concentrate
feeding. These scenarios consequently resulted in between 2.0 and 11.5% (Traditional) and 52.0–66.5% (Mod-
O2 emissions from cropland expansion relative to baseline. Concurrently, the land areas required
ern) greater C
for grasslands declined by between 21.0 and 25.7% (Traditional) and 29.0–29.4% (Modern).
The net effect of these changes was a reduction in the dairy land footprint by 7.4–9.5% and 6.1–8.2% for the
L-CnFo and L-CnFoCo scenarios, respectively, for the Traditional sector. For the Modern sector, I-CnFo and
I-CnFoCo led to 30.1–32.5% less and 20.9–31.8% greater land footprints, respectively. The increase in cropland
area dedicated to concentrate feeds crops under I-CnFoCo outweighed the decline in grassland area and hence
the total land footprint increased (Fig. 4B,D, I-CnFoCo). These changes resulted in reductions of between 8.0
and 31.1% (Traditional) and 10.9–16.0% (Modern) in emissions associated with grassland expansion. Under
I-CnFoCo, while the land footprint increased, only between 29.8 and 49.5% of this additional area expansion
resulted in the conversion of native ecosystems. Therefore, for all scenarios there were reductions in total LUC
CO2 emissions, by 7.2–15.5% for the Traditional sector and 1.2–4.1% for the Modern sector.
Scientific Reports | (2021) 11:4190 | https://doi.org/10.1038/s41598-021-83475-8 8
Vol:.(1234567890)www.nature.com/scientificreports/
Figure 4. Dairy land footprint and feed intakes for Traditional (A,C) and Modern (B,D) dairy sectors.
Effects of crop yield gains on the land footprint and GHG emissions. The fertilizer-induced yield gains in maize
(for bran) and sunflower (for cake) led to an increase in soil N2O emissions by a factor of 5.5 for maize and 3.2
for sunflower (full results in SI Sect. 4). These increases occurred concurrent with a 2.25 and 1.0 Mg ha−1 year−1
increase in the yields of these crops. Hence, absolute N 2O emissions per hectare for these two crops, as well as
yield-scaled N2O emissions, increased. These yield gains however led to less area of these two crops needed to
satisfy the feed demands for the dairy herd. Relative to the scenarios without yield gains, the total area dedicated
to maize (for bran) and sunflower (for cake) declined by 57.6 and 47.4%, respectively (Fig. 4A,B), as a result
of these yield gains. Moreover, most of the scenarios (with the exception of the feed conservation scenarios)
involved the substitution of feeds with relatively low soil N 2O emissions (native grasslands) for feeds which
have relatively high N2O fluxes (Napier grass and concentrate feed crops) (Table 1) (Fig. 4C,D). Therefore, the
fertilizer-dependent yield gains have the effect of increasing total N 2O emissions relative to the scenarios with
the same diets with baseline yields for concentrate feeds. Moreover, while the dietary impact of these changes
was higher milk productivity (Table 3), the growth in milk production is not sufficient to lead to an actual
decline in the soil N2O emissions intensity. Relative to the baseline crop yield growth variant, N2O emissions
intensities therefore rose by a maximum of 34.0%. The additional reliance on concentrate feeds also led to greater
CO2 emissions from energy use upstream from the farm, increasing by between 220 and 232% (Traditional
sector) and 227–246% (Modern sector). This also led to higher CO2 emissions from energy use per unit of
milk. However, despite the growth in N 2O and CO2 emissions from crop yield gains, these have the effect of
reducing LUC emissions, both from cropland expansion (e.g., because less crop area was required to meet the
crop feed demands) and from grassland expansion. The latter occurred because the yield gains in feed crops
implied less grasslands needed to be converted to cropland to satisfy the crop feed demands, and hence there
would be less expansion of grasslands needed to replace the grassland converted to croplands. In summary, the
fertilizer-dependent yield gains have the effect of increasing N2O emissions from soils and energy use CO2, both
in absolute terms and per kg FPCM. However, the decline in land converted to cropland due to improved yields
would result in less cropland and grassland expansion, and thereby lower LUC emissions. The reduction in LUC
emissions outweighed the increase in emissions from soils and energy use, and therefore in net terms, the crop
yield gains reduced GHG emissions attributable to milk production by between 11.4 and 4.4% (Traditional) and
29.5–34.9% (Modern).
Discussion
To the knowledge of the authors, this study presents the first comprehensive assessment of GHG emissions from
Tanzania’s dairy sector that includes the impact of indirect emissions from expanding crop and grassland areas.
Initiatives to include the dairy sector in Tanzania’s NDC or, for example, to develop a dairy NAMA will require
foresight analyses, which provide empirical evidence quantifying the impact of proposed mitigation strategies
on GHG emissions and on milk productivity. This study therefore offers the first assessment of such dimensions,
which can be used in subsequent analyses that consider additional mitigation strategies (e.g. animal genetic
Scientific Reports | (2021) 11:4190 | https://doi.org/10.1038/s41598-021-83475-8 9
Vol.:(0123456789)www.nature.com/scientificreports/
gains)—also in conjunction with cost–benefit analyses. It thereby supports ongoing public and private efforts to
formulate evidence-based mitigation strategies available.
The framework used in this study, based on principles of attributional life cycle assessment, was instrumental
in showing how LUC emissions are comparatively significant in relation to direct non-CO2 emissions. These
account for 45.8—65.8% of total GHG emissions from the dairy sector. Because all the scenarios resulted in
increases in direct non-CO2 emissions by between 0.6 and 33.1%, our analysis demonstrates that emissions from
LUC deserve to be prioritized in future mitigation strategies. Importantly, this study highlights that reducing the
dairy land footprint through improved feeding practices combined with crop yield gains has particular mitiga-
tion potential by curbing emissions from cropland and/or grassland expansion. These results could be used
to guide the development of a dairy NAMA or the refinement of the NDC benefiting from synergies resulting
from improved feeding practices and crop yield gains on dairy sector productivity and land use. The higher milk
yields would result in economic benefits for dairy producing households across the four studied regions. The
milk productivity and GHG emissions estimates described above could help stakeholders who must balance
both environmental and socioeconomic criteria in designing climate change mitigation policies (Lin et al.)97,
and who must target populations based on criteria such as breed of cattle owned (i.e. the Traditional or Modern
sectors, as described above) or on productivity potential across livestock production systems.
This study contributes to the knowledge base by providing GHG mitigation potential at sub-national scale
from reduced land use in the dairy sector, a first for sub-Saharan Africa (SSA). Previously, Brandt et al.25 evalu-
ated comparable feed and crop yield scenarios in Kenya using a framework that included C O2 emissions from
cropland expansion as well as forest grazing. The present analysis includes both cropland and grassland expansion
using longitudinal simulations and the feeding and crop yield scenarios were evaluated in relation to a baseline.
This study found that avoided emissions from grassland expansion were the main cause of emissions reductions.
These emission reductions were more significant (declining by up to 1.2 and 12.9 kg CO2eq kg−1 FPCM for
Modern and Traditional sectors, respectively) than the estimated reduction in CO2 emissions from forest graz-
ing by Brandt et al.25, estimated at 0.06 kg CO2eq kg−1 milk under the optimal feeding and maize yield scenarios.
Similar as the present study, other top down, regional studies using the Global Biosphere Model (GLOBIOM)
(Havlik et al.)84 have found that land sparing could be a key mitigation strategy in the beef and dairy s ectors27,98.
Gerssen-Gondelaach et al.27 calculated that LUC-related emissions across Latin America, South-East Asia, and
Sub-Saharan Africa (SSA) account for 20 to over 50% of total GHG emissions from beef and dairy production
systems, and suggest that reducing LUC-related emissions is a key strategy for reducing GHG emissions from
dairy production in SSA and other regions.
The realization of avoided LUC emissions could be influenced by a demand or supply r ebound99. Based on
the partial equilibrium analysis of Valin et al.100, improving productivity in ruminant productions systems in SSA
under the presence of highly elastic demand for milk and dairy products resulted in production rebounds suf-
ficient enough to negate emissions savings from reduced LUC. In Tanzania, increasing domestic milk production
is a pillar of the national poverty alleviation s trategy7 and therefore policy initiatives in the dairy sector will likely
favour continued supply growth, by improving availability of inputs, promoting improved production practices,
and further developing dairy supply chains7. Such factors combined with increasing demand from a growing
and increasingly affluent and urbanized population, or from increased demand from trading partners, could
result in significant growth in production in coming years. This thus poses the risk that efficiency gains result in
greater crop and grazing land expansion, increasing CO2 emissions from LUC, leading to similar outcomes as
well documented cases in South A merica100. We caution therefore that more work is needed to evaluate the risk
for these outcomes. For evaluating these outcomes, consequential LCA is more suitable than the attributional
method used here, owing to its ability to account for indirect land use change, import substitution and substitu-
tion between beef and milk p roduction101.
Prioritizing climate change mitigation activities in Tanzanian dairy. Since LUC emissions com-
prise a large portion of the C footprint, it logically follows that changes that lead to a reduced land footprint,
such as by replacing low yielding native grasslands (≤ 3 Mg ha−1 year−1) with Napier grass (≥ 10 Mg ha−1 year−1)
or through yield gains in feed crops, could result in avoided emissions from LUC. However, this study did not
find strong evidence that feed intensification in itself contributes to avoided LUC. It attributes this to the effect
of increases in crop-based feeds (maize bran or sunflower cake) on land use (scenario I-CnFoCo), which led
to a larger land footprint. The dietary changes under this scenario brought the level of concentrate intake to
levels reminiscent of intensified dairy farms. For e xample96, reports that dairy farms in Kenya typically use
1–2 kg cow−1 day−1 of concentrates. Thus, based on these results, we caution that adoption of improved feed-
ing practices, insofar as these lead to greater demand for feed crops, have potential to increase the dairy land
footprint, leading to higher C O2 emissions from LUC. However, the present analysis also shows that crop yield
gains can offset this. This has a net negative effect on the overall carbon footprint because N 2O and C O2 emis-
sions from crop yield gains is low relative to the avoided emissions from LUC. Although the present study only
assumed a 50% yield gap reduction, it still estimated emissions savings that are 105% larger than those estimated
by25 (this study simulated crop yield gains of up to 80% of the water limited yield potential for maize). The
higher estimated net mitigation of the yield gains herein were attributable to the inverse relationship with area
of grassland under use for feeding, which in turn translated into reduced conversion of native ecosystems. We
therefore expect that initiatives under the Tanzanian Grazing-land and Animal Feed Resources Act89, as well
as complementary programs in the grain and oilseed subsector102, could result in mitigation co-benefits for the
dairy sector. In order to maximize the likelihood of co-benefits, these policy initiatives should promote best
practices to increase the yields of feed crops. Such practices would sustainably enhance yields and minimize N2O
fluxes resulting from application of N-fertilizer103.
Scientific Reports | (2021) 11:4190 | https://doi.org/10.1038/s41598-021-83475-8 10
Vol:.(1234567890)www.nature.com/scientificreports/
The feeding strategies evaluated for the Traditional sector suggest that reducing seasonal feed deficits are
essential in improving emissions efficiency of this sector. Feeding high quality forages or concentrates will not
result in improved productivity unless seasonal feed deficits are better managed since poor body condition
caused by periodic feed deficits can have lasting effects on milk productivity and r eproduction105 and lifetime
productivity of the cows31. Of the scenarios evaluated above and the additional scenarios presented in SI 6,
feeding additional concentrates during lactation was not found to be particularly effective if a feed conservation
strategy was not first implemented. Based on this we propose that dairy farmers rearing local cattle (the Tradi-
tional sector) should be supported to adopt better feed conservation practices, such as treatment of stovers, or
of silage or hay making practices. Such practices would improve productivity by reducing dry season milk yield
shortfalls. While treatment of stover is relatively safe and easy, lack of access to urea is often cited as a constraint
to widespread adoption of this p ractice12.
The benefits of higher milk yield and lower emissions intensities from improved feeding will be highest when
these interventions are targeted to the Modern sector. Moreover, owing to the higher feed conversion efficiency
and greater efficiency of Bos taurus genetics88, a greater uptake of Bos taurus in place of Bos indicus genetics could
allow for milk production targets to be met with a smaller land and carbon footprint. Notenbaert et al.26 evalu-
ated the role of genetic gains on GHG emissions and household food security in the Tanga region of Tanzania,
estimating that genetic gains could reduce emissions intensity of milk by as much as 50%. However, their study
only accounted for direct non-CO2 emissions, and thus potentially omitted a significant component of the dairy
C footprint occurring from LUC. Based on our estimates, the Traditional sector, due to the greater reliance on
native grasslands and the comparatively large herd overhead (larger proportion of unproductive cattle), has more
than twice the land footprint (1.25–1.50 ha TLU−1 versus 0.60–0.70 ha TLU−1) and up to a 4.5 higher C footprint,
when the role of LUC emissions are accounted. We emphasize therefore that genetic gains offer significantly
larger GHG mitigation potential than previously estimated. It is proposed that because the Traditional sector is
constrained by low feed conversion efficiency and contributes the majority of the LUC emissions, genetic gains
should be a priority focus for GHG mitigation initiatives. Genetic gains would help to capitalize on synergies
resulting from improved feeding and animal husbandry, and will be more effective at reducing emissions inten-
sities when combined with yield gap reductions in the feed crop sector. In this regard, there can be synergies
between these GHG mitigation initiatives and existing priorities under the LMP, for which genetic gains and
feeding practice improvement are key components8.
Feeding management in Tanzania’s livestock master plan and GHG emission targets. The
milk yield gains in our scenarios are as high as 51.4% and 60.1% for local and improved cows, respectively.
These milk productivity gains were associated with up to 52.4% and 38.0% declines in emission intensities in the
Traditional and Modern sectors, respectively. Using the baseline estimates of milk production from the above
simulations, the estimated supply gap projected by the LMP8 of a factor of 71.0% of the national milk demand by
2030 could be reduced by up to 32.1%. Alternatively, if the milk supply gap were to be wholly eliminated, these
changes in feeding practices would allow for a 33.3% reduction in the size of the dairy herd relative to a scenario
involving baseline feeding practices. Such changes in feeding practice combined with the yield gap reductions
simulated in this study would allow milk production targets to be met with up to 52.4 and 38.0% reductions in
emissions intensities for the Traditional and Modern sectors, respectively.
Limitations and suggestions for future research. Data limitations and modelling uncertainty. Emis-
sion factors (EFs) in this study are based on the best available estimates from the literature and values ranged
from Tier 1 to Tier 3 29. An advantage of the approach taken here was that the EFs that have the largest impact on
the dairy sector’s GHG footprint (i.e. enteric fermentation and LUC) were calculated with Tier 2 and 3 factors.
Central to the development of more accurate GHG accounting frameworks for crop and livestock production
will be the availability of country specific EFs, such as those pertaining to emissions from manure management,
and crop and grasslands. The same applies to datasets on livestock population densities, as well as data on feed
ratios/intakes of livestock. The present study benefitted from the most recent gridded livestock of the world
dataset94, which to the knowledge of the authors is the most accurate source of spatial data on livestock popula-
tion densities currently available. The diets specified herein were based on survey d ata35, which is prone to er-
roneous farmer recall. Moreover, it is known that livestock diets vary highly across geographies and farm types.
This introduces uncertainties in diet baselining. All these sources of uncertainty were nevertheless quantified in
the present study through Monte Carlo simulations.
The LUC transition framework in this study was based on the assumption that cropland expansion converts
grasslands, which may not always be the case. While this study did not consider management changes within
a given land use category, the scenarios assessed were designed to reduce the requirement for grazing (e.g. by
reducing the total grassland requirements), and therefore in principle should result in less demand for grazed
biomass, and hence degradation of grasslands or native ecosystems. In this respect, the use of a dynamic livestock
model was instrumental, because the change in roughage intake with changing dietary regimens is explicitly
accounted for. The further development of methodologies for accounting for the impact of grazing practices
on land degradation and LUC, and for validating these methodologies on the ground, will assist studies such as
ours with the development of region- or country-specific GHG emission estimates.
Suggestions for future work. The modelling framework developed for this study is publicly available (see data
availability below) and thus other researchers working at the intersection of dairy production and climate change
mitigation could extend this analysis further. Extending the framework in this study using a consequential LCA
would be warranted given the greater depth and policy insights provided by this over the attributional method.
Scientific Reports | (2021) 11:4190 | https://doi.org/10.1038/s41598-021-83475-8 11
Vol.:(0123456789)You can also read