Mozambique Energy Outlook, 2015-2030. Data, scenarios and policy implications
←
→
Page content transcription
If your browser does not render page correctly, please read the page content below
Munich Personal RePEc Archive

Mozambique Energy Outlook, 2015-2030.
Data, scenarios and policy implications

Mahumane, Gilberto and Mulder, Peter

VU University Amsterdam

May 2015

Online at https://mpra.ub.uni-muenchen.de/65968/
MPRA Paper No. 65968, posted 06 Aug 2015 14:25 UTC
Faculty of Economics and Business Administration

Mozambique Energy Outlook, 2015-2030.
Data, Scenarios and Policy Implications

Research Memorandum 2015-7

Gilberto Mahumane
Peter Mulder
Mozambique Energy Outlook, 2015-2030.
 Data, Scenarios and Policy Implications

 Gilberto Mahumanea and Peter Mulderb

 a
 Eduardo Mondlane University, Maputo, Mozambique
 & VU University, Amsterdam, The Netherlands
 Email: gilberto.mahumane@gmail.com
 b
 VU University, Amsterdam, The Netherlands

Abstract
This paper presents the first comprehensive Energy Outlook for Mozambique, a country that since long is
one of the poorest nations of the world but since recently also developing into a leading energy producer.
We present projections until 2030, based on a newly developed integrated long-run scenario model, new
national and regional energy statistics, demographic and urbanization trends as well as cross-country
based GDP elasticities for biomass consumption, sector structure and vehicle ownership. Our analysis
shows an emerging ‘energy-dichotomy’ in Mozambique. On the one hand, the energy sector is
characterized by a rapid and huge expansion. Until 2030, exploitation of the country’s reserves of coal,
natural gas and hydropower is likely to increase primary energy production at least six-fold and probably
much more, most of which is destined for export. We show that, as a result, Mozambique is rapidly
developing into an important player at international energy markets; it may well become one of the
leading global producers of natural gas and coal. On the other hand, our analysis shows that households
continue to account for the major part of total energy consumption, with the majority of the population
still being deprived from access to modern energy fuels by 2030. Hence, despite the spectacular rise of the
extractive industry sector, population growth continues to be a key driver of energy consumption growth
in Mozambique. Finally, we discuss the major challenges these findings pose for energy policy in
Mozambique.

Keywords:
Mozambique, Energy Outlook, Energy Scenarios, Energy Policy

 1
1. Introduction
Over the last years Mozambique’s natural resource wealth has attracted substantial foreign direct
investments in large energy-intensive industries as well as in the mining, exploration and transformation
sectors. This undoubtedly will have a large impact on Mozambique’s role in international energy markets.
In its latest Africa Energy Outlook, the IEA refers to Mozambique as an emerging large energy producer
that is expected to soon join the group of leading energy producers in Africa, together with Nigeria, South
Africa and Angola (IEA 2014). This is a sharp break with the recent past: for many decades the
Mozambican energy sector was characterized by decline, disruption and post-war reconstruction, despite
its abundant natural resources. Against this background we present in this paper a comprehensive Energy
Outlook for Mozambique until 2030, based on a newly developed integrated long-run scenario model of
the Mozambican energy sector (Mahumane and Mulder 2015). To the best of our knowledge, our analysis
is the first integrated Energy Outlook for Mozambique in the energy studies literature.
 Until recently, the Mozambican energy sector is probably best known for the Cahora Bassa dam
(HCB), which is, with 2075 MW of capacity, one of the largest hydropower installations in Africa.
However, Mozambique has the potential to build another 5000 MW of hydropower. In addition, the
country has large sedimentary basins of natural gas: on-shore reserves have been discovered and off-shore
areas in the Rovuma basin are now researched and could contain more than 100 trillion cubic feet of gas,
and probably also oil. Until now, commercial discoveries are limited to natural gas whereas oil discoveries
appear to be economically not yet viable – but the area clearly has a potential for oil, and exploration is in
the early phase. In addition, during the last decade massive deposits of coal in the northern province of
Tete have been (re-)discovered, with an estimated size of about 23 billion tons.1 Moreover, the country
has vast extractable reserves of mineral sands, containing, among others, ilmenite, zircon, rutile and
titanium slag. Finally, the country’s has a great biomass and biofuels potential, with estimates of at least
30 million hectares of arable land currently unused.
 Paradoxically, despite all this wealth, the Mozambican population so far is heavily reliant on
traditional forms of energy: about 97% of total household energy needs are still met by traditional biomass
fuels such as wood and charcoal, only about 20% households have access to electricity and LPG
consumption is limited to better-off households in a few major cities. Also, the country ranks 10th from
bottom on the Human Development Index, about 80% of its population lives on less than $2 (PPP) a day
and per capita GDP is only about $1000 (PPP). At the same time, this situation is gradually changing for
the better. For example, over the last decade and a half Mozambique experienced rapid economic growth,
the urban population grew with about 50% since 2000, electricity access doubled over the last seven years
and car ownership more than doubled since 2000.
1
 Back in the 1850s Richard Thornton, a geologist on the Zambezi expedition under David Livingstone, was the first
to undertake geological research into Tete’s coal occurrence (Hatton and Fardell, 2012).
 2
Our analysis fits in the tradition of studies presenting country-specific energy outlooks (see, for
example, Aburas 1993, Bhattacharyya 2010, Kibune and Kudo 1996, Kim et al. 2001, McPherson and
Karney 2014, Pereira Jr. et al. 2008, Solomon and Krishna 2011, Yamashita and Ishida 2000, Zachariadis
2011, Zhou et al. 2013). The integrated Energy Outlook for Mozambique presented in this paper starts
from historical trends since 2000 and subsequently covers the anticipated surge in natural resources
exploration until 2030, exploring the potential impact of this surge on energy supply and demand, the
energy infrastructure and economic growth in Mozambique. Our scenario analysis is driven by newly
developed and locally collected energy statistics for the recent past as well as information about the latest
developments and future plans as regards the production and transformation of energy in Mozambique.
These data are supplemented with demographic and urbanization trends as well as cross-country based
GDP elasticities with respect to biomass consumption, sector structure and vehicle ownership. The
analysis makes use of LEAP, the Long range Energy Alternatives Planning System – an integrated
modeling tool that can be used to track energy consumption, production and resource extraction in all
sectors of an economy (Heaps, 2012). We model energy demand by households, transport and extractive
industries, as well as the sectors agriculture, manufacturing, services, government and other. Also we
specify electricity demand from neighboring countries in the region, given their essential role in
developing the Mozambican electricity market. As regards the supply side, we model electricity
production on a project by project basis, as well as gas exploration, coal mining, mineral (heavy) sands
mining and charcoal production.
 In doing so, we offer, in contrast to other studies, the first comprehensive Energy Outlook study
for Mozambique as an emerging leading energy producer. In an unpublished ministerial report, Mulder
(2007) presented a rudimentary first version of a long-term integrated energy scenario study for
Mozambique, based on data for the period 2000-2005. But most of the existing (consultancy) planning
studies for Mozambique typically consider one dimension or subsector of the energy system, like for
example the electricity sector (Ministry of Energy /Norconsult 2009, Norconsult, 2011). In their review of
the energy situation in Mozambique, Cuvilas et al. (2009) provide basic statistics for the period 2000-2006
as well as an assessment of future energy supply potential. Bucuane and Mulder (2009b) estimate the
potential resource wealth of Mozambique in comparison to other countries, with the aim to evaluate
whether the foreseen exploration of natural resources in Mozambique will pose a threat rather than a
blessing to its economic development. Sebitosi and Da Graça (2009) examine the potential of Tete
province to develop into a regional industrial hub for the Southern African region, given its natural
resource wealth in general and the presence of HCB in particular. Others have studied Mozambique for its
traditional biomass and biofuels markets (Arndt et al. 2010; 2011, Batidzirai et al. 2006, Brouwer and
Falcão 2004, Di Lucia 2010, Schut et al. 2010, Schut et al. 2014), electricity sector reform (Nhete 2007),
drivers and barriers to rural electrification (Ahlborg and Hammar 2014, Mulder and Tembe 2008) and the

 3
micro-economics of residential energy consumption (Arthur et al. 2010, 2012).
 The structure of the paper is as follows. In section 2 we provide information on the database
underlying our scenario analysis. Section 3 portraits major developments in the Mozambican energy
sector during the recent past, in order to put our Energy Outlook in context. In Section 4 and 5 we describe
our scenario methodology and modelling framework, respectively. Section 6 and 7 present the Energy
Outlook for Mozambique, respectively focusing on the energy supply and demand side. Section 8
concludes and discusses key policy implications.

2. Data
Our scenario analysis has its roots in (newly collected) historical data for the period 2000-2011,
supplemented with information about future plans as regards the production and transformation of energy
in Mozambique during the period 2012-2030 – our scenario timeframe. Most of the energy statistics for
Mozambique that we use in our analysis were collected and processed by the Directorate of Studies and
 2
Planning (DEP) of the Mozambican Ministry of Energy (ME, 2012). Underlying data have been
provided by a range of local institutions, including National Institute of Petroleum (INP), National
Company of Hydrocarbons (ENH), Mozambique Petroleum Company (PETROMOC), Cahora Bassa
Hydroelectric (HCB), Mozambique power utility (EdM), Mozambique Transmission Company
(MOTRACO), National Energy trust-Fund (FUNAE), South African multinational gas and Oil company
(SASOL), Matola Gas Company (MGC), Portuguese Petroleum and Gas Company (GALP), VidaGas,
National Institute of Statistics (INE), Mozambique Petroleum Import (IMOPETRO) and the Ministry of
Planning and Development (MPD). Historical data on consumption of traditional biomass have been
estimated on the basis of combined information from national survey data published by INE and
international data published by the IEA and FAO.
 Data on existing and future production of mineral resources (coal, natural gas and heavy sands)
were compiled on the basis of information gathered from the Ministry of Mineral Resources (MIREME),
KPMG International (2013), United States Geological Survey (Yager, 2012) and the US Energy
Information Administration (EIA/DOE). In addition we collected information from press releases by
private companies (in Bloomberg, Reuters, Mining Weekly, Mozambique Information Agency-AIM, and
other national press), as well as from personal communications with local experts. Information on future
electricity trade in the region is based on information published in the Integrated Resource Plan by the
South African government (SA Department of Energy, 2011) and interviews with local experts. Finally,

2
 This has been done within the EuropeAid /127640/SER/MZ project “Capacity Building in Energy Planning and
Management in Mozambique”. The authors of this article participated in this project.
 4
demographic and economic data on Mozambique were obtained from INE, the Ministry of Planning and
Development and the Mozambique Central Bank (BM) as well as from the World Bank, the International
Monetary Fund (IMF, 2013), the United Nations Department of Economic and Social Affairs (2011
Revision), and the African Development Bank (AfDB). All locally collected data, insofar possible, have
been checked against data from international sources, including British Petroleum (BP Statistical Report
2012), International Energy Agency (IEA 2013a, 2014), United Nations Populations statistics and the
World Development Indicators as published by the World Bank.

3. The Energy sector 2000-2011
In order to provide key insights into the context of our energy scenarios, we start this Energy Outlook with
a brief description of the evolution of the Mozambican energy sector during the recent past (2000-2011;
our pre-scenario period). We do so by presenting first, in Table 1 a short energy balance of the country.
 First and foremost, the data presented in Table 1 show an already sizeable expansion of the energy
sector, which is unprecedented in the history of the country. Since 2000, on average and by
approximation, energy production increased annually with 6%, imports with 10%, exports with 20% and
final consumption with 4%. Second, this expansion is largely driven by developments in the natural gas
and electricity markets (more on this below). Third, despite the emerging production and consumption of
modern energy forms, energy services from traditional biomass (fuelwood and charcoal) still dominate the
energy balance of Mozambique: in 2011 it accounted for 64% of energy production and 77% of final
energy consumption. As regards the latter, less than 5% of households in Mozambique are using a modern
form of energy for cooking at home, the remainder uses charcoal and wood fuel (INE, 2009; INE, 2010a).
In rural areas, where the majority of the population lives, 97% of households rely on daily wood fetching
for their energy needs. In urban areas charcoal has rapidly become the prevailing fuel of choice,
accounting for approximately 50 per cent of all energy consumption expenditures.
 The rise of the natural gas market in Mozambique started in 2004 with the mass exploitation of
the Pande/Temane onshore gas fields, accomplished through a consortium led by the South African
company SASOL. Most gas is exported to South Africa via a pipeline, signifying the largest inter-African
gas trading project. Mozambique is entitled to a royalty of 5% of the total exports, but so far natural gas
consumption in Mozambique has been lower than the potential royalty gas it can take.

 5
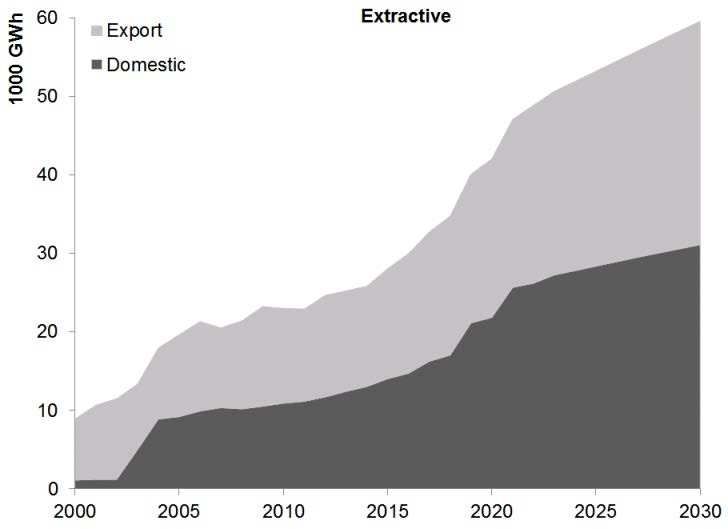
Table 1. Short energy balance of Mozambique
 Av. Ann.
 ktoe
 Growth
 2000 2011 2000–11
Production 7,252 12,786 5.8%
 Biomass 6,418 8,199 2.5%
 Electricity 834 1,417 5.5%
 Hydro 830 1,415 5.5%
 Other 4 2 -6.8%
 Coal 12 465 44.7%
 Natural gas 1 3,126 125.2%
 Petroleum products 0 44 131.4%
Import 657 1,684 9.9%
 Electricity 112 737 20.8%
 Petroleum products 546 947 5.7%
Export 670 4,009 19.6%
 Electricity 670 1,028 4.4%
 Natural gas 0 2,981 252.7%
Primary Energy Supply 7,240 10,460 3.7%
 Transformation (Gas to Electricity) 0.75 7.27 25.5%
 Transformation (Fuelwood to Charcoal) 1,472 1,705 1.5%
 Other* 183 498 10.5%
Final Consumption 5,584 8,250 4.0%
 Biomass 4,946 6,391 2.6%
 Electricity 176 902 17.8%
 Natural gas 0.18 81 84.2%
 Petroleum products 463 875 6.6%
* International bunkers, change in reserves, own use, transmission and distribution
losses, statistical differences. Sources: see section 2.

 The electricity market in Mozambique is principally characterized by its 2075MW hydropower
capacity, provided at the Cahorra Bassa dam (HCB) in the northwestern province of Tete. The country has
another 200MW or so of power generation capacity installed, in the form of 3 small hydro dams, some
natural gas turbines, and numerous diesel generators. HCB can generate more than enough for the entire
country and beyond. In 2011, the national electricity company EdM – which has a near monopoly on
electricity distribution in Mozambique – got 11 times more energy from HCB than it did on average
during the 1990s, when it was largely dependent on imports for its supply (46% over the 1990s). The latter
is due to fact that HCBs electricity production was interrupted during the protracted post-independence
civil war (1975-1990). After rehabilitation, HCB production regained its role by the end of the 1990s. In
the period 2006-2011, HCB exported 76% of its production to South Africa, against 86% in the five years
prior to 2006 – the rest being sold to EdM. Since 2000 Mozambique started re-importing electricity on a

 6
large scale from the South African power utility Eskom, in order to supply the newly constructed
aluminum smelter Mozal in the south of Mozambique (see below) – accomplished via a separate
distribution line managed by the company Motraco. It is considered that this is the same electricity sold by
HCB to Eskom that the latter then re-exports to Mozambique, thus providing a wheeling service. This
expensive solution is necessary in the absence of a domestic north-south transmission line to connect HCB
to Motraco’s system and EdM’s grid in southern Mozambique.
 In Table 2 we present a sectoral breakdown of domestic consumption of energy and electricity, in
relation to the sector structure of the Mozambican economy (in terms of GDP). In short, from the Table it
can be seen that the sector services accounts for about one-third of total GDP, followed by the sectors
agriculture and fishing (about 25%) and industry (15%), while the transport and government sector each
make up for about 10%. In terms of energy consumption, the picture is completely different: in 2011
households were responsible for about 60% of total energy consumption, followed by the transport sector
(30%) and industry (8%). Evidently, this dominance of the household sector illustrates the small size of
the Mozambican economy. Table 2 also shows that during the period 2000-2011 energy consumption
increased most rapidly in the Extractive Industry along with the Mozal aluminum smelter. By 2011 the
extractive industry in Mozambique was still relatively small, and mainly consisting of the previously
mentioned exploration of natural gas. However, in 2010 large-scale exploration of coal started in Tete
province, leading to the first shipment of mineral coal for export in September 2011. In addition, improved
infrastructure and economic development has led to a notable increase in energy consumption by the
transport sector.

Table 2. Sector composition of GDP, final energy consumption and electricity consumption.
 Final energy
 GDP Electricity consumption
 consumption

 % % Change % % Change % % Change

 2000 2011 2000–11 2000 2011 2000–11 2000 2011 2000–11
 Agriculture & Fishing 25.7 24.7 -4% 0.3 0.3 0% 0.0 0.0 --
 Extractive Industry 0.5 1.3 160% 0.0 0.3 -- 1.1 1.3 18%
 Other Industry & Construction 14.9 15.5 4% 2.8 8.6 207% 66.0 83.1 26%
 MOZAL aluminum smelter 1.2 4.0 233% 2.0 7.7 285% 48.4 76.0 57%
 Other Industry & Construction 13.7 11.5 -16% 0.8 0.8 0% 17.6 7.1 -60%
 Services 33.0 32.3 -2% 0.4 0.4 0% 9.0 3.8 -58%
 Transport 10.3 11.6 13% 6.4 31.2 388% 0.0 0.0 --
 Electricity and Water 4.5 4.8 7% 0.2 0.1 -50% 4.6 1.4 -70%
 Government 11.2 9.8 -13% 0.0 0.0 0% 1.0 0.4 -60%
 Households -- -- -- 89.9 59.1 -34% 18.3 9.9 -46%

 7
In terms of electricity consumption, the picture changes again. Most notably is the vast dominance
of the aluminum smelter Mozal, which in 2011 was responsible for about three quarters of total electricity
consumption in the country. Clearly, this fact is a key feature of (future) energy planning and energy
policy in Mozambique, as will be shown throughout the paper. In 2011, Other industry and services made
up for, respectively, about 7% and 4% of total electricity consumption, while about 10% is consumed by
households. Mozambique’s electricity consumption had grown steadily with GDP from 2001-2006, with
an average GDP elasticity of electricity consumption of nearly 1. However, since 2006, electricity
consumption has grown 1,6 times faster than GDP, denoting an electricity-intensification of the economy.
The strong growth came from all sectors. Reflecting the country’s unequal economic development, until
recently about two-third of the country’s demand for electricity is concentrated in the southern region.
 Although the share of the residential sector in total electricity consumption fell over time since
2000, total electricity consumption by households increased considerably under influence of increasing
(urban) welfare and (rural) electrification. In 2011, 107 out of 128 districts were connected to the main
grid, with coverage limited to the district headquarters in many rural districts. Since 2000, the
electrification rate grew on average with 15% per year, from 4% of households having electricity in 2000
to 18% in 2011. However, regional differences in access are considerable. In the Maputo area access to
electricity is over 60%, while in most other provinces access varies between 6% and 24%. Cross-regional
variation in access is nevertheless decreasing over time, due to intense efforts to electrify rural areas. In
2011 more than 163.000 households were connected to the main grid, which is a six-fold increase from
2000. Over the same period the number of clients of the national electricity company EdM grew with
400%. Total electricity per capita almost tripled between 2000 and 2011; when we exclude electricity
consumption by Mozal, this figure reduces to a still impressive growth of about 80%. Consumption per
EdM-client decreased over time because the electrification efforts implies increasingly connecting
relatively poor people in peri-urban and rural areas, people who consume relatively small quantities.

 8
4. Scenarios

We chose to develop in this paper a limited number of scenarios that are intentionally fairly simple and
straightforward. Our main goal is to highlight major trends in the transformation of the emerging
Mozambican energy sector, including the expected consequences for both domestic and international
energy markets. The development of richer scenarios, including more detail and variation in terms of
energy policies, structure of energy demand, energy supply mix options and regional differences, is
deliberately left for future work.
 Energy outlooks usually give three basic scenarios – medium, high and low – that are often
largely defined by GDP and population growth expectations. We follow this approach, but add a fourth
scenario that assumes exploitation of Mozambique’s natural resources exploration to its fullest potential.
We label our three basic scenarios as Reference, Reference High and Reference Low; the fourth scenario
is labelled Extractive. Reference is the most likely development path. It is to be noted that this is not a
‘business as usual’ scenario, but is based on baseline projections plus activities of new extractive industry
and electricity generation projects that are (almost) sure to be realized, taking into account realistic and
somewhat conservative estimates about the output price development in the extractive and aluminum
industry. Furthermore, it adopts a medium variant of population growth scenarios, a modest decline in
household size, a moderate speed of urbanization and somewhat conservative estimates as regards the
development of energy intensity improvements across sectors. Reference High and Reference Low then
refer, respectively, to the optimistic and pessimistic variant of Reference – thus assuming higher (lower)
baseline economic growth, lower (higher) population growth, higher (lower) speed of urbanization, faster
(slower) decline of household size and energy intensities across sectors and higher (lower) output price
developments in the extractive and aluminum industry. Finally, our Extractive scenario describes the
expected evolution of the Mozambican energy system if all potential projects of extractive and aluminum
industries as well as power generation are realized, including those projects that are yet (very) uncertain.
Because of this focus, we assume in this scenario all other leading dimensions of the model to be equal to
the Reference or Reference High scenario. We refer to Table 3 for a brief summary and overview or
scenarios.

 9
Table 3. Scenarios

Scenario Variant Description Annual New projects Output price Population Household Speed of Energy
 growth extractive extractive growth size urbanization intensity
 Baseline industry and and improvement
 GDP* power sector aluminum s
 industry
 The most likely Gradual Including Realistic and Medium Linear Medium Realistic and
 development decrease to those that are somewhat growth extrapolation scenario somewhat
 Medium path. 4.7% in (almost) sure conservative scenario of decreasing conservative
 2030. to be realized estimates trend estimates

 The pessimistic Gradual Same as Low High growth Trend 50% Trend 50% Same as
 variant of decrease to Reference- estimates scenario slower than slower than Reference-
Reference Low Reference- 3.8% in medium Reference- Reference- medium
 medium. 2030. medium medium

 The optimistic Gradual Same as High Low growth Trend 50% Trend 50% Same as
 variant of decrease to Reference- estimates scenario faster than faster than Reference-
 High Reference- 5.9% in medium Reference- Reference- medium
 medium. 2030. medium medium

 The extractive Same as Including all Same as Same as Same as Same as Same as
 industry driven Reference- planned Reference- Reference- Reference- Reference- Reference-
 development high. projects, high. high. high. high. medium.
Extractive path. including
 those that are
 uncertain

 *
* Baseline GDP means all sectors excluding extractive industry

 10
5. Scenario model The scenario model that we developed for this Energy Outlook makes use of the LEAP framework, a medium to long-term modeling tool, designed around the concept of long-range scenario analysis. 3 The model includes a historical period (2000-2010), in which the model is run to test its ability to replicate known statistical data. Subsequently, the model generates multiple forward looking scenarios for the period 2011–2030. The choice for 2011 as first scenario year is driven by data availability, but also marks the beginning of large scale natural resource exploration in Mozambique. Data, bottom-up project information, key assumptions Extractive industry Power plants Electrification Scenarios South Africa • Production • Capacity • # new connections • Electricity demand • Prices • Efficiency MOZLEAP model Resources Stock changes Transformation Demand by end-use sectors Current Accounts (2000-2010) Scenarios (2011-2030) Energy intensity builder • Exogenous, as function of time; • Endogenous, as function of GDP, urbanization GDP builder Population projections Biomass model Transport model • GDP total • Population size • Biomass consumption • # Vehicles • Sector structure • Household size • Fuelwood-Charcoal • % Urbanization substitution Modelling, data, key assumptions Figure 1. Structure of the modelling framework 3 For more information see www.energycommunity.org 11
Figure 1 summarizes the structure of our modelling framework. On the supply side, we model
electricity production, gas exploration, coal mining and mineral (heavy) sands mining on a project by
project basis, using information that we collected about the latest developments and future plans as
regards the production and transformation of energy in Mozambique. In addition we develop and integrate
into the LEAP framework a simple biomass model to calculate future paths of charcoal production and
biomass consumption in Mozambique. On the demand side we adopt a mix of these methodologies to
model energy demand by households, transport and extractive industries, as well as the sectors agriculture,
manufacturing, services, government and other. Also we specify electricity demand from neighboring
countries in the region (especially South Africa), given their essential role in developing the Mozambican
electricity market. As regards the demand side, the LEAP accounting framework in essence calculates
(future) energy demand as the product of activity levels (such as GDP, population, physical production
levels) and energy intensity per unit of activity. Energy demand modeling is based on a combination of
historical energy and activity level data, information on demographic and urbanization trends supplied by
external sources, locally collected bottom-up information as regards future electricity distribution and
cross-country econometric modeling of various GDP elasticities.
 In Mahumane and Mulder (2015) we provide an elaborated description of the scenario model,
which we have given the name MOZLEAP. For this reason and because of space constraints, here we
limit ourselves to a relatively brief account of our modelling approach and its results. Also we refer to the
Annexes for more detail on the structure of the model, including its sector sector (Table A.1, Annex B)
and the mathematical structure of the sub-models on GDP, biomass and transport fuel consumption
(Annex A).

5.1 GDP
To model future development paths of GDP we developed a so-called GDP builder that is embedded in
LEAP’s overall accounting framework. We construct future GDP paths by combining a top-down and
bottom-up approach, as follows. We start with historical data from existing sources (Mozambique Central
Bank, National Statistics Institute, IMF, Worldbank) on Mozambique’s total GDP and its sector structure
for the period 2000–2010. From these data series we derive historical GDP growth rates, excluding the
extractive industry – which was very small until 2010 (around 1% of total GDP; see Table 2). We call this
baseline GDP growth. Subsequently, adopting a simple top-down approach, for the period 2011–2030 we
assume that baseline GDP growth Y follows a declining trend as function of time t, according to a logistic
curve, such that annual GDP growth gradually evolves towards 3.8% – 5.9% by 2030, depending on the
scenario (for details see Table 4, the formulas in Annex A and Table A.2 in Annex B).
 Next, using a bottom-up approach, we construct GDP separately for each extractive industry,
including the aluminum industry, as follows. First, based on the information in our dataset, we specify per
 12
existing and planned extractive industry project the expected future production in physical units. We
include in our model electricity production, gas exploration, coal mining and mineral (heavy) sands
mining. Second, we calculate for each project the GDP value per physical unit of production. To do so, we
start with historical data until 2012, which we subsequently extrapolate, assuming a simple but scenario-
specific trend based on expected international market prices of the primary resources involved (LNG,
heavy sands minerals, coal, aluminum). 4 Third, we estimate future GDP of the extractive industry by
combining these price trends with expected physical production patterns per project, and subsequently
aggregating over all projects. Together with the baseline GDP this sums up to total GDP, including an
implied total GDP growth rate. Finally, we construct a sectoral breakdown of aggregate GDP by assuming
that the respective sector shares of four main sectors (agriculture, services, manufacturing and
government) evolve over time as a function of per capita GDP. The results of our GDP calculations are
summarized in Table 4.

Table 4. Evolution of GDP across scenarios
Scenarios GDP GDP per capita (US$) GDP growth rate* (%)
 2010 2015 2020 2025 2030 2010 2015 2020 2025 2030

Extractive Baseline 403 504 623 749 868 7,2 6,9 6,5 5,7 4,7
 Extractive 4 153 328 481 528 5,5 20,0 14,5 3,0 2,3
 Total 407 657 951 1.230 1.396 7,2 9,9 9,0 4,7 3,9

Reference Baseline 403 504 623 749 868 7,2 6,9 6,5 5,7 4,7
 Extractive 4 114 205 186 170 5,5 27,0 6,4 0,3 0,3
 Total 407 618 828 935 1.039 7,2 10,6 6,4 4,6 4,0

Reference High Baseline 403 509 646 814 1.009 7,2 7,1 6,8 6,4 5,9
 Extractive 4 114 223 228 235 5,5 27,0 8,6 2,3 2,3
 Total 407 623 869 1.042 1.244 7,2 10,7 7,3 5,5 5,2

Reference Low Baseline 403 500 600 690 754 7,2 6,8 6,1 5,0 3,8
 Extractive 4 113 188 151 123 5,5 27,0 4,2 -1,7 -1,7
 Total 407 613 788 841 877 7,2 10,5 5,6 3,8 3,0

*Average annual growth rate, 3-year moving average.

4
 These prices are partly based on expert judgments for the upcoming years, published in a variety of resources (IEA
2013b, KPMG 2013), while for the remaining years price trends are assumed to follow a straightforward but
scenario-specific pattern, with annual price fluctuations varying between –2% and 4%. Given the expected large
relative size of the extractive industry in the future economy of Mozambique, future price trends for primary
resources are deliberately designed to be conservative, in order to avoid an upward bias in future GDP development
paths. See Table A.2. for further details.

 13
When we look at the last decade and a half, the data clearly illustrate that Mozambique is
extremely poor but at the same time experienced rapid economic growth. In 2010 per capita GDP was just
over $400, in 2015 this is expected to be over $600 (which equals to about $1300 in PPP terms). These
levels roughly correspond with, respectively, 9% and 2% of the per capita GDP level in South Africa and
the USA and imply that still about half of the Mozambican population lives below the local absolute
poverty line (Boom 2011). Yet, the rapid increase in per capita GDP implies that the average annual
growth rate of GDP is well over 7% during the period 2000-2015. In addition, Table 4 shows that our
modelling of Baseline GDP leads to a gradual increase of Baseline GDP per capita to levels of $750–
$1000 by 2030, depending on the scenario. Furthermore, from Table 4 it can be seen that Extractive GDP
per capita is expected to increase dramatically over time, from almost zero in 2000 to $123–$235 by 2030
in the Reference scenarios and $528 in the Extractive scenario. Our assumptions as regards the expansion
of production levels in the extractive industry imply that Extractive GDP growth is expected to peak in
this decade, and will smooth after 2020. Together these developments cause total per capita GDP to be in
the range of $900–1400 by 2030, which equals a 115–243% increase from 2010 levels.

5.2 Population
Size and growth of the population is a key element of our scenario model, because it helps define critical
indicators such as per capita GDP, the electrification rate, total residential energy consumption, and fuel
consumption by passenger cars. In addition, these indicators are influenced by the composition of the
population in terms of the urban-rural divide and whether or not households have access to electricity. In
our model, data on historical and future developments of population size and urbanization levels are based
on information supplied by Mozambique’s National Statistics Institute (INE), cross-checked with the
United Nations (UN) population statistics.
As regards population growth, all our scenarios for the period 2011–2030 take as their starting point
historic data for the year 2010. In 2010 Mozambique's population was some 22.4 million in total, of which
almost 31% lived in urban areas; average household size was 4.3, average annual population growth was
2.5%, with urban population growing 3.2% per year. Subsequently, all scenarios assume population
growth to gradually decrease over time; we refer to Table A.2 for a summary of our key demographic
assumptions across the various scenarios. As a result, by 2030 total population size is expected to be 32.7–
37.1 million people, with 34.8 million people in the Reference Medium scenario (see Table 5). Growth of
urban population is expected to increase to 3.5% per year in 2030 in the Medium scenario; in the Low and
High scenarios we assume this percentage to be 50% lower and higher, respectively. As a result, by 2030
the percentage of urban population is expected to be 30.8 – 49.4, with 39.1% of urban people in the

 14
Medium scenario (see Table 5). This implies that in the Medium scenario the number of people living in
cities in Mozambique by 2030 is as large as 60% of the entire population in 2010, which obviously will
reshape the urban landscape in Mozambique over the next 25 years, and, hence, transform (residential)
energy demand. Finally, in all scenarios we assume the average household size to gradually decrease
under influence of income growth and urbanization, from 4.3 persons in 2010 to 4.13 – 4.25 persons in
2030.

Table 5. Population, urbanization and electrification

 Scenarios Element Unit 2010 2015 2020 2025 2030

 Extractive Population Million 22,4 25,1 27,6 30,1 32,7
 Urbanization % 30,9 34,1 39,8 47,2 56,1
 Electrification % 15,3 25,4 32,6 37,6 40,9

 Reference Population Million 22,4 25,2 28,2 31,4 34,8
 Urbanization % 30,9 32,3 34,2 36,5 39,1
 Electrification % 15,3 25,3 32,1 36,4 38,9

 Reference High Population Million 22,4 25,1 27,6 30,1 32,7
 Urbanization % 30,9 34,1 39,8 47,2 56,1
 Electrification % 15,3 25,7 33,7 39,9 44,7

 Reference Low Population Million 22,4 25,4 28,9 32,9 37,1
 Urbanization % 30,9 30,6 29,2 28,1 27,1
 Electrification % 15,3 25,0 30,5 33,1 33,6

 The extent to which the Mozambican population has access to electricity is expected to change
rapidly as a result of intensive (rural) electrification programs and growing income levels. In our model
the electrification rate is endogenously determined by combining information on electricity network
expansion (number of new connections realized) with population growth dynamics as described above. In
2010 the national utility EdM realized 100.000 new connections. In our Reference scenario we expect this
number to increase to 135.000 in 2015, and subsequently decrease to 100.000 in 2030. In our Reference
Low and High scenarios, we assume that in 2030 respectively 70.000 and 130.000 new connections will
be realized (see Table A.2). Given population growth, this implies that in our model the (household)
electrification rate is expected to increase from 15% in 2010 to 34% – 45% in 2030, with 39% in the
Reference scenario (see Table 5). We assume transmission and distribution losses to remain at 5% as from
2011.

 15
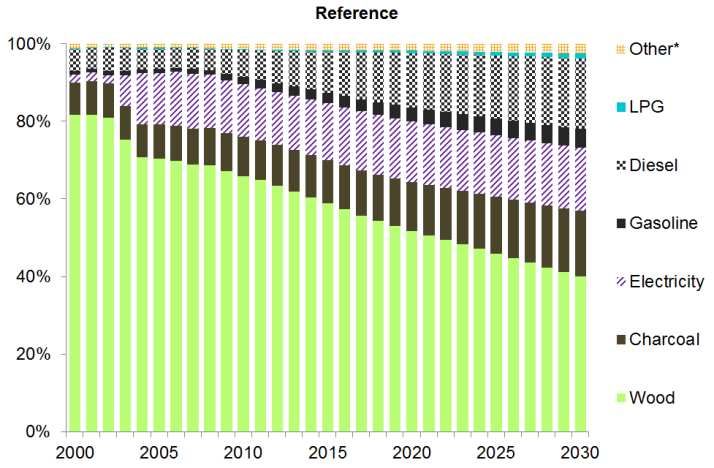
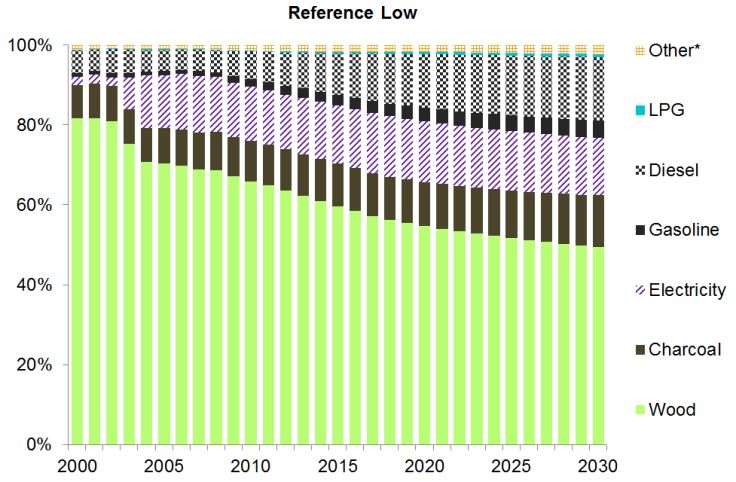
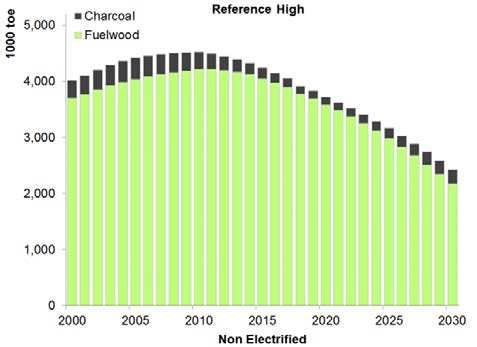
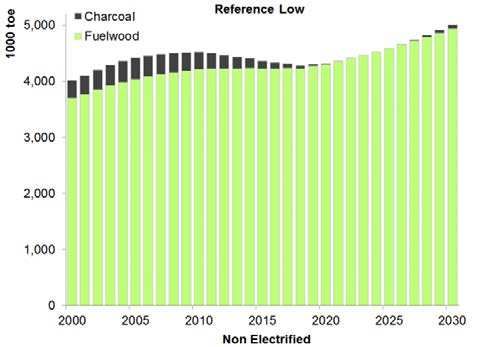
5.3 Biomass

We model future demand for fuelwood and charcoal by means of a simple biomass model, embedded
within LEAP’s overall accounting framework. Following micro-based evidence of household energy
consumption patterns in developing countries (Barnes and Floor 1999, Barnes et al. 2005), we adopt a
nested model structure. First, we assume that total biomass consumption is merely determined by GDP per
capita, thus considering substitution with modern energy forms (such as LPG and electricity) as function
of relative prices a second-order effect (Leach 1992). Second, we assume that the choice for one of the
two dominant forms of biomass (fuelwood and charcoal) is implicitly driven by their relative prices as
well as the urbanization rate. More specifically, we first define the evolution of per capita biomass
consumption over time according to a logarithmic S-shaped curve that is driven by an initial consumption
level, a constant (vertical shift of the curve) and the elasticity of biomass consumption with respect to
GDP per capita. Next, we calculate the evolution of the share of charcoal in total biomass consumption as
function of the inter-fuel substitution elasticity (i.e. between charcoal and fuelwood) and the annual
growth rate urbanization. The fuelwood share is calculated as the remainder.
 To allocate charcoal and fuelwood consumption across electrified and non-electrified households,
we implemented the following assumptions. First, we assume that in 2000 all electrified households lived
in urban areas, and that in 2011 the urban and rural electrification rates were, respectively 55% and 5%
(IEA 2013). Second, we assume that 5% of total fuelwood consumption and 85% of total charcoal
consumption is consumed by urban households with the remainder being consumed by rural households
(Atanassov, et. al., 2012; Brouwer and Falcão, 2004; INE, 2009). Third, we assume that fuelwood and
charcoal is consumed by, respectively, 33% and 80% of households in urban areas, while 10% of
households in rural areas consume charcoal. 5 Finally, building on these assumptions we model future
evolution of biomass consumption per electrified household as a function of changes in the total biomass
consumption as well as the change in urbanization rate U relative to the change in the electrification rate
E. Biomass intensity per non-electrified household is subsequently derived from total biomass
consumption not consumed by electrified households. As a result, total biomass consumption in our model
declines with increasing GDP, following an inverted S-shaped pattern. As regards its composition, with
rising GDP per capita consumption of charcoal increases at the expense of fuelwood consumption, under
influence of rising income and urbanization – up to some income threshold level, after which is substituted
for modern energy forms such as LPG and electricity. For further details we refer to Annex A.

5
 Note that rural electrification has a minor impact on switching of cooking fuel while the opposite is true for
urbanization, which is a major driving force for the choice of cooking fuel.
 16
5.4 (Bio-)fuels

We model fuel demand for road transport as function of expected evolution of vehicle ownership over
time, given per capita GDP and population trends as described before. To this aim we developed a logistic
function that is embedded within LEAP’s accounting framework. Following evidence from the top-down
transport modeling literature in developing countries (Button et al. 1993, Medlock and Soligo 2002) we
assume the number of vehicles per 1000 people to be merely determined by GDP per capita, thus
considering (relative) fuel prices a second-order effect. Next we calibrate our model by combining this
approach with data on the annual evolution of registered vehicles in Mozambique and fuel consumption in
the recent past, supplied by, respectively, the Mozambican National Institute of Road Transport
(INATTER, 2012) and the Ministry of Energy (ME, 2012). For further details we refer to Annex A.
 Mozambique has a large potential for biofuel production, given its climate and a vast amount of
unused arable land. At this moment, biofuel production plays only a marginal role in the energy mix.
However, the country has adopted a National Program for the Development of Biofuels to promote and
use agro-energy resources for energy and food security. In doing so, the government also aims to
encourage socioeconomic development and to reduce the country's dependence on fuel imports (IRENA,
2012; Ecoenergy, 2008). The program aims to progressively increase the proportion of biofuel in
Mozambique’s domestic liquid fuel mix in three phases. The pilot phase (2012-2015) is currently being
implemented with a fuel blending mandate of 10% for bioethanol and 3% for biodiesel. An operational
phase (2016 to 2020) will follow, with 15% bioethanol and 7.5% biodiesel blending and conclude with an
expansion phase (2021-onwards) of 20% bioethanol and 10% biodiesel blending. In our scenarios, we
include these phases, but taking into account a 5-year delay to reflect the actual situation.

5.5 South Africa
South Africa’s power utility (Eskom) has identified Mozambique as a potentially important supplier of
electricity in its Integrated Resource Plan 2011 (SA Department of Energy, 2011) to help addressing its
future supply-side challenges. Eskom is particularly interested in new hydropower from Mozambique, as
the existing electricity generation mix in South Africa is carbon-intensive. Already, HCB represents 40%
of Eskom’s carbon-free generation. One of the scenarios in the IRP is to use 2600 MW of power from
Mozambique, including 2135 MW from the new hydro projects. Electricity purchases from Natural Gas
plants at the Mozambique-RSA border is not looked at in the IRP. As of date, South Africa gets 92 MW
from Gigawatt plant in Ressano-Garcia, and could get an additional 150 MW from Sasol’s plant in the
same area. According to the IRP, South Africa needs an additional 90 GW of generating capacity by 2030,
mostly from renewables. Therefore in our Extractive Scenario, we have modeled 3320 MW of capacity
dedicated to Eskom, of which 1900 to 2100 MW would have to be firm.

 17
5.6 Energy Intensity
We assume that in various sectors of our model the evolution of energy intensity is a function of GDP
growth, reflecting the notion of increasing energy efficiency under economic development (Lescaroux
2011). For the period 2000-2010 energy intensity values are calculated based on historical data regarding
energy consumption and activity levels on a sector by sector basis. Subsequently, future energy intensity
values for the period 2011-2030 are calculated on the basis of a variety of simple assumptions, again on a
sector by sector basis. 6 We refer to Table A.3 in the Annex B for a detailed summary of our assumptions
as regards future energy intensity trends across the various end-use sectors.
 In short, we assume that in a poor country like Mozambique electricity consumption per
household increases over time under influence of rising GDP, because growing household income leads to
increasing demand for electric appliances such as refrigerators and air conditioning. Also, we assume that
LPG consumption per household increases over time under influence of rising GDP as well as the degree
of urbanization, because growing household income leads to a shift towards modern cooking fuels, while
in developing countries LPG is a typical urban fuel for logistic reasons. Furthermore, we assume that
kerosene consumption per household decreases over time, because of a gradual ‘autonomous’ substitution
towards more efficient and cleaner fuels like electricity and LPG. Finally, future charcoal and fuelwood
intensities are derived from our biomass model.
 For the Agriculture sector we assume that energy intensity increases with about 20% over the
course of 20 years, under influence of modernization and mechanization. In the Manufacturing sector, we
assume that Mozal’s production process does not change over time; future energy intensity values and fuel
shares are therefore constant and based on historical data. In the Other Industry sector we assume that
energy intensity increases at a decreasing pace, driven by the opposing forces of modernization and
increasing energy efficiency. In the sector Commercial Services. Government and Other we assume that
electricity intensity increases with economic growth, In Services we assume that LPG consumption (in
hotels and restaurants) depends positively on the degree of urbanization.
 Energy intensity in the extractive industry is determined by constant values of electricity and
diesel consumption per physical unit of production. Actual values originate from a combination of
indicative figures on open-cut coal mining and mineral sands explorations reported in the literature
(Bleiwas 2011; SEE 2009) and from personal communications with local experts involved in mining
activities in Mozambique. Finally, fuel efficiency in road transport is assumed to gradually increase over
time under influence of economic development, whereas fuel intensity for tractors is assumed to increase
because of the expected increasing use of heavy equipment as economic development proceeds.

6
 Given Mozambique’s current status as an extremely poor country with a rapidly expanding energy sector, we
decided to leave a careful analysis of energy efficiency improvements in end-use sectors for future research.
 18
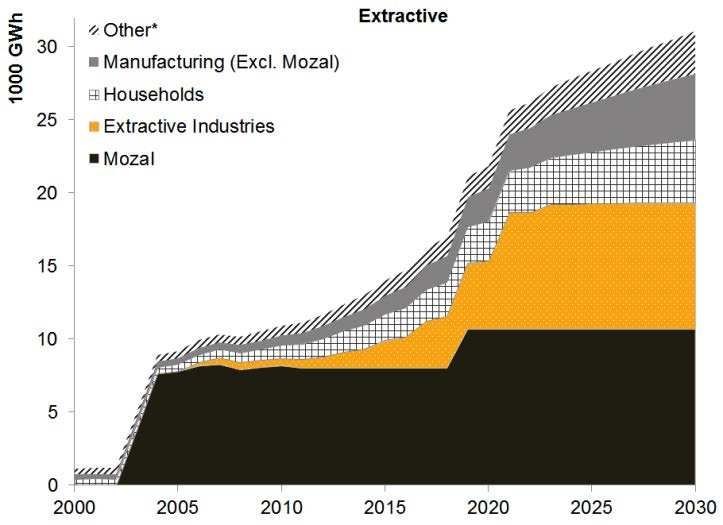
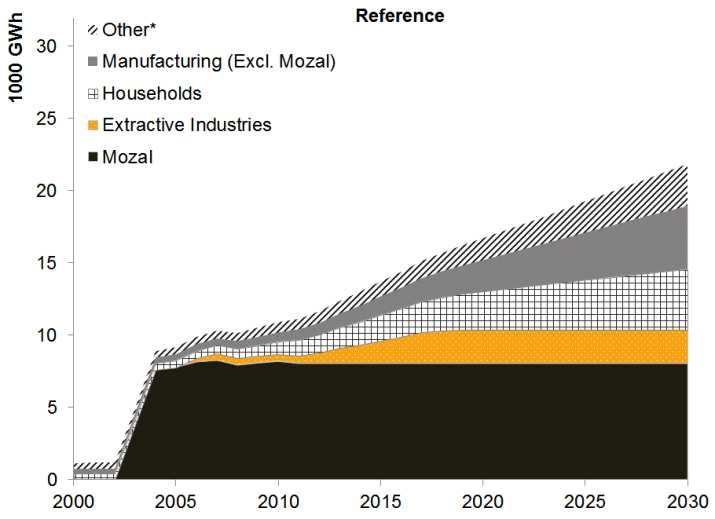
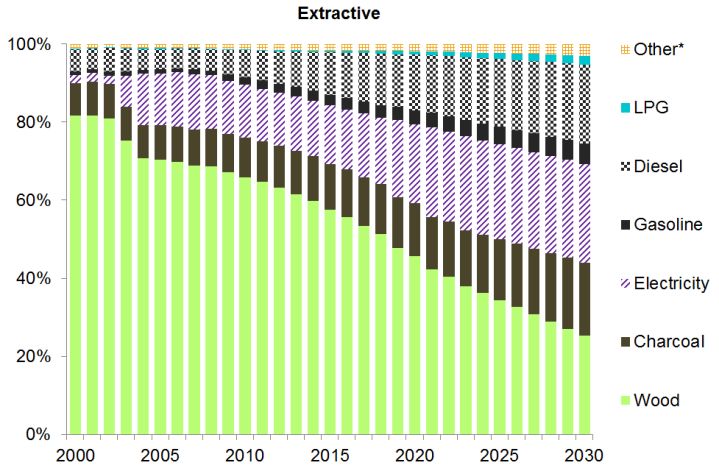
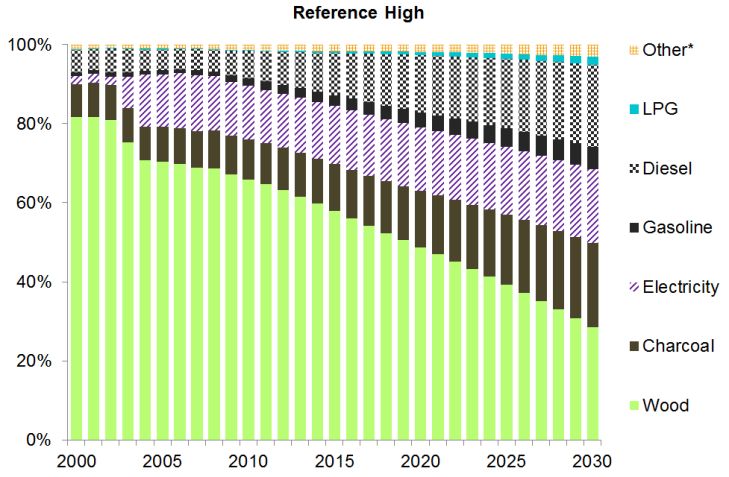
6. Outlook energy supply
In this section we present an outlook for energy production in Mozambique, according to the scenario
methodology described in the previous sections. As illustrated in Figure 2, we expect in the reference
scenario that total primary production increases from almost 14 million toe in 2011 to over 90 million toe
in 2030. If Mozambique were to follow the extractive scenario development path, primary production
could even increase to a level of 180 million toe in 2030. This equals a 6 to 13-fold increase in primary
energy production in less than 20 years. As can be seen from the upper part of Figure 2, natural gas and
coal together will make up for 80-90% of these production levels. In contrast, at the turn of the century 80-
90% of total energy production in Mozambique consisted of wood, with hydro largely making up for the
remaining 10-20%. 7 Nevertheless, according to our scenarios total energy production from wood and
hydro are expected to increase 60-90% over the next 15 years; yet the emergence of natural gas and coal
are causing their relative shares in total energy production to decrease to about 3% (hydro) and 10% in
2030. Clearly, together this means that Mozambique will undergo no less than a revolution at the supply
side of its energy sector.
 The lower part of Figure 2 shows that 80-90% of total energy production in Mozambique is
expected to be destined for export. This is especially true for the natural gas and coal production, but to a
lesser extent also for hydro, which continues to be exported to South Africa and other neighboring
countries in the form of electricity (more on this below). The natural destination for coal is India, but
Brazil is also expected to be a market for Mozambique’s coal export (IEA 2014). Of course, energy
production from wood and solar almost exclusively serves the domestic market. We refer to Table 6 for a
more detailed overview of the destination of primary energy production per energy source, including its
(end-use) form.

7
 We exclude Solar and Diesel from Figures 2 and 3 because their values are too small to visualize.
 19
Figure 2. Total primary energy production by source (top) and destination (bottom).

 20
Table 6a. Destination of primary energy production by energy type (1000 TOE) – Reference scenario

Energy type Destination Energy form Use Reference scenario % change
 2010 2015 2020 2025 2030 2015-30
Natural Gas Domestic use Primary End use 69,8 116,0 148,3 209,0 286,2 147%
 Secondary Electricity Generation 0,9 196,8 243,4 200,1 220,9 12%
 Export Primary End use 2.967,1 4.376,0 29.980,2 30.203,5 30.438,1 596%
 Secondary Electricity 3,2 536,7 642,8 686,1 665,3 24%

Coal Domestic use Secondary Electricity Generation 0,0 0,0 205,0 168,5 186,0 --
 Export Primary End use 25,6 17.919,8 31.918,9 39.675,4 44.265,2 147%
 Secondary Electricity 0,0 0,0 676,9 713,3 695,8 --

Wood Domestic use Primary End use 4.563,3 4.767,2 4.782,6 4.798,1 4.649,8 -2%
 Secondary Charcoal making 3.470,7 4.529,8 5.810,6 7.611,4 9.865,1 118%

Hydro Domestic use Secondary Electricity Generation 937,7 978,8 985,1 1.281,9 1.460,9 49%
 Export Secondary Electricity 494,9 537,6 539,3 1.130,8 1.030,3 92%

Solar Domestic use Secondary Electricity Generation 0,4 1,0 2,1 3,5 7,7 639%
 Export Secondary Electricity 0,2 0,6 1,1 3,1 5,4 849%

 21
Table 6b. Destination of primary energy production by energy type (1000 TOE) – Extractive scenario

Energy type Destination Energy form Use Extractive scenario % change
 2010 2015 2020 2025 2030 2015-30
Natural Gas Domestic use Primary End use 70,7 311,5 535,6 634,6 699,8 125%
 Secondary Electricity Generation 69,8 116,1 158,5 221,3 302,2 160%
 Export Primary End use 2.967,1 4.376,0 42.782,4 81.412,0 81.646,6 1766%
 Secondary Electricity 3,2 531,2 1.136,3 1.286,3 1.302,0 145%

Coal Domestic use Secondary Electricity Generation 0,0 0,0 464,9 670,5 645,1 --
 Export Primary End use 25,6 23.700,4 54.956,4 71.742,3 78.213,0 230%
 Secondary Electricity 0,0 0,0 1.706,9 2.528,3 2.553,6 --

Wood Domestic use Primary End use 4.563,3 4.640,1 4.254,9 3.461,2 2.679,0 -42%
 Secondary Charcoal making 3.470,7 4.698,8 6.255,5 7.805,1 9.967,0 112%

Hydro Domestic use Secondary Electricity Generation 937,7 1.005,4 1.029,6 1.347,6 1.619,3 61%
 Export Secondary Electricity 494,9 549,0 683,3 937,1 1.234,0 125%

Solar Domestic use Secondary Electricity Generation 0,4 1,0 1,9 3,8 7,4 621%
 Export Secondary Electricity 0,2 0,6 1,3 2,7 5,7 906%

 22
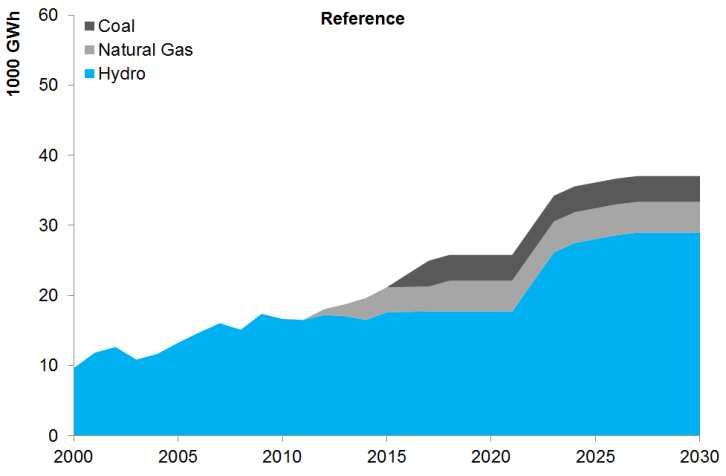
As a consequence of the current energy revolution, Mozambique is rapidly developing into an important
player at international energy markets, especially when it comes to natural gas and coal. To assess this
trend we compare in Table 7 the expected production and export levels of natural gas and coal by
Mozambique in 2030 (according to our scenarios) with the equivalent production and export levels by the
current (2013) global Top-10 countries. From this Table it can be seen that Mozambique is expected to
develop into, respectively, a global Top-20 producer and Top-10 exporter of Natural Gas and Coal. The
emergence of Mozambique as a major exporter of these fossil fuels is of course due to the combination of
sizeable future production and a relatively small domestic economy, as a result of which its primary
energy production will be largely exported.

Table 7. Mozambique 2030 compared to the current (2013) top-10 countries for production and export of natural
gas and coal.
 Natural Gas
 Production Exports
 1 US 627,2 1 Russian Federation 250,6
 2 Russian Federation 544,3 2 Qatar 138,4
 3 Iran 149,9 3 Norway 118,0
 4 Qatar 142,7 4 Canada 87,6
 5 Canada 139,3 5 Mozambique 2030, Extractive 81,6
 6 China 105,3 6 Netherlands 59,3
 7 Norway 97,9 7 US 49,5
 8 Saudi Arabia 92,7 8 Algeria 47,7
 9 Mozambique 2030, Extractive 84,0 9 Indonesia 34,8
 10 Algeria 70,7 10 Mozambique 2030, Reference 30,4

 26 Mozambique 2030, Reference 31,6

 Coal
 Production Export
 1 China 1840,0 1 Indonesia 247,1
 2 US 500,5 2 Australia 194,3
 3 Australia 269,1 3 Russia 78,7
 4 Indonesia 258,9 4 United States 78,4
 5 India 228,8 5 Mozambique 2030, Extractive 78,2
 6 Russian Federation 165,1 6 Colombia 56,8
 7 South Africa 144,7 7 South Africa 52,2
 8 Mozambique 2030, Extractive 81,4 8 Mozambique 2030, Reference 44,2
 9 Kazakhstan 58,4 9 Canada 22,0
 10 Poland 57,6 10 Kazakhstan 14,8

 13 Mozambique 2030, Reference 45,1
 Million tonnes oil equivalent. Source: BP

 In addition, Mozambique is expected to strengthen its position as an important player in the
regional market for electricity. Based on our information and assumptions as regards future electricity
generation projects, we present in Figure 3 the expected future development paths of electricity production

 23
per energy source. From Figure 3 it can be seen that total electricity production is at least expected to
more than double from about 16 GWh in 2011 to 37 GWh in 2030 (Reference scenario), while it could
also triple to about 54 GWh in 2030 if Mozambique were to follow the extractive scenario in this respect.
Figure 3 also illustrates that hydro remains the main source of electricity production, thanks to the existing
Cahora Bassa Hydroelectric (HCB) dam in combination with planned future construction of other major
hydro projects, including HCB-North and Mphanda Nkuwa. However, the share of hydro in total
electricity generation mix is expected to decrease as a result of the expected construction of thermal power
plants fueled by natural gas and coal. Because of HCB’s dominance, until recently hydro was responsible
for virtually 100% of electricity production in Mozambique, whereas by 2030 natural gas and coal
together are expected to account for about 20-40% of total electricity production, depending on the
scenario.

Figure 3. Electricity generation by source

 As noted before, our electricity supply projections are primarily based on information and
assumptions as regards future electricity generation projects. Total capacity is anticipated to meet the
combined effect of increased power demand from South Africa, a range of coal and heavy sands mining
projects, and other domestic demand. Figure 4 illustrates that existing and future electricity generation
projects would produce more than enough to supply domestic electricity demand under various scenarios
of demand growth (see next section). More precisely, from the Figure it can be seen that only about half of
expected total electricity generation capacity is needed to meet domestic electricity demand, while the
other half thus serves electricity demand from neighboring countries, especially South Africa.
Consequently, realization of future electricity generation projects heavily depends on the willingness of
the South African power utility ESKOM to reach long term agreements with Mozambique to meet its own

 24
future demand. Hence, demand from South Africa will continue be the main driver for electricity capacity
addition in the future.

 Figure 4. Electricity production capacity by destination.

 25
7. Outlook energy demand
In this section we conclude our analysis by presenting an outlook for energy demand in Mozambique. We
do so by first presenting in Figure 5 for each of the four scenarios the evolution of total final energy
consumption per sector until 2030. From the Figure it can be seen that in the Reference scenario total
energy demand is expected to increase to 11.6 thousand toe in 2030. This is a 60% increase from the 2011
level of energy demand, and equivalent to an average annual increase of 2.6% as from 2011. If
Mozambique were to follow the Reference Low development path, total final energy consumption is
expected to reach 12.3 thousand toe in 2030, which equals an average annual increase of energy demand
of 2.9% as from 2011. In contrast, the lowest level of energy consumption is to be expected if
Mozambique were to follow the Extractive Scenario development path – with an estimated total final
energy demand of 10.6 thousand toe in 2030, implying a 2.1% average annual increase over the period
2011-2030. The evolution of total final energy demand in the Reference High scenario is very similar to
the Extractive scenario, notwithstanding differences in its composition.

Figure 5. Total final energy consumption by sector.

 26
You can also read