BIM to BEM Development of integrated workflow from Archicad to Energy Evaluation - Mariami Tkeshelashvili - Lund University Publications
←
→
Page content transcription
If your browser does not render page correctly, please read the page content below
BIM to BEM
Development of integrated workflow from Archicad to
Energy Evaluation
Mariami Tkeshelashvili

Master thesis in Energy-efficient and Environmental Buildings
Faculty of Engineering | Lund University
BIM to BEM: Development of an integral workflow from Archicad to Energy Evaluation

Lund University
Lund University, with eight faculties and a number of research centres and specialized
institutes, is the largest establishment for research and higher education in Scandinavia. The
main part of the University is situated in the small city of Lund which has about 112 000
inhabitants. A number of departments for research and education are, however, located in
Malmö. Lund University was founded in 1666 and has today a total staff of 6 000 employees
and 47 000 students attending 280 degree programmes and 2 300 subject courses offered by
63 departments.

Master Programme in Energy-efficient and Environmental Building Design

This international programme provides knowledge, skills, and competencies within the area
of energy-efficient and environmental building design in cold climates. The goal is to train
highly skilled professionals, who will significantly contribute to and influence the design,
building or renovation of energy-efficient buildings, taking into consideration the architecture
and environment, the inhabitants’ behavior and needs, their health and comfort as well as the
overall economy.

The degree project is the final part of the master programme leading to a Master of Science
(120 credits) in Energy-efficient and Environmental Buildings.

Examiner: Henrik Davidsson (Division of Energy & Building Design)

Supervisor: Jouri Kanters (Division of Energy & Building Design), Andy Thomson (Thomson
Architecture, Canada)

Keywords: Building Information Modelling (BIM), Building Energy Modelling (BEM),
interoperability, performance based design, early design optimization.

Publication Year: 2021

                                                      2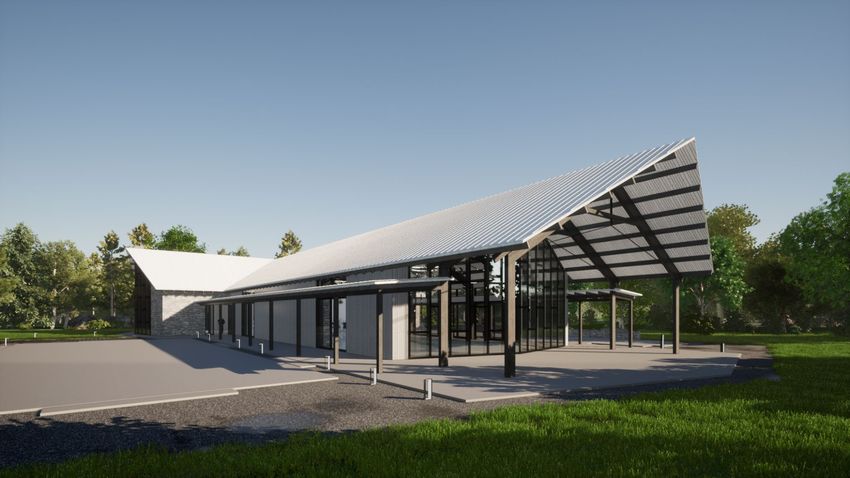
BIM to BEM: Development of an integral workflow from Archicad to Energy Evaluation

Abstract
Buildings are one of the main contributors to climate change as they consume a significant
part of the total energy produced. The reduction of the energy consumption and carbon
emissions of the buildings is vitally important for our environment. The building performance
simulations (BPS) play an important role when it comes to energy-efficient building design.
There are various BPS tools on the market today, and they are used for building design
optimization at all stages of the design process. The most energy savings can be achieved
during the preliminary design phase. Energy performance simulations can often be ignored
during this phase for several reasons such as insufficient knowledge of simulation know-how,
absence of detailed pieces of information about the loads and HVAC systems and
interoperability challenges, which emerge during Building Information Modelling (BIM) to
Building Energy Modeling (BEM) integration. Nowadays, interoperability between BIM and
BPS tools is characterized by data clashes and losses during translation. In these
circumstances, the given study analyzes current interoperability challenges by evaluating the
shortcomings of the translation process using three typical BIM to BEM workflows.
Workflows include one BIM and three different BPS tools and evaluations are based on three
case studies. The results show that a promising solution to current BIM to BEM challenges
can be the development of the BIM-integrated BEM tools, which today are often underrated
due to their simplicity and limits.

                                                     3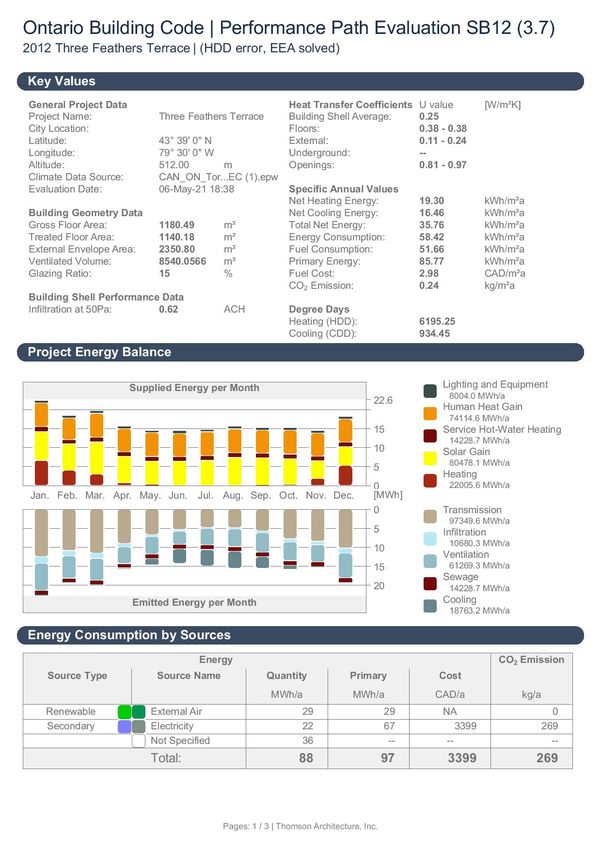
BIM to BEM: Development of an integral workflow from Archicad to Energy Evaluation

Acknowledgment
This project has been conducted after an initiative from the Canadian firm “Thomson
Architecture”. The company’s supervisor for this project has been Andy Thomson. I would
like to thank him for his guidance and comments throughout the thesis. Also, for giving me
access to the BIM models of Muskoka lakes residence and POSH, the wedding assembly, as
they were used for case studies later. Moreover, I would like to express my appreciation to
Enzyme architecture for providing high-quality BIM models for my studies.

I would like to thank my supervisor Jouri Kanters for helping me in the formation of my thesis
topic and for his guidance and comments throughout the entire degree project.

I would like to thank Cove.tools and the Graphisoft support team for patiently answering all
my questions regarding software specifications and for granting me a student license for their
tools.

I would like to acknowledge the support provided by the Grasshopper 3D community and
Global Archicad community to all the beginners.

I would like to thank my cat Märta, who always sat by me and encouraged me while working
on this project.

Eventually, I want to extend my gratitude to Maria Wall for sending us constant updates and
reminders throughout the thesis period.

                                                     4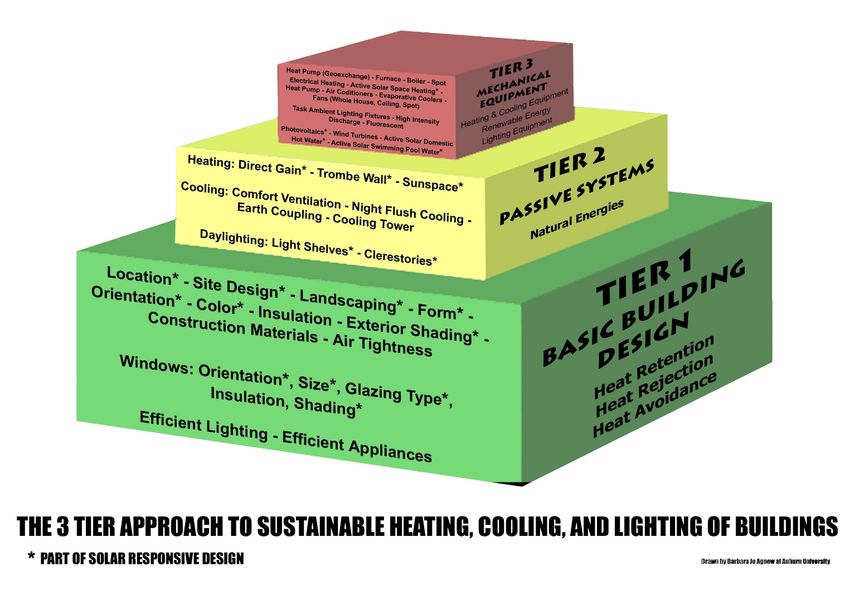
BIM to BEM: Development of an integral workflow from Archicad to Energy Evaluation

Contents
Abstract ............................................................................................................. 3
Acknowledgment ............................................................................................... 4
Abbreviations .................................................................................................... 6
Definitions ......................................................................................................... 7
1    Introduction ............................................................................................... 9
  1.1 Background                                                                                                       9
  1.2 Objectives                                                                                                     11
  1.3 Research questions                                                                                             12
  1.4 Limitations                                                                                                    12
2    Theoretical background ........................................................................... 13
  2.1 Definition of BIM                                                                                              13
  2.2 Definition of BEM                                                                                              15
  2.3 State-of-art of BIM to BEM challenges and solutions                                                            17
  2.4 BPS tools used for case studies.                                                                               18
     2.4.1 Energy Evaluation (EE)                                                                                    18
     2.4.2 Cove.tool (CT)                                                                                            19
     2.4.3 Climate studio (CS)                                                                                       19
3    Method .................................................................................................... 21
  3.1 BPS tools workflow                                                                                             22
  3.2 Case studies                                                                                                   23
     3.2.1 Shoebox                                                                                                   24
     3.2.2 POSH – Wedding venue                                                                                      26
     3.2.3 Muskoka – Residential                                                                                     29
4    Results ..................................................................................................... 32
  4.1 Climate analysis                                                                                               32
  4.2 Geometry                                                                                                       35
  4.3 Energy                                                                                                         39
     4.3.1 Shoebox                                                                                                   39
     4.3.2 POSH – The wedding venue                                                                                  46
     4.3.3 Muskoka                                                                                                   49
5    Discussion ............................................................................................... 52
6    Conclusion............................................................................................... 54
References ....................................................................................................... 55
Appendix 1 ...................................................................................................... 59
Appendix 2 ...................................................................................................... 62

                                                                     5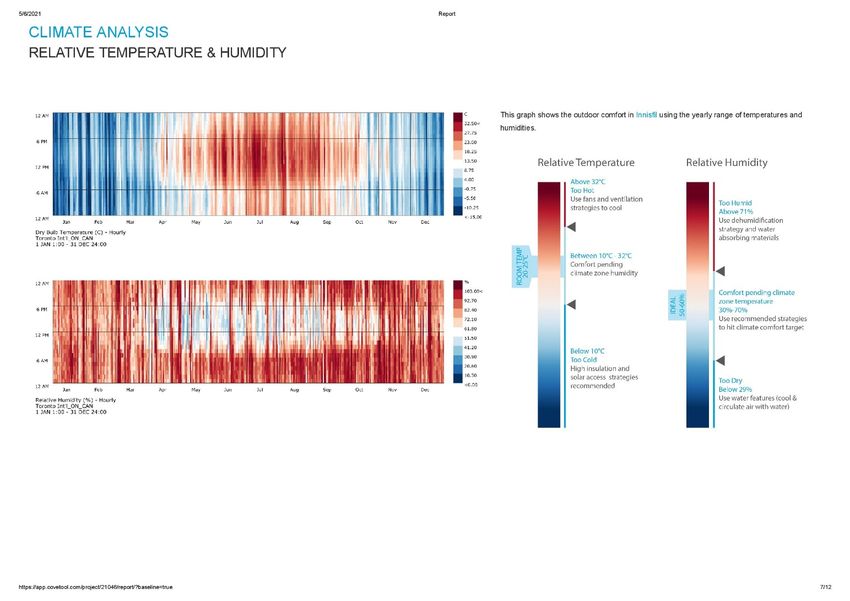
BIM to BEM: Development of an integral workflow from Archicad to Energy Evaluation

Abbreviations
BIM:      Building information modeling
BEM:      Building energy modeling
BPS:      Building performance simulation
EE:       Energy Evaluation
CT:       Cove.tool
CS:       Climate studio
GUI:      Graphical user interface
IFC:      Industry foundation class
gbXML:    Green building XML
TEUI:     Thermal energy use intensity
GFA:      Gross floor area
TFA:      Treated floor area
EEA:      External envelope area
TEDI:     Thermal energy demand intensity
EUI:      Energy use intensity
LPD:      Lighting power density
TST:      Total solar transmission
COP:      Coefficient of performance
SHGC:     Solar heat gain coefficient
ACH:      Air changes per hour
AEC:      Architecture Engineering Construction
CAD:      Computer-aided design
WWR:      Window-to-wall ratio
HVAC:     Heating, cooling and air conditioning
HDD:      Heating degree days

                                                 6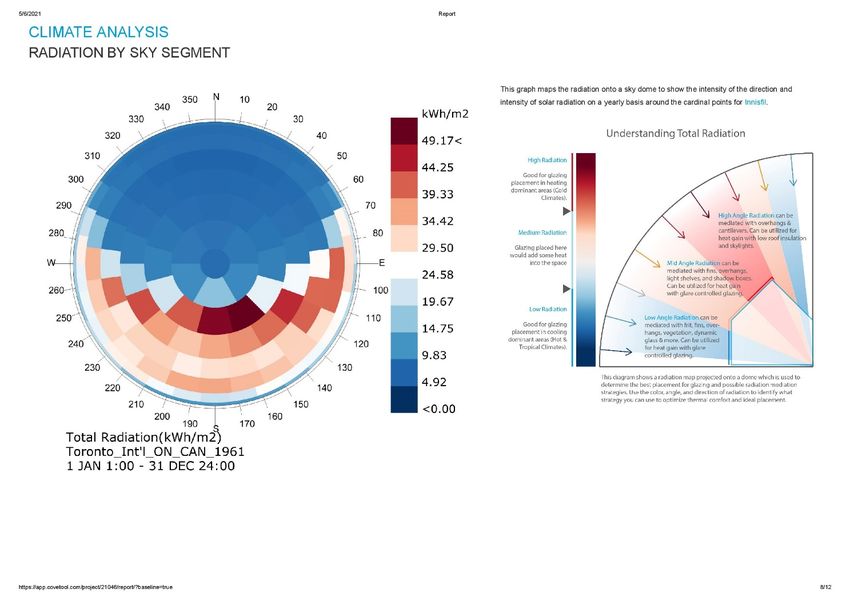
BIM to BEM: Development of an integral workflow from Archicad to Energy Evaluation

Definitions

Total solar transmittance
The percentage of incident solar radiation transmitted by an object includes the Direct Solar
Transmission plus the part of the Solar Absorption reradiated inward. TST divided by 100
equals Solar Heat Gain Coefficient (SHGC) or g-value (Graphisoft, 2010).

Air changes per hour
The number of interior volume air changes that occur per hour and has units of ACH
(Graphisoft, 2010).

Building volume
The volume of the conditioned air space of a building measured by its internal dimensions
(Graphisoft, 2010).

Infiltration
Uncontrolled outside air movement into a building, typically through the cracks and
nonvisible holes through the building envelope (Hopfe and McLeod, 2015).

Lighting power density
The maximum lighting power output per unit of floor area (Graphisoft, 2010).

U-value
U-value is the thermal transmittance, which is the rate of heat flow through matter. The U-
value is dependent on the thermal properties of the window, wall, or component assembly and
weather conditions. A smaller value indicates a lower rate of heat flow or better thermal
performance. (Switala-Elmhurst and Udo-Inyang, 2014).

SHGC
Solar Heat Gain Coefficient is the fraction of solar radiation through a window to the
incoming radiation on the window. g-values values range between 0 and 1 and a smaller value
indicates less solar heat gain (Switala-Elmhurst and Udo-Inyang, 2014).

Infiltration
Infiltration or air leakage is the rate of air movement through a window or wall assembly. For
windows, air leakage values typically range between 0.1 and 0.3 and the lower the value, the
tighter the window (Switala-Elmhurst and Udo-Inyang, 2014).

HDD
Heating degree days (HDD) are a measure of how cold the temperature was on a given day or
during a period of days (Graphisoft, 2010).

Dry Bulb Temperature

The dry-bulb temperature is the temperature of air measured by a thermometer freely exposed
to the air, but shielded from radiation and moisture (“Dry-bulb temperature,” 2021).

                                                      7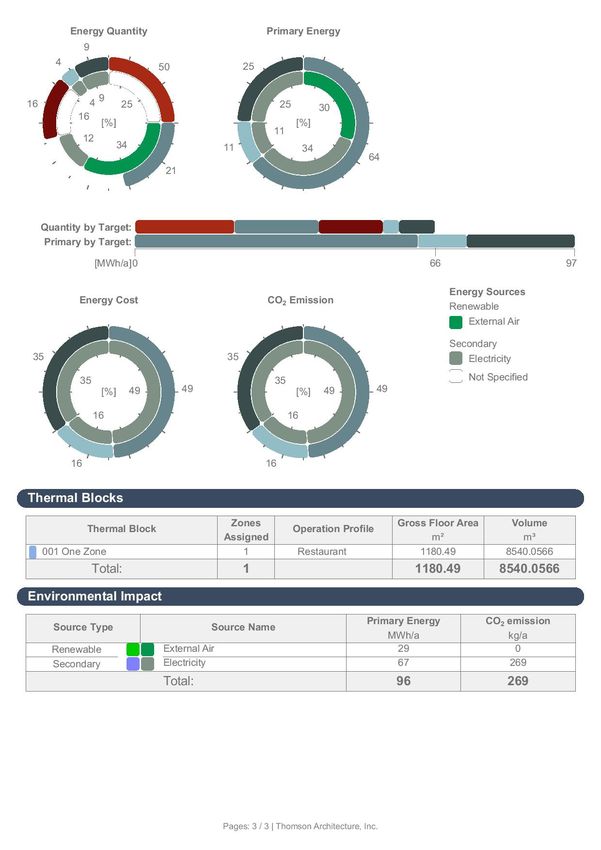
BIM to BEM: Development of an integral workflow from Archicad to Energy Evaluation
WWR
The window to wall ratio is a fraction of the above-grade wall area covered with fenestration
as a ratio of the total exterior wall area.
TEDI
Thermal energy demand intensity (TEDI) is calculated as transmission losses (conduction,
convection, radiation, and air leakage) through the enclosure only. This metric is derived from
the annual space heating and cooling energy demands, dividing them by the conditioned floor
area of the building (Kesik and O’Brien, 2019).
EUI
EUI is expressed as energy per square foot or meter per year. It is calculated by dividing the
total energy consumed by the building in one year by the total gross floor area of the building
(“Energy Use Intensity (EUI),” n.d.).
Relative Humidity
The amount of water vapour present in air is expressed as a percentage of the amount needed
for saturation at the same temperature.
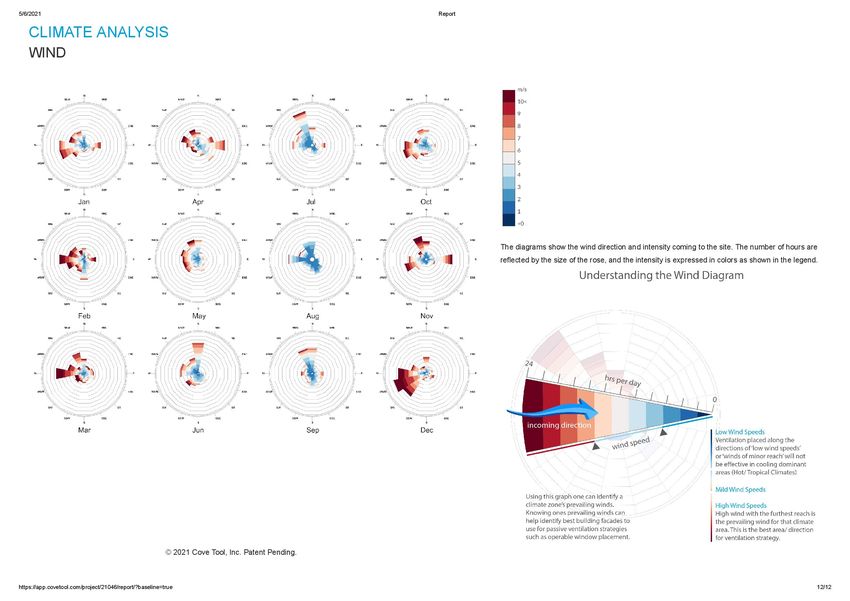
Wind rose
A diagram showing the relative frequency of wind directions and speed at a place.
8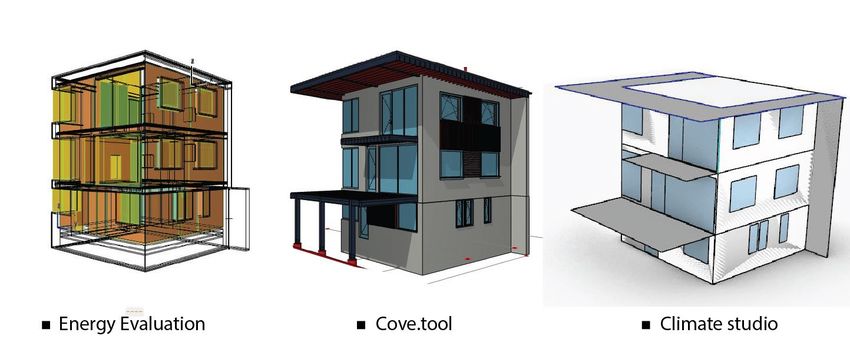
BIM to BEM: Development of an integral workflow from Archicad to Energy Evaluation

1 Introduction
1.1 Background
Globally, buildings are responsible for a significant part of energy consumption. The number
varies by location, concretely in European Union buildings account for approximately 40 %
of the total energy use (Energiläge, 2020), rate increases up to 48 % for the United States,
with 36% for the operational energy and an additional 12% coming from the construction
(Venkatraj et al., 2020). It has been several decades since scientists warned us that the planet
and its natural systems have a specific limit of processing the waste. However, the rate of
pollution is beyond this limit since fossil fuels are consumed at a pace beyond any previous
point in history (Kendall, 1992).

As the age of cheap energy is coming to an end, the consequences of the accelerated climate
change are forcing a radical rethinking of building construction techniques and the need for
energy efficiency (Hopfe and McLeod, 2015). Numerous measures were taken to promote the
reduction of energy consumption. The Kyoto protocol was one of the first initiatives towards
the energy reduction process in 1997 (UNFCCC, 1997).

Despite increased awareness, the global energy demand continues to grow. It slowed down in
2019 due to slower economic growth and weather conditions (IEA, 2019), but the trend has
changed due to the Covid-19 pandemic, which caused energy demand reduction by 6%, the
largest in 70 years in percentage terms (IEA, 2020). The demand was decreased not because
of the energy-efficient measures but rather due to lockdown restrictions. Unfortunately, as
after previous crises, the rebound of the emissions can be larger than the reduction unless
there are actions that promote cleaner and more resilient energy infrastructure (IEA, 2020).

The energy used to create an indoor comfort environment is mainly derived from non-
renewable sources, which are carbon-based (coal, oil, and gas). The environmental problems
that we face today are primarily caused by emitting large quantities of carbon dioxide
(Alavyet al., 2021). Therefore energy reduction for the buildings is highly desirable.

Designing energy-efficient buildings can decrease their energy consumption up to 80%
(Lechner, 2014). This can be more easily achieved by understanding the method of the three-
tier design approach to sustainable design. The first tier works with basic building design
techniques, the second tier with passive systems development, and the final tier with active
systems such as mechanical equipment (Figure 1). The early design phase, mainly the first
tier, is vitally important. It is characterized by the variability in the building parameters such
as massing, the surface to volume ratio, orientation, etc. At this stage, 60% of reduction of the
heating, cooling, and lighting can be achieved (Lechner, 2014). The decisions taken in this
phase are the ones that most strongly affect building performance and are the most
burdensome to adjust in a later stage.

                                                      9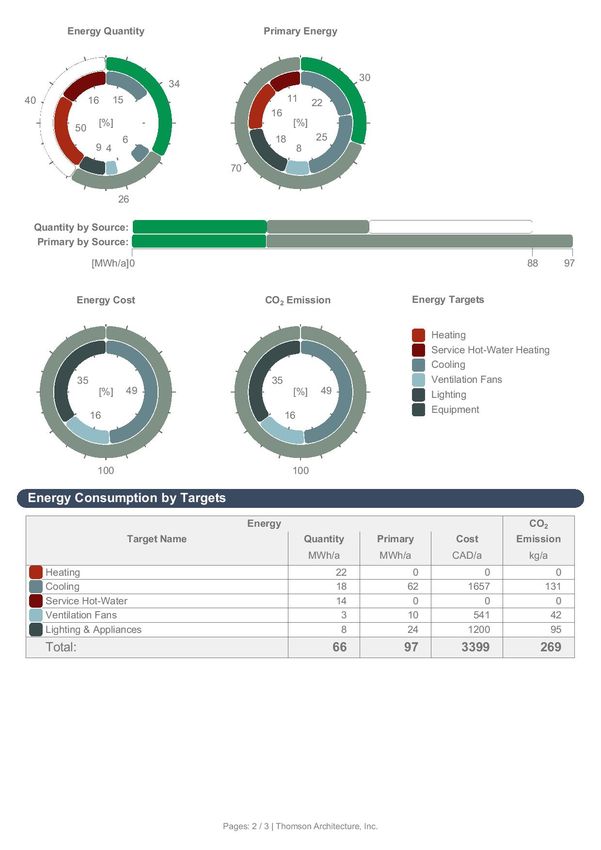
BIM to BEM: Development of an integral workflow from Archicad to Energy Evaluation

            Figure 1. The three tier approach to the sustainability design of heating, cooling, and
                            lighting (free poster available at www.heliodon.org).

The MacLeamy curve (Figure 2) shows that the further the design team is through the design
process, the more complex and costly the changes become. The concept of “shifting the
effort” can be understood as shifting the main working load towards the pre-design phase.
The team has increased opportunity to make design decisions that have the highest effect on
the functional capabilities and the cost of the design changes is the lowest (Gao et al., 2019).

                Figure 2. The MacLeamy curve (Available via license: CC BY-NC-ND 4.0).

                                                     10
BIM to BEM: Development of an integral workflow from Archicad to Energy Evaluation
The energy-efficient building design is a convoluted process, which involves a wide range of
professionals with different backgrounds (Bracht et al., 2021). The trend of separating
architecture and engineering is evident for much of the last century. Moreover, the energy
part is mainly addressed at the third tier, which includes active systems. Usually, it is assumed
that the engineering team can make any idea work at the mechanical systems level (AIA,
2012). On the other hand, architectural education is facing a skills gap – many architects do
not obtain the skills they need to design energy-efficient buildings on graduation from schools
of architecture (Thomson, 2020). Besides the fact that many architects lack simulation know-
how, they do not have the time and resources to learn new tools (Paryudi, 2015). One of the
reasons for the lack of motivation is that most Building Performance Simulation (BPS) tools
are not architect friendly, which means that they are too complex and do not fit the working
methods to which architects are used to. As a result, energy evaluation in pre-design is often
avoided and the benefits of the early design optimization are reduced (Paryudi, 2015).
Another reason why the energy evaluation is being shifted towards the final design phase can
be the lack of communication between different stakeholders during the early design phase.
It is mainly caused by the low level of Building Information Modelling (BIM) use. BIM,
shortly described as a software model containing information about the physical and
functional properties of the facility, is mainly known for its ability of collaborative design
(Rashed Alsharif, 2019). Thus, it is desirable to extract the full potential of BIM. Lack of joint
effort can result in performing building’s energy performance at the final stage of the design.
Not because to motivate or examine design solutions that lead to energy efficiency, but rather
for code compliance (Arayici et al., 2018).
There is a wide range of BPS tools worldwide. However, not all of them are suitable for the
early design stage. The absence of accurate data in the first tier of the design process makes
most BPS tools and workflows impracticable. Consequently, there is a need for the simulation
tool, which can help architects to make early-stage decisions and provide a simple, flexible
workflow that can result in reasonable energy assessment (Li, 2017).
1.2 Objectives
This study will assess the performance of Archicad’s Energy Evaluation compared to other
building performance simulation tools, identify associated challenges and limitations, and
suggest modeling techniques and potential software features for better BIM to BEM
workflows and integrations.
Moreover, the potential for immediate performance feedback referred to as “design
optimization” will be determined. Which is facilitates the achievement of energy-efficiency
requirements at early-stage design and obtainment of a single model. Interoperability
challenges will be further explored by proposing three different workflows based on three
BPS tools in order to analyze the energy performance for three case studies.
11BIM to BEM: Development of an integral workflow from Archicad to Energy Evaluation
1.3 Research questions
Within this study, the following questions were formulated:
• What type of interoperability challenges appears while converting BIM to BEM with
different tools?
• How much time does it take to translate BIM to BEM and what is the complexity of
the different tools?
• What are the pros and cons of the proposed BPS tools when compared to each other?
• What can be the possible solution to current interoperability challenges and which
improvements can be made to further develop and raise the level of BIM to BEM
integration?
1.4 Limitations
The study was accomplished with a holistic approach, considering different parameters that
affect energy simulation evaluation and the whole building energy balance. The research
includes topics related to architecture, building physics, passive and active systems (without
getting deep into specific mechanical system details).
Due to limited time, the study will only focus on the energy part and investigate key indicators
for early-stage design optimization such as energy use intensity (EUI), thermal energy
demand intensity (TEDI) and the energy balance.
A validation of BEM simulation software to determine their accuracy will not be covered
since BPS programs need to be validated against measured data, which is not applicable in a
particular case.
On account of the limitations of the simulation software, no additional studies were conducted
for moisture risks, thermal bridge assessment, carbon footprint, daylight and sewage.
12BIM to BEM: Development of an integral workflow from Archicad to Energy Evaluation
2 Theoretical background
A literature review was conducted to identify studies addressing BIM to BEM integration
during the design process. The electronic databases searched were mainly Science
direct(“ScienceDirect.com,” 2021), Google Scholar (“Google Scholar,” 2021), and Research
Gate (“ResearchGate,” 2021). Since BIM and BEM tools are developed rapidly and are
updated frequently, these platforms were searched for full-text papers published in English
for the last seven years, starting from 2014.
The following keywords were used for the search: BIM, BEM, building simulations, building
performance simulation, interoperability, model integration, and early design evaluation.
After application of the keywords, articles were selected based on the title and abstract. The
final selection was made by reading full texts to determine if they were relevant to the study
objectives.
2.1 Definition of BIM
To fully understand all the benefits of the BIM to BEM integration, some of the key points of
the BIM development will be reviewed in the following chapter.
Today, BIM can be defined as a process of creating an intelligent three-dimensional building
model that enables stakeholders to manage and coordinate the whole life cycle of the building,
including a plan, design, construction, operation, and maintenance (Autodesk, 2021). Since
its first introduction, BIM has developed and matured into six directions: design, estimation,
construction, building life cycle, performance, and technology (Latiffi et al., 2014).
An equally significant aspect of BIM is the levels of maturity which illustrates how this
method progressed and formed throughout time (Figure 3). Level 0 includes computer-aided
design (CAD) and can be described as a low level of collaboration since the design process is
non-interoperable and information is exchanged via paper-based or electronic documents.
Different stakeholders do not collaborate as everyone creates their own data. Even though
industry professionals rarely use this level, it can still be applied. In other words, even BIM-
oriented software can be used as a level zero if the exchange of information is paper-based
and there is low cooperation (Biblus, 2019a). The key point in the next level of evolution is
the introduction of 3D modeling.
Level 1 uses both 2D and 3D CAD information for visualizations and the generation of the
necessary documentation. This level is a partial collaboration since information is shared
electronically using a common data environment (CDE). CDE is a data-sharing platform,
which can collect, store and organize data throughout the design process (Biblus, 2019b).
However, this level is still referred to as a” lonely BIM” since different stakeholders rarely
collaborate and usually, they work on their own, producing separate files.
As CAD software became more intelligent, users wanted to share the design and the data
associated with it. As a result, more attention was given to the data rather than 3D
visualizations. Some key points of level 2 include the introduction of time management and
cost calculation. Libraries and object-based parametric modeling is introduced, which is one
13BIM to BEM: Development of an integral workflow from Archicad to Energy Evaluation
of the main difference between BIM and traditional 3D modeling. In particular, objects are
represented by parameters and the rules that determine shape and form together with some
non-geometric data.
Objects are automatically updated according to user control. Sets of base building object
classes are created, which predefine the wall, roof, or slab and how they interact. It was
acknowledged that that multiple classes could share parameters. For example, the boundaries
of the slab can be defined by the wall planes surrounding it. What’s most important, if the
single object is moved, all the others change their location and appearance accordingly (Sacks
et al., 2018). Apart from the technical improvements, a collaborative workflow is the main
focus of the level 2 BIM. But, full integration does not necessarily mean that all the
stakeholders are working within the same document. Instead, team members can develop
separate CAD models while being part of the standard file type, such as industry foundation
classes (IFC), which unites all the data produced throughout the design process.
Level 3 BIM is the final goal of the design and construction practice. It is often referred to as
an” Open BIM” and includes full integration of the information in the cloud-based
environment, which enables all the stakeholders to work on the same model simultaneously.
Apart from the construction sequencing and cost calculations, with Level 3 BIM entire life
cycle of the building can be assessed, resulting in a better business outcome. Integrated web
services and multidisciplinary design eliminate the chances of conflicting information
(UNITED-BIM, 2020).
Figure 3. BIM development timeline.
Nowadays, most architectural projects are designed with BIM, one of the well-used
instruments in architecture, engineering, and construction (AEC). With the help of BIM
technology, a computer-generated model of the building can be constructed, enabling the
coordination of the information for different disciplines that are needed to support the
construction, fabrication, and mechanical, electrical, and plumbing (MEP) systems required
to erect the building (Chen et al., 2018). Even though BIM enables optimization of design
parameters such as location, orientation, glazing, and fabric properties from the preliminary
design stage, an additional tool for building energy assessment is needed.
14BIM to BEM: Development of an integral workflow from Archicad to Energy Evaluation
2.2 Definition of BEM
While BIM tools such as Archicad and Revit are used to create BIM models, separate tools
for energy assessment are necessary. This is where BEM steps in. BEM can be described as
an application of computer-based simulation software in order to perform a detailed energy
assessment of the building and its systems (Farzaneh et al., 2019). Performed simulations are
based on a mathematical model enacted by the software and provide an approximate
representation of the structure. Additional data input is required for the creation of the
complete building model. Input data, which is necessary to run detailed building performance
analysis, include:
• Climate: typical weather data for a specific location;
• Site: Building location, orientation, context shading by site, trees, or surrounding
buildings;
• Geometry: building shape and zone distribution;
• Envelope: envelope characteristics of materials, constructions, openings, thermal
bridges, infiltration and shadings;
• Internal heat gains: generated by occupants, lighting and equipment;
• Schedules: occupant and operation schedules;
• Heating, ventilation and air conditioning (HVAC) system specifications (Rashed
Alsharif, 2019), (Pezeshki et al., 2019), (Chaudhary et al., 2016).
The information about the climate is typically provided by importing a weather file. A weather
file is an annual weather stream for specific climate zones containing text information
regarding daily temperature measurements, relative humidity, radiation, wind, and
precipitation. It represents an average year of 30 years (EnergyPlus, 2021).
Site, geometry, and envelope include input data that requires the most time. There is a high
probability of human error due to the amount of information that needs to be inputted
manually (E. Kamel and Memari, 2019).
Internal heat gains and schedules are predicted by numerous standards such as ASHRAE 55
(ASHRAE 55, 2010), ASHRAE 90.1 (ASHRAE 90.1, 2019), DIN18599 (DIN V 18599,
2011), etc. In most cases, simulation tools include templates that simplify and shorten the
process of data input. Additional changes to the values can be made according to the
specifications of the building. The energy model is different from the typical 3D models
produced with BIM. It is possible to generate an energy model from an information model.
The energy simulation process can be integrated within the design and can be more accurate
and efficient. However, the integrity of the BIM-based energy modeling is not yet fully
achieved (Elnabawi, 2020)
The complexity of HVAC input greatly depends on the simulation tool itself. Some of the
tools have modes that enable the assessment of heating and cooling loads without any system
details. However, it is necessary to define condition requirements for the zones, such as min
and max indoor temperatures. Some tools only require details, such as the coefficient of
performance (COP) and there are tools that additionally need specified HVAC system type.
15BIM to BEM: Development of an integral workflow from Archicad to Energy Evaluation
When all the required data is provided, the software is ready to run the simulation. It means
that the built-in engine will solve equations connected with thermodynamics and building
science. The time required for the calculations can vary depending on the size of the building,
level of detail and complexity of the analysis (Tupper et al., 2013). The building performance
can be simulated in many different ways. Some of the most common types of simulation
include climate analysis, thermal comfort, energy calculations, daylight assessments, etc. The
output depends on the simulation type and tool. Usually, results are reported for annual
performance and include heating and cooling demands, peak loads, daylight impacts, HVAC
and renewable system performance, embodied and operational carbon emissions, resource
consumption, energy costs and other performance-related variables (“Building performance
simulation,” 2021).
BEM tools typically consist of two units: a graphical user interface (GUI) and a simulation
engine (Figure 4). GUI can be described as a system of interactive visual elements facilitating
Figure 4. BEM simulation process.
the building energy modeling process by providing a graphical interface for users (Ehsan
Kamel and Memari, 2019). The second component, the simulation engine, works behind and
provides results based on input from GUI. In other words, there is a continuous process of
mapping from GUI to simulation engine and usually, this is where the majority of the
interoperability challenges occur. Currently, none of the simulation engines are capable of
independently importing BIM file schemas such as international foundation class (IFC) and
green building XML (gbXML) (Ehsan Kamel and Memari, 2019).
The mapping between GUI and simulation engine can also be described as a model integration
process. There are three types of model integration: combined, central and distributed
(Negendahl, 2015).
The combined method considers a software package that enables design and BPS
simultaneously (Farzaneh et al., 2019). Combined model integration has several benefits:
instant feedback regarding the building’s performance at any stage of the design, a high level
of interoperability, and accuracy. Nonetheless, compared to other methods, combined model
integration is somewhat limited.
Central model integration refers to a method where BIM to BEM translation happens with the
help of the BIM file schemas such as IFC or gbXML. File schemas act as a medium between
BIM and BEM containing the relevant input data. This is the most used approach nowadays.
However, it might not be appropriate for all stages of building design, especially at the early
stage when changes happen more frequently. When it comes to BIM to BEM translation, it
16BIM to BEM: Development of an integral workflow from Archicad to Energy Evaluation
should be noted that there can be three types of compatibility: directly compatible, not
compatible and indirectly compatible (Farzaneh et al., 2019).
Directly compatible translation refers to a process when BEM tool has a mapping interface
that facilitates the direct translation of the file schema’s data model to the internal data model
of the simulation engine. For instance, Climate Studio can act as a mapping interface to
connect BIM file schema to EnergyPlus simulation engine. The absence of a mapping
interface means that process of translation is not compatible. And finally, translation is
indirectly compatible when the middleware interface can be used instead of mapping to
connect the simulation engine to the BIM file data (Farzaneh et al., 2019).
The distributed method may bear a resemblance to the most complicated workflow, but it has
its advantages. Mainly, the middleware interface allows more control over the translation
process, the possibility of geometry modification, deep integration and evaluation of complex
forms. Grasshopper, which is the visual programming language, is one of the most used
middleware interfaces.
2.3 State-of-art of BIM to BEM challenges and solutions
The evaluation of the articles for recent years (2016-2020) shows that BIM to BEM
integration draws more and more interest among researchers and industry professionals.
The studies point out that full interoperability between BIM and BEM tools has not yet been
achieved (Bracht et al., 2021; Chong et al., 2017). The absence of insufficient and valuable
tools for architects that could lead to energy reductions by enabling the design team to
evaluate more energy-saving measures during the early stage of the design process is also
noticed (Asl et al., 2016; Jin et al., 2019; Kim et al., 2015). Usually, BPS is ignored at the
early stage of design due to uncertainties, lack of information regarding specific details such
as zones, loads, schedules, mechanical systems and computational time (Singh et al., 2020).
The majority of the reviewed papers agree that the main problem with BIM to BEM
integration is the limited capability of data exchange among different BIM and BEM software,
making it hard to create a unique model containing all the types of information. Optimization
of the interoperability process is error-prone and complicated due to the wide variety of BIM
export file formats and energy engines available on the market. According to the reviewed
papers, gbXML and IFC file format usage, i.e., the central model integration method for
information sharing between BIM and BEM, is the most common workflow (Farzaneh et al.,
2019). Although both schemas are comprehensive file formats, BIM authoring tools might
still struggle to properly transfer required data to IFC and gbXML (Ehsan Kamel and Memari,
2019; Pezeshki et al., 2019). Another problem emerges when the BEM tool cannot correctly
retrieve data provided with the BIM file. With the accurate BIM model, there are still missing
information and recognition issues. Sometimes even the most advanced and complete tools
fail to generate reliable BEM models which utilizes all required information from BIM file
schemas (Gourlis and Kovacic, 2017).
Most of the studies are dedicated to the central method, and interoperability challenges are
often solved by creating new middleware components (distributed model integration), often
referred to as a corrective tool using Python programming language. It should be noted that
this method might not be an efficient approach since this type of simulation can rarely be used
17BIM to BEM: Development of an integral workflow from Archicad to Energy Evaluation
in the optimal design process due to complexity and frequent energy modeling. Also, it
requires a high level of programming skills (Asl et al., 2016; Jabi, 2016; Kim et al., 2015; Sun
and McArthur, 2016).
Even though the combined method of the model integration is an up-and-coming solution for
the BIM to BEM interoperability challenges, only several studies focus on them (Farzaneh et
al., 2019). A few studies investigating the BIM-based BEM tools suggest that this kind of
workflow can be as accurate as advanced BPS tools. Moreover, the combined method can
reduce the simulation’s computational time and require fewer resources (Li, 2017; Sun and
McArthur, 2016).
2.4 BPS tools used for case studies.
Based on the literature review, some main problems that emerge while performing BPS at the
early design stage were identified to investigate them further in the case studies. These
problems include:
• Inefficient translation of the data from BIM to BEM,
• Shortage of studies where combined model integration method is assessed,
• Calculation time and complexity,
• Relevancy to the early design stage.
BPS tools for the case studies were selected based on the above-listed criteria.
2.4.1 Energy Evaluation (EE)
Energy Evaluation is an add-on application for Archicad that enables architects to evaluate
buildings within the BIM interface and provide fast feedback on specific design alternatives,
efficiency and sustainability (Graphisoft, 2021). The outcome of the Energy Evaluation is
based on building geometry, weather data for the particular location, operational profiles and
mechanical systems. Energy evaluation provides templates for various operational profiles
based on the DIN 18599 standard (DIN - Deutsches Institut für Normung e.V., 2018).
Dynamic building energy evaluation is performed by passing data to StruSoft’s Vip-Energy
calculation engine (Strusoft, 2021). As a result, yearly energy consumption, carbon footprint
(including only carbon dioxide emitted during building’s operation) and monthly energy
balance can be generated. The annual results are displayed on the automatically generated
evaluation report (Appendix 1).
The Vip-Energy calculation engine integrated with Archicad depends on dynamic models.
Dynamic models include deconstruction to the level where facts and behavior are known and
each component group is analyzed separately (“VIP-Core Dynamic Simulation Engine,”
2014). The data is calculated for every hour. The Vip-energy calculation engine is validated
with ANSI/ASHRAE standard 140-2007, the standard test method for evaluating BPS tools
(ASHRAE140-2007, 2010). The VIP-Energy’s calculation method is based on DIN 18599
standard for energy performance of the buildings (DIN - Deutsches Institut für Normung e.V.,
2018)
18BIM to BEM: Development of an integral workflow from Archicad to Energy Evaluation
When it comes to the model integration method, Archicad and Energy Evaluation can be
referred to as a combined system since BEM is produced directly from BIM and
design/energy simulation processes are carried out simultaneously. Most of the data from the
BIM model is utilized by Energy Evaluation.
2.4.2 Cove.tool (CT)
Cove.tool is a web app, an automated building performance platform that allows architects
and engineers to perform energy evaluation (Cove.tool, 2021). Cove.tool is connected to the
Archicad with a plugin that automatically translates BIM to BEM. After proper classification
of the different building elements, geometry is uploaded to the web page. Whenever changes
are made to the BIM model, the geometry needs to be uploaded manually. The Cove.tool’s
outcome is based on the geometry of the uploaded model, climate data, operational schedules
and specifications of the mechanical systems. At the moment, the application only extracts
the geometry and does not draw any information about the assembly from the BIM model.
All of the other values regarding thermal envelope are populated using the selected energy
code for the project location. The established regulations determine the minimum values for
a given building. At the moment, available building codes are valid for U.S. and Canada. The
templates of the operational profiles are based on ASHRAE standards. They are assigned
automatically depending on the selected building type. Currently, CT has eight variations of
the buildings, including both residential and commercial classes. CT only allows single-zone
assessment, runs annual simulations and delivers results regarding daylight, energy and
carbon footprint. An automatic report can be generated based on the outcome. Apart from the
energy calculations, CT offers design optimization and is integrated with American Institute
of Architects 2030 commitment (AIA, 2021), a national effort to reduce building-related
impacts on the environment (Cove.tool, 2021).
The simulation engine is based on Argonne ISO 13790 (Argonne National Laboratory, 2008),
which gives calculation methods for assessing the annual energy use for space heating and
cooling of a building. The calculation method includes assessment of the heat transfer by
transmission and ventilation, the contribution of internal and solar heat gains towards
buildings heat balance, annual energy needs for heating and cooling and yearly energy use.
Since building geometry is exported from the BIM modeler, the model integration using CT
can be classified as a central method. CT acts as a mapping interface to facilitate data
translation.
2.4.3 Climate studio (CS)
Climate studio is environmental performance analysis software for the AEC industry
developed by Solemma LLC. It is a plugin for the Rhinoceros and it is integrated with
Grasshopper as well. The connection between Archicad and CS is possible through the
Grasshopper live link plugin for Archicad (Climate Studio, 2021). Live connection plugin
enables Archicad components to be imported in Grasshopper and projected in Rhino viewport.
It should be noted that live link plugin is mainly used for design purposes and not for energy
simulations since currently it is impossible to automatically create BEM model through the
live connection from the Archicad. CS can run multizone thermal simulations based on the
19BIM to BEM: Development of an integral workflow from Archicad to Energy Evaluation
buildings geometry, weather conditions, operational schedules, and mechanical system
specifications. CS provides a vast amount of building material libraries and schedules based
on ASHRAE standards, almost for all types of buildings. CS can generate results regarding
buildings’ energy performance, daylight and carbon footprint. At present, the creation of a
report based on the results generated in Grasshopper is not possible. CS attributes fully
parametric energy modeling via Grasshopper and enables automatic AIA 2030 reporting
(AIA, 2021; Climate Studio, 2021).
CS calculation method is based on EnergyPlus simulation engine. Like the Vip engine,
EnergyPlus supports heat balance-based solutions, including radiant and convective effects
on the building.
Archicad-Grasshopper-CS workflow can be referred to as a distributed method since
Grasshopper is the middleware tool that connects the BIM file with the simulation engine. In
this case, CS acts as a GUI.
20BIM to BEM: Development of an integral workflow from Archicad to Energy Evaluation
3 Method
The research was divided into five main stages. Figure 5 exhibits a detailed overview of each
step. In the first stage of the study, a literature review was carried out, with the primary
purpose to reflect the current knowledge and challenges within the AEC industry when it
comes to BIM to BEM integration. Based on the assessed literature, some of the main
problems were listed and relevant BPS tools were selected.
In the second stage, all the necessary data for the BPS was collected. Specifically, BIM models
for three case studies included information about the building geometry, orientation and
envelope specifications. Weather files were downloaded from EnergyPlus databases
(EnergyPlus, 2021). Toronto weather file was used for all of the case studies. For comparison,
weather file was assessed in Excel and min, max and average values of the key climate
indicators (Dry bulb temperature, relative humidity and wind speed) were calculated
manually. Additionally weather files from cities (Victoria, Yellowknife, Ottawa, Quebec,
Toronto and Whitehorse) located in different climate zones (“Comparing the Energy Codes,”
2020) were used for additional climate analysis such as Heating Degree Days (HDD)
calculations. Custom schedules were made according to building types and usage. Loads for
detailed internal heat gain calculations and HVAC system specifications for more rational
energy use intensity (EUI) results were taken from the relevant standards and energy codes.
During the third stage, numerical and analyses were carried out. BIM files for each of the case
studies was evaluated with three BPS tool. Some preferable conditions included:
• BPS tools could transform BIM to BEM automatically
• Remodeling of the building should be avoided as much as possible.
Subsequently, at the fourth stage, simulation results could be obtained. Apart from the energy
outcome, climate and geometry analysis can be assessed. Climate as the variability of different
weather data over a predefined period can play an essential role in the adaptation of passive
strategies. Understanding the connection between the climate conditions and thermal comfort
requirements can lead to climate responsive design, which can reduce the usage of the active
Figure 5. Workflow of the study.
21BIM to BEM: Development of an integral workflow from Archicad to Energy Evaluation
mechanical systems and rely more on passive strategies (AIA, 2012). Therefore it could be
essential to evaluate how different BPS tools read weather data.
Obtained results were further analyzed at the fifth stage. Comparative analyses evaluate
different BEM software outcomes and explain the possible reasons behind the differences
between the same indicators.
3.1 BPS tools workflow
Three different workflows were used for the case studies. The starting point for all of them is
the one BIM model produced in Archicad (Figure 6).
Figure 6. BPS workflows used for the case studies.
The first workflow includes energy assessment via Energy Evaluation. General information
regarding building location, orientation and climate conditions need to be provided to simulate
building with Energy Evaluation. If BIM model already includes information regarding these
matters, EE automatically uses it and no additional input is required. As a next step, the
building needs to be divided into relevant zones. Zones are spatial units of the building which
later are assigned to specific thermal blocks of EE. Thermal blocks are simply a group of
zones that share an operational profile and mechanical systems. Zones should be placed with
the inner edge method and it should cover all the spaces which need to be evaluated by EE.
Zones created with the inner edge method include area (m²) between the internal edges of the
walls (Graphisoft help center, 2014). After all the zones are assigned to relevant thermal
blocks, BEM model can be created instantly. Some of the final steps include the allocation of
the infiltration, operation profiles and mechanical systems. Infiltration (ACH) needs to be
assigned to each building assembly, such as a wall, roof, floor, windows and doors separately.
All the loads determined in the operational profiles were reduced to zero to evaluate passive
design impacts. HVAC systems were set to “Not yet specified” mode, a demand calculation
mode proposed by EE, which means that systems fulfill all heating and cooling demands as
they arrive during hourly simulation throughout the entire reference year (Graphisoft, 2010).
The second workflow includes energy assessment via Cove.tool. BIM geometry is exported
by CT plugin, which is an add-on for Archicad. According to their type and classification, the
plugin can automatically create a new 3D view where all the building elements are displayed
in different colors. CT only requires basic building elements such as floors, internal and
external walls, windows and shadings, to generate BEM model. After all the assemblies are
22BIM to BEM: Development of an integral workflow from Archicad to Energy Evaluation
classified correctly, geometry can be exported and linked to the CT web page. Additionally,
it creates a quick graph in Archicad’s interface showing approximate EUI loads. CT requires
information regarding the building’s location. The weather file is assigned automatically and
orientation information is taken from the exported BIM model. Other values regarding
thermal envelope, operational schedules, loads, infiltration and HVAC systems are populated
automatically based on the selected building type and code. All the loads were reduced to zero
and the coefficient of the performance (COP) for heating and cooling was reduced to one to
evaluate passive design systems. The Integrated Part Load Value (IPLV), a performance
characteristic used to describe the performance of a chiller capable of capacity modulation,
was set to ”no chiller.”
The third workflow demonstrates the energy simulations performed with Climate Studio. The
geometry, particularly the 3D representation of the zones, is connected to the Grasshopper
through the live link, the add-on for the Archicad. The geometry can be displayed in the Rhino
viewport. After some modifications, zone geometry can be connected to the CS. If the changes
are done in BIM model, geometry in the CT can be updated automatically since there is a live
connection between the add-on and Archicad. As additional information, CS requires the
building’s location, infiltration, operational profiles, loads and HVAC system specifications.
The live link connection is mainly used for design purposes and not for energy modeling.
Therefore, it could be possible that this workflow won’t work for complex geometries. Even
though it is undesirable, an alternative workflow where the geometry will be created in Rhino,
can be offered. Similarly to CS, loads and COP for HVAC systems were reduced to zero and
one respectively for passive systems assessment.
Even though the range of the results provided by selected BPS tools can be extensive, only
the shared outcomes for all of them can be compared.
3.2 Case studies
Three case studies were selected to evaluate the performance of the BPS tools. The first is the
simple shoebox, second and third ones are public and residential buildings, respectively.
Energy simulation can be a complex process, which is influenced by multiple factors. BPS
tools have different methods; hence they read, analyze and interpret data differently.
Consequently, narrowing influencing factors as much as possible for the starting point could
bring to light indicators whose impact could be not noticeable among the vast amount of data
that BPS tools can provide. Based on these assumptions, the shoebox was selected as a starting
point due to its simple geometry and sensitivity analysis based on the significant variables for
the early design stage; the first tier of the three-tier design approach was carried out (Figure
1). Sensitivity analysis could reveal how BPS tools assess the changes between different
variables such as infiltration rate, orientation, window to wall ratio (WWR), thermal envelope
and glazing properties, shading strategies, occupancies and loads. For simplification,
mechanical ventilation was excluded from the shoebox simulations.
Second (POSH the wedding venue) and third (Muskoka residence) case studies are typical
buildings with complex geometry and their BIM models include more data than a simple
shoebox. Therefore, it could be interesting to assess how BPS tools based on different model
integration methods handle BIM to BEM translation.
23BIM to BEM: Development of an integral workflow from Archicad to Energy Evaluation
Simply running BPS without any HVAC and loads can capture the enclosure’s thermal
efficiency and thermal mass effects also account for the solar and transmission factors. The
form and fabric of the envelope remain constant, whereas loads and HVAC systems vary with
occupancy (Kesik and O’Brien, 2019). Moreover, high heat recovery efficiency can be
compromised against the thermal envelope. From the perspective of the passive performance,
it could not be desirable to enroll measures that allow active systems to compromise it (Kesik
and O’Brien, 2019). Thereby, all of the case studies were tested for their passive performance
as a starting point. As a next step, BIM models were simulated with all the inputs that were
disregarded before.
3.2.1 Shoebox
A simple shoebox with two south-oriented windows was modeled in Archicad for the first
case study (Figure 7).
Figure 7. Shoebox geometry.
3.2.1.1 Envelope details
The envelope materials were selected based on the other two case studies (Table 1).
Table 1. Shoebox envelope details
Wall Roof Ground floor
Thick / Thick Thick /
mm Material type / mm Material type mm Material type
Outside
19 Siding wood 22 Galvalume Roof 102 Concrete
13 Air Space 19 Air space 250 Polyurethane
89 Roxul Batts 3 Air barrier 203 Gravel
3 Air barrier 13 Plywood - -
13 Plywood 140 Mineral Batt - -
140 Roxul Batts 140 Roxul Batts - -
13 Plywood 13 Plywood - -
3 Vapour barrier 3 Vapour barrier - -
16 Vapour barrier 38 Structural deck
Inside
24BIM to BEM: Development of an integral workflow from Archicad to Energy Evaluation
3.2.1.2 Loads
The shoebox was assessed as a residential building and it was assumed that it can be fully
occupied from 06:00 to 09:00 and from 17:00 to 24:00. The same schedule was assigned to
equipment and lighting loads. From 24:00 to 06:00 it is assumed that people are sleeping
therefore there is no lighting and equipment load.
Thermal transmittance of the envelope components, glazing specifications, leakage, internal
heat gains and other assumptions made to run the simulation can be seen from (Table 4).
Table 2. Loads for the shoebox
Case study 1 -Shoebox Source
Roof 0.19 BIM
Wall 0.13 BIM
U values / W/m²K
Window 0.6 BIM
Ground floor slab 0.13 BIM
TST / % Window 52 BIM
Roof 0.1 BIM
Wall 0.1 BIM
Air leakage at 50 Pa Window 0.9 BIM
Door 0.9 BIM
Slab 0.1 BIM
Airflow per person / L/s/person -
Ventilation
Airflow per area / L/s/m² -
Air changes per hour / ACH at 50
Total infiltration
Pa 0.1 Custom
Heating / ℃ 20 ASHRAE 140
Temperature setpoints
Cooling / ℃ 26 ASHRAE 140
Heating / ℃ -
Temperature setbacks
Cooling / ℃ -
Human heat gain / W per capita 108 ASHRAE 55
LPD / W/m² 0.5 DIN 18599
Internal heat gains
Equipment / W/m² 1 DIN 18599
Occupancy count / m² per capita 25 Custom
25BIM to BEM: Development of an integral workflow from Archicad to Energy Evaluation
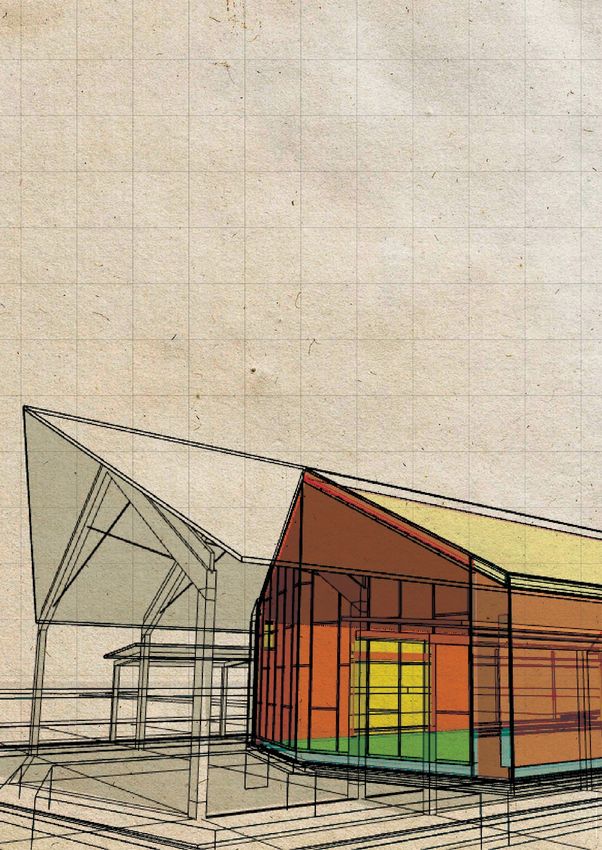
3.2.2 POSH – Wedding venue
POSH is an 1140 m² one-story wedding pavilion and accessory uses in the region of Ontario,
Canada Figure 8. It is classified as a commercial A2 assembly occupancy (“The Ontario
Building Code | Classification of Buildings,” 2018). From the South and East, it is surrounded
by the forest.
The maximum height of the POSH is approximately 10 m. The wedding venue has high
glazed facades towards South, West and North. West curtain walls glazing is shaded with a
large overhang (~ 8.7 m). Glazed sliding doors located on the south and north facades are
shaded with relatively smaller overhang (~ 3.74 m).
Figure 8. POSH - Wedding Venue, render by Enzyme Architecture.
The Wedding venue unites several spaces (Figure 9). The majority of the floor area is
dedicated to the reception and ceremony spaces (~ 980 m²). The rest of the site includes a
small vestibule and cloakroom, storage, WC and the bar. For simplification, the whole
building was assessed as a one-zone and was treated as a reception and ceremony space.
26BIM to BEM: Development of an integral workflow from Archicad to Energy Evaluation
Figure 9. POSH-Wedding Venue floor plan.
3.2.2.1 Envelope details
Table 3 provides detailed information regarding the materials of the thermal envelope.
Table 3. POSH - Thermal envelope details
Wall [type 1] Wall [type 2] Roof
mm Material type mm Material type mm Material type
Outside
19.1 Wood Siding 88.9 Brick 25.4 Seam Metal Roof
19.1 Air space 25.4 Air space 6.4 Cap sheet membrane
152 Rockwool 76.2 Rockwool 6.4 Base sheet membrane
6.4 Air barrier 6.4 Air barrier 12.7 Plywood
6.4 Vapour barrier 19.1 Plywood 228.6 Rockwool
19.1 Plywood 140 Roxul Batts 76.2 Polyisocyanurate
Mineral Fibre
88.9 Batts 6.4 Vapour barrier 6.4 Vapour barrier
15.9 Gypsum Board 15.9 Gypsum board 12.7 Plywood
38.1 Structural deck
Inside
Floor slab
mm Material type
102 Structural concrete
76.2 Polyurethane
203 Gravel
27BIM to BEM: Development of an integral workflow from Archicad to Energy Evaluation
3.2.2.2 Loads
The building is mainly occupied on Friday, Saturday, and Sunday, the whole year-round. The
ceremony usually starts at 11:00 and continues until 24:00. When it comes to occupancy, two
scenarios are possible - 126 and 300 people, respectively. The simulations are carried out for
300 people as it is considered the worst-case scenario with the highest heat gain possibilities.
Thermal transmittance of the envelope components, glazing specifications, leakage, internal
heat gains and other assumptions made to run the simulation can be seen from Table 4.
Table 4. POSH- Specifications and loads
Case study 1 - POSH Wedding Venue Source
Roof 0.09 BIM
Wall 0.11 BIM
Window 0.6 Supplier
U values / W/m²K
Door 0.7 Supplier
Intermediate floor slab 3.6 BIM
Ground floor slab 0.12 BIM
Window 52 Supplier
TST / %
Door 52 Supplier
Roof 0.1 BIM
Wall 0.1 BIM
Air leakage at 50 Pa Window 0.9 BIM
Door 0.9 BIM
Slab 0.1 BIM
Airflow per person / L/s/person 3.8 ASHRAE 62.1
Ventilation
Airflow per area / L/s/m² 0.9 ASHRAE 62.1
Air changes per hour / ACH at 50
Total infiltration
PA 1 Custom
Heating / ℃ 20 ASHRAE 90.1
Temperature setpoints
Cooling / ℃ 26 ASHRAE 90.1
Heating / ℃ 15 Custom
Temperature setbacks
Cooling / ℃ - Custom
Human heat gain / W per capita 126 ASHRAE 55
LPD / W/m² 0.5 DIN 18599
Internal heat gains
Equipment / W/m² 1 DIN 18599
Occupancy count / m² per capita 45 Custom
Hot water load l/day per capita 10 Custom
28You can also read