Renewable Cheaper electricity with - for 2020 for South Africa
←
→
Page content transcription
If your browser does not render page correctly, please read the page content below

Cheaper
electricity with
renewable
energy                           Costing a 15% target
                                 for 2020 for South Africa

with highlights of the WWF National Renewable Energy Conference
Contents

  1 Foreword

  2 Introduction

  6 Costing a 2020 target for 15% renewable electricity in South Africa

 15 WWF National Renewable Energy Conference Programme

 16 The Environmental Goods and Services Forum

 17 South African National Energy Research Institute

 18 Towards a sustainable energy future in the Western Cape

 19 The science and state of renewable energy technologies

 20 Possible challenges to the implementation of cabinet’s directions related to renewables

 22 Resolutions

 28 Living Planet Unit

“This is a welcome initiative. It is good to see such a range of stakeholders
at this important event. We need to increase our ambition for utilising our
abundant renewable energy resources. This will be good for growth and
jobs, as well as the environment. Renewable energy technologies can also
help us to achieve universal access to affordable energy services.”
                                                                 – Minister Buyelwa Sonjica

                               “The Long-Term Mitigation Scenarios (LTMS) process in South Africa tells us that there is
                               not a choice between renewable energy and energy efficiency. To do what is “required by
                               science” we need both. We also need policy that creates the market conditions to make
                               it more profitable to save ourselves than kill ourselves. Science and economics must be
                               applied to improve the well-being of our people, the prosperity of our economy and the
                               future of our planet. Globally, investment in renewable energy is growing faster than any
                               other sector. South Africa has a particular advantage in the abundant sunlight that could
                               be harnessed for industrial-grade electricity and could still become a leading player in this
                               emerging field. The bulk of the investment will come from companies and individuals, but
                               government must act as the catalyst.

Algeria, Kenya, Mauritius and Uganda have beaten us to a renewable energy feed-in tariff (FiT), but the National Energy
Regulator of South Africa has committed to ours being introduced by the end of February 2009. Just like we have to
decouple our economy from ever-increasing resource consumption, we may have to consider a Department for Energy
that is not structurally linked to Minerals. Projects like concentrated solar power (CSP) and Working for Energy, which
address national sustainable development priorities, could be elevated to the status of “flag-ship national initiatives”.
This conference has motivated 15% of electricity come from renewables by 2020. This will require concerted commitment
and enterprise. We will have to ensure that the mandates of our state institutions, including the national utility, the
regulator, research institutes and standards bodies are clearly defined and complimentary with the short- and long-term
interests of our people.”
                                                                                          – Deputy Minister Derek Hanekom
FOREWORD

Dr Morné du Plessis,
CE, WWF South Africa

                                                                                                                                             WWF South Africa
Cheaper electricity
with renewables
By Dr Morné du Plessis, Chief Executive, WWF South Africa

It was with a great deal of expectancy and excitement that        financial resources from across the world to address specific
WWF South Africa organised our first National Renewable           environmental issues.
Energy Conference. The conference was attended by some
of the country’s leading experts in the field, as well as by      WWF South Africa is participating in a number of these
senior representatives of government, including the Minister      Network Initiatives. This conference was convened in the
of Mineral and Energy Affairs, Buyelwa Sonjica, and the           context of the New Global Climate Deal. The primary
Deputy Minister of Science and Technology, Derek Hanekom.         objective of this initiative is to ensure that an effective and
The presentations and subsequent working group discussions        equitable multilateral agreement is negotiated by parties to
– as reflected in this document – provide concrete suggestions    the UN Framework Convention on Climate Change by the
for South Africa to initiate the Cabinet-mandated transition to   end of 2009 and ratified by the end of 2012. South Africa
a low-carbon economy and society.                                 has been identified as one of 11 priority countries in this
                                                                  Network Initiative and has enormous potential for early action,
This Conference, with other initiatives for the reduction of      as demonstrated by the research report launched at the
South Africa’s ecological footprint, represents a shift in the    Conference and featured in this document.
focus of WWF South Africa. From concentrating primarily
on the conservation of the country’s biodiversity and             In order to participate effectively in these Network Initiatives,
environmental resources, the organisation is increasingly         WWF South Africa has embarked on a process of internal
engaging proactively with government, the private sector          restructuring, which includes the creation of a Living Planet
and civil society to promote economic growth and social           Unit. This Unit, which comprises of a Climate Change and a
development in a manner that is both equitable and                Trade and Industry Programme, with a Business and Industry
environmentally sustainable.                                      Programme in development, will play a leading role in WWF
                                                                  activities to address environmental sustainability and the
This is in line with developments taking place in WWF offices     ecological footprint of South Africa.
across the world. The world’s largest independent conservation
organisation recently dedicated itself to the twin goals of       It is my sincere hope that this publication and events such
protecting ecological capital and reducing humanity’s             as the National Renewable Energy Conference contribute
footprint. In order to achieve these objectives, WWF focuses      substantially to the transformation of South Africa’s economy
its global efforts on key Network Initiatives – the main thrust   and development pathway, to realise a future in which – in line
of these efforts is to mobilise significant levels of human and   with WWF’s mission – humans can live in harmony with nature.

                                                                                             Cheaper electricity with renewable energy | 1
INTRODUCTION

Sustainable energy is more
cost-effective for the nation
By Richard Worthington, WWF Climate Change Manager

South Africa has about a quarter of the world’s best sunlight of all land mass (around 25% of
the highest category of insolation, i.e. solar power potential). This national resource, as well as
bountiful wind, ocean, sustainable biomass and locally relevant micro-hydro energy is ever present,
but effectively ignored. The enormous socioeconomic value that can be realised by capitalising
upon our renewable energy resources, at all levels, demands clear and urgent action.

Under current market conditions, it takes longer to realise        What is the appropriate level of ambition for growing our
financial returns on renewable energy investments than on          sustainable energy sector?
fossil fuels. We are only starting to recognise our potential to
join market leaders in renewable energy technologies (RETs),       The resolutions articulating the output of the working groups
which are still enjoying the strongest global growth. If we want   and plenary sessions, adopted by consensus and serving as
the local benefits and competitive positioning offered by a        the mandate for a “short-term task force” (an aspirational title
substantial RET industry, we need concerted action to grow         for a small group of volunteers) appear on page 23. There was
from what is currently a very small base.                          some trepidation about ambitions for institutional
                                                                   rationalisation, such as liberating energy from the minerals
The electricity sector is the obvious spring-board for RET         sector by splitting a department, but no hesitation in endorsing
growth in South Africa, as the social costs of operating our       the 15% by 2020 target for electricity from renewable energy
current electricity generation technology are as extensive as      and the Working for Energy programme for meeting broader
the economic opportunities of starting to harness our              energisation and livelihoods objectives.
renewable resources. Consistently higher employment rates
in RET generation alone justify an ambitious RE programme.         The costing research was commissioned by the Climate
As a focused Sustainable Development Policy and enabling           Change Programme of WWF South Africa, which is also part
Measure (SD-PAM in climate-speak), it will provide a clear         of the WWF International New Global Climate Deal Network
case for the kind of international support promised in climate     Initiative, within a project called SNAPP: Supporting National
change negotiations. We have so much potential; we just            Assessment of Policy Proposals for an effective and equitable
need to count the costs to see why and how we can                  post-2012 multilateral agreement on climate change. SNAPP
mobilise investments.                                              is a partnership of WWF offices in Brazil, China, India and
                                                                   South Africa, with some financial support from the European
In this context, WWF South Africa in 2008 decided to convene       Commission. The event was also supported by Norwegian
a national conference. It started as a ‘symposium’ to launch a     (NORAD) funding of the Global Deal Network Initiative and
research report: modelling the costs of an ambitious renewable     kindly hosted by Nedbank.
energy target for South Africa for electricity generation under
recent market conditions, building on the work of the Cabinet-     South Africa has been playing a significant role in climate
mandated Long-Term Mitigation Scenarios process (LTMS).            negotiations, being the first developing country to openly
With the Department of Minerals and Energy (DME) having            contemplate international “commitments” to mitigation1 –
postponed the National Summit that was planned to review the       seeking to break the stand-off between ‘North and South’.
2003 White Paper on Renewable Energy, the level of interest        The government statement of 28 July, reporting on a Cabinet
and support through the WWF network, we held a successful          Lekgotla that considered the LTMS, has received wide
two-day event attended by representatives of civil society,        recognition as an innovative and appropriate developing
business and industry and government.                              country leadership position. However, there is a growing
                                                                   urgency for domestic policy to come in line with international
The main challenge was to what extent we could say: “Yes,          positioning. For us to walk the talk, we need to start
we can.” (It was the week in which an election was inspiringly     implementing our policy commitments.
won.) What do we really want to achieve and how quickly
can we start to realise the benefits of sustainable energy         1 In climate-speak we now talk of NAMAs (Nationally Appropriate Mitigation Actions) that
                                                                   are MRV (Measurable, Reportable and Verifiable) as part of the new deal, that must include
investments? What are the barriers and how best do we make
                                                                   support form the developed countries (as listed in Annex II of the Convention – UNFCCC)
the case for the policies and measures that overcome them?         that is also MRV.

2 | Cheaper electricity with renewable energy
INTRODUCTION

                                                                                                                                                                           © Martin Harvey / WWF-Canon
  The ruling party’s 2007 Polokwane Resolution on Climate                • “Setting similar targets for electricity generated from both
  Change is encouraging, with resolutions to “…promote                     renewable and nuclear energy sources by the end of the
  the realignment of institutional mechanisms which will fast              next two decades.”
  track the utilisation of renewable energy…” and “Escalate
  our national efforts towards … an ambitious renewable                  Given the context of the target (at that time) of 20 000 MW of
  energy target.”                                                        nuclear plant by 2025 within a total capacity of 80 000 MW,
                                                                         this means a renewable target similar to a quarter of total
  However, the 1998 White Paper on Energy Policy for the                 supply in 2028.
  Republic of South Africa (WPEP’98) was already quite specific:
  “Government policy on renewable energy is thus concerned               This should signal that we are ready to shift from the easy,
  with meeting the following challenges:                                 short-term profits offered to fossil fuel users through
  • ensuring that economically feasible technologies and                 externalisation of real costs. However, the ‘Externalities Study’
    applications are implemented;                                        that was intended to inform Integrated Energy Planning (IEP),
  • ensuring that an equitable level of national resources is            which the DME twice put out to tender, was “put into
    invested in renewable technologies, given their potential            abeyance” along with the whole IEP process, in September
    and compared to investments in other energy supply                   2006. Both should be resumed as a matter of urgency.
    options; and
  • addressing constraints on the development of the                     Lack of robust data should not, however, blunt our ambition.
    renewable industry.”                                                 International trends are clear enough. The Living Planet
                                                                         Report clearly indicates the unsustainability of traditional
  This is taken up in the July 2008 statement calling for:               development pathways, with energy being the greatest
  • “Laying the basis for a net zero-carbon electricity sector in        contributor to a global footprint 30% higher than the carrying
    the long term”, and                                                  capacity of our planet:

  Living Planet Index (of global biodiversity), 1970–2005                Humanity’s Ecological Footprint, 1970–2005

                   1.8                                                                          1.8

                   1.6                                                                          1.6

                   1.4                                                                          1.4
                                                                      Number of planet Earths

                   1.2                                                                          1.2
Index (1970=1.0)

                                                                                                             World biocapacity
                   1.0                                                                          1.0

                   0.8                                                                          0.8

                   0.6                                                                          0.6

                   0.4                                                                          0.4

                   0.2                                                                          0.2

                    0                                                                            0
                         1960   1970   1980    1990         2000 05                                   1960        1970           1980          1990          2000 05

                                                                                                                           Cheaper electricity with renewable energy | 3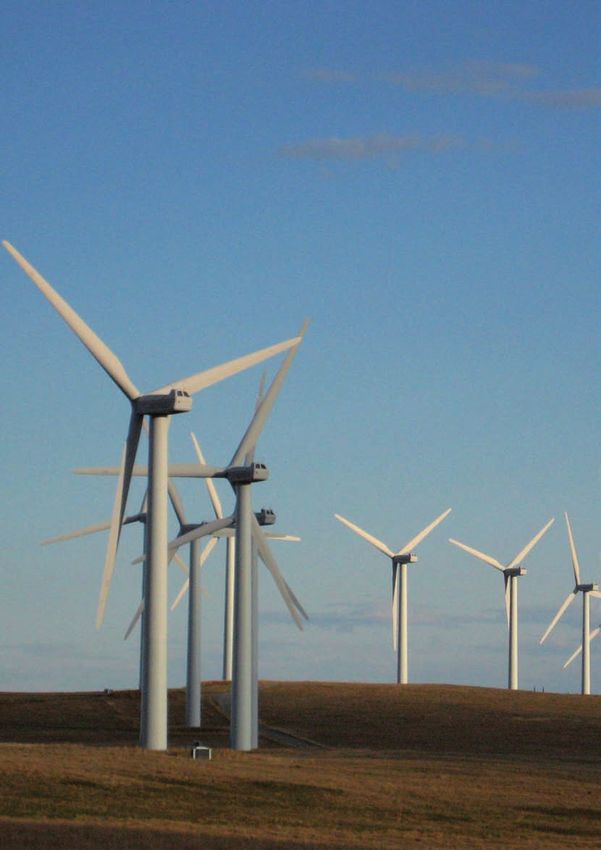
INTRODUCTION

      The report also provides a sketch of the global solutions,                                                                                burning of fossil fuels. The most resource-efficient means of
      based on the work of several expert panels, including input by                                                                            meeting transport service needs with available technology
      the International Energy Agency:                                                                                                          and infrastructure requires the inherent energy-efficiency of
                                                                                                                                                electric motors. Expanding the role of electricity as an energy
                                                                                                                                                carrier in the national supply mix provides a further imperative
      Output of the WWF Climate Solutions Model                                                                                                 for sustainable and clean generation options. Their potential
                                1 000
                                                                                                               A1B final energy demand          for relatively rapid delivery (short project lead-times) means
                                                               Energy efficiency and demand reduction
                                                                                                                                                we won’t need new coal-fired plants to electrify transport.
                                                               Conventional fossil fuels
                                                 800           Nuclear
                                                                                                                                                The case for renewable energy is particularly strong under the
Final energy supplied or avoided (EJ per year)

                                                               Zero- and low-emission wedges
                                                               Natural gas instead of coal for baseload
                                                                                                                                                paradigm of a developmental state, since the opportunities
                                                 600                                                                                            for local community participation, maximising the use of
                                                                                                      WWF scenario final energy demand
                                                                                                                                                locally owned resources, is consistently higher than for
                                                 400
                                                                                                                                                ‘stock’ or finite energy sources (fossil and nuclear fuels).
                                                                                                                                                Additionally, the direct employment benefits are indicated by
                                                                                                                                                a study conducted by AGAMA Energy in 2005, which found
                                                 200
                                                                                                                                                the following rates of job creation, shown per unit of installed
                                                                                                                                                generation capacity and against electricity despatched:
                                                   0

                                                                             Contingent supply from wedges exceeds demand                       Conventional     Direct jobs per      Renewable       Direct jobs per
                                                                                        and is represented below the zero line                  energy           MW         GWh       energy          MW         GWh
                                                 -200                                                                                           technologies     capacity   generated technologies    capacity   generated
                                                        1990         2000           2010          2020        2030          2040         2050
                                                                                                                                                Coal (current)      1.7        0.3    Solar Thermal      5.9       10.4
                                                                                                                                                Coal (future)       3.0        0.7    Solar PV          35.4       62.0
                                                                                                                                                Nuclear             0.5        0.1    Wind               4.8       12.6
      WWF South Africa’s Living Planet Unit has identified
                                                                                                                                                Nuclear PBMR        1.3        0.2    Biomass            1.0        5.6
      renewable energy as a top priority, not only to serve traditional
                                                                                                                                                Gas                 1.2        0.1    Landfills          6.0       23.0
      electricity demand and energisation2 goals, but also for
      sustainable transport solutions. Mobility of the populace
      is not well served by the inefficient internal combustion                                                                                 There are, however, many who would still restrict renewable
      engine, nor are our lungs, water or soil well served by the                                                                               energy to ‘niche’ applications. The conference identified
                                                                                                                                                several myths about renewable energy options that are still
      2 ‘Energisation’ is an objective of WPEP’98 – ensuring that all South Africans have access to
                                                                                                                                                peddled in the corridors of power (see page 23). Putting
      appropriate and affordable energy services for basic needs and productive activity.                                                       public benefit before profit is a prevailing political challenge

      “If we continue with
      business-as-usual,
      we will go out of business.”
                                                                                                                                                 – Marthinus van Schalkwyk, Minister of Environmental Affairs

      4 | Cheaper electricity with renewable energy
INTRODUCTION

 in all fields of endeavour, but nowhere more urgent than          South Africa, as a developing country. Given the need for
 in how we access energy. The confluence of fossil fuel            global emissions to peak in 2015 and to be reduced from
 impacts and price volatility (not to mention military spending    1990 levels by 80% by 2050, the proposal for South Africa
 to secure access) make a compelling case for rejecting            to reduce to 300Mt per annum between 2050 and 2060 is
 business-as-usual. Fortunately we can reverse the depletion       indeed the least we must achieve. Perhaps most significant
 of natural capital with market-corrective measures, such as       is the LTMS conclusion that there is only one credible future
 South Africa’s promised levy on non-renewable electricity         scenario for South Africa: to transform in line with what is
 generation. There is also growing coherence around new            ‘Required by Science’. In the words of Minister Marthinus
 paradigms for our global financial architecture emerging          van Schalkwyk, “If we continue with business-as-usual, we
 through climate change negotiations.                              will go out of business.”

 The modelling work of the University of Cape Town’s Energy        This latest research report simply indicates how an ambitious
 Research Council (ERC), particularly the rigorous work for        medium-term renewable energy target, as part of an
 the LTMS, has confirmed civil society’s long-held conviction      intervention that includes improved efficiency, could actually
 that a just transition to sustainable energy supply is not more   reduce the escalation of electricity prices, assuming some
 expensive for the nation, but rather more cost-effective.         accounting of the costs of carbon emissions. The Working
 This work emboldened Cabinet to commit to stabilising             for Energy programme suggests that the same trend can
 national greenhouse gas emissions between 2020 and 2025.          be brought to bear on non-electric energy service delivery
 A presentation at the December 2008 negotiations under the        through renewable inputs. If we start now “ensuring that an
 UN Framework Convention on Climate Change suggested               equitable level of national resources is invested in renewable
 that emissions should plateau at 550 Mt CO2 equivalent.           technologies” (WPEP’98), we will quickly realise a range of
                                                                   local benefits and soon attract international investment.
 The LTMS graph below shows in red the emissions range that
 South Africa is proposing to stay within, given international     The key message that we hope this publication will convey is
 support. This overlays a number of possible emissions             that we can afford to make renewable energy development
 trajectories, from unrestricted business-as-usual at the top,     a leading national priority, even without carbon finance.
 through reductions expected from three sets of interventions      Moreover, commitment to an ambitious medium-term target
 improving on current development plans, to the lowest band        can attract international financial support for our sustainable
 in blue, which would bring us broadly in line with reductions     development.
 required within an effective international mitigation effort.

 Even the lowest emissions trajectory – reducing to about half
 of current emissions by 2050 – assumes a lot of leeway for

 LTMS modelled and proposed emissions trajectories

            1 800
                                                                                                                      Growth without
                                                                                                                      constraints
            1 600
                                                                                                                      Current
                                                                                                                      development
            1 400                                                                                                     path

            1 200

                                                                                                                      Start now
            1 000
Mt CO2-eq

             800                                                                                                      Scale up

             600                                                                                                      Use the Market

                                                                                                                      GHG reduction
                                                                                                                      and limits
             400

                                                                                                                      Required by
             200                                                                                                      Science

               0
               1990      2000              2010             2020    2025    2030      2035    2040                 2050                 2060

                                                                                              Cheaper electricity with renewable energy | 5
STUDY OVERVIEW

Costing a 2020 target for
15% renewable electricity
in South Africa
An overview of the report of the independent study undertaken by Dr Andrew Marquard, Bruno Merven and Emily Tyler,
Energy Research Centre, University of Cape Town

                                                                                                                     © Patricia Buckley / WWF-Canada

6 | Cheaper electricity with renewable energy
STUDY OVERVIEW

EXECUTIVE SUMMARY

The study explores the implications of a renewable energy (RE) target for South Africa to generate
15% of electricity from renewable resources by 2020. We report on the effects of 15% renewable
electricity on the total cost of electricity production, investment in electricity infrastructure, and
national greenhouse gas emissions. Achieving such a target will pose institutional, financial and
policy challenges and several options were considered. The two most promising technologies for
South African conditions are wind and solar thermal electricity.

The study used the modelling framework of the recently-             study indicates that the renewables option is cheaper than
completed Long-Term Mitigation Scenarios (LTMS). During             nuclear. Indeed, if partner programmes such as efficiency are
the course of the study, new research on wind resources             also implemented, the overall cost of renewables will be lower
in South Africa was encountered which indicates that the            than business-as-usual.
potential for wind power is far greater than previously thought.
Since these findings are relatively new, both the LTMS              Four areas were identified where partner programmes would
assumptions and the new assumptions were used to get a              help reduce costs:
range of costs for a large-scale wind energy programme.             • research and development;
                                                                    • infrastructure development;
A number of scenarios were modelled to explore various              • industrial strategy; and
ways in which the target of 15% could be met, what impact           • energy efficiency.
high or low wind resource assumptions had on the target,
and what impact an energy efficiency programme would have           An industrial strategy based on a) increasing the local content
on the costs of the target. The most promising scenario is a        of renewables plants, and b) developing a competitive edge
mix of solar thermal and wind, which benefits both from the         in solar thermal technology internationally, would funnel
lower cost of wind and the ability of solar thermal plants to       much of this investment back into the local economy. This
contribute to peak demand.                                          would create more jobs than current plans and ultimately earn
                                                                    significant export revenue as the rest of the world attaches
                                                                    much greater value to low-carbon energy sources. If carbon
 Key findings:                                                      finance is added, the picture becomes even more positive.
 • Reaching a 15% renewable target by 2020 will not cost            Tradable ‘white’ certificates for energy savings are another
   the earth: by 2020 average electricity costs will only           promising option for financing the numerous benefits of
   be slightly higher (about 15%) than the baseline (the            efficiency, including: creating employment, saving the country
   business-as-usual scenario).                                     money and avoiding the risk of blackouts up to at least 2012.

 • Combined with an energy efficiency programme,                    The main challenge – financing the renewable electricity
   average electricity costs will be lower than the baseline        programme – could be accomplished through a feed-in tariff,
   for most of the 2015-2020 period.                                tradable renewable energy certificates, international climate-
 • With the addition of carbon finance for both the                 related finance, and subsidies for technology development.
   efficiency programme and the renewable programme,                Support for technology, finance and capacity for developing
   average electricity costs will drop to 18% below the             countries is promised as part of the future of the international
   baseline by 2020.                                                climate agreement, due to be negotiated by end of 2009.
                                                                    In order to meet the target, however, planning should start
                                                                    immediately and conclude by 2010. Optimal implementation
Emissions reductions for all RE scenarios were similar:             would require sophisticated policymaking and a high degree
around 165 Mt of CO2-eq over the period (2006-2020), with           of coordination between key stakeholders.
reductions of up to 400Mt when combined with an energy
efficiency programme. By 2020, annual greenhouse gas                South Africa has the necessary institutional, technical and
(GHG) emissions reductions from achieving the RE target             physical infrastructure to achieve this. Committing the nation
would be 14% for the electricity sector, constituting 6.5% of       to such a target would give substance to South Africa’s
total national emissions.                                           leading position on international climate change response.
                                                                    It would make renewables, possibly packaged as a set of
The modelling indicates that by itself, such a programme            Sustainable Development Policies and Measures (SD-PAMs),
would have less of an impact on the electricity price than the      part of measurable, reportable and verifiable (MRV) mitigation
2008 tariff increase. The alternatives to electricity supply from   actions, which would thus qualify for the MRV support
coal in South Africa are renewable energy and nuclear. This         promised to developing countries in Bali in December 2007.

                                                                                               Cheaper electricity with renewable energy | 7
STUDY OVERVIEW

                                                © Adam Oswell / WWF-Canon

8 | Cheaper electricity with renewable energy
STUDY OVERVIEW
Explaining a 2020 target for
15% renewable electricity
Further details of the scenarios and modelling results:
The model of the South African energy system used for ELECTRICITY SUPPLY: THE DIFFERENT
this study is a partial equilibrium linear optimisation model SCENARIOS
developed by the Energy Research Centre (ERC) of the (All numbering of tables and graphs as per full research report)
University of Cape Town for the LTMS Scenario Building Team
(Hughes et al 2007; Winkler 2007). The modelling platform Three cases for 15% renewable supply were modelled:
used is MARKAL, developed by the International Energy • Case 1: Wind power modelling using the same
Agency (IEA). MARKAL is an optimising model: subject to assumptions as the LTMS on South Africa’s wind resource.
available resources and a set of required energy services • Case 2: Wind power modelling using new and more
specified by the modelling team, the model determines optimistic research on South Africa’s wind resource.
the optimal configuration of the energy system in terms of • Case 3: Model constrained to use an equal amount of
an objective function, usually to minimise costs, subject wind and Concentrating Solar Power (CPS) using the more
to constraints. The model ensures that energy system optimistic wind resource assumptions.
requirements are met, e.g. that energy demand is equal to • Cases 1A, 2A and 3A: same as above, but in conjunction
supply; that a specified reserve margin is maintained and that with a demand-side (consumer use) energy efficiency
technologies have a limited life. programme.
It was assumed that delivery of the target will begin in 2015, The model, in the reference case (the baseline), shows
when the first new renewable plants will come online and additional capacity of just over 12GW required up to 2020.
produce 2.5% of South Africa’s electricity, which will increase Wind options require more installed capacity to ensure the
linearly until reaching 15% in 2020. Earlier implementation at same availability. In the scenarios without energy efficiency,
scale would require (given plant availability assumed in the between 43% and 76% of new coal capacity is displaced
model) shutting down existing plants or postponing planned (depending on the different share of wind and therefore
investment. of additional peaking capacity required) and with energy
efficiency, this rises to between 57% and 94%.
The extremely low reserve margin between now and 2014
suggests scope for a significant pilot programme, as well Table 2 – New generation capacity in GigaWatts (GW) for each
as for deployment of smaller-scale renewable technologies scenario, commissioned from 2015-2020
such as biomass plants. For the first plants to come online Coal Wind Solar % new coal
in 2015, the planning process for wind would have to begin thermal displaced
around 2010 and possibly before this for solar thermal plants, Reference 12.17 0.00 0.00 –
given the lead time of new plants and the requirement to Case 1 2.94 8.76 6.90 76%
undertake planning and environmental impact assessments Case 2 6.92 18.27 0.00 43%
(EIA). Another important factor is technology learning: we Case 3 4.03 9.08 5.09 67%
have used the same model for technology learning developed Case 1A 0.74 5.76 7.26 94%
for the LTMS, but have used more conservative assumptions Case 2A 5.19 16.43 0.00 57%
for wind energy from the IEA’s 2008 Energy Technology Case 3A 2.51 8.29 4.59 79%
Perspectives. Nevertheless, by 2015 renewable technology is,
in the model, considerably cheaper than it is today. Table 3 – Reserve margin, peak demand and installed capacity
AF reserve Peak demand Total installed
Since it would be perverse for any government to set such a margin1 (GW) capacity (GW)
target (involving additional costs) without also implementing Reference 15% 57.48 66.18
an energy efficiency programme (which lowers demand Case 1 14% 57.48 72.61
and defers investment, thus lowering costs), we have also Case 2 18% 57.48 79.2
modelled some combined efficiency and renewable options Case 3 16% 57.48 72.21
to investigate the impact on the costs of the target within Case 1A 15% 53.04 65.6
such a programme. The impact of the energy efficiency Case 2A 19% 53.04 73.46
programme is significant, resulting in the postponement of Case 3A 17% 53.04 67.23
the second planned new coal plant. We have also modelled Nuclear 15% 57.48 66.46
a nuclear alternative, to investigate the comparative costs of Nuclear efficiency 17% 53.04 62.39
a nuclear and a renewable programme up to 2020. Although
government has called for both technologies in the South
African system, it is unlikely that both a renewable and a
1 In calculating the reserve margin (the spare generation capacity), an Availability Factor
nuclear programme can be accommodated up to 2020 (AF) has been used to add built capacity, which is 1 for all plant except wind, where it is 0.23
without underutilising generation capacity. for the lower resource estimate, and 0.39 for the higher availability factor.
Cheaper electricity with renewable energy | 9STUDY OVERVIEW
COSTS AND INVESTMENT REQUIREMENTS (All numbering of tables and graphs as per full research report)
Costs have been calculated in several ways, to make as The impact of carbon finance on the average cost of electricity
detailed a comparison as possible between the different is calculated for Cases 1 to 3, using two carbon prices: 10 euros
scenarios. Two basic approaches have been used. The per tonne, and 20 euros per tonne (in current terms).
first is the method used in the LTMS to estimate the cost of
mitigation (measured in R/tonne of CO2-eq mitigated). This All costs are expressed in 2003 Rands. Costs can be
approach uses the total incremental system costs, which converted to 2008 Rands by multiplying by the relevant PPI
are annualised (discounted and then levellised), and then ratio (in this case, about 180/124, where 180 is an estimate of
divided by the total average CO2-eq mitigated, which is an the PPI for 2008).
internationally-accepted approach for comparing mitigation
costs of alternative measures. The second approach uses the The mitigation costing shows changes from the reference
model output (capacity expansion and electricity production) case both in terms of an average cost (or cost saving
to calculate direct costs in the electricity sector from the input with efficiency) per tonne of avoided CO2 emissions, and
costs. Three cost measures are described below: as a change in the over-all cost of electricity supply as a
percentage of GDP (as an annual average over the modelled
1. Investment costs, which represent the present value of period). The savings come not only from avoided electricity
investment in the year before a new plant is commissioned. investment and production, but also because less renewable
These form a good basis for comparing investment capacity would be required to meet the 15% target due to the
requirements, but are only an approximate reflection of the lower baseline.
timing of the investment. (Due to the lower lead time for
renewables, these are more accurately reflected, whereas Table 7 – Mitigation costs using annualised total incremental
the timing of coal investments, for example, is inaccurately system costs
close to the point at which the capacity comes online.) Rands per tonne Incremental costs
as a % of GDP
2. Total undiscounted annual electricity production costs, Case 1 R141 0.10%
consisting of annual fuel costs, annual operation and Case 2 R101 0.08%
maintenance costs, and annualised capital costs for new Case 3 R104 0.08%
capacity (over the period of the lifetime of a new plant). This Case 1A -R32 -0.05%
provides a useful indicator of the difference between costs Case 2A -R37 -0.07%
in the reference case and the other cases. Case 3A -R39 -0.07%
Nuclear R105 0.09%
3. Average annual electricity production costs per kWh Nuclear efficiency -R17 -0.03%
– costs in (2) are used to calculate average annual cost of Efficiency alone -123 -0.14%
production per kWh, which is a proxy for understanding the
impact of the target on the electricity price. It is not possible Investment requirements are identical until 2012, when the
to predict the electricity price from the model output, since scenarios begin to diverge. In the efficiency scenario, due to
this depends on regulatory policy and accounting policy, the delay of a new plant from 2013 because of lower demand,
but this cost is a useful indicator of a price trend for the investment levels are considerably lower than in the reference
energy component of the electricity price, which in 2004 case (only investments required in the electricity sector have
was around 60% of the average electricity price. been considered).
10 | Cheaper electricity with renewable energySTUDY OVERVIEW
Table 8 – Power sector investment requirement, 2012–2019 (millions of 2003 Rands)
2012 2013 2014 2015 2016 2017 2018 2019
Reference 27 283 38 480 28 701 18 332 21 487 22 388 23 284 23 959
Case 1 27 283 38 480 42 283 40 124 46 747 49 156 52 599 55 048
Case 2 27 283 38 480 43 766 32 426 35 834 33 669 36 305 37 449
Case 3 27 283 38 480 39 768 45 094 36 407 41 397 44 776 46 001
Case 1A 19 302 22 785 24 531 34 378 44 621 46 299 48 417 50 929
Case 2A 19 302 22 785 29 842 29 500 33 129 29 541 31 697 33 140
Case 3A 19 302 22 785 26 925 34 448 37 158 38 601 39 743 40 850
Nuclear 27 283 38 480 28 894 29 896 39 617 41 400 42 985 44 768
Nuclear efficiency 19 302 22 785 13 248 33 478 47 541 38 033 37 835 39 221
Efficiency alone 19 302 22 785 18 789 15 540 18 680 19 482 20 279 21 071
Investment costs
The impacts on the investment costs of electricity generation of eight variations, shown below, from the reference case (business-
as-usual) up to 2020, are indicative of the ‘front-loading’, or high initial capital costs of renewable energy technology deployment.
Figure 9 – Percentage increase in investment costs for Cases 1 to Figure 10 – Percentage increase in investment costs for Cases 1A
3 and nuclear to 3A and nuclear efficiency
160% 140%
120%
140%
100%
120% 80%
100% 60%
40%
80%
20%
60% 0%
40% -20%
-40%
20%
-60%
0% -80%
2013 2014 2015 2016 2017 2018 2019 2013 2014 2015 2016 2017 2018 2019
Case 1 Case 2 Case 3 Nuclear Case 1A Case 2A Case 3A Nuclear efficiency
Total annual electricity production costs
When capital costs are spread over the lifetime of the plant, to portray annual electricity production costs relative to the reference
case, nuclear costs are the highest by 2020, which is a result of the combined impact of escalating nuclear fuel prices and the
assumption that no technological learning takes place (the observed trend in relation to costs). With the efficiency programme,
the total costs only exceed the reference case in 2018, whereas without the efficiency case, costs are 15 – 20% higher by 2020.
Figure 11 – Percentage increase in total annual electricity Figure 12 – Percentage increase in total annual production costs,
production costs, Cases 1 to 3 and nuclear Cases 1A to 3A, nuclear efficiency and efficiency alone
25% 15%
10%
20%
5%
15%
0%
-5%
10%
-10%
5%
-15%
0% -20%
2012 2013 2014 2015 2016 2017 2018 2019 2020 2012 2013 2014 2015 2016 2017 2018 2019 2020
Case 1 Case 2 Case 3 Nuclear Case 1A Case 2A Case 3A
Nuclear efficiency Efficiency alone
Cheaper electricity with renewable energy | 11STUDY OVERVIEW
Average cost per kWh CARBON FINANCE
This indicator is a proxy for price increases. The actual (The international trading of carbon credits)
average price increase would be significantly lower, as
this analysis is concerned only with the cost of producing Up to end 2012 the Clean Development Mechanism provides
electricity and not with the transmission or distribution costs. a revenue stream for both renewable energy and efficiency
In the reference scenario, the cost of producing electricity interventions; thereafter a more robust carbon market,
increases by 2.13 times from 2006 to 2020 in real terms. In including sectoral options, is anticipated under the post-2012
other cases, the increase is greater: between 2.45 and 2.56 multilateral climate change regime, scheduled to be agreed in
times for the renewable scenarios, and 2.57 for the nuclear Copenhagen in December 2009. This could be complimented
scenario, without efficiency. For the efficiency scenarios, by a domestic carbon tax. A carbon price of Euro 10/tonne
the increase is between 2.34 and 2.42 for the renewables CO2 in 2012 is widely considered to be conservative and
scenarios, and 2.54 for the nuclear scenario: major price escalation can be expected by the end of the
modelled period. All avoided coal emissions were paid at the
Figure 4 – Percentage change from reference in average cost of average rate of avoided emissions per kWh for all three
electricity for Cases 1A to 3A and nuclear efficiency scenarios, which was 1.058 kg/kWh of renewable electricity
25% generated.
20% Figure 17 – Impact of a Euro 10 carbon price on the % change from
reference in average cost of electricity for Cases 1A to
15% 3A (with carbon finance for energy efficiency as well)
2%
10%
0%
5%
-2%
0%
-4%
-5% -6%
-10% -8%
2012 2013 2014 2015 2016 2017 2018 2019 2020
-10%
Case 1A Case 2A Case 3A
Nuclear efficiency Efficiency alone -12%
-14%
2012 2013 2014 2015 2016 2017 2018 2019 2020
Case 1A Case 2A Case 3A
Figure 18 – Impact of a Euro 20 carbon price on the % change from
reference in average cost of electricity for Cases 1A to
3A (with carbon finance for energy efficiency as well)
A clear, certain 0%
-2%
and mandatory -4%
-6%
target is crucial to
-8%
-10%
-12%
the success of the -14%
-16%
renewable energy -18%
-20%
programme.
2012 2013 2014 2015 2016 2017 2018 2019 2020
Case 1A Case 2A Case 3A
12 | Cheaper electricity with renewable energySTUDY OVERVIEW
CONCLUSION
(verbatim from the independent study)
A renewable energy target of 15% for 2020 comprising explore a potential programme in more detail,
wind and solar thermal energy, particularly if especially in terms of investment requirements and
combined with partner programmes such as an mechanisms. Other areas which could be explored
energy efficiency programme, will provide significant include technical options such as storage systems,
greenhouse gas mitigation, together with air quality, more in-depth analysis of risks associated with power
health and ecosystem service co-benefits to South sector investments (including using other approaches
Africa. There are also opportunities for the country such as portfolio approaches, and assessing the
to develop a competitive advantage in solar thermal risks arising from current investment patterns),
technologies, and establish South African industry and as well as the implications of different planning
technicians as front-runners in this area of the rapidly approaches emphasising distributed generation.
expanding international renewable energy sector.
Figure 19 gives an indication of the impact of two
The additional costs are likely to be financed different levels of carbon price on the levellised
predominantly through carbon markets, or supported cost of 35% availability wind. The impact on solar
as an SD-PAM, and could also be offset against thermal plants would be similar, i.e. the levellised
savings from energy efficiency. Remaining additional costs would be reduced by the same amount.
costs can be allocated to electricity consumers.
Figure 19 – Impact of carbon finance on levellised costs of wind
There is also scope for direct grant funding from
government for technology development programmes. 45
40
A clear, certain and mandatory target is crucial to the
success of the RE programme. This target must be 35
supported by a well developed regulatory framework. 30
2003 cents/kWh
It is proposed that this framework is comprised of a
25
feed-in tariff for wind in the first instance, extended
to solar thermal once the tariff mechanism is proven, 20
combined with subsidies and tax incentives for the 15
development of the solar thermal technology, and
10
investment in expertise, capacity and capability as
leaders in this international sector. An energy efficiency 5
trading scheme is proposed as the foundation for 0
achieving the industrial energy efficiency target. 2010 2011 2012 2013 2014 2015 2016 2017 2018 2019 2020
Wind 35% Euro 20 carbon finance Nuclear PWR
While this study makes the general case for Wind 35% Euro 10 carbon finance Coal SCC
considering such a target, further studies should Wind 35% no carbon finance
© Adam Oswell / WWF-Canon
Cheaper electricity with renewable energy | 13WWF National Renewable Energy Conference
1
3 4
Pictured from left to right: 6
1. Saliem Fakir, Head: Living Planet Unit, WWF-SA.
2. Alistair Schorn, International Programme
Manager, WWF-SA; Richard Worthington,
Climate Change Manager, WWF-SA; Cheryl
Carolus, Executive Chairperson of Peotona
Group Holdings; Simon Steward, Managing
Director of Suregas; Jenny Williams, Corporate
Relations, WWF-SA; Tasneem Essop,
International Climate Policy Advocate,
WWF-SA; Peet du Plooy, Trade and Investment
Advisor, WWF-SA; and Dr Morné du Plessis,
CE of WWF-SA.
3. Cheryl Carolus, Executive Chairperson of
Peotona Group Holdings.
4. Kevin Whitfield, Head: Nedbank Capital;
Christina Golino, Unit Manager: Knowledge
Management, (DBSA); Bishop Geoff Davies,
Coordinator of the Southern African Faith
Communities’ Environment Institute; Brigitte
Burnett, Head: Sustainability Within the
Cluster Enterprise, Governance & Compliance,
Nedbank.
5. Noma Qase, Director for New and Renewable
Energy, Department of Minerals and Energy,
and Dr Guy Preston, Working for Water.
6. See pictures 2 and 4 for details.
7. Minister Buyelwa Sonjica, Department of
Minerals and Energy.
14 | Cheaper electricity with renewable energyWWF National Renewable Energy Conference
2 THURSDAY 6th – DAY 1
10:00 Welcome: Richard Worthington, WWF Living Planet Unit
10:15 Keynote address: Deputy Minister Derek Hanekom, Department of Science
and Technology
10:45 Costing a 2020 target for 15% renewable electricity in South Africa:
Dr Andrew Marquard, research lead author, Energy Research Centre, University
of Cape Town
11:30 The renewable energy resource and knowledge base:
Prof Wikus van Niekerk, Director, Centre for Renewable and Sustainable Energy
Studies (CRSES), Stellenbosch University
12:15 Plenary comment and discussion
12:40 LUNCH
13:30 Proposed feed-in tariff system for South Africa:
Sibusiso Zungu, senior engineer, EIP and Tembani Bukula, National Energy
Regulator of South Africa (NERSA)
14:00 Evolution One Fund, private equity for renewable energy in Southern Africa:
Christopher Clarke, Inspired Evolution Investment Management
14:15 Working for Energy: Dr Guy Preston, Chairperson, Working for Water
14:45 TEA/COFFEE
15:00 Setting up commissions: finalisation of themes, topics, objectives and outputs
15:30 Electricity from Biomass energy Solar water heating
renewable resources
Working for Energy:
Wind potential: Kilian Dr Guy Preston and
Hagemann (UCT) and Biomass energy:
5
Solar potential: Annie Sugrue
Sterren Bester
17:15 Working groups review progress and appoint ‘drafting’ team members
17:30 Informal networking with pre-dinner drinks
18:30 Gala dinner: Welcome by Dr Morné du Plessis, CE of WWF-SA
18:40 Hosts welcome: Kevin Whitfield, Head, Nedbank Capital
18:45 Pre-dinner address: Kadri Nassiep, CEO of SANERI
19:30 Keynote address: Minister Buyelwa Sonjica, Department of Minerals and Energy
20:00 Entertainment: BuskAid
FRIDAY 7th –DAY 2
09:30 DBSA Renewable Energy Market Transformation Programme: Moses Chundu
7
10:00 Energy and climate targets – action and strategies from the Western Cape:
Mark Gordon, Director SEM, Department of Environmental Affairs
10:30 South African Wind Energy Project: André Otto (DME)
11:00 Commissions reconvene and consider key conclusions, with an additional working
group on advocacy and a short-term task force
11:45 “Lessons from Iceland”, including myths regarding RE: Peter Lukey (DEAT)
12:10 Report-back on commission highlights (including tabling inputs to drafting team)
12:40 LUNCH – and conversion of commission output to draft resolutions
13:30 Plenary presentation, discussion and adoption of resolutions, facilitated by
Tasneem Essop, WWF International Climate Policy Advocate
14:50 Closing address: Deputy Minister Derek Hanekom
15:15 Thanks and farewell
Particular thanks to the reporters and commission facilitators, including:
Leila Mahomed, Stefan Wiswedel and Sivuyile Maboda (Sustainable
Energy Africa (SEA)); Dorah Lebelo (GreenHouse Project); Saliem Fakir and
Prof Wikus van Niekerk (CRSES), Stellenbosch University; Gary Pienaar (IDASA);
Glynn Morris (AGAMA Energy); Rehana Dada and Kirkpatrick & Associates.
Cheaper electricity with renewable energy | 15WWF National Renewable Energy Conference
The Environmental Goods
and Services Forum
By Peet du Plooy, WWF Trade and Investment Advisor
The Environmental Goods and Services (EGS) sector The Department of Trade and Industry (DTI) has identified
comprises companies whose business is to improve the EGS as a potential growth sector with a positive contribution
efficiency with which we use our natural resources and/or to to national sustainable development goals. In order to
protect, manage and grow our natural capital. EGS include support the realisation of this potential, the department has
a variety of activities, such as renewable energy, energy established an EGS sector desk to develop a customised
services, water treatment, the protection of biodiversity, waste sector programme for the industry.
management, pollution control and legal and consulting
services related to ecological sustainability. Initiated by the DTI, the South African EGS Forum was launched
in August 2007 at the Development Bank of South Africa,
Globally, by 2004, this was already a $548bn industry. It is with the aim of providing a single platform for the industry
expected to grow to $688bn by 2010 and $800bn in 2015. to collectively lobby government for industry support.
South Africa has a disproportionately small share of this
market (compared to its global share in other industries): WWF supported the event with the release of a publication
the local industry has been estimated in a report to Nedlac titled “Rethink Investment in (South) Africa”, which calls for
in 2006, to be worth between R14.5bn and R23.2bn foreign investment in EGS for South Africa and the continent
(1% to 1.6% of GDP and less than 0.4% of the global as a whole. WWF encourages all EGS companies to join
market). By far the majority of the local market to date has the Forum.
been in waste management.
For EGSF membership enquiries contact:
While leading large and multinational companies operating Megan van Horsten
in South Africa are developing their own EGS offerings Tel: +27 21 674 5964
(like Siemens, who builds wind turbines here and exports E-mail: megan@buy-environmental.co.za
them to the world), many EGS companies are small and or Andrea Firth
medium-sized enterprises (SMMEs). Only some of the Tel: +27 21 671 3826
sub-sectors have representative industry bodies and these E-mail: andrea@buy-environmental.co.za
seldom collaborate. www.egsf.org.za
© Chris Marais / WWF-Canon
© James Frankham / WWF-Canon
© Chris Marais / WWF-Canon
16 | Cheaper electricity with renewable energyWWF National Renewable Energy Conference
Kadri Nassiep, CEO, SANERI
South African National Energy
Research Institute
By Kadri Nassiep, Chief Executive Officer, SANERI
The South African National Energy Research Institute electronic information platform called Reegle contribute to
(SANERI) – a state-owned subsidiary of the Central Energy sharing of information and development of regional priorities.
Fund (Pty) Ltd was awarded the rights to host the Southern
African secretariat for the Renewable Energy & Energy There is significance in SANERI hosting REEEP. REEEP
Efficiency Partnership (REEEP) in 2008. REEEP was formed has made measurable progress in overcoming policy and
in 2002 at the World Summit on Sustainable Development in regulatory barriers inhibiting the uptake of renewable energy
Johannesburg as a multilateral partnership, to promote the and energy in certain developing countries. Aspects such as
uptake of renewable energy and energy efficiency, particularly human capital and techno-economic studies, coupled with
in the developing country members’ energy markets. suitable research and development and demonstration still
require attention however. This is where SANERI’s activities
REEEP has successfully supported policy and regulatory are aimed at and provides for perfect synergy with REEEP’s
studies in developing countries, where appropriate political focus. It is expected that SANERI will be able to support the
support exists for implementation. In Southern Africa, activities of REEEP in the region by supporting postgraduate
projects have been developed in Zambia, Tanzania, Lesotho studies and project development, once the appropriate policy
and South Africa. REEEP creates an opportunity for and fiscal regime have been put in place.
developing countries to fast-track deployment of renewable
energy and energy efficiency through the introduction of A consultation process with key stakeholders in South
suitable policies and measures that are developed with Africa has already commenced, to be followed by broader
REEEP financial support. Priorities are established in the consultations in the region. The intention is to establish what
relevant region and the REEEP Secretariat (based in Austria) activities are still required to make REEEP’s future activities
and its Governing Body is responsible for project approval more relevant and what could be done to enhance the impact
and development of the strategic direction of the overall of current REEEP activities in the region. This will provide for
programme. For this coming year, REEEP has secured a uniquely Southern African strategy for solving what is really
project funding of €3.7 million for distribution in the various a uniquely Southern African dilemma.
REEEP membership regions.
For further information on REEEP activities in Southern Africa,
The regional Secretariat is responsible for coordinating regional please contact Amanda Luxande on +27 11 280 0465 or
inputs into the strategic direction of the overall REEEP amandal@saneri.org.za. The REEEP website can be viewed
programme of work, and assists in developing a framework at www.reeep.org and provides a portal to the Reegle
for projects in the region. Regional workshops and an information system (www.reegle.info).
Cheaper electricity with renewable energy | 17WWF National Renewable Energy Conference
© Carlos G. Vallecillo / WWF-Canon
Towards a sustainable energy
future in the Western Cape
Highlights of the presentation by Mark Gordon, Western Cape Department of Environmental Affairs and
Developmental Planning
The Western Cape’s energy demand is approximately In order to achieve these targets, the Province has embarked
249.621 GJ (2004) and this is expected to grow to on the following plan of action:
420 million GJ over the next 20 years under current growth • Finalisation of a White Paper on Sustainable Energy in the
patterns. Industry and transport are the main energy Western Cape;
consumers and account for 80% of energy consumption. • Drafting of a Sustainable Energy Act;
The transport sector is heavily dependent on petrol and • Roll-out of a Solar Water Heater (SWH) programme initially
the industrial sector, mostly reliant on electricity, is also the targeting 1 000 poor households with a plan to have this up
second largest liquid fuel consumer in the province. scaled to 100 000;
• Establishment of a Solar Water Heater Training Academy in
The Western Cape produces 30 536 000 tonnes of CO2 per order to build up trained capacity for installation, fabrication
year – half from the industrial sector and a further 22% from and maintenance of SWH’s;
the transport sector. Most of the carbon dioxide released • Setting up a Renewable Energy Sector Cluster for the
from energy use within the province comes from electricity Western Cape, involving industry players, government and
production, with petrol and diesel use also contributing academic institutions;
significantly. Industry is the largest user of electricity in • Grid study being done in partnership with GTZ – a German
the province, followed by the residential sector and then government development agency;
commerce and government. • Completion of energy audits of all Provincial
Government buildings;
The Provincial Government of the Western Cape has • Roll-out of “greening” Provincial Government buildings to
developed a Renewable Energy Strategy as part of its Climate promote energy efficiency; and
Change Implementation Plan. The focus on renewable energy • Development of a plan to provide innovative financing for
and energy efficiency is critical for mitigation against climate Renewable Energy Projects such as Clean Development
change and the following targets have been set: Mechanisms and Special Purpose Vehicles.
• 15% renewable energy generation by 2014 off current base
of 5000 MW
• 10% energy efficiency against business as usual by 2014
• 15% reduction of CO2 emissions by 2014 on 2000 levels.
18 | Cheaper electricity with renewable energyWWF National Renewable Energy Conference
The science and state of
renewable energy technologies
Synopsis of the presentation by Prof Wikus van Niekerk, Centre for Renewable and Sustainable Energy Studies
(CRSES), Stellenbosch University
The scale of the global and local renewable energy resources While photovoltaic (PV) systems still have major cost and
is truly staggering: the energy from the earth’s annual solar storage challenges, this technology is especially applicable
radiation is at least ten times greater than the total resource to non-grid applications and is seeing massive investment
of fossil fuels and nuclear energy. The annual wind, tidal, growth globally.
biomass and hydro energy (all of which is ultimately a result of
solar energy) exceeds the total fossil fuel and nuclear energy Stellenbosch University’s Centre for Renewable and
resource many times over. Sustainable Energy Studies (CRSES) has a research “spoke”
connection with the University of Pretoria on solar thermal
South Africa boasts some of the most intensive solar technologies and with the Nelson Mandela Metropolitan
irradiance in the world, with levels of greater than 9 000MJ/m² University on solar photovoltaic technologies. Work on
in the northern parts of the Northern Cape and more than PV is also being done at the University of Johannesburg,
8 500MJ/m² for the entire Northern Cape and western parts of University of Cape Town and University of the Western
North West Province. Cape. Local PV manufacturing capacity is ramping up with
foreign investment.
Solar water heaters are an established technology that
saves electricity costs and is subsidised under Eskom’s Wind energy is seeing a more detailed quantification with
Demand Side Management Programme. Technologies also future plans for multiple projects on a scale of 100MW or
exist to generate solar thermal electric power using a variety greater. Wave and ocean energy is also receiving more
of geometries, including solar dishes, troughs and towers. attention with the best wave energy resource situated on the
Solar troughs are an established technology with 420MW south western coast.
installed globally at the scale of 30–80MW per installation.
Energy storage for 7.5 hours is available, as is the option Various universities (Stellenbosch, North West, Western Cape,
of hybridised solar/natural gas to provide base load power. and Cape Town) are investigating next-generation biomass
Fresnel collectors offer a cost-efficient evolution of solar energy. Among renewable energy technologies other than
troughs with the first units expected in 2010. Solar dishes can solar, wind or wave energy, large run-of-river projects like the
generate 25kW with plans for 500MW of capacity. proposed Grand Inga Project in the Democratic Republic of
the Congo can deliver cost effective renewable energy on
The most attractive option for South Africa is likely to be the a large-scale. Another attractive option is biogas digesters
solar tower – another proven technology (with the first plant which turn bio-waste into clean cooking or heating fuels and
built in the 1980s) and is currently in operation in Spain and other waste-to-energy projects, including landfill gas.
the United States. Eskom is planning a 100MW (electric) unit
northwest of Upington. With 14 hours of energy storage in South Africa has significant, even world-leading, solar, wind
molten salt, it can provide 24 hours of power in summer and and ocean energy resources. It has expertise in these fields
a 70% load factor throughout the year. A solar tower can be and a history of funding cutting-edge energy projects (like
built within three years. Coal-to-Liquid and the Pebble-Bed Modular Nuclear Reactor).
With leadership, it could turn this comparative advantage into
Another newer technology is the solar chimney which collects a competitive advantage.
hot air from a large covered area and generates wind power
with the updraft through a central chimney (cost expectations
are between 10.5 and 26.8 Euro cents per kWh).
© Claire Doole / WWF-Canon
Cheaper electricity with renewable energy | 19You can also read