2019 Electricity Statement of Opportunities - June 2019 - AEMO
←
→
Page content transcription
If your browser does not render page correctly, please read the page content below
2019
Electricity
Statement of
Opportunities
June 2019

A report for the Wholesale Electricity Market

Important notice

PURPOSE
AEMO publishes the Wholesale Electricity Market Electricity Statement of Opportunities under clause 4.5.11 of
the Wholesale Electricity Market Rules.
This publication has been prepared by AEMO using information available in May 2019. Information made
available after this date may have been included in this publication where practical.

DISCLAIMER
This document or the information in it may be subsequently updated or amended. This document does not
constitute legal or business advice, and should not be relied on as a substitute for obtaining detailed advice
about the Wholesale Electricity Market Rules or any other applicable laws, procedures or policies. AEMO has
made every effort to ensure the quality of the information in this document but cannot guarantee its accuracy
or completeness.
Accordingly, to the maximum extent permitted by law, AEMO and its officers, employees and consultants
involved in the preparation of this document:
• make no representation or warranty, express or implied, as to the currency, accuracy, reliability or
 completeness of the information in this document; and
• are not liable (whether by reason of negligence or otherwise) for any statements or representations in this
 document, or any omissions from it, or for any use or reliance on the information in it.

VERSION CONTROL

Version Release date Changes

1 14/6/2019 Initial release

2 18/6/2019 Correction to measurement (MW to GWh), Table 2, page 5

© 2019 Australian Energy Market Operator Limited. The material in this publication may be used in
accordance with the copyright permissions on AEMO’s website.

Executive summary

This Wholesale Electricity Market (WEM) Electricity Statement of Opportunities (ESOO) presents AEMO’s Long
Term Projected Assessment of System Adequacy (PASA) for the South West interconnected system (SWIS) in
Western Australia (WA). It reports AEMO’s peak demand and operational consumption 1 forecasts across a
range of weather and demand growth scenarios for the 10-year Long Term PASA Study Horizon for the
2019-20 to 2028-29 Capacity Years2. The WEM ESOO is one of the key aspects of the Reserve Capacity
Mechanism (RCM), which ensures enough capacity is available to meet reliability targets set under the Long
Term PASA study for the SWIS. The WEM ESOO report highlights the 10% probability of exceedance (POE) 3
peak demand forecast under the expected demand growth scenario 4, which is used to determine the Reserve
Capacity Requirement (RCR)5 for the 2021-22 Capacity Year.

 Key findings Long Term PASA ensures
 there is sufficient capacity in
 • Based on the 10% POE peak demand forecast, the RCR has been the SWIS to meet the
 determined as 4,482 megawatts (MW) for the 2021-22 Capacity Year. forecast 10% POE peak
 demand plus a reserve
 • The 10% POE peak demand is forecast to grow slowly at an average annual margin, and to limit
 rate of 0.4% over the outlook period. This is slightly lower than the 0.6% projected unserved energy to
 growth rate projected in the 2018 WEM ESOO. 0.002% of annual energy
 consumption for each
 • Assuming no changes in installed or committed capacity, there is expected Capacity Year of a 10-year
 to be sufficient capacity to meet forecast demand over the outlook period. forecast period.

 • For the first time, operational consumption is forecast to fall at an average
 annual rate of 0.4%, in comparison to 0.9% growth reported in the 2018 WEM ESOO.
 • Both peak demand and operational consumption growth are expected to be subdued due to the
 continued uptake of behind the meter photovoltaic (PV) capacity6, as well as ongoing energy efficiency
 improvements. This PV capacity is forecast to grow at an average annual rate of 7.6% (122 MW per
 year), with higher uptake expected in the early years of the outlook period, to reach an estimated
 2,500 MW installed by 2028-29.
 • The Demand Side Management (DSM) Reserve Capacity Price (RCP) for the 2019-20 Capacity Year is
 $16,990 per MW7.

1
 Operational consumption refers to electricity supplied from the transmission grid over a period.
2
 A Capacity Year commences in the Trading Interval starting at 8:00 AM on 1 October and ends in the Trading Interval ending at 8:00 AM on 1 October of
 the following calendar year. All data in this WEM ESOO is based on Capacity Years unless otherwise specified.
3
 POE means the likelihood a peak demand forecast will be met or exceeded. A 10% POE peak demand forecast is expected to be exceeded, on average,
 only one year in 10, while 50% and 90% POE peak demand forecasts are expected to be exceeded, on average, five years in 10 and nine years in 10
 respectively. A 10% POE forecast assumes more extreme weather and is more conservative than 50% and 90% POE forecasts for capacity planning.
4
 This 2019 WEM ESOO provides low, expected, and high demand growth scenarios based on different levels of economic growth. Unless otherwise
 indicated, demand growth forecasts in this executive summary are based on the expected demand growth scenario.
5
 The RCR is AEMO’s determination of the total amount of generation or DSM capacity required in the SWIS to satisfy the Planning Criterion for a specific
 Reserve Capacity Cycle.
6
 Behind the meter PV capacity includes both residential and commercial rooftop PV that is less than 100 kilowatts (kW) and commercial PV systems ranging
 between 100 kW and 30 MW.
7
 This DSM RCP for the 2019-20 Capacity Year is based on the forecast Expected DSM Dispatch Quantity and is published in accordance with clause 4.5.13(i)
 of the WEM Rules. The RCP paid to generators for the 2019-20 and 2020-21 Capacity Years is $126,683/MW and $114,134/MW respectively; see
 https://www.aemo.com.au/Electricity/Wholesale-Electricity-Market-WEM/Reserve-capacity-mechanism/Benchmark-Reserve-Capacity-Price.

© AEMO 2019 | 2019 Electricity Statement of Opportunities 3
Reserve Capacity Requirement
The RCR for the 2021-22 Capacity Year is 4,482 MW8.
Excess capacity has increased from 4.9% for the 2019-20 Capacity Year to 8.4% for the 2020-21 Capacity Year.
This has largely been due to new large-scale renewable generation with an estimated nameplate capacity of
around 400 MW9 that was assigned Capacity Credits for the 2020-21 Capacity Year.
Assuming there are no changes to the current level of installed and committed capacity, based on forecast
demand excess capacity is forecast to increase to 484 MW (10.8%) for the 2021-22 Capacity Year. By the end
of the outlook period, excess capacity is forecast to fall to 407 MW (8.9%) due to peak demand growth.
The RCP for the 2021-22 Capacity Year will be determined once Capacity Credits have been assigned for the
2019 Reserve Capacity Cycle10.

DSM Reserve Capacity Price
For the 2019-20 Capacity Year, the DSM RCP is $16,990 per MW11.
The DSM RCP for the 2020-21 Capacity Year will be published in the 2020 WEM ESOO, three months before
the price takes effect, in line with the WEM Rules.

Peak demand and operational consumption forecasts
The accuracy of peak demand forecasts directly affects the accuracy of the RCR, which is based on the 10%
POE peak demand forecast. If peak demand forecasts are inaccurate there is a risk of setting an inappropriate
RCR and RCP.
Since the RCP reflects the economic value of capacity, an inappropriately high or low RCP risks sending
misleading price signals to the market. AEMO recognises the significant changes underway in the WEM (such
as distributed energy resources (DER)12 uptake), which are causing variability and uncertainty in peak demand.
In response, AEMO is continuing to enhance its forecasting systems to monitor and analyse the impact of
these changes.
AEMO forecasts the 10% POE peak demand to increase at an average annual rate of 0.4% over the 10-year
outlook period, as presented in Table 1. These forecasts are lower than the peak demand forecasts published
in the 2018 WEM ESOO, with the variance between the two forecasts at 118 MW in the 2021-22 Capacity Year.
Key drivers for lower forecasts include methodology improvements (particularly around the effect of behind
the meter PV on peak demand), as well as revised economic and population growth forecasts. These
reductions in the peak demand forecasts are partially offset by three new block loads in the expected case,
which contribute to an additional 84 MW by 2021. Further details on these changes can be found in
Chapter 3.

8
 Calculated as the 10% POE peak demand forecast, plus a reserve margin and maintaining the Minimum Frequency Keeping Capacity requirements (as
 defined in clause 3.10.1(a) of the WEM Rules). The reserve margin is calculated as the greater of (1) 7.6% of the 10% POE peak demand (including
 transmission losses) and allowing for Intermittent Loads and (2) the maximum capacity of the largest generating unit in the SWIS.
9
 Including Alinta’s Yandin Wind Farm (214.2 MW nameplate capacity; 40.932 MW Capacity Credits for the 2020-21 Capacity Year) and Bright Energy
 Investments’ Warradarge Wind Farm (183.6 MW nameplate capacity; 36.124 MW Capacity Credits for the 2020-21 Capacity Year).
10
 Timing for the events in the 2019 Reserve Capacity Cycle can be found in the 2019 Reserve Capacity timetable at http://aemo.com.au/Electricity/
 Wholesale-Electricity-Market-WEM/Reserve-capacity-mechanism/Reserve-capacity-timetable.
11
 All DSM information required by the WEM Rules is provided in Chapter 6 of this WEM ESOO.
12
 DER technologies refers to small-scale embedded technologies that either produce electricity, store electricity, or manage consumption, and reside within
 the distribution system, including resources that sit behind the customer meter.

© AEMO 2019 | 2019 Electricity Statement of Opportunities 4
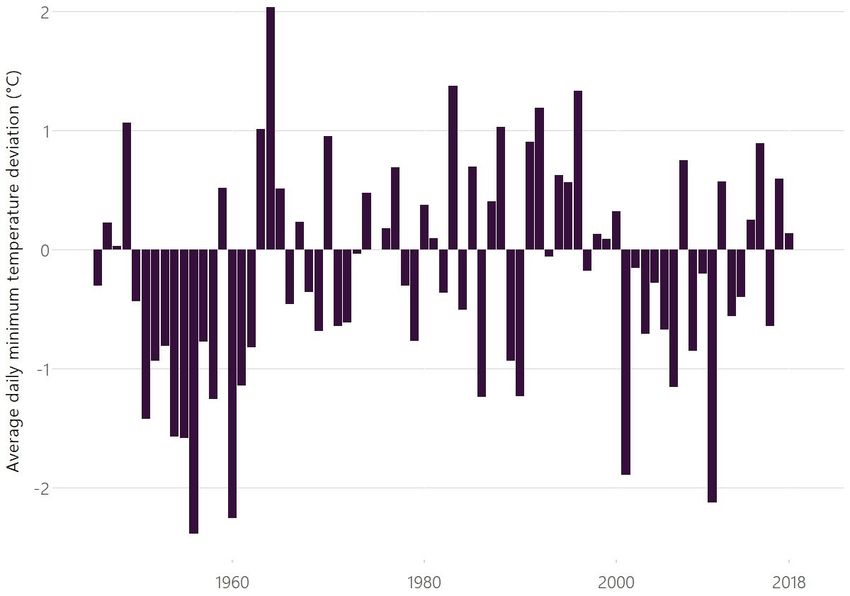
Table 1 Peak demand forecasts for different weather scenarios, expected demand growth

 Scenario 2019-20 2020-21 2021-22 2022-23 2023-24 5-year average 2028-29 10-year average
 (MW) (MW) (MW) (MW) (MW) annual growth (MW) annual growth

 10% POE 4,007 4,063 4,075 4,074 4,078 0.4% 4,152 0.4%

 50% POE 3,758 3,813 3,819 3,822 3,826 0.5% 3,897 0.4%

 90% POE 3,536 3,589 3,597 3,597 3,606 0.5% 3,672 0.4%

Source: ACIL Allen with AEMO input.

Operational consumption forecasts in gigawatt hours (GWh) for the high, expected, and low growth scenarios
are shown in Table 2. These forecasts reflect different economic, population and electric vehicles growth
scenarios13. Chapter 3 contains further information about the DER forecasts.

 Table 2 Operational consumption forecastsA for different economic growth scenarios

 Scenario 2019-20 2020-21 2021-22 2022-23 2023-24 5-year average 2028-29 10-year
 (GWh) (GWh) (GWh) (GWh) (GWh) annual growth (GWh) average annual
 growth

 High 18,225 18,302 18,179 18,059 17,952 -0.4% 18,112 -0.1%

 Expected 18,221 18,289 18,151 18,008 17,864 -0.5% 17,543 -0.4%

 Low 18,191 18,004 17,832 17,679 17,521 -0.9% 17,024 -0.7%

A. Operational consumption forecasts are by financial year.
Source: ACIL Allen with AEMO input.

In the expected growth scenario, operational consumption is forecast to decline at an average annual rate of
0.5% over the next five years and 0.4% over the entire outlook period. This is in contrast to the 2018 WEM
ESOO, which forecast operational consumption to grow at an average annual rate of 0.9% over the outlook
period. The revision is largely associated with higher behind the meter PV forecasts, combined with falling
residential consumption which is partly due to energy efficiency improvements. Chapter 5 contains analysis of
the trends in operational consumption.

Trends in SWIS peak demand
Peak demand has previously averaged close to 3,700 MW (except for the all-time peak demand in 2015-16)
over the past seven years, as shown in Table 3. This year’s peak demand represents a significant decrease
from previous years and was the lowest summer peak observed in the SWIS since 2006.
The unusually low 2018-19 peak demand indicates the increasing impact of behind the meter PV as well as
the impact of the timing of very hot days (with maximum temperatures over 40°C14) on peak demand.

13
 For behind the meter PV, expected case forecasts have been applied to all three demand growth scenarios. This is because behind the meter PV uptake
 has been observed to be strongly driven by the payback period and customers’ technology adoption preferences, rather than general macroeconomic
 drivers like GSP growth. Behind the meter battery storage is assumed to have no effect on operational consumption due to its small efficiency losses.
14
 BOM 2019, About the climate extremes analyses: Extreme climate indices used. Available at http://www.bom.gov.au/climate/change/about/extremes.shtml.

© AEMO 2019 | 2019 Electricity Statement of Opportunities 5
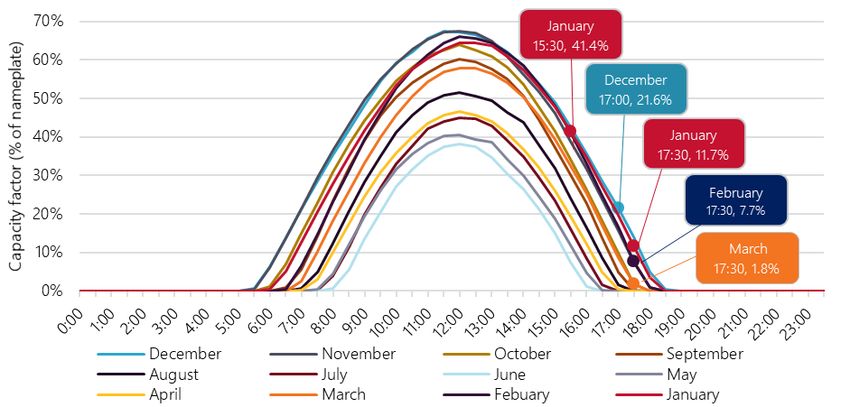
Table 3 Comparison of peak demand days, 2011-12 to 2018-19 Capacity Years

 Capacity Date Trading Peak Daily Time of Rank of Maximum
 Year Interval demand maximum temperature dayB temperature in
 commencing (MW) temperatureA peak Trading Interval
 (°C) (°C)

 2018-19 7 February 2019 17:30 3,256 35.8 15:00 21 33.5

 2017-18 13 March 2018 17:30 3,616 38.5 14:00 2 36.2

 2016-17 21 December 2016 17:00 3,543 42.8 14:30 2 38

 2015-16 8 February 2016 17:30 4,004 42.6 15:00 3 41

 2014-15 5 January 2015 15:30 3,744 44.2 13:30 1 41.1

 2013-14 20 January 2014 17:30 3,702 38.7 15:00 7 36.9

 2012-13 12 February 2013 16:30 3,739 41.1 13:00 2 36

 2011-12 25 January 2012 16:30 3,860 40.0 15:00 7 39.1

A. Measured at the Perth Airport weather station (station identification number 9021).
B. A rank of 1 indicates that it was the hottest day in the Capacity Year, and a rank of 2 indicates that it was the second hottest day in the
Capacity Year.
Source: AEMO and Bureau of Meteorology (BOM).

It is expected that long term temperature trends are likely to continue to have significant impacts on peak
demand. As ongoing evidence from BOM suggests continued changes in Australia’s climate conditions 15,
AEMO will continue to monitor the effects of climate on peak demand.

Impact of behind the meter PV systems
AEMO estimates the demand that would have occurred if there was no generation from behind the meter PV
(“underlying demand”16). Underlying demand is then analysed to examine the effect of behind the meter PV
on peak demand. Historically, underlying peak demand generally occurs on the same day as peak demand.
Since 2006, which marks the commencement of the energy market, 2018-19 is the second time17 that
underlying peak demand occurred on a day that was different to the peak demand day.
Underlying peak demand is estimated as 3,555 MW at 14:00 on 20 January 2019 18, 9.2% higher than the
observed peak demand of 3,256 MW at 17:30 on 7 February 2019, as shown in Figure 1. In 2018-19, the peak
demand reduction due to rooftop PV (106 MW) output was outweighed by the reduction in peak demand
due to the shift in peak demand time (193 MW). Although behind the meter PV generation dropped off
slightly earlier on 7 February 2019 than it did on 20 January 2019, the underlying peak demand time was the
crucial factor that determined the observed peak demand.
The most recent summer peak demand (for the 2018-19 Capacity Year) was equal to the most recent winter
peak demand (in winter 2018), the first time this has happened since energy market commencement in 2006.

15
 BOM 2018, State of the Climate 2018, Australian Government. Available at http://www.bom.gov.au/state-of-the-climate/State-of-the-Climate-2018.pdf.
16
 Underlying demand refers to all electricity consumed on site and can be provided by localised generation from behind the meter PV, battery storage, and
 embedded generators, or by the electricity grid.
17
 The first time was 2013-14.
18
 20 January 2019 was the hottest day of the 2018-19 Capacity Year.

© AEMO 2019 | 2019 Electricity Statement of Opportunities 6
Underlying and observed demand on underlying and observed peak demand days

The continued growth of behind the meter PV installations has affected the level and timing of peak demand
over the last eight years. Actual peak demand for each year in the past eight years is compared with the
estimated underlying peak demand in Table 4.

Table 4 Effect of behind the meter PV on peak demand, 2011-12 to 2018-19

 Estimated Reduction in Reduction in
 Estimated
 Trading Peak underlying peak demand peak
 Capacity underlying
 Month Interval demand peak from PV demand from
 Year peak Trading
 commencing (MW) demand generation peak time
 Interval
 (MW) (MW) shift (MW)

 2018-19 Jan/FebA 17:30 3,256 3,555 14:00 106 193

 2017-18 Mar 17:30 3,616 3,727 16:30 12 99

 2016-17 Dec 17:00 3,543 3,767 15:00 153 71

 2015-16 Feb 17:30 4,004 4,147 16:30 63 81

 2014-15 Jan 15:30 3,744 3,902 14:30 136 22

 2013-14 JanA 17:30 3,702 3,767 16:30 46 19

 2012-13 Feb 16:30 3,739 3,806 14:00 55 12

 2011-12 Jan 16:30 3,860 3,931 15:30 42 29

A. Underlying peak demand occurred on a different day in the same Capacity Year.

© AEMO 2019 | 2019 Electricity Statement of Opportunities 7
AEMO expects the strong growth of behind the meter PV capacity in the SWIS to continue, with an expected
2,500 MW of total installed capacity by the end of the outlook period. Technological, commercial, and
regulatory factors, as well as increasing environmental awareness, continue to drive this strong uptake.

Response to Individual Reserve Capacity Requirement
The Individual Reserve Capacity Requirement (IRCR) financially incentivises Market Customers to reduce
consumption during peak demand periods and consequently reduce their exposure to capacity payments.
The highest IRCR response to date occurred on 7 February 2019 when 59 customers reduced consumption,
resulting in total load reduction of 82 MW. IRCR response in early February has been high historically as
customers expect peak demand will occur in this period. The peak demand days in the 2018-19 Capacity Year
have been easier for Market Customers to predict, as they occurred in late January to early March, resulting in
high IRCR response rates. In the 2018-19 Hot Season, 190 unique customers responded in at least three
Trading Intervals, indicating that the IRCR mechanism continues to encourage electricity users to reduce
demand at peak times.

Other market changes in the WEM
There are several changes currently occurring in the WEM that may impact the RCM, including:
• The Generator Interim Access (GIA) arrangement19, developed as a short-term solution to network
 congestion, is fully subscribed at just under 900 MW after receiving strong interest from project
 developers.
• Amendments to Reserve Capacity pricing arrangements have been proposed 20 to ensure that the RCP
 reflects the economic value of capacity.
• The DER Roadmap (to be developed by mid-2020), which forms part of the WA Government’s Energy
 Transformation Strategy21, will consider ways to mitigate the system security and market issues associated
 with strong uptake of DER technologies.
• A Whole of System Plan, which aims to consolidate many aspects of power system planning, is being
 developed by the WA Government (supported by AEMO and Western Power).

19
 The GIA arrangement was developed to facilitate new generation connections on a constrained basis. It is not scalable and was intended as an interim
 solution. Generators connected under the GIA arrangement will be migrated to the new security-constrained dispatch engine as part of the
 implementation of constrained access (to be delivered under the WA Government’s Energy Transformation Strategy), and the GIA tool will be
 decommissioned. There is currently concern that the GIA arrangement will limit the entry of some renewable facilities that may have otherwise connected
 prior to 2022 if the GIA arrangement had no capacity restriction.
20
 For further information, see https://www.treasury.wa.gov.au/Public-Utilities-Office/Industry-reform/Improving-Reserve-Capacity-pricing-signals/.
21
 For further information, see https://www.treasury.wa.gov.au/Treasury/News/Energy_Transformation_Strategy/.

© AEMO 2019 | 2019 Electricity Statement of Opportunities 8
Contents
Executive summary 3

1. Introduction 13

2. Changes in generation capacity 14
2.1 Capacity diversity 14
2.2 Certified Facilities 15

3. Forecast methodology and assumptions 20
3.1 The Planning Criterion 20
3.2 Forecast methodology 21
3.3 DER forecasts 24
3.4 Supporting forecasts 35

4. Historical and forecast peak demand 37
4.1 Historical peak demand 37
4.2 Peak demand forecasts 47
4.3 Reconciliation with previous forecasts 48

5. Historical and forecast operational consumption 51
5.1 Historical operational consumption 51
5.2 Operational consumption forecasts 53
5.3 Reconciliation 54

6. Reserve Capacity Target 56
6.1 Overview 56
6.2 Forecast capacity requirements 57
6.3 Availability Classes 57
6.4 Availability Curves 58
6.5 DSM Reserve Capacity Price 59
6.6 Opportunities for investment 60

7. Current market issues and developments 63
7.1 Changes to the RCP arrangements 63
7.2 Reserve Capacity payments and IRCR liability 63
7.3 Current ERA WEM reviews and rule changes 64
7.4 The rise of DER and large-scale renewable energy 65
7.5 Embracing DER and planning for a future energy system 65
7.6 Infrastructure developments in the SWIS 67

A1. Determination of the Availability Curve 70

© AEMO 2019 | 2019 Electricity Statement of Opportunities 9
A2. Expected DSM Dispatch Quantity and DSM Activation Price 72
A2.1 Expected DSM Dispatch Quantity 72
A2.2 DSM Activation Price 73

A3. Supply-demand balance under different demand growth scenarios 74

A4. Economic growth forecasts 76

A5. Behind the meter PV forecasts 77

A6. Summer peak demand forecasts 78

A7. Winter peak demand forecasts 80

A8. Operational consumption forecasts 82

A9. Power station information in the SWIS 84

A10. Facility capacities 87

Measures and abbreviations 90

Glossary 92

Tables
Table 1 Peak demand forecasts for different weather scenarios, expected demand growth 5
Table 2 Operational consumption forecastsA for different economic growth scenarios 5
Table 3 Comparison of peak demand days, 2011-12 to 2018-19 Capacity Years 6
Table 4 Effect of behind the meter PV on peak demand, 2011-12 to 2018-19 7
Table 5 Key assumptions for low, expected, and high demand growth scenarios 22
Table 6 DER forecast – main assumptions 25
Table 7 WA GSP forecasts, 2019-20 to 2023-24 financial years 35
Table 8 WA population growth, 2019-20 to 2023-24 financial year 36
Table 9 Comparison of peak demand days, 2011-12 to 2018-19 Capacity Years 38
Table 10 Weather and generation conditions on the eight hottest weekdays in the 2018-19 Capacity
 Year 40
Table 11 IRCR response on summer peak demand days, 2012 to 2019 44
Table 12 Effect of behind the meter PV on peak demand, 2011-12 to 2018-19 46
Table 13 Difference between 10% POE expected scenario forecasts, 2018 WEM ESOO and this 2019
 WEM ESOO (MW) 49
Table 14 Difference between operational consumption expected scenario forecasts, 2018 WEM ESOO
 and this 2019 WEM ESOO (GWh) 55
Table 15 Reserve Capacity Targets (MW)A 57
Table 16 Availability Classes (MW) 58

© AEMO 2019 | 2019 Electricity Statement of Opportunities 10
Table 17 Expected DSM Dispatch Quantity and DSM RCP, 2019-20 to 2028-29 59
Table 18 Capacity outlook in the SWIS, 2019-20 to 2021-22 Capacity YearsA 61
Table 19 New capacity offered through the EOI compared to capacity certified, 2014-15 to 2021-22
 (MW) 62
Table 20 List of WEM reviews being undertaken by the ERA 64
Table 21 Indicative distributions of system security risks 65
Table 22 Energy Transformation Strategy workstream elements 67
Table 23 EDDQ, 2019-20 to 2028-29 73
Table 24 Supply-demand balance, high demand growth 74
Table 25 Supply-demand balance, expected demand growth 75
Table 26 Supply-demand balance, low demand growth 75
Table 27 Growth in WA gross state product, financial year basis 76
Table 28 Annual energy generated from behind the meter PV systems A 77
Table 29 Summer peak demand forecasts with expected demand growth 78
Table 30 Summer peak demand forecasts with high demand growth 79
Table 31 Summer peak demand with low demand growth 79
Table 32 Winter peak demand forecasts with expected demand growth 80
Table 33 Winter peak demand forecasts with high demand growth 81
Table 34 Winter peak demand forecasts with low demand growth 81
Table 35 Forecasts of operational consumption (financial year basis) 82
Table 36 Forecasts of operational consumption (Capacity Year basis) 83
Table 37 Scheduled Generators in the SWIS, 2017-18 Capacity Year 84
Table 38 Non-Scheduled Generators in the SWIS, 2017-18 Capacity Year 85
Table 39 Registered generation Facilities – existing and committed 87
Table 40 Registered DSM Facilities – existing and committed 89

Figures
 Underlying and observed demand on underlying and observed peak demand days 7
 Proportion of Capacity Credits by fuel type, 2016-17 to 2020-21 Capacity Years 15
 Scheduled Generator map for the SWIS, 2020-21 16
 Non-Scheduled Generators map for the SWIS, 2020-21 17
 Facility Capacity Credits and operating classification (Facilities receiving more than 35 MW
 of Capacity Credits)A,B 18
 Capacity Credits in the SWIS by fuel type and generator age, for the 2020-21 Capacity Year 19

© AEMO 2019 | 2019 Electricity Statement of Opportunities 11
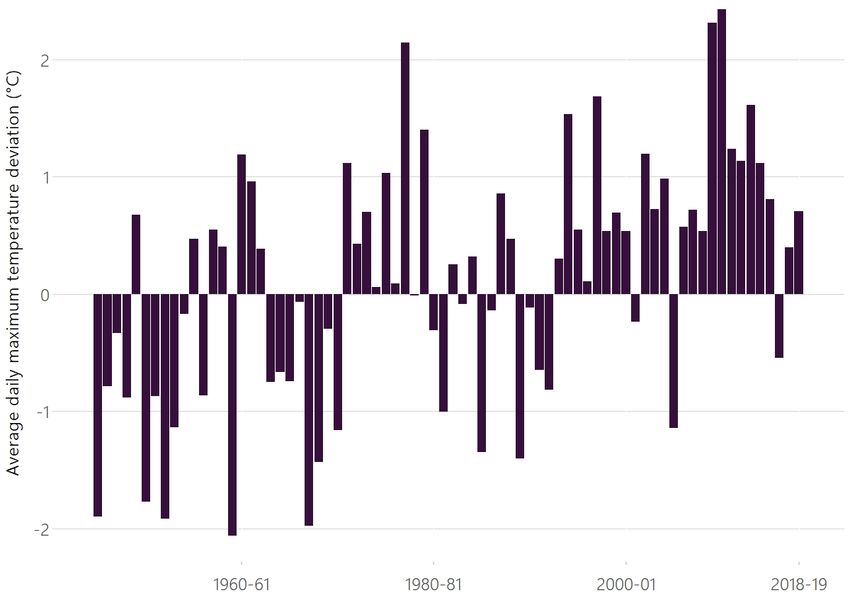
Components of peak demand forecasts 22
 Forecast installed behind the meter PV system capacity, 2018-19 to 2028-29 financial years 26
 Solar capacity factor traces, averaged by month, for behind the meter PV in the SWIS A,B 27
 Methodology for the low, expected, and high scenario peak demand reduction from behind
 the meter PV 28
 Forecast peak demand reduction from behind the meter PV systems (summer), 2019-20 to
 2028-29A 29
 Forecast influence on average peak demand timing of various levels of behind the meter PV
 penetration 30
 Forecast installed capacity of battery storage systems (behind the meter), 2019-20 to 2028-
 29 financial years 31
 Peak demand reduction from battery storage, 2019-20 to 2028-29A 32
 Projected number of EVs, 2019-20 to 2028-29 financial years 33
 Forecast EV impact on peak demand under an uncoordinated charging regime, 2019-20 to
 2028-29 34
 EV contribution to operational consumption, 2019-20 to 2028-29 financial years 34
 Average daily maximum temperature deviations (°C) A, December to March in each
 financial year 38
 Occurrence and temperature of hot days (over 35 C), 2012-13 to 2018-19 Capacity Years
 °
 39
 Demand profiles on the 21 hottest days in the 2018-19 Capacity Year 41
 Summer and winter peak demandA, Capacity Year 2006-07 to 2018-19B Capacity Years 42
 Average daily minimum temperature deviations ( °C)A, winter in each calendar year 43
 Demand profile on the peak demand day and underlying peak demand day, 2018-19 45
 Underlying demand and behind the meter PV generation profile on the peak demand day
 and underlying peak demand day, 2018-19 46
 10% POE forecast peak demand under different growth scenarios, 2019-20 to 2028-29 47
 10% POE, 50% POE, and 90% POE peak demand forecasts under the expected demand
 growth scenario, 2019-20 to 2028-29 48
 Forecast reconciliation, 2018-19 peak demand 49
 Total operational consumption in the SWIS, 2010-11 to 2017-18 51
 Underlying residential consumption in the SWIS, 2010-11 to 2017-18 52
 Total number of residential customers and the average annual consumption per residential
 customer in the SWIS, 2010-11 to 2017-18A 53
 Operational consumption forecasts under different growth scenarios, 2019-20 to 2028-29A 53
 Forecast supply-demand balance, 2019-20 to 2028-29A,B 61
 2020-21 Capacity Year Availability Curve 71
 2021-22 Capacity Year Availability Curve 71

© AEMO 2019 | 2019 Electricity Statement of Opportunities 12
1. Introduction

The Wholesale Electricity Market (WEM) Electricity Statement of Opportunities (ESOO) is an annual
publication which presents AEMO’s Long Term Projected Assessment of System Adequacy (Long Term PASA)
for the South West interconnected system (SWIS) in Western Australia (WA).
The WEM ESOO presents peak demand and operational consumption forecasts over a 10-year Long Term
PASA Study Horizon. The Long Term PASA ensures there is sufficient capacity in the SWIS to meet the
forecast peak demand plus a reserve margin.
The Reserve Capacity Mechanism (RCM) is a market-oriented mechanism that aims to ensure that a minimum
level of generation and Demand Side Management (DSM) capacity is available in the SWIS to meet forecast
electricity peak demand, and to limit expected energy shortfalls22 to 0.002% of annual energy consumption
for each Capacity Year of a 10-year forecast period23. The Long Term PASA in the 2019 WEM ESOO considers
the 2019-20 to 2028-29 Capacity Years24.
The development of the WEM ESOO is integral to the operation of the RCM in the WEM and may be used by
Market Participants when making strategic, planning, investment, and other decisions relating to the issues
and opportunities presented.
A key deliverable from the 2019 Long Term PASA is the determination of the Reserve Capacity Requirement
(RCR) for the 2019 Reserve Capacity Cycle. The RCR is the quantity of generation and DSM capacity required
under the RCM for the 2021-22 Capacity Year.
The 2019 WEM ESOO also includes information about:
• A summary of relevant government policies and initiatives.
• Relevant WEM Rules and methodologies under review.
• Emerging trends in Reserve Capacity requirements and pricing.
• Current and future issues relating to the operation of the SWIS.
• A summary of electricity infrastructure development plans for the SWIS.

22
 The expected energy shortfall is the expected unserved energy, which refers to a forecast by AEMO of the aggregate amount in megawatt hours by which
 the electricity demand is projected to exceed supply.
23
 The Planning Criterion, which sets the level of capacity to be procured through the RCM, is defined in clause 4.5.9 of the WEM Rules.
24
 A Capacity Year commences in the Trading Interval starting at 8:00 AM on 1 October and ends in the Trading Interval ending at 8:00 AM on 1 October of
 the following calendar year. All data in this WEM ESOO is based on Capacity Years unless otherwise specified.

© AEMO 2019 | 2019 Electricity Statement of Opportunities 13
2. Changes in generation
 capacity

This chapter examines the diversity of existing Facilities participating in the WEM based on
Market Participant, fuel type, and Facility characteristics25.

2.1 Capacity diversity
This chapter focuses on generation capacity associated with Facilities in the WEM that have been allocated
Capacity Credits via the RCM26.

2.1.1 Changes to Capacity Credit assignments
For the 2020-21 Capacity Year, 65 registered Facilities have been assigned 4,965.551 megawatts (MW) of
Capacity Credits. This compares to 62 Facilities holding 4,887.970 MW of Capacity Credits for the 2019-20
Capacity Year and 50 Facilities holding 3,531.1 MW of Capacity Credits at capacity market start in 2005.
In the 2018 Reserve Capacity Cycle for the 2020-21 Capacity Year, new capacity was assigned Capacity Credits
as follows:
• Two Non-Scheduled Generator (NSG) Facilities were assigned Capacity Credits:
 – Yandin Wind Farm (40.932 MW).
 – Warradarge Wind Farm (36.124 MW).
• Two upgrades to existing NSG Facilities were assigned Capacity Credits:
 – Greenough River Solar Farm extended its solar generation capacity, resulting in an additional
 8.580 MW of Capacity Credits.
 – Badgingarra Wind Farm installed solar generation capacity and received an additional 5.904 MW of
 Capacity Credits.

2.1.2 Capacity Credits by fuel type
Figure 2 summarises the market share of Capacity Credits by fuel type within the WEM. It shows a significant
decrease in DSM Capacity Credits following the 2016-17 Capacity Year, likely due to the introduction of a
revised formula for calculating the DSM Reserve Capacity Price (RCP) for Demand Side Programmes (DSPs)
which resulted in a lower price27. Consequently, DSM Capacity Credits declined by nearly 500 MW between
the 2016-17 and 2020-21 Capacity Years.

25
 More information on existing generation and DSM capacity can be found in the 2019 Request for Expressions of Interest, published January 2019 and
 available at https://www.aemo.com.au/Electricity/Wholesale-Electricity-Market-WEM/Reserve-capacity-mechanism/Expressions-of-interest.
26
 Behind the meter photovoltaic (PV) does not receive Capacity Credits. For further information about behind the meter PV, refer to Chapter 3 and
 Chapter 4.
27
 Refer to the Government Gazette No.89 ‘Electricity Industry (Commencement of Electricity Industry (Wholesale Electricity) Market Amendment
 Regulations) Order 2016’, Perth, 31 May 2016.

© AEMO 2019 | 2019 Electricity Statement of Opportunities 14
Key changes in Capacity Credits assigned between the 2019-20 and 2020-21 Capacity Years are:
• An increase of 38% in the share of capacity assigned to renewables (increasing from 3.8% of total Capacity
 Credits assigned for the 2019-20 Capacity Year to 5.2% of total Capacity Credits assigned for the 2020-21
 Capacity Year).
• A decrease of 1.5% in total capacity share for coal, gas, diesel, and dual-fuel Facilities (decreasing from
 94.9% of total Capacity Credits assigned for the 2019-20 Capacity Year to 93.5% of total Capacity Credits
 assigned for the 2020-21 Capacity Year).

 Proportion of Capacity Credits by fuel type, 2016-17 to 2020-21 Capacity Years

2.2 Certified Facilities
The 65 Facilities that have been assigned a total of 4,965.551 MW of Capacity Credits for the 2020-21 Capacity
Year are operated by a total of 31 Market Participants, and comprise:
• 39 Scheduled Generators.
• 24 NSGs.
• 2 DSP Facilities.

2.2.1 Facility types

Scheduled Generators
The locations and Capacity Credit assignments for Scheduled Generators certified for the 2020-21 Capacity
Year are shown in Figure 3.
Between the 2019-20 and 2020-21 Capacity Years, there have been no significant changes to the Scheduled
Generation fleet, with assigned Capacity Credits increasing by 3.372 MW from a total of 4,638.5 MW to

© AEMO 2019 | 2019 Electricity Statement of Opportunities 15
4,641.872 MW28. Muja CD remains the largest power station, with four units29 accounting for 16.3% of
Capacity Credits assigned for the 2020-21 Capacity Year.

 Scheduled Generator map for the SWIS, 2020-21

Non-Scheduled Generators
NSGs are typically assigned a lower level of Capacity Credits relative to their nameplate capacity, to reflect
their contribution during peak demand periods, in comparison to Scheduled Generators which are assigned
Capacity Credits based on their maximum generation capacity at 41°C30. The Capacity Credit assignment,
nameplate capacity, and location of each Non-Scheduled Generator certified for the 2020-21 Capacity Year is
shown in Figure 4.
Despite the quantity of Capacity Credits assigned to existing NSG Facilities decreasing31, the quantity of
Capacity Credits assigned to new and existing NSGs has increased overall by 74.209 MW (or 40%) between
the 2019-20 and 2020-21 Capacity Years, from 183.470 MW to 257.679 MW. This increase is due to two:
• Facility upgrades – Badgingarra Wind Farm and Greenough River Solar Farm – totalling 14.484 MW of
 capacity.

28
 The 3.372 MW increase in assigned Capacity Credits is a result of improved operational efficiencies/output from existing Scheduled Generators.
29
 Muja CD comprises Muja units G5, G6, G7, and G8, with 195, 193, 211, and 211 MW of Capacity Credits in the 2020-21 Capacity Year, respectively.
30
 The estimated contribution of NSG Facilities during peak periods is determined using the Relevant Level Methodology as detailed in Appendix 9 of the
 WEM Rules. Available at https://www.erawa.com.au/rule-change-panel/wholesale-electricity-market-rules. Scheduled Generators usually receive a quantity
 of Capacity Credits close to their nameplate capacity.
31
 Capacity Credits assigned to many existing Facilities have decreased due to decreasing Relevant Levels (the MW quantity determined by AEMO in
 accordance with the Relevant Level Methodology specified in Appendix 9 of the WEM Rules).

© AEMO 2019 | 2019 Electricity Statement of Opportunities 16
• New Facilities – Warradarge Wind Farm and Yandin Wind Farm – totalling 77.056 MW of capacity.
NSG capacity is comprised of 78% wind, 16% solar, and 6% biogas. The assignment of Capacity Credits for
wind and biogas Facilities tends to be relatively consistent each year. In contrast, individual solar Facilities are
demonstrating trends of lower Capacity Credit assignment. This is caused by increased behind the meter
photovoltaic (PV) penetration reducing the level of demand from the SWIS during the day, consequently
shifting peak demand intervals to evening periods when solar irradiance is minimal32. Section 4.1.4 contains
further information relating to peak demand intervals shifting to evening periods.

 Non-Scheduled Generators map for the SWIS, 2020-21

2.2.2 Facility size and characteristics

Classification of Capacity Credits
The Capacity Credits assigned to a Facility indicate the level of capacity that is expected to be available during
peak demand periods. This is independent of the total energy generation each year, which is affected by
factors including operating cost per megawatt hour, age, system demand, classification, and scheduled
outages.
Newer generators are generally more fuel-efficient and can operate for longer periods without an outage, so
have a higher energy output. Facilities that provide baseload generation, such as coal-fired generators, are
designed to operate continuously and have high start-up costs. Consequently, it may be more economically

32
 The generation profiles of large-scale and behind the meter PV are correlated, and a decline in behind the meter PV generation in the evening
 corresponds to a subsequent increase in observed demand from the grid. As a result, peak demand periods are typically occurring after the decline in
 behind the meter PV generation, where large-scale PV demonstrates a similarly low output, leading to a reduced Relevant Level.

© AEMO 2019 | 2019 Electricity Statement of Opportunities 17
viable for these Facilities to continue to operate at lower demand times when wholesale electricity prices are
low or even negative due to high levels of generation from NSG.
AEMO defines the classification of baseload, mid-merit, peaking, and NSG Facilities as follows33:
• Baseload capacity relates to Scheduled Generators that operate more than 70% of the time.
• Mid-merit capacity relates to Scheduled Generators that operate between 10% and 70% of the time.
• Peaking capacity relates to Scheduled Generators that operate less than 10% of the time.
• NSG capacity relates to Facilities that cannot be scheduled because the level of output is dependent on
 factors beyond the control of the operator.
The nameplate capacities, Capacity Credit assignments, and classifications of Facilities that have received
Capacity Credits in the 2020-21 Capacity Year are shown in Figure 5.

 Facility Capacity Credits and operating classification (Facilities receiving more than 35 MW
 of Capacity Credits)A,B

A. Facilities smaller than 35 MW have been excluded for better presentation of the information.
B. The difference between nameplate capacity and Capacity Credits for Scheduled Generators relates to the measurement at 41°C being
slightly lower than nameplate capacity. For NSGs, the difference is accounted for by the Relevant Level calculation.

In summary, for the 2020-21 Capacity Year:
• The 12 largest Facilities by Capacity Credits have been classified as either baseload or mid-merit, and hold
 57% of the total assigned Capacity Credits.
• 53% of assigned Capacity Credits have been classified as baseload, 21% as mid-merit, and 19% as peaking.
 The remaining Capacity Credits have been assigned to NSG and DSM Facilities.

33
 The classification of baseload, mid-merit, and peaking Facilities is based on the percentage of Trading Intervals in the 2017-18 Capacity Year that the
 Facility operated, adjusted for full outages. A full outage has been defined as a Trading Interval where a Facility has gone on an outage equal to its
 Capacity Credit allocation during the 2017-18 Capacity Year.

© AEMO 2019 | 2019 Electricity Statement of Opportunities 18
• 100% of coal, 65% of gas, and 12% of dual-fuel Capacity Credits have been classified as baseload, totalling
 2,627.1 MW.
• 17% of gas and 52% of dual-fuel Capacity Credits have been classified as mid-merit, totalling 1,053.6 MW.
• 18% of gas, 100% of diesel and 36% of dual-fuel Capacity Credits have been classified as peaking, totalling
 941.172 MW.
For comparison, the behind the meter PV fleet (which does not receive Capacity Credits) had an installed
capacity of approximately 1,036.8 MW as of December 2018, which is larger than Muja CD at 854 MW.

Facility age
Capacity Credits assigned for the 2020-21 Capacity Year are summarised in Figure 6, by fuel type and age of
the generation mix participating in the RCM. Wind and solar are the most common fuel type installed over
the past five years, despite receiving a significantly lower level of Capacity Credits than those assigned to
Scheduled Generators. This is likely due to the additional sources of revenue streams available through
Large-scale Generation Certificates under the Renewable Energy Target34, and the relatively lower cost of
operation compared to Scheduled Generators.
Other aspects relating to generator age and Capacity Credits include:
• At 34-39 years old, the Muja CD coal Facilities are the oldest generation in the SWIS and received a total
 of 810 MW of Capacity Credits in the 2020-21 Capacity Year.
• 97% of large-scale solar capacity has been installed in the past five years or is currently under
 construction.

 Capacity Credits in the SWIS by fuel type and generator age, for the 2020-21 Capacity Year

34
 For further information, see http://www.environment.gov.au/climate-change/government/renewable-energy-target-scheme.

© AEMO 2019 | 2019 Electricity Statement of Opportunities 19
3. Forecast methodology
 and assumptions

This chapter describes the methodology and assumptions used to undertake the 2019 Long
Term PASA study for the 2019-20 to 2028-29 Capacity Years to meet the Planning Criterion
outlined in the WEM Rules. It includes a summary of methodologies for peak demand and
operational consumption35 forecasts and the expected energy shortfall (unserved energy)
assessment. It presents inputs into the peak demand and operational consumption
forecasts, including:
• Distributed energy resources technologies36 uptake (behind the meter PV and battery
 storage, and electric vehicles [EVs]).
• Economic growth.
• Population growth.
• New block loads.

3.1 The Planning Criterion
The Planning Criterion that AEMO uses in the Long Term PASA study is outlined in clause 4.5.9 of the WEM
Rules37. The Planning Criterion includes two parts to ensure that there is sufficient available capacity in each
Capacity Year during the 2019 Long Term PASA Study Horizon 38 to:
• Meet the highest demand in a half-hour Trading Interval (part (a) of the Planning Criterion), assessed using
 the expected 10% probability of exceedance (POE39) peak demand forecasts presented in Chapter 4.
• Ensure adequate levels of energy can be supplied throughout the year (part (b) of the Planning Criterion),
 assessed by conducting reliability analysis to forecast the expected unserved energy (EUE) based on the
 peak demand and operational consumption forecasts presented in Chapters 4 and 5.
In line with past trends, the 2019 Long Term PASA study determined that the peak demand-based capacity
requirement in part (a) set the Reserve Capacity Target (RCT)40 for each Capacity Year from the 2019-20 to

35
 Operational consumption refers to electricity supplied from the transmission grid over a period.
36
 DER technologies refers to small-scale embedded technologies that either produce electricity, store electricity, or manage consumption, and reside within
 the distribution system, including resources that sit behind the customer meter.
37
 The Planning Criterion applies to the provision of generation and DSM capability – see clause 4.5.10 of the WEM Rules.
38
 The 2019 Long Term PASA Study Horizon is the 10-year period commencing on 1 October 2019 (1 October in Year 1 of the 2019 Reserve Capacity Cycle).
39
 POE means the likelihood a peak demand forecast will be met or exceeded. A 10% POE peak demand forecast is expected to be exceeded, on average,
 only one year in 10, while 50% and 90% POE peak demand forecasts are expected to be exceeded, on average, five years in 10 and nine years in 10
 respectively. A 10% POE forecast assumes more extreme weather and is more conservative than 50% and 90% POE forecasts for capacity planning.
40
 The RCT is AEMO’s estimate of the total amount of generation and/or DSM capacity required in the SWIS to satisfy the Planning Criterion for a Capacity
 Year under an “expected demand growth” scenario – see clause 4.5.10(b)(i) of the WEM Rules.

© AEMO 2019 | 2019 Electricity Statement of Opportunities 20
2028-29 Capacity Years. The RCT determined for the 2021-22 Capacity Year sets the RCR for the 2019 Reserve
Capacity Cycle. Detailed information about the forecast RCT is provided in Chapter 6.
Section 3.2 summarises the methodologies used to assess both elements of the Planning Criterion in the 2019
Long Term PASA study.

3.2 Forecast methodology
3.2.1 Overview
The general forecasting methodology41 undertaken by AEMO’s consultants to provide the key forecasting
inputs for this 2019 WEM ESOO is consistent with that used for ESOOs in the National Electricity Market
(NEM)42, where practical. The demand forecasts are based on similar parameters, such as weather, number of
connections and economic growth. The same consultants were used to provide the economic and DER
forecasts for both the WEM and NEM as inputs to the ESOO forecasts.
AEMO engaged:
• Deloitte Access Economics (DAE) to develop economic and population growth forecasts (see Sections 3.4.1
 and 3.4.2)43.
• Commonwealth Scientific and Industrial Research Organisation (CSIRO) to develop DER forecasts (see
 Section 3.3)44.
• ACIL Allen to develop the peak demand and operational consumption forecasts for the 2019 WEM ESOO
 (see Sections 3.2.2 and 3.2.3)45.
• Robinson Bowmaker Paul (RBP) to carry out reliability forecasts, including EUE (see Section 3.2.4)46.
ACIL Allen adopted a similar approach to forecasting as in previous years, with improvements made to the
assumptions associated with the impact of behind the meter PV, batteries, EV, and block loads.
The peak demand forecasts developed by ACIL Allen were based on:
• Three weather scenarios: 10% POE, 50% POE, and 90% POE.
• Low, expected, and high demand growth scenarios, which reflect different economic and population
 scenarios, different levels of new block loads (of at least 20 MW in size), and different levels of EV uptake.
ACIL Allen applied three forecasts of demand growth (low, expected, and high) for each of the three weather
scenarios, for a total of nine peak demand forecasts. A total of three operational consumption forecasts were
developed, under low, expected, and high demand growth scenarios.
Using a similar methodology as in the 2018 WEM ESOO, the expected scenario for behind the meter PV
uptake was applied across the three demand growth scenarios. This approach continues to be adopted
because behind the meter PV uptake has been observed to be strongly driven by the payback period
(calculated based on factors such as installation cost, electricity prices and customer load sizes) and

41
 This section discusses the methodology used to prepare summer peak demand forecasts. For details about the winter forecasts, see ACIL Allen’s report.
42
 Major differences in the detailed requirements of the approach include timing of studies, specific WEM rule requirements for the RCM which are different
 to the NEM (e.g. reliability planning criteria), and treatment of network constraints in the WEM.
43
 DAE 2019. Long term economic scenario forecasts. Available at: http://aemo.com.au/-/media/Files/Electricity/NEM/Planning_and_Forecasting/Inputs-
 Assumptions-Methodologies/2019/Long-term-economic-scenario-forecasts---Deloitte-Access-Economics.pdf.
44
 CSIRO 2019. Projections for small scale embedded energy technologies. Available at: https://www.aemo.com.au/-
 /media/Files/Electricity/NEM/Planning_and_Forecasting/Inputs-Assumptions-Methodologies/2019/2019-Projections-for-Small-Scale-Embedded-
 Technologies-Report-by-CSIRO.pdf.
45
 ACIL Allen 2019. Peak demand and energy forecasts for the South West interconnected system. Available at: http://aemo.com.au/Electricity/Wholesale-
 Electricity-Market-WEM/Planning-and-forecasting/WEM-Electricity-Statement-of-Opportunities.
46
 RBP 2019. 2019 assessment of system reliability, development of Availability Curves, and DSM Dispatch Quantity forecasts for the South West
 interconnected system. Available at: http://aemo.com.au/Electricity/Wholesale-Electricity-Market-WEM/Planning-and-forecasting/WEM-Electricity-
 Statement-of-Opportunities.

© AEMO 2019 | 2019 Electricity Statement of Opportunities 21
customers’ technology adoption preferences, rather than general macroeconomic drivers like GSP growth 47.
As current observed trends suggest behind the meter battery uptake is likely to follow the same pattern, the
expected scenario for battery uptake was similarly applied across the three demand growth scenarios in this
2019 WEM ESOO.
A summary of the key assumptions behind each demand growth scenario is presented in Table 5.

Table 5 Key assumptions for low, expected, and high demand growth scenarios

 Expected Low High

 Economic growth forecast
 Expected Low High
 Developed by DAE – see Section 3.4.1

 Population forecast
 Expected Low High
 Developed by DAE – see Section 3.4.2

 Forecast block loads
 Determined by AEMO in consultation with Expected Low High
 stakeholders – see Section 3.4.3

 Weather conditions
 10% POE, 50% POE, and 90% POE peak demand forecasts were produced for
 Based on Perth Airport weather station
 each scenario.
 records sourced from BOM

 DER forecasts
 Developed by CSIRO – see Section 3.3

 Behind the meter PV Expected

 Batteries Expected

 EVs Expected Low High

3.2.2 Peak demand forecasts
ACIL Allen applied an econometric approach to forecasting peak demand in the SWIS by establishing a
statistical relationship between historical peak demand and key drivers including weather and economic
factors. Separate models were used for the summer and winter periods. The peak demand forecasts were
developed by applying the adjustments to the underlying peak demand forecasts to account for the impact
of existing and potential new block loads, EVs, behind the meter PV and battery storage, as shown in Figure 7.

 Components of peak demand forecasts

47
 See the CSIRO report.

© AEMO 2019 | 2019 Electricity Statement of Opportunities 22
Improvements in the underlying peak demand forecasting model for the 2019 WEM ESOO study include:
• Accounting for the contribution of block loads as discrete increases in peak demand by excluding existing
 block loads from the historical data used to estimate the underlying peak demand regression model. New
 and existing block loads were then added back on as post-model adjustments.
• Better accounting for the peak demand reduction caused by behind the meter PV shifting the peak
 demand time to later in the day. Historical underlying demand figures in the Trading Interval starting at
 17:3048 (when peaks are assumed to continue to occur during the outlook period, reflecting recent
 history49) were used to develop the underlying peak demand regression model, rather than the underlying
 peak demand values at the times of historically observed peaks.
• Accounting for EVs’ contribution to peak demand as post-model adjustments based on charging profiles
 developed by CSIRO.
These improvements resulted in lower peak demand forecasts and average annual peak demand growth
rates over the outlook period, compared to the model applied in the 2018 WEM ESOO 50.
Economic, demographic, and weather parameters51 were identified as other factors affecting peak demand
and energy consumption. Forecasts for the economic and demographic parameters are in Section 3.4.

3.2.3 Operational consumption forecasts
ACIL Allen used econometric models to develop its operational consumption forecasts. The underlying
residential and non-residential (including commercial and industrial) energy consumption regression models
were developed separately. Post-model adjustments were applied to both underlying forecasts to account for
the impact of behind the meter PV and EVs52. The non-residential underlying forecasts were further adjusted
by accounting for consumption of existing and potential new block loads.
Synergy supplied historical residential connections 53 and consumption by tariff to AEMO for the development
of the underlying residential energy consumption forecasts.
Heating degree days (HDD) and cooling degree days (CDD) were applied in the underlying modelling to
measure the impact of average temperature conditions on energy consumption. HDD and CDD are used to
determine the amount of energy required for heating and cooling respectively. The number of HDD and CDD
in a given year was calculated as the sum of the difference between average daily temperature and the
cooling and heating benchmark temperature respectively. The cooling benchmark temperature is 26°C and
24°C for the residential and the non-residential sectors respectively, when customers are assumed to turn on
air-conditioning. The heating benchmark temperature is 18°C for both sectors.

3.2.4 Reliability assessment
The reliability assessment was undertaken with the aim of limiting EUE to no more than 0.002% of annual
expected operational consumption for each Capacity Year of the 2019 Long Term PASA Study Horizon. RBP
carried out the assessment in three phases and applied a combination of time sequential capacity availability
simulation and Monte Carlo analysis.
• Phase 1: Develop forecast load duration curves (LDCs).

48
 Previous WEM ESOO reports used the actual underlying daily peak demand, which historically has occurred before 17:00.
49
 AEMO’s analysis indicates that continued uptake of behind the meter PV is likely to shift the peak demand interval later in the day (see Section 3.3.1).
50
 See Section 5.5 of ACIL Allen’s report for more detailed information.
51
 Daily maximum and minimum temperature data for the Perth Airport weather station was collected from the BOM from 1 January 1987. See Section 5.4 of
 ACIL Allen’s report for more detailed information.
52
 The net effect of battery storage on operational consumption is assumed to be zero, since batteries simply store energy (kilowatt hours [kWh]) to be used
 at a later time, and efficiency losses are small.
53
 In the SWIS, Synergy supplies electricity to non-contestable customers whose annual electricity consumption is less than 50 megawatt hours (MWh). See
 https://www.erawa.com.au/gas/switched-on-energy-consumers-guide/can-i-choose-my-retailer.

© AEMO 2019 | 2019 Electricity Statement of Opportunities 23
– Five distinct forecast LDCs were developed based on each of the five most recent historical load
 profiles (the 2012-13 to 2017-18 Capacity Years). This provided a greater level of variation in load
 chronology compared to using an averaged LDC to develop the forecast LDCs as in previous WEM
 ESOOs.
 – For each Capacity Year of the Long Term PASA Study Horizon, the historical load profile was scaled to
 match the 50% POE peak demand and expected energy forecasts. This produced five different forecast
 LDCs for each Capacity Year based on each of the five historical reference years used54.
• Phase 2: Run simulation to calculate the average EUE.
 – The EUE simulation was run five times for each Capacity Year using each of the five forecast LDCs
 developed in Phase 1. This resulted in five EUE estimates for each Capacity Year over the Long Term
 PASA Study Horizon. For each EUE simulation:
 ○ Time sequential capacity availability simulation was used to compare the total available capacity to
 the corresponding load in an hour. This considered planned outages, intermittent generation, an
 application of the network constraints to Constrained Access Facilities 55, and randomly sampled
 forced outages. EUE occurs whenever the total available capacity is less than the load in an hour.
 ○ The Monte Carlo analysis was applied to run the EUE simulation over many iterations with
 probabilistically simulated forced outages. The EUE was calculated as the average of the total
 estimates of unserved energy of the Monte Carlo runs.
 – The average EUE for a given Capacity Year was calculated as the average of the five EUE estimates.
• Phase 3: Determine the amount of Reserve Capacity required to limit the EUE to 0.002% of the annual
 expected operational consumption forecast.
 – The average EUE was calculated as a percentage of the annual expected energy forecast for a given
 Capacity Year.
 – If the percentage of EUE is greater than 0.002%, the RCT is incrementally increased to reassess the
 average EUE until the EUE is less than or equal to 0.002%. The RCT will be then set by part (b) of the
 Planning Criterion.
For the 2019 Long Term PASA study, EUE remained less than 0.002% in every Capacity Year of the Long Term
PASA Study Horizon. The RCT was hence set by part (a) of the Planning Criterion for each of the 10 relevant
Capacity Years.

3.3 DER forecasts
AEMO commissioned CSIRO to develop DER forecasts of behind the meter PV and battery storage for
residential and commercial sectors, and EV for passenger vehicles, light commercial vehicles, trucks, and
buses56. These forecasts were applied as post-model adjustments to the underlying peak demand and energy
consumption forecasts.
The DER forecasts were developed for Australia across three growth scenarios: low, expected, and high57. The
WA forecasts are specific to the postcodes covered by the SWIS. All three growth scenario forecasts have
been provided in this section and the 2019 WEM ESOO data register for stakeholders to use in their analysis if
desired.

54
 The forecast LDC based on the 50% POE peak and expected energy demand represents an expected scenario for the reliability assessment in accordance
 with clause 4.5.9(b) of the WEM Rules.
55
 As defined in chapter 11 of the WEM Rules. Constrained Access Facilities include Facilities that are under the Generator Interim Access arrangement.
56
 The CSIRO DER forecasts included the installation numbers and capacity of behind the meter PV, battery storage and EV, and charge and discharge
 profiles of battery storage and EV. All assumptions and forecasts for DER reported in this section refer to gross quantities.
57
 Low, expected, and high scenarios are named differently in the CSIRO’s report as slow change, neutral and fast change scenarios respectively. In addition
 to these scenarios, CSIRO produced forecasts for low and high DER scenarios. The additional DER scenarios are discussed in more detail in CSIRO’s report.

© AEMO 2019 | 2019 Electricity Statement of Opportunities 24
You can also read