Fog-assisted Energy Efficient Cyber Physical System for Panic-based Evacuation during Disasters
←
→
Page content transcription
If your browser does not render page correctly, please read the page content below
© The British Computer Society 2021. All rights reserved.
                                                       For permissions, please e-mail: journals.permissions@oup.com
                                                                                         doi: 10.1093/comjnl/bxaa201

       Fog-assisted Energy Efficient Cyber
        Physical System for Panic-based
          Evacuation during Disasters

                                                                                                                        Downloaded from https://academic.oup.com/comjnl/advance-article/doi/10.1093/comjnl/bxaa201/6249696 by guest on 17 August 2021
                           Sahil1,2, * and Sandeep Kumar Sood3
              1
               School of Computing, Indian Institute of Information Technology, Una, HP, India
   2
       Department of Computer Science and Engineering, Guru Nanak Dev University Regional Campus,
                                           Gurdaspur, PB, India
       3
         Department of Computer Applications, National Institute of Technology, Kurukshetra, HR, India
                            ∗ Corresponding author: sahil.neelam@hotmail.com

 Disasters around the world have adversely affected every aspect of life and panic-health of stranded
 persons is one such category. An effective and on-time evacuation from disaster-affected areas can
 avoid any panic-related health problems of the stranded persons. Although the nature of disasters
 differ in terms of how they occur, the evacuation of stranded persons faces approximately same set of
 issues related to the communication, time-sensitive computation and energy efficiency of the devices
 operated in the disaster-affected areas. In this paper, a cyber physical system (CPS) is proposed
 that takes into account various challenges of the disaster evacuation, so an efficient on-time and
 orderly evacuation of stranded panicked persons could be realized. The system employs fog-assisted
 mobile and UAV devices for time-sensitive computation services, data relaying and energy-aware
 computation. The system uses a fog-assisted two-factor energy-aware computation approach using
 data reduction, which enables the energy-efficient data reception and transmission (DRecTrans)
 operations at the fog nodes and compensates to extend the period for other functionalities. The data
 reduction at fog devices employs Novel Events Identification (NEI) and Principal Component Anal-
 ysis (PCA) for detecting consecutive duplicate traffic and data summarization of high dimensional
 data, respectively. The proposed system operates in two spaces: physical and cyber. Physical space
 facilitates real-world data acquisition and information sharing with the concerned stakeholders
 (stranded persons, evacuation teams and medical professionals). The cyber space houses various
 data-analytics layers and comprises of two subspaces: fog and cloud. The fog space helps in providing
 real-time panic-health diagnostic and alert services and enables the optimized energy consumption
 of devices operate in disaster-affected areas, whereas the cloud space facilitates the monitoring
 and prediction of panic severity of the stranded persons, using a conditional probabilistic model
 and seasonal auto regression integrated moving average (SARIMA), respectively. Cloud space also
 facilitates the disaster mapping for converging the evacuation map to the actual situation of the
 disaster-affected area, and geographical population analysis (GPA) for the identification of the panic
 severity-based critical regions. The performance evaluation of the proposed CPS acknowledges its
 Logistic Regression-based panic-well being determination and real-time alert generation efficiency.
 The simulated implementation of NEI and PCA depicts the fog-assisted energy efficiency of the
 DRecTrans operations of the fog nodes. The performance evaluation of the proposed CPS also
 acknowledges the prediction efficiency of the SARIMA and disaster mapping accuracy through
 GPA. The proposed system also discusses a case study related to the pandemic disaster of coronavirus
 disease 2019 (COVID-19), where the system can help in panic-based selective testing of the persons,
                 and preventing panic due to distressing period of COVID-19 outbreak.

 Keywords: Fog Computing; Panic Attacks; Unmanned Aerial Vehicle (UAV); Energy Efficiency; Logistic
 Regression; Principal Component Analysis (PCA); Seasonal Auto Regression Integrated Moving Average

Section C: Computational Intelligence, Machine Learning and Data Analytics
                 The Computer Journal, Vol. 00 No. 0, 2021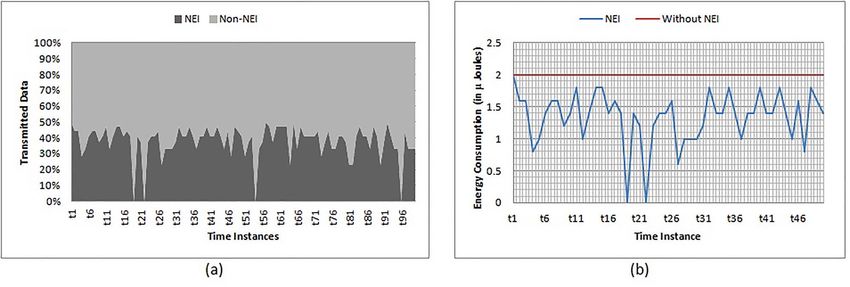
2                                                         Sahil and S. Sood

                      (SARIMA); Geographical Population Analysis (GPA); COVID-19; Internet of Things (IoT); Cloud
                                                             Computing
                               Received 3 April 2020; Revised 9 September 2020; Accepted 5 December 2020
                                                   Handling editor: Professor Gerard Parr

1.   INTRODUCTION                                                     numbness or tingling, fear of dying and fear of losing

                                                                                                                                           Downloaded from https://academic.oup.com/comjnl/advance-article/doi/10.1093/comjnl/bxaa201/6249696 by guest on 17 August 2021
                                                                      control or oncoming madness, whereas a clinical study [18]
Disasters over the past several decades have led to considerable
                                                                      has found that the prevalence of panic attack is majorly
destruction of physical infrastructure, a massive amount of
                                                                      manifested by the nine most commonly endorsed symptoms,
human injuries, large-scale human causalities and substantial
                                                                      namely accelerated heart rate (98.3%), dizziness (96.0%),
economic losses [1,2]. According to Swiss Re Institute [3],
                                                                      breathlessness (92.0%), sweating (88.0%), chest pain (85.0%),
the natural and manmade disasters in 2019 have jointly caused
                                                                      chills (84.0%), trembling (84.0%), nausea (83.0%) and choking
around 140 billion USD economic losses and claimed more
                                                                      (79.0%).
than 11 000 lives. The Indian floods during the month of
                                                                         Panic-exposed situations can lead to the various medical con-
August in 2019 have killed more than 420 persons and caused
                                                                      ditions [19] among persons viz. panic disorder, post-traumatic
an economic loss of 7 billion USD [4]. Alone the disaster of
                                                                      stress disorder (PTSD), effect on cardiovascular system and
wildfires in 2015 has victimized 494 000 persons and caused
                                                                      impairment of immune system. In panic disorder [20], the panic
a 3.1 billion USD economic damage [5]. The hurricane Kat-
                                                                      attacks occur repeatedly and unexpectedly, and the person
rina in 2005 has affected millions of people and killed more
                                                                      remains in a constant terror of having additional occurrences of
than 1800, and caused 340 billion USD economical loss [6].
                                                                      panic attacks. In PTSD [21], lasting consequences of traumatic
Such substantial increase in number and impact of disasters
                                                                      ordeals viz. helplessness, intense fear etc. develop and remain
in the recent past has affected every corner of the world, and
                                                                      for months. The long-term panic exposure can affect the human
made disaster-associated risks the significant part of the threat-
                                                                      body, and increase the susceptibility of developing chronic
space on this planet [7]. The disaster-associated risks can be
                                                                      medical conditions [22]. In a situation of panic, stress or
mapped from the exacerbating effects of the climate change
                                                                      anxiety, the brain sends signals to fight or flee in response. The
[8], and deteriorating situations like unplanned urbanization,
                                                                      body responds by releasing hormones like cortisol. However,
demographic changes and unpreparedness to deal with disas-
                                                                      the long-term exposure of cortisol impairs the immune system,
ter events [9]. Resultantly, the human population exposure to
                                                                      as cortisol prevents the release of chemicals which causes
disasters has increased significantly [10] and posing various
                                                                      inflammation, which consequently affects the capability of the
threats to the entire humankind. One such threat is panic-related
                                                                      immune system to protect the body against infections. That’s
health problems.
                                                                      why persons with the chronic condition of panic disorder may
   The exposure to potentially traumatic events like disasters
                                                                      be likely more susceptible to catch flu, common cold or other
has severe consequences in various health-related issues, and
                                                                      kinds of infections. In a situation of panic, breathing may
this can be attributed from the extensive literature, which
                                                                      become shallow and rapid, a situation called hyperventilation,
indicates that the high incidence of panic attacks (69–77%)
                                                                      where the body allows lungs to inhale more oxygen, so the
occurs among the persons exposed to traumatic events and
                                                                      oxygen could transport in the body quickly, and prepare the
causes various panic-related health problems [11] [12]. The
                                                                      body to respond to the situation of panic. The situation may
impact of witnessing various traumatic events during disasters,
                                                                      become worse for a person suffering from Chronic Obstructive
on stranded persons, can be characterized by the feeling of
                                                                      Pulmonary Disease (COPD). Panic situations can also accel-
fear, which prompt stern physical reactions known as panic in
                                                                      erate the heart rate. A person suffering from vasoconstriction
disasters [13]. These incidences of panic occurred in the form
                                                                      (a medical condition, where the blood vessels of the person
of sudden periods of intense fear termed as panic attacks. The
                                                                      are narrow) may experience increased vulnerability of coronary
sudden onset of a panic attack without any warning causes
                                                                      events, in a situation of panic. Henceforth, the consideration
intense discomfort [14] [15], and typically spans over 10 to 20
                                                                      of panic health of the stranded persons during the disaster is
min, but may last for more than an hour in extreme cases [16].
                                                                      critical for on-time and effective evacuation, and to avoid any
The diagnostic criteria of DSM-V of American Psychiatric
                                                                      panic-related post-disaster health problems.
Association [17] state that a panic attack can be characterized
by the occurrence of at least four of the symptoms, namely
                                                                      1.1.   Challenges
accelerated heart rate, breathlessness, chest pain, trembling,
feeling of choking, abdominal discomfort or nausea, chills            During disasters, the panic-health of the stranded persons is
or feeling of warmth, insatiability or faintness, dizziness,          impacted due to the witnessing of various dreadful situations.
derealization or feeling unreal, sweating, hallucinations or          The evacuation of such persons on a priority basis can prevent

                Section C: Computational Intelligence, Machine Learning and Data Analytics
                                 The Computer Journal, Vol. 00 No. 0, 2021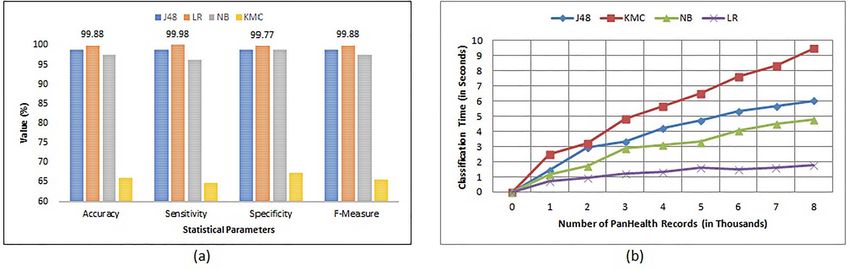
Fog-assisted Energy Efficient CPS for Evacuation                                             3

the ill-effects of panic on their health. However, the situations    management [28], healthcare [29], transportation [30], indus-
of critical infrastructure like roads, bridges, buildings etc., in   trial manufacturing [31], and alike. The integration of IoT net-
the disaster-affected areas, change over the time due to the         work with cloud computing has provided these smart things and
disruptions and dynamic phenomenon like the flooding of              mobile devices higher storage and computation capabilities,
roads, smoke, debris, etc. Hence, in such situations, the real-      and made the system to analyze the physical world scenarios
time monitoring and analysis of the stranded persons’ health         for different domains remotely. The advent of fog computing
and situational information of the disaster-affected areas can       in Cloud-IoT scenario has further exploited the computation
enable the evacuation process effective and timely [23]. This        functionalities of the cyber space to provide shorter response,

                                                                                                                                         Downloaded from https://academic.oup.com/comjnl/advance-article/doi/10.1093/comjnl/bxaa201/6249696 by guest on 17 August 2021
can be only possible if the Information and Communication            location-aware computation and less dependency on network
Technologies (ICT) could complement the evacuation teams in          bandwidth [32] [33]. The placement of fog-devices at the net-
realizing the entire situation from remote locations, and enable     work edge, near to data sources, and away from cloud servers,
them to act accordingly.                                             makes this paradigm suitable for time-sensitive applications.
   However, the various limitations restrict the realization of         In situations like disasters, where entire communication
the effective evacuation process: (1) communication, (2) time-       infrastructure is highly affected and most of the time leads
sensitive computation and (3) energy efficiency of the devices,      to the complete breakdown, the aggregation of data from the
in disaster-affected areas. Communication is one of the main         sensors, and relay to the cloud servers, requires a kind of ad
concerns in disaster-affected areas. The communication infras-       hoc networking infrastructure. The UAVs facilitates various
tructure is highly affected by the destructive nature of the         such data-related activities in the disasters by acting as mobile
disasters, and most of the time leads to the complete breakdown      relay [34]. UAVs can reach in such hostile situations, and
of the entire communication network [24]. In such situations,        operate as relay nodes in facilitating the communication of
the partial or complete failure of communication between the         ground nodes with the remote data centers [35] [36] [37]. The
stranded persons and response system can lead to the delays          integration of these technological paradigms, and addressing
and faults in response and subsequently to unavoidable loss          of evacuation-related challenges can end up in an effective on-
of life. In situations like disasters, where on-time decision-       time and orderly evacuation system.
making is critical for various time-sensitive applications, the
incapability of evacuation teams and monitoring frameworks
                                                                     1.3.   Focus
to monitor real-time dynamics viz. health parameters and envi-
ronmental information can deteriorate the on-time and orderly        In the times where the quality of life is quantified in terms
evacuation of the stranded persons. The power grids or source        of up to what extent a human can achieve the sustainability
of power also get affected due to the destructive impact of the      regarding health, living, handling of unexpected events and
disasters and might result in the unavailability of power supply     other matters, the technology plays an essential role in every
in disaster-affected areas. Hence, the majority of devices in        aspect of human life. The incorporation of ICT in the domain
the post-disaster phase operates primarily on battery-sourced        of disaster management is one such dimension, which focuses
power [25]. These devices remain alive for a limited period of       on the sustainability of human beings regarding the handling
time, and need to be recharged. Hence, the operations of these       of unexpected disaster events [38]. In this paper, a cyber phys-
devices must be energy-aware to keep these devices alive for         ical system (CPS) is proposed that takes into account various
an elongated period.                                                 challenges of the disaster evacuation, so an effective on-time
                                                                     and orderly evacuation of stranded panicked persons can be
                                                                     realized. The CPS can be considered as the orchestration of
1.2.   Motivations
                                                                     physical systems and distributed computing, where properties
Evacuation is the key in the post-disaster management activities     of the physical systems are acquired by the transducers and
and attracting more and more attentions of the nations, industry     analyzed by the computation resources of the cyber systems
and academia around the world. The on-time and orderly evac-         [39]. The proposed system operates in two spaces: physical
uation of stranded persons from disaster-affected areas can save     and cyber. Physical space facilitates the acquisition of various
lives and reduce the destructive effects of disasters on human       disaster-related attributes, using wireless body area network
health effectively. However, for effective disaster evacuation,      (WBAN)-assisted biosensors and behavioural sensors, and IoT-
the real-time situation awareness viz. damages to the paths,         assisted environmental sensors. It also provides alerts to the
physical environment and monitoring of stranded persons is           concerned stakeholders (stranded persons, evacuation teams
crucial [26] and provides a holistic picture of the disaster-        and medical professionals). The cyber space houses various
affected areas to the evacuation teams.                              data-analytics layers and comprises of two subspaces: fog
   The advancements in sensor technology and wireless com-           and cloud. The fog space employs local data analytics for
munication, and their assimilation in the internet of things         time-sensitive and energy-aware computation using fog com-
(IoT) [27] has promoted the wide-scale deployment of smart           puting and relays the acquired physical data to the remote
things and mobile devices in various domains like disaster           cloud servers in the cyber space. The fog space helps in

                Section C: Computational Intelligence, Machine Learning and Data Analytics
                                 The Computer Journal, Vol. 00 No. 0, 2021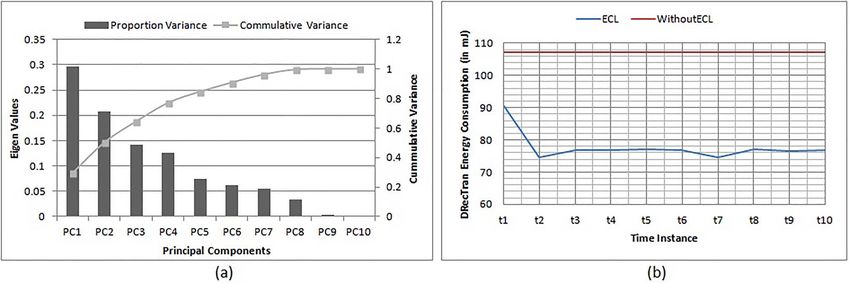
4 Sahil and S. Sood
providing real-time panic-health diagnostic and alert services, work lacks the corresponding feature. The feature EEA also
and enables two-factor energy efficiency of fog devices oper- mentions the approaches which have been employed by the
ated in disaster-affected areas using data reduction. It houses corresponding works for achieving energy efficiency. The
three layers: synchronization (SYN), panic wellbeing determi- comparison depicts that none of the evacuation-based work
nation and smart decision making (PWD) and energy conser- has considered the healthcare aspect during the process of
vation layer (ECL). evacuation. The literature review has also not found any smart
After processing at fog space, the data advance to the cloud healthcare framework regarding the panic attacks. Based on
space for panic severity analysis and disaster mapping. The the analysis of the literature review and comparison of the
Downloaded from https://academic.oup.com/comjnl/advance-article/doi/10.1093/comjnl/bxaa201/6249696 by guest on 17 August 2021
cloud space employs two layers, namely Panic Severity Analy- state-of-the-art works, the presented CPS has focused on
sis (PSA) Layer and Disaster Mapping Layer (DML). The PSA the criticality of panic-based healthcare during disasters, and
monitors and predicts the panic severity of the stranded per- proposed a panic-based evacuation system that enables on-
sons using conditional probabilistic analysis and seasonal auto time and orderly evacuation of the stranded persons and also
regression integrated moving average (SARIMA) respectively, considers the energy constraints of the devices operated in
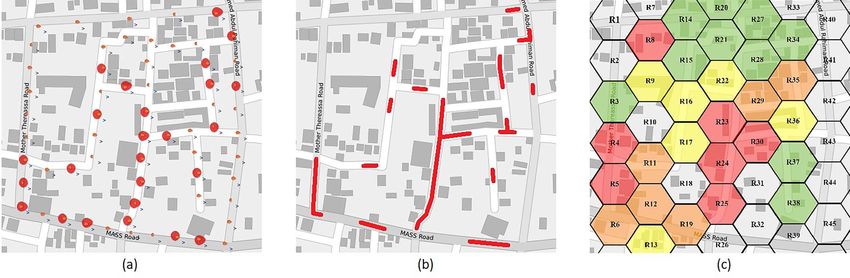
whereas the DML employs geographical population analysis disaster-affected areas.
(GPA) to identify the critical regions and evacuation-priority This paper has been organized into five parts. The sec-
within those regions based on the determined panic severity of ond part presents the proposed CPS and discusses its various
the stranded persons. DML also converge the evacuation maps subsystems. The third part evaluates the performance of the
to the actual situations, based on the monitored disaster status proposed system. The fourth part discusses a case study related
of the routes. The knowledge of evacuation routes, identified to the coronavirus disease 2019 (COVID-19) based panic. The
critical regions and panic severity-based evacuation priority of fifth part concludes the findings from the presented research.
the stranded person in those regions provides the evacuation
teams with the capability to plan their strategy for on-time and
2. PROPOSED SYSTEM
orderly evacuation.
The proposed CPS operates in two spaces: physical and cyber,
1.4. Contributions as shown in Fig.1. The physical space facilitates the process
of data acquisition through various sensors and the cyber space
The proposed CPS has a significant set of contributions in houses various data analytics layers. The cyber space comprises
the domain of energy-aware disaster-oriented healthcare and of two subspaces, namely fog space and cloud space. Fog space
evacuation as follows. employs fog computing-based local data analytics for time-
sensitive and energy-aware computation at the fog nodes. It
• This paper contributes a smart framework for panic- houses three layers: SYN, PWD and ECL. The acquired data
based on-time and orderly evacuation of the stranded from physical space are processed at fog space, and finally
persons. stored at the cloud storage in cloud space. The cloud space
• This paper provides a fog-assisted two-factor energy employs two layers namely PSA Layer and DML, and facili-
efficiency approach using data reduction. tates the analysis of panic severity of the stranded persons, and
• This paper provides a data reduction approach names as disaster mapping by converging evacuation maps to the actual
Novel Event Identification to identify two-dimensional situation, and identification of panic severity-based critical
duplicate data. regions, and prioritizing of the evacuation of panicked persons
• This paper provides an approach names as Geographi- in those regions. The proposed system facilitates on-time and
cal Population Analysis to identify the disaster critical orderly evacuation of the stranded persons. Each space of the
regions based on the panic severity of the stranded proposed CPS has been explained as follows.
persons.
2.1. Physical Space
1.5. State-of-the-Art Literature and Paper Organization
The responsibility of the physical space is to acquire the var-
Table 1 depicts various significant state-of-the-art related ious disaster-related attributes and provide alerts to the con-
works. The table represents the major contributions of these cerned stakeholders (stranded persons, evacuation teams and
state-of-the-art works, and compare them based on nine feature medical professionals). This space collects the panic health
viz. Fog/Edge Computing (FC/EC), Cloud Computing (CC), (PanHealth)-related attributes of the stranded persons, and the
IoT, Real Time Monitoring (RTM), Prediction Modeling (PM), disaster environment (DisEnvi)-related attributes of the sur-
Strategy Based Evacuation (SBE), Healthcare Aspect (HCA), roundings, as shown in Table 2. The proposed system employs
Information Sharing √ (IS) and Energy Efficiency Approach biosensors, behavioral sensors and WBAN for acquiring Pan-
(EEA). The tick ( ) indicates that the work comprises of Health attributes [18]. The PanHealth-related physiological
the corresponding feature, and cross (×) indicates that the attributes like heart rate, breathlessness, chest pain, nausea and
Section C: Computational Intelligence, Machine Learning and Data Analytics
The Computer Journal, Vol. 00 No. 0, 2021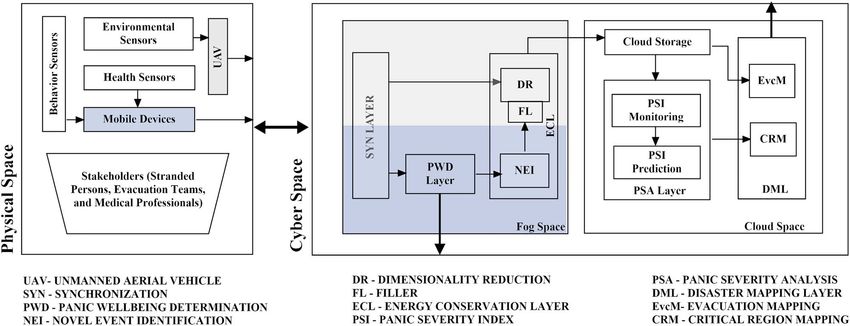
TABLE 1. State-of-the-art comparison.
Authors Major contribution Year FC/EC CC IoT RTM PM SBE HCA IS EEA
√ √ √ √ √ √
Xu et al. [6] Relationship-based 2018 × × ×
personalized evacuation scheme
√ √ √ √ √
Bhattacharjee et al. [40] Crowdsensing-based evacuation 2019 × × × ×
maps building using smartphone-based
delay tolerant networks
√ √ √ √
Karthik and Suja [41] Wireless Sensor Network 2019 × × × × ×
(WSN)–based geographic
map-oriented path discovery to
multiple exits
√ √ √
Fathy and Barnaghi [27] Energy-aware communication 2019 × × × × × Data Reduction
through reduced data transmission
√ √ √
Ejaz et al. [42] Coverage-area based UAV 2020 × × × × × Optimized data
scheduling for energy efficient collecting route
data collection
√ √ √ √ √
Akmandor [43] Sensor-based machine learning 2018 × × × Data Reduction
inference and compression
√ √ √ √ √ √
Santamaria et al. [44] Cognitive Intelligence-based 2018 × × Data Reduction
human activity using
behavioral sensors
√ √ √ √ √ √
Gia et al. [45] Physiological, behavioral and 2019 × × Adaptive Sampling
environmental
The Computer Journal, Vol. 00 No. 0, 2021
Fog-assisted Energy Efficient CPS for Evacuation
attributes-based health monitoring
√ √ √ √ √ √ √
Asghari et al. [46] Prediction of medical conditions 2019 × ×
for providing appropriate
health services.
√ √ √ √ √ √ √ √
Proposed CPS Fog-assisted energy efficient 2021 Data Reduction
panic-based disaster evacuation
Section C: Computational Intelligence, Machine Learning and Data Analytics
5
Downloaded from https://academic.oup.com/comjnl/advance-article/doi/10.1093/comjnl/bxaa201/6249696 by guest on 17 August 2021
6                                                       Sahil and S. Sood

                                                                                                                                       Downloaded from https://academic.oup.com/comjnl/advance-article/doi/10.1093/comjnl/bxaa201/6249696 by guest on 17 August 2021
                            FIGURE 1. Architecture of panic-oriented evacuation-based cyber physical system.

sweating are acquired by the wearable biosensors, whereas the
PanHealth-related behavioral attributes like dizziness, chills,
trembling and choking are acquired by the wearable behav-
ioral sensors. The mobile devices of the stranded persons act
as the sink nodes [47] in the WBAN, for aggregating Pan-
Health attributes from the biosensors and behavioral sensors,
in the physical space. The WBAN also acquires the location
of the persons using GPS sensor of the sink nodes. The wifi-
capability of the sink nodes provides the WBAN with an
extension to integrate with the IoT network to transmit the
acquired PanHealth attributes to the cyber space for advanced
processing [48].
    The IoT-assisted environmental sensors, present in ambient,
acquire DisEnvi attributes, namely visibility range, temperature
of the structures and environment, water level, smoke detection,                          FIGURE 2. Fog Network.
tilt in structures and obstacle in the path. These environmen-
tal sensors are implanted in the ambient viz. in-pavements,
buildings, etc. These sensors transmit the location of their own
placement along with acquired DisEnvi attributes in the IoT          2.2.1.Fog Space
network. The UAVs act as the sink nodes in the IoT network           Fog space employs fog computing-based local data analytics
for aggregating DisEnvi attributes from environmental sensors,       for time-sensitive and energy-aware computation at the fog
in the physical space. The acquired data by mobile devices and       nodes. It houses three layers: SYN, PWD and ECL. In this
UAVs from Physical space are transmitted into cyber space for        space, two types of fog nodes, User Fog Node (UFN) and
various data analytical processing.                                  Network Fog Node (NFN), operate at the different levels of
                                                                     the fog network, as shown in Fig. 2, and host three layers of
                                                                     fog space, as shown in Fig. 1. The acquired PanHealth data
                                                                     using WBAN sensors, from physical space, are transmitted to
2.2.   Cyber Space
                                                                     the persons’ mobile devices. These devices act as low-level
The acquired data from physical space arrive in the cyber            fog nodes for PanHealth data and are called as UFNs in the
space. The cyber space houses various data analytics layers          fog network. These UFNs are present in the proximity of
available at the different phases of the panic-based evacuation      the persons and provide local data analytics for time-sensitive
process. This space comprises of two subspaces, namely fog           and energy-aware computation. The UFNs also act as smart
space and cloud space. The explanation of each subspace is as        gateways for WBAN, by housing three layers: SYN, PWD and
follows.                                                             ECL, and extend the WBAN to the IoT network.

                Section C: Computational Intelligence, Machine Learning and Data Analytics
                                 The Computer Journal, Vol. 00 No. 0, 2021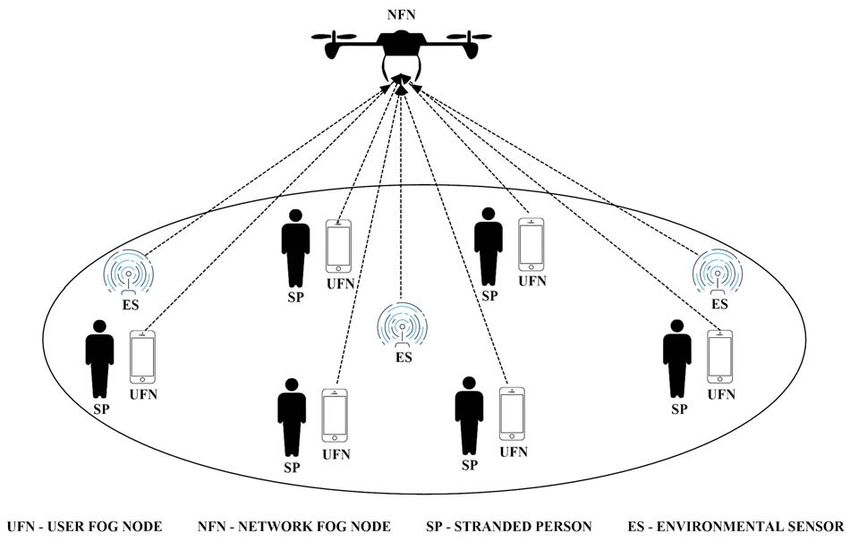
Fog-assisted Energy Efficient CPS for Evacuation                                                       7

                                                   TABLE 2. Disaster-related datasets.
S. No.     Dataset           Description                        IoT technology                      Attributes

1.         PanHealth         Data about the health related      Optical Heart Rate Sensors,         Heart rate, Breathlessness, Chest pain,
           dataset           physiological and behavioral       ECG Sensors, Contraction            Nausea, Sweating, Dizziness, Chills,
                             attributes of the stranded         Sensors, Capacitive Humidity        Trembling, Choking, Location.
                             persons.                           Sensors, Inertial Sensors,
                                                                Accelerometer, Piezoelectric

                                                                                                                                                  Downloaded from https://academic.oup.com/comjnl/advance-article/doi/10.1093/comjnl/bxaa201/6249696 by guest on 17 August 2021
                                                                Sensors, GPS Sensors.
2.         DisEnvi dataset   Environmental data regarding       Infrared Sensors, Temperature       Visibility, Temperature, Water level,
                             the surroundings of the stranded   Sensors, Ultrasonic Depth           Smoke detection, Tilt in structures,
                             persons.                           Sensors, Photoelectric Sensors,     Obstacle range, Disaster Location.
                                                                Electrolytic Sensors, GPS
                                                                Sensors.

   The acquired DisEnvi data using IoT-assisted environmental           2.2.1.2.Panic Wellbeing Determination and Smart Decision
sensors, from physical space, and the locally processed Pan-            Making Layer
Health data at UFNs in fog network, are transmitted to the              The UFNs host this layer for local data analytics and real-
UAVs. These UAVs act as sinks for DisEnvi data and as upper             time panic wellbeing determination at the users’ premises.
level fog nodes for UFNs processed PanHealth data in the                This layer, based on the acquired PanHealth data, continuously
fog network. These devices are called as NFNs in fog space.             classifies the panic wellbeing (PW) of the stranded person in
The NFNs fly in proximity to the environmental sensors and              one of the two classes, namely Normal (NOR) or Abnormal
mobile devices, for aggregating DisEnvi and PanHealth data,             (ANOR). The class of NOR depicts that the PW of the persons
and providing energy-aware computation to the aggregated                is normal, and does not require any special consideration in
data by housing two layers: SYN and ECL, as shown in Fig. 1.            the process of evacuation for the current instance. The class
The detailed explanation of each layer of the fog space is as           of ANOR depicts that the PW of the person is abnormal,
follows.                                                                means the person is panicked, and requires immediate medical
                                                                        guidance, and prioritized consideration further in the process
                                                                        of evacuation analytics. The PanHealth data of the stranded
                                                                        persons at a particular instance ti , in the proposed system,
                                                                        comprise of nine acquired attributes and forms a PanHealth
2.2.1.1.Synchronization Layer                                           vector (PaHi ). The incidence of a panic attack is determined
The synchronization layer acts as the entry point to the cyber          in that PaHi , based on the identification of any four and more
space, for the data acquired from physical space. This layer            symptoms. Hence, the PWD layer employs logistic regression
is present at both the UFNs and NFNs and performs the                   [50] for classifying the PW of the stranded persons. The logistic
task of global synchronization of the acquired data. The                regression fits for the categorical classifications, where deci-
remotely deployed sensors have different internal clocks: non-          sion boundaries are defined based on the threshold of various
synchronized, synchronized and no clock [49], and the acquired          scenarios, and the same is required in the determination of
data from these sensors do not synchronize globally. Hence,             PW of the stranded persons. The logistic regression defines
the proposed CPS has programmed the gateway nodes, i.e.                 the decision boundaries as linear or nonlinear and classifies the
UFNs in WBAN and NFNs in IoT network for synchronizing                  data into categorical classes. The logistic regression uses Eq. 1
the acquired PanHealth data and DisEnvi data, respectively.             to classify the PanHealth records based on the threshold using
These gateways globally synchronize the acquired data using             a function, as follows.
absolute global time stamps. These gateways tag the absolute
global time instances on the values of the acquired attributes
and synchronize the various events on the global timescale.                                           eω0 +ω1 .PaHi
The global synchronization of acquired data helps in depicting                                γ =                                           (1)
                                                                                                    1 + eω0 +ω1 .PaHi
the holistic picture of the disaster-affected area. It facilitates
various time-sensitive activities like real-time analysis of
panic wellbeing, panic severity monitoring and prediction and           where γ is the output the logistic regression, e is the base
disaster mapping. The synchronized PanHealth data transmit to           of natural logarithmic, ω0 is the intercept of bias, ω1 is the
the UFN-hosted PWD layer, whereas the synchronized DisEnvi              coefficient of the PanHealth record and PaHi is the PanHealth
Data transmit to the NFN-hosted ECL, as shown in Fig. 1.                record of the person at the time instance ti .

                 Section C: Computational Intelligence, Machine Learning and Data Analytics
                                  The Computer Journal, Vol. 00 No. 0, 2021
8 Sahil and S. Sood
The categorical classification requires the output of the in hostile situations like disasters. Since, the fog devices in
response to be either 1 or 0, and the Bernoulli distribution the proposed system facilitate data collection, time-sensitive
considers the probability of PW =1 (ANOR), if the output of local data analytics, data caching and transmission relay, their
the function is γ , and correspondingly the probability of PW energy-consumption consideration is critical for the effective
= 0 (NOR) if the output of the function is γ -1. But the linear operation of evacuation in disaster-hit areas, where the source
relation of γ and PaHi violates the constraint of the probability of power regeneration is not available [27]. Hence, the energy-
to range between 0 and 1. Hence, the logistic regression uses aware computation at the UFNs and NFNs can extend the
sigmoid function, which provides s-shaped curve to classify lifetime of fog nodes and guarantee the quality of service.
Downloaded from https://academic.oup.com/comjnl/advance-article/doi/10.1093/comjnl/bxaa201/6249696 by guest on 17 August 2021
the data into one of the category using the threshold of the In IoT networks, the data reception and transmission (DRec-
output of the function, as shown in Eq. 2. Trans) poses as the dominant factor for the energy consumption
of the devices, and consumes higher energy than the data
1 processing [50] [51]. However, by limiting the communica-
PW = sig(γ ) = (2)
1 + e−γ tion between the devices, the DRecTrans energy consumption
of the devices can be reduced [52], and compensated for
where PW depicts the class of the determined panic wellbeing, extending the period for other functionalities. The ECL of
and sig(γ ) is the categorized value of the logistic regression the proposed system considers these factors, responsible for
output γ . energy consumption in fog nodes, and enables energy-efficient
The fog-based local data analytics functionality at the UFN operations of the devices through energy-aware computation
enables real-time PW determination and alert generation to using data reduction at the fog nodes. The ECL focuses on three
concerned stakeholders. The alert generation provides on-time dimensions for energy-aware computation: data reduction, data
diagnostic alerts and medical guidance in the event of a panic quality and energy conservation. The ECL addresses these
attack, to the person and his/her relatives for immediate care, concerns by reducing data transmission from UFNs to NFN and
as shown in Algorithm 1. The determined PW class, along with from NFN to cloud servers in such a manner that the quality
acquired PanHealth record, is further transmitted to the ECL. of data can be retained by reconstructing the same data as if
they were from the source, and the energy can be conserved
Algorithm 1 Panic well-being determination and alert through reduced DRecTrans operations. The ECL employs the
generation following energy model to determine the energy consumption
of UFNs and NFNs.
Input: PanHealth Record PaHi , time instance ti
1: Until the person get evacuated Energy Model
2: Determine the current time stamp ti The energy model considers the energy consumption of fog
3: Map the PaHi to the feature space nodes during the operations of data collection, local data ana-
4: Determine the PW of the mapped sample using, lytics, data caching and data transmission. The model denotes
eω0 +ω1 .PaHi
5: γ = 1+e ω0 +ω1 .PaHi the energy consumption for data collection as ER , local data
6: PW = sig(γ ) = 1+e1−γ analytics and data caching as EP and data transmission as ET .
7: Send Diagnostic alert (PW) to the person The proposed energy model refers to the energy consump-
8: If PW == ANOR, then tion characteristics of the energy model [53] [54]. The model
9: Send Guidance alert to person & relatives considers the energy consumption of a UFN for collecting a
10: Transfer (PaHi ∪ PW) to the ECL single data value as α Joules. Suppose, a UFN receives m
11: Exit data values in an instance, then the total energy consumption
(ER _UFN ) for collecting m data values is shown Eq. 3. The
Output: PW of the stranded person and generated alerts model considers the energy consumption of a UFN for locally
analyzing and caching a single data value as β Joules. Suppose,
2.2.1.3.Energy Conservation Layer a UFN processes and caches m data values, then the total
During disasters, the infrastructure and essential services are energy consumption (EP _UFN ) for analyzing and caching m
highly affected by the destructive nature of the disasters, and data values is shown in Eq. 4. The model considers the energy
most of the time leads to the complete breakdown. In such consumption of a UFN for transmitting a single data value
hostile situations, the majority of disaster management oper- as η Joules. Suppose, the UFN transmits m’ data values after
ations primarily operate on battery-powered devices. These processing, then the total energy consumption (ET _UFN ) for
devices remain alive for a limited period of time, and need to transmitting m’ data values is shown in Eq. 5.
be recharged. In the proposed system, the fog devices UFNs
and NFNs operate in the disaster-affected areas. Therefore,
the inefficient energy consumption in these devices could have
a negative impact on the power-constrained fog operations ER _UFN = m ∗ α Joules (3)
Section C: Computational Intelligence, Machine Learning and Data Analytics
The Computer Journal, Vol. 00 No. 0, 2021Fog-assisted Energy Efficient CPS for Evacuation 9
EP _UFN = m ∗ β Joules (4) Then, the total energy consumption (ET _NFN ) of an NFN for
transmitting n’ data packets is shown in Eq. 13.
−→ h (11)
ET _UFN = m ∗ η Joules (5) = ρ ∗ h Joules (12)
n
Based on Equations 3–5, the total energy consumption of a
ET _NFN = i Joules (13)
Downloaded from https://academic.oup.com/comjnl/advance-article/doi/10.1093/comjnl/bxaa201/6249696 by guest on 17 August 2021
UFN (EUFN ) for relaying acquired data from sensors to NFN, i=1
for a particular time instance is shown in Eq. 6. The ECL at
the UFN works on optimizing the EUFN by employing a mod- Based on Equations 9–13, the total energy consumption
ule named Novel Event Identification (NEI), which reduces (ENFN ) of an NFN for relaying aggregated data from UFNs and
the acquired data from sensors, so the transmission energy environmental sensors, to the cloud server for a particular time
consumption ET _UFN can be minimized and resultantly could instance is shown in Eq. 14.
optimize the overall EUFN .
ENFN = ER _NFN + EP _NFN + ET _NFN Joules (14)
EUFN = (m ∗ α) + (m ∗ β) + (m ∗ η) Joules (6)
The ECL at the NFN works on optimizing the ENFN by
The energy model further considers the data received from employing a module named Dimensionality Reduction, which
UFNs and environmental sensors, to NFN, in the form of reduces the features of aggregated data, so the transmission
packets, which may have variable length. The proposed energy energy consumption (ET _NFN ) can be minimized. Even the
model only considers the number of data values, from a source energy consumption during the data collection (ER _NFN ) at
(UFN or environmental sensor) as the length of the packet. NFN is also optimized due to the energy-aware computation
During the relaying of data to the NFN, the model considers of data by NEI. Hence, the entire resultant of NEI and Dimen-
n number of UFNs and environmental sensors, which transmit sionality reduction helps in minimizing the ENFN . Each module
the data in an instance to that NFN. For collecting each packet, of this layer on UFNs and NFN is explained as follows.
the energy consumption at the NFN depends upon the size of
the packet. Let say a packet is of variable length h. Then, the 2.2.1.3.1.Novel Event Identification
energy consumption () for collecting each packet is directly The ECL employs a module named Novel Event Identifica-
proportion to the length of packet as shown in Equations 7 and tion (NEI) at UFNs to avoid consecutive duplicate PanHealth
8, and the total energy consumption (ER _NFN ) for collecting n data transmission to the NFN. The WBAN in physical space
data packets at NFN is shown in Eq. 9. continuously acquires the PanHealth events, and UFNs in fog
space continually monitor the panic wellbeing. However, the
−→ h (7) PanHealth attributes may not change or remain the same,
depend upon the body and surrounding events of the stranded
= ρ ∗ h Joules (8) person. In such a scenario, the transmission of data to the
NFN may involve the consecutive duplicate events, and even
where ρ is the constant, which accounts for the increasing consecutive duplicate attribute values too. This can result in
energy consumption with increase in packet length and vice- energy consumption for transmitting the duplicate data. The
versa. energy of the UFNs can be conserved by avoiding such dupli-
n cate data transmissions to the NFN. Hence, the NEI focuses on
the identification of duplicate data, i.e. consecutive duplicate
ER _NFN = i Joules (9)
i=1 events and consecutive duplicate attribute values, and allows
only novel events and novel attribute values to relay further in
The model considers the energy consumption of an NFN for the fog space.
locally caching, and processing a single packet as τ Joules. The sink node of the WBAN arranges the PanHealth
The total energy consumption (EP _NFN ) for locally caching attributes acquired at the time instance ti , in a well-defined
and processing the received and filled n’ data packets at NFN sequence to form a PanHealth vector (PaHi ), and follows
is shown in Eq. 10. the same sequence throughout the process. The PWD layer
classifies the PanHealth event PaHi at ti into one of the PW
EP _NFN = n ∗ τ Joules (10) class and appends the classified PW value to the PaHi . This
PaHi is analyzed by the NEI to identify the novel PanHealth
The model considers the energy consumption of an NFN for events, and attribute values. The NEI creates a checkpoint in the
transmitting a single packet as ’ Joules, which depends upon time-space, when a novel event is encountered, stores it in the
the length of the packet h’, is shown in Equations 11 and12. log memory of the UFN, and transmits the event to the NFN.
Section C: Computational Intelligence, Machine Learning and Data Analytics
The Computer Journal, Vol. 00 No. 0, 202110 Sahil and S. Sood
The NEI determines the duplication of the subsequent events 4: Create a checkpoint at ti
one by one, by determining the fully matched event, fully 5: Flush log memory of UFN
unique event and partially matched event, using a piecewise 6: uRec = PaHi
match function as shown in Eq. 15. 7: Save uRec in log
If the match function determines that the subsequent event, 8: If(isempty(binSeq[ti ])==0), then
i.e. PaHi+1 is fully matched, the NEI does not transmit the 9: PaHCompi =omitFeatures(PaHi , binSeq[ti ])
subsequent event and continues to determine the matching 10: PaHCompi = PaHCompi ∪ binSeq[ti ]
between the unique event and next subsequent events. The 11: Send PaHCompi to NFN
Downloaded from https://academic.oup.com/comjnl/advance-article/doi/10.1093/comjnl/bxaa201/6249696 by guest on 17 August 2021
UFN uses cache memory to store the most recent event. If 12: Else (Send PaHi to NFN)
NEI determines any subsequent event fully unique, it creates 13: mRec = PaHi+1
a new checkpoint to the time instances of the newly iden- 14: Save mRec in log
tified novel event, flushes the content of the log memory, 15: If(match(uRec,mRec)==uRec==mRec), then
saves the newly identified novel event in the log memory and 16: i++
transmits that event to the NFN. If the NEI determines that 17: Goto Step 13
the subsequent event partially matches with the unique event,
18: ElseIf(match(uRec,mRec)==∅), then
NEI constructs a binary sequence of the partially matched
19: i++
subsequent event using function constructBinSeq that employs
AND operation to determine the attribute values of the partially 20: Goto Step 4
matched event, which are different from the unique event, and 21: Else
saves the binary sequence in binSeq. Based on the binSeq value, 22: i++
the function omitFeatures omits the matching values of the 23: binSeq[ti ]=constructBinSeq(uRec,mRec)
partially matched event and makes the compressed form of the 24: Goto Step 4
partially matched event, i.e. PaHCompi . The NEI appends the 25: Exit
corresponding binSeq with the compressed record (PaHCompi ) Output: Novel Data Transmission
and sends it to the NFN. In this manner, the NEI also avoids
the subsequent duplicate attribute values of the PanHealth data.
The entire working of NEI is shown in Algorithm 2. Here, in 2.2.1.3.2. Dimensionality Reduction
Algorithm 2, uReC and mRec signify the unique PanHealth The NFN acts as the ultimate sink for data from various
record and subsequent matching PanHealth record (which is sources viz. UFNs and environmental sensors. The data arrived
matching with the unique record), respectively. at the NFN includes the temporal PanHealth and DisEnvi
match(PaH i , PaH i+1 )
events of the various stranded persons and various locations,
⎧ ⎫
respectively, which make the acquired data at the NFN a
⎪
⎪ ∅ (PaH i ∩ PaH i+1 ) = PaH i = PaH i+1⎪
⎪ high dimensional data. The high dimensional data present
⎪
⎨PaH ⎪
⎬
i+1 (PaH i ∩ PaH i+1 ) = ∅ various challenges like intense computation requirements, and
=
⎪
⎪ PaH − (PaH ∩ PaH ) ⎪
⎪ increased error rate during analysis [55]. The transmission
⎪
⎩
i i i+1 ⎪
⎭
+binSeq (PaH i ∩ PaH i+1 ) ⊂ PaH i of such high-dimensional big data requires significant energy
(15) consumption at the NFN. The ECL employs Dimensionality
Reduction (DR) module at the NFN, which addresses the issue
The function in Eq. 15 matches the subsequent PanHealth of energy conservation at the NFN, by employing energy-
event PaHi+1 with the saved unique event PaHi , and only trans- aware computation using data summarization. However, the
mits the outcome of the function based on three different crite- NEI-processed data from the UFN have omitted consecutive
ria for fully matched, fully unique and partially matched event, duplicate events and values, and the DR module requires the
respectively. The outcome of the match function determines the entire data for identifying the data patterns, and trends for data
value of m’ (refer Eq. 5), such that m’ ≤ m. In this manner, summarization. That is why the DR has a filler component
the transmission energy consumption of the UFN (ET _UFN ) (FL), which analyzes the collected data against the time-series
minimizes and resultantly, the overall energy consumption of to fill the missing values in the received data. It replicates the
the UFN (EUFN ) optimizes, by reducing the data transmission preceding value of the attributes in the missing value position,
from UFN to NFN. in the time series.
The DR module uses Principal Component Analysis (PCA)
Algorithm 2 Novel Event Identification [56], which transforms the high-dimensional data, say Qn×d
having n records and d dimensions into low dimensional sub-
Input: Temporal PanHealth events
space, say Q’n×d having n records and d’ dimensions such
1: Set Time counter i as 0 that d’ < d. PCA transforms the data in such a way that
2: Set binSeq[ ] as ∅ the data can be represented maximally using few dimensions.
3: For every temporal PanHealth event PaHi , The PCA identifies those dimensions or principal components
Section C: Computational Intelligence, Machine Learning and Data Analytics
The Computer Journal, Vol. 00 No. 0, 2021Fog-assisted Energy Efficient CPS for Evacuation 11
(PC), which can retain maximum information of the common
structure that exists in a dataset by using the concept of co- Algorithm 3 Dimensionality Reduction
variance and Eigen’s (values and corresponding vectors), as
Input: High dimensional dataset Qn×d
shown in Equations 16 and 17. The transformation of data using
Eigen vectors identify the PCs. The identified PCs or Eigen 1: Column standardization of dataset Q
vectors depict the direction in which maximum variance of the 2: Determine the co-variance matrix S of column standard-
data is retained, using Eigen values, as shown in Eq. 18. The ized dataset Q
identified PCs provide the loading factors of each dimension to 3: Determine the Eigen values and corresponding Eigen
Downloaded from https://academic.oup.com/comjnl/advance-article/doi/10.1093/comjnl/bxaa201/6249696 by guest on 17 August 2021
project the data values on those PCs, as shown in Eq. 19. The vectors of S using,
PCs depict the maximum variance or spread of the data and are 4: λi .vi = S.vi , where where, i i:1−→d
mutually uncorrelated. 5: Choose PCs account for maximum variance using cumu-
lative variance
S = QT Q (16) 6: Compute xij ’ of the PCj using loading factors as,
7: xij = xTi ∗ PCj
where, S is the co-variance matrix, and QT is the transpose of 8: Exit
the column standardized dataset Qn×d .
Output: Reduced Dimensional dataset Q’n×d
The column standardization of the dataset Q helps in moving
the data points to the origin along with retaining the original The employed NEI reduces the packet length (m’), such
spread of data, and the co-variance matrix analyzes the co- that m’ ≤ m, of the transmitting packet from the UFN; as
dependence between the dimensions. a result, the energy consumption for collecting packets from
UFNs reduces at NFN and subsequently optimizes ER _NFN . On
λi .vi = S.vi (17) the other side, employed dimensionality reduction at the NFN
reduces dimensions of data from d to d’, and results in reducing
where, λi i:1−→d are Eigen values for of the d-dimensions of the energy consumption for transmitting a single packet (’),
the co-variance matrix, and vi i:1−→d are the corresponding as the length of packet reduces, and subsequently optimizes
Eigen vectors, such that λ1 ≥ λ2 ≥ λ3 ≥ . . . λd . The values ET _NFN . In this manner, the overall energy consumption of
of λi and vi are determined by satisfying Eq. 17. λi s show the NFN reduces with the deployment of NEI at UFNs and
the variance of the data retained by the corresponding Eigen dimensionality reduction at the NFN.
vectors vi s. The PCA analyzes the variance or spread of data
on a direction vi using corresponding Eigen values as show in 2.2.2.Cloud Space
Eq. 18. The acquired data from physical space are processed at fog
space, and finally stored at the cloud storage in the form of
λi time-series data. The time series data consist of successive
variance(λi ) = d
(18)
i=1 (λi )
observations made over the time interval [57] [58]. The cloud
space employs two layers, namely PSA Layer and DML. Each
PCA chooses the PCs which cover maximal variation using layer has been explained as follows.
cumulative variance. Based on the identified PCs, the reduced
dataset having chosen PCs as features of the new transformed 2.2.2.1.Panic Severity Analysis Layer
data Q’n×d is transmitted to the remote servers in the cloud Panic Severity Analysis (PSA) layer analyzes the time-series
space. The PCA computes PCi ∈ IRd , which represents the PanHealth-DisEnvi data of the panicked persons, for monitor-
matrix of loading values corresponding to d-dimensions of Q. ing and predicting their panic severity in the form of Panic
Using the loading values, and actual values of the attributes Severity Index (PSI). The PSI provides a probabilistic measure
of the record (xi ), the transformed value (xi ’) is determined for analyzing the effects of the occurrence of the PanHealth-
as shown in Eq. 19. Eq. 19 can be expanded, as shown and DisEnvi-related adverse events on the panic health of
in Eq. 20. Algorithm 3 depicts the entire working of PCA the stranded persons and helps in facilitating the on-time and
at NFN. orderly evacuation of stranded persons. A higher value of PSI
indicates the possibility of severe panic attacks. Hence, the PSI
xij = xTi ∗ PCj (19) is monitored and predicted for identifying the critical regions,
and evacuation priority of people in those regions. The PSI is
monitored in the form of conditional probability, as shown in
Eq. 21.
xij = xid1 ∗ PCjd1 + xid2 ∗ PCjd2 + xid3 ∗ PCjd3 + . . .
PW
PSI = P (21)
+ xidd ∗ PCjdd (20) e1 ∪ e2 ∪ e3 ∪ . . . ei
Section C: Computational Intelligence, Machine Learning and Data Analytics
The Computer Journal, Vol. 00 No. 0, 202112 Sahil and S. Sood
Here, PW denotes the panic health class of the stranded MA terms, P is the order of seasonal AR (SAR) terms, D is
person, and ei denotes the occurrence of an adverse event in the order of differencing or power of (1-LV ), A is the order
a particular time instance. The PSI helps the cloud servers in of seasonal MA (SMA) terms and V is the seasonality period.
monitoring the panic health severity of the stranded panicked The terms P (LV ) and P (LV ) converge the entire seasonal
persons. Based on the current and past monitored PSI, the prediction function as shown in Equations 25 and 26.
PSA layer further employs SARIMA prediction model for
predicting the PSI. SARIMA is the extension to the prediction V
)=1− V
− 2V
− 3V
− ··· − PV
P (L 1L 2L 3L PL
model ARIMA, and considers the seasonal characteristics of
Downloaded from https://academic.oup.com/comjnl/advance-article/doi/10.1093/comjnl/bxaa201/6249696 by guest on 17 August 2021
(25)
the data using hyper-parameters for accounting the seasonality
of the data series. The hyper-parameters in the SARIMA are
similar to the parameters of the ARIMA; however, the hyper-
parameters involve seasonal lag (i.e. minutes, hourly, daily, A (LV ) = 1 − 1 LV − 2 L2V − 3 L3V − · · · − A LAV
weekly, monthly, yearly), which is specified by the seasonality (26)
period variable. ARIMA employs auto regression (AR) and
moving average (MA) to predict the value in a time-series
based on the linear combination of present and past values, The PSI prediction using SARIMA involves four phases
and prediction errors, respectively. ARIMA(p, d, a) is used to [59]: (I) Model Identification, (II) Parameter Identification,
predict a value in time-series, as shown in Eq. 22. (III) Diagnostic Checking and (IV) Prediction. In model identi-
fication phase, the time plot of the data is inspected for station-
ary data and determines the value of d, so the variance of data
Y t = φ 1 Y t−1 + φ 2 Y t−2 + · · · + φ p Y t−p + Z t + θ 1 Z t−1 + can be stabilized. After the identification of d, the preliminary
θ 2 Z t−2 + · · · + θ a Z t−a (22) values, i.e. p, a, P, D and A are identified in this phase using
Partial Autocorrelation Function (PACF) and Autocorrelation
where Yt denotes the stationary data value at tth instance, for Function (ACF).
the non-stationary data value St , using the differencing process The PACF determines the required order of AR terms i.e.
of order d, such that Yt = St - St−d . St denotes the predicted PSI p, whereas the ACF depicts the amount of linear dependence
of a person. p and a denote the number of AR terms and MA between data values of time series, which are separated by a
terms, respectively. φ and θ are the AR and MA coefficients, lag of a. In parameter identification phase, the parameter and
respectively. Yt denotes the predicted value, and Y t−1 . . . Y t−p corresponding standard errors are estimated using statistical
denotes the previous p predicted data values. Zt denotes random measures: lease square estimation (LSE), maximum likeli-
error for predicted data value and Z t−1 . . . Z t−a denote the hood (ML) and Yule–Walker. In diagnostic checking, different
previous a prediction errors. The Eq. 22 can be represented models are evaluated, and their residuals are analyzed. The
using lag operator (L) as shown in Eq. 23. model, which has the least residual or values of Mean absolute
Error (MAE), Mean square error (MSE) and Root mean square
φ p (L)Y t = θ a (L)Z t (23) error (RMSE), fits well and is selected. In prediction phase,
the model predicts the PSI based on the fitted model. The
where PSI prediction using SARIMA is illustrated in Algorithm 4.
φ p (L)Y t = (1 − φ 1 L − φ 2 L2 − φ 3 L3 . . . φ p Lp )Y t The monitored and predicted PSI of the stranded persons are
Lp .Y t = Y t−p transmitted to the DML, which analyzes the PSI time-series
θ a (L)Z t = (1 − θ 1 L − θ 2 L2 − θ 3 L3 . . . θ a La )Z t to ascertain the highest panic severity of the person for a
La .Z t = Z t−p particular future time-frame (ranges from current instance to
The SARIMA predicts the PSI based on the past values of a particular future instance), so panicked critical regions and
the PSI and past predicted errors. Since the PSI is based on evacuation priority of the stranded persons in those regions
the number of symptoms appeared, and the duration of the could be identified.
panic attacks, it is significant to consider the periodicity or
seasonality of the time series in ARIMA prediction. Hence, the Algorithm 4 Panic Severity Index Prediction
PSA layer employs SARIMA(p,d,a)(P,D,A)[V] to predict the
Input: Monitored PSI Time-series data
PSI of a stranded panicked person, as shown in Eq. 24
1: Determine the differencing values for stabilizing the
φ p (L) P (L
V
)(1 − L)d (1 − LV )D St = θ a (L)A (LV )Z t (24) data.
2: Examine PACF, and ACF Plots to decide the structure of
where and are seasonal AR and seasonal MA coefficients, SARIMA
respectively. p is the order of nonseasonal AR terms, d is the 3: Determine the AR and MA coefficient for both non-
order of nonseasonal differencing, a is the order of nonseasonal seasonal and seasonal
Section C: Computational Intelligence, Machine Learning and Data Analytics
The Computer Journal, Vol. 00 No. 0, 2021You can also read