The six business models for copyright infringement - A data-driven study of websites considered to be infringing copyright
←
→
Page content transcription
If your browser does not render page correctly, please read the page content below
The six business models for
copyright infringement
A data-driven study of websites considered to be infringing copyright

A Google & PRS for Music commissioned report
with research conducted by BAE Systems Detica.
27th June 2012
Acknowledging contributions of data from:

with the assistance of:

2 The six business models for copyright infringement – A data driven study of websites considered to be infringing copyright
Executive summary
The Six Business Models for Copyright Infringement is a                       must sign up to be included. For all the sites we segmented, 86%
segmentation driven investigation of sites that are thought by major          of advertisements did not display the Ad Choices logo suggesting
rights holders to be significantly facilitating copyright infringement. In    that the advertisers do not associate themselves with the online
this study, we investigate the operation of a sample of these sites to        advertising self-regulation scheme.
determine their characteristics. Among other things, we investigate
                                                                              Each segment has different proportions of advertising or payments.
how they function, how they are funded, where they are hosted, what
                                                                              For example, two-thirds (67%) of the ‘Live TV Gateway’ segment, the
kinds of content they offer, and how large their user bases are.
                                                                              fastest-growing segment, which consists of sites that provide live-
The aim of this study is to provide quantitative data to inform debate        streams of free-to-air and pay TV content as well as other content,
around infringement and enforcement. Although a large amount                  are funded by advertisers. These sites also solicit donations as a part
of quantitative and qualitative data has been collected in the past           of their business model.
through consumer surveys into why people use these sites, there is
                                                                               ‘P2P Communities’, the second fastest growing segment, are even
insufficient data-driven analysis of the sites that are considered to
                                                                              more dependent on advertising income (86%) than the Live TV
facilitate copyright infringement.
                                                                              Gateway segment and more likely than all five other segments to
                                                                              solicit donations from their community members.
How the data was collected
                                                                              Payment and card processors
For this study, BAE Systems Detica collected from rights holders
lists of sites that they believed to be significantly infringing copyright.   The study also examined in an objective way the presence and
These lists provided more than one thousand sites. A systematic               influence of payment processors and card processors. In at least
sample of 153 sites, together with publicly available information, was        three of the segments, the existence of the logos for credit card
used to build a segmentation model. The resulting segments were               and/or electronic payment processor logos were significant. Whilst
analysed, and their characteristics were confirmed in a subsequent            the presence of these logos does not give us certainty that card
analysis of 104 additional sites. In contrast to previous research            processors or payment processors actually facilitate payment, it does
this analysis of the market for copyright infringement is based on a          suggest the strong likelihood that these payment facilities are used
statistically significant representation of these sites.                      for payment collection.
This research provides industry and policymakers with information             Two of these segments include sites which collect subscriptions
about the business of copyright infringement. The segmentation of             via their payment pages: we called these ‘Subscription Community’
the results revealed six major business models, which are shown in            and ‘Rewarded Freemium’. A third segment, which we called ‘Music
Figure 1-1:                                                                   Transaction’, contained sites that appeared to collect payment for the
                                                                              content that they sell.
                                                                              Overall, 36% of the segmented sites had payment pages; credit card
                                                                              company logos were present on 69% of them. However, that is not
                                                                              to say that the remaining 64% were not taking payment, only that a
                                                                              payment page was not visible to us, for example if a site was closed
                                                                              and we could not obtain membership.
                                                                              The visibility of card and payment processor logos suggests a critical
                                                                              relationship between those sites and the subscription and transaction
                                                                              services that they may rely on. More specifically, those engaged
                                                                              in these transaction services appear to be clustered in particular
Figure 1-1: Six major copyright infringement business
                                                                              countries.
models identified in this study
                                                                              Content and format

Each of the segments identified in this study are characterised by the        In addition to insight on financing, this study also provides data on
type and operation of the sites found within them. Below we describe          which kinds of sites favour certain kinds of content.
the differences between the segments in terms of the way they are             A broad range of content including music, films, software, games and
financed, the content and formats provided, how users arrived at              ebooks appears on many sites. However, it is the Live TV Gateway
sites and where the segments are predominantly located. See Figure            segment, containing a significant number of sites offering live free-
1-2 for more details.                                                         to-air and pay TV in addition to other content, which is growing the
                                                                              fastest.
Key Segment Characteristics                                                   The largest individual site is one in the P2P Community segment.
                                                                              Sites in this segment generally make all forms of content, except live
Financing                                                                     TV, available to download. Downloads allow the user to obtain a full
This study provides data-driven insight into how copyright                    copy of the file which they can then view offline or copy for each of
infringement operates as a business across a range of business                their various gadgets. Unlike streaming, downloads can be obtained
models. It shows that websites are most commonly funded in part               independent of the speed of the user’s internet access, enabling the
or in combination by either advertising or payments (including                highest quality of experience.
subscriptions, donations, and transactions).                                  Many sites also offer streamed content for the user to consume.
For each segment, this study helps to identify which are the                  This is obviously required for live TV but can support other types of
significant economic drivers. This data is likely to prove useful             content such as music or video.
and insightful to industry and policymakers who seek to tackle                We investigated where and how the content was hosted and found
infringement by ‘following the money’.                                        that both Live TV Gateway and P2P Community sites, the two largest
                                                                              and fastest growing segments, tended to link to content on other
Advertising                                                                   sites or services rather than host the content.
Advertising plays a key role in at least three of the segments. To            These two segments use quite different architectures to achieve this:
understand where these adverts were coming from, we examined                  Live TV Gateway sites deliver the content from one central server to
the advertisements found on each site by checking for the presence            which they link, whereas P2P Community sites offer links to the files
of the “Ad Choices” logo. The “Ad Choices” scheme is administered             which are served from a distributed array of servers or other users
by the Internet Advertising Bureau (IAB) in the UK, and ad agencies           within the community.

                                                                                                                                                      3
Arriving on the sites This study also examined referral data on how users arrive at sites considered to be infringing. It shows that different kinds of sites are reached in quite different ways. Users of sites in the Live TV Gateway, P2P Community and Music Transaction segments were all more likely to have arrived directly without first visiting any other internet sites than was the case with the other three segments. Users were more likely to have visited a search engine prior to arriving on a Music Transaction site than was the case with the other five segments. Live TV Gateway users were most likely to have visited a social network prior to their visit to the site we examined. These sites were also the most likely to have a social networking presence, in the form of a social networking ‘action’ icon, for example Facebook ‘like’ buttons, Twitter ‘tweet’ button or similar. Prior to their visit, users of Embedded Streaming and Rewarded Freemium sites were more likely to have visited other sites that don’t fall into the social or search categories than was the case with the other 4 segments. Location We examined the geographical location of the sites IP addresses and found two notable facts: sites in the ‘Music Transaction’ segment were far more likely to be hosted in Russia than any other segment, and a disproportionate number of sites in the ‘Rewarded Freemium’ and the ‘Embedded Streaming’ segments were hosted in the Netherlands. The UK is a significant home to only a relatively small proportion of one segment: P2P Community, but these types of site appear to have high numbers of users and are growing. This report provides a snapshot of the market taken in April/May 2012 and is intended to inform debate about how to address online copyright infringement. More can be done in terms of data: while we have analysed the growth and decline in user numbers, as a snapshot, the report is unable to evaluate other changes in the market. This report provides a baseline from which to monitor the market. Detica believes that with the addition of time-series data, a full picture of the market and the segments respective trajectories can be realised. 4 The six business models for copyright infringement – A data driven study of websites considered to be infringing copyright
-The sites predominantly offer links to streams of live
                                                                                         free-to-air and pay TV. These sites offer above average
                                                                                         levels of games and eBooks, as well as other content in
                                                                                         lower proportions.
                                                                                         - The sites typically provide links to downloads or
                                                                                         streams. The content is centrally hosted (as opposed to
                                                                                         using P2P) in a different location from the site.
                                                                                         - Predominately advertisement funded with some
                                                                                         donations. Typically free to the user.
                                                                                         - Rapid growth in last year.
                                                                                         - Most likely to have a mobile site and a social
                                                                                         networking presence.
                                                                                         - Users often arrive after typing the address into the
                                                                                         browser.

                                                                                                                    Chart labels are the
                                                                                                                    number of websites
                                                                                                                    in each segment

       - User is able to buy music to download from the site’s
       own servers. Also offer some games and eBooks.
       - Likely to have social networking presence and
       discovery via search is relatively high. Returning users
       often type the address directly into the browser.
       - Content hosted on sites on servers. Relatively large
       proportion hosted in Russia.
       - All have card processor logos on payment page.                                  - Well organised range of content types with the
       - Small, declining user base.                                                     exception of live free-to-air and pay TV, offered free to
                                                                                         the user.
                                                                                         - Engages user with Forums and ability to comment
                                                                                         on content.
                                                                                         - Facilitates downloading of content via P2P or
                                                                                         distributed servers.
                                                                                         - Heaviest dependency on advertisement and
                                                                                         donation funding
                                                                                         - The advertising is largely provided by organisations
                                                                                         not affiliated with the Ad Choices scheme.
                                                                                         - Sustained growth over five years.
                                                                                         - Direct access levels very high
                                                                                         - Europe appears to be the main home of these sites

Figure 1-2: The six business models for copyright infringement
The numbers of websites identified in each segment in the donut chart presented in
Figure 1-2 above describe only volumes of websites that fell in each segment after
a systematic sample of websites had been taken for the segmentation. This can be
used as a proxy for the presence of total numbers of different websites available to
the user. However, no inference can be drawn on the size of the market for each
segment in terms of users, importance, market value or loss to rights holders. A small
segment, above, might have a lot of business but be limited to a few websites, where
a much larger segment in terms of the numbers of websites may undertake less
business.

                                                                                                                                                     5
6 The six business models for copyright infringement – A data driven study of websites considered to be infringing copyright
Contents

Context and terms of reference                                                   8

Results                                                                          9
 The Six Segments                                                               10

Analysis                                                                        17
 Content                                                                        17
 Navigation to the Site                                                         18
 Network Arrangement                                                            19
 Sources of Revenue                                                             20
 Community and Social Features                                                  21
 Cost to User, User Base and Growth                                             22

Methodology                                                                     23
 Copyright infringement market model                                            24
 Populating the metrics against a prioritised list of websites                  26
 Identifying six segments in the data                                           27

Next steps                                                                      30
 Repeating the study to understand changes to the market conditions over time   30
 Repeating the study to analyse the cause and effect of events                  30
 Industrialising the study for a wider dataset                                  30

Appendices                                                                      31

                                                                                 7
1 Context and terms of reference BAE Systems Detica (Detica) was commissioned by PRS for Music and Google UK (Google) to investigate the characteristics of websites that are alleged to infringe copyright. There have been many studies and surveys of online copyright infringement but this report is the first to provide a purely data-driven description and analysis of the online copyright infringement industry. Detica was provided with a list of websites by The Federation against Copyright Theft (FACT), The British Phonographic Industry (BPI), The Football Association Premier League (FAPL), UK Interactive Entertainment (UKIE), PRS for Music and the Publishers Association. The rights holders believed the sites contained in these lists to be significantly facilitating copyright infringement. The lists formed the basis for the subsequent data-driven analysis. The lists themselves were provided confidentially and are not detailed in this report. Detica does not confirm or deny the claims made by the rights holders as to whether these sites can be said to facilitate copyright infringement. The aim of the study was to measure and analyse these websites in a way that was objective, evidence-based and determined by the data. The goal was to create a map of the alleged copyright infringing market, based on evidence, that could provide industry and policymakers with insight into how these sites operate. 8 The six business models for copyright infringement – A data driven study of websites considered to be infringing copyright
2 Results
Detica’s data-driven segmentation identified six clear segments             Six segments were identified using a statistical method, effectively
within the ‘copyright infringement industry’. Each of these segments        grouping sites with similar characteristics. Examining these
contain sites with business models similar to other sites within their      characteristics enabled Detica to provide a clear profile of each
segment but significantly different from sites in other segments.           segment.
In the same way that collecting data about furniture retailers might        The following section of this report sets out the profiles for each of
show that there are a range of quite different business models in that      the six segments, in the following manner:
industry (Swedish flat-pack giants, sofa superstores, antique shops,        1. Segment name – based on discussion between Detica, PRS for
hi-design boutiques, etc), Detica’s data-driven analysis of the sites           Music and Google.
identified by rights holders shows that they cluster into six segments;
in effect six types of business model for copyright infringement. In        2.	Description of operating drivers and characteristics – based on the
this chapter we describe those segments and the metrics collected in           underlying metrics.
the analysis.                                                               3. Key metrics for the segment:
Detica used over 100 different metrics in this study. These metrics           • Standard – Size of the cluster, range of unique UK visitors per
gathered information on the size and growth of each site, the type               month and a growth indicator. The growth indicator is based on
of content offered, how users navigated to them, their network                   the global change in activity on the websites in terms of page
arrangements, their sources of revenue, their community and their                views. It cannot be compared directly with unique UK visitors but
social features. A full list of metrics can be found in Appendices G             it does provide a relative view of change.
and H.
                                                                              • Numeric – Selected significant metrics displayed in a chart
The majority of the metrics were collected on a yes/no basis                     showing the segment average compared to the population
e.g. Does a site offer music content? Does a site have a social                  average. It should be noted that some metrics are relative values,
networking presence? etc. In addition, a number of non-numeric                   and that all the metrics displayed have been normalised for
metrics were also used to aid the description of our segments. These             comparison between different segments.
categorical metrics include:
                                                                              • Categorical – The two most significant non-numeric metrics.
• IP Address Location – The country location of ‘A record’ (IP
   address).
• Top Level Domain Location – The country location of the Top Level
   Domain.
• Ad Provider Type – Is advertising present? If so, is it provided by Ad
   Choices?
• Card Processor Logo – Does a payment page exist? If so, are the
   logos of Visa, MasterCard or American Express present?
• Electronic Payment Provider Logo – Does a payment page exist? If
   so, is the PayPal logo present?

                                                                                                                                                     9
2.1 The six segments
Detica analysed the six segments and identified the following
operating drivers for each segment (see Appendices A and B for
comparisons of all metrics):
Segment 1: Live TV Gateway
This segment contains 33% of the sites examined and is the fastest growing segment,
with an average increase in global page views of around 61% (in the twelve month
period studied). The segment is mid-high in terms of volume when compared to the other
segments with up to 1.1M unique UK users per month on one site alone.
• The sites offer links to streams of live free-to-air and pay TV.
• These sites offer above average levels of games and eBooks, as well as other content in
lower proportions, but their stand out feature is live TV.
• The sites typically provide links to downloads or streams. The content is centrally hosted
(as opposed to using P2P) in a different location from the site.
• Predominately advertisement funded with some donations. 67% have adverts with 86%
of those ads served by networks not affiliated with the Ad Choices scheme.
• Typically free to the user.
• Rapid growth in last year.
• Most likely to have a mobile site and a social networking presence.
• Compared to the other segments Live TV Gateway has very high levels of direct
access and referrals from social networks. It also has the highest level of social network
presence. Search referral, albeit to a lesser degree, is also above average in this
segment.
• More of these sites are in the US than any other single country.
Figure 2-1 : Graphical representation of
Segment 1 – Live TV Gateway
Note: See ISO
3166-1 decoding
table for code to
country mapping
10 The six business models for copyright infringement – A data driven study of websites considered to be infringing copyrightSegment 2: P2P Community
The second fastest growing segment, with an average increase in global page views of
around 17% per year. The segment contains 19% of the sites, and at least one site in the
segment could be considered high volume, containing around 2.1M unique UK users per
month.
• Well-organised range of content types offered free to the user. Content available does
not include live free-to-air and pay TV.
• Engages user with forums and ability to comment on content but they have relatively low
levels of user login or user ratings.
• Facilitates downloading of content via P2P or distributed servers.
• Heavy dependency on advertisement and donation funding. 86% have adverts and 84%
of adverts are served by Ad networks not affiliated to the Ad Choices scheme.
• Sustained growth over past five years.
• Direct access levels very high compared to other access methods.
• Europe appears to be the main home of these sites, including the United Kingdom.
Figure 2-2 : Graphical representation of
Segment 2 – P2P Community
11Segment 3: Subscription Community
This segment contains the fewest sites, with only 5% of the sites sampled. The usage
volumes and level of growth present for sites across this segment were unclear due to a
lack of available data.
• User pays a subscription fee for a well-organised range of content types. This content
does not include live free-to-air and pay TV.
• These sites offer a tiered community model, in which users can earn different levels of
access and content quality through payment or uploading of content to the site.
• Users are much more engaged than in other segments – with relatively high levels of
user login, user rating systems and ability to comment on content.
• These sites have the highest levels of donation and the second highest of level of
monthly subscription of any segment.
• Only 12% of sites carry adverts.
• Facilitates downloading of content via P2P or distributed servers.
• These sites do not have any dominant forms of referral but they do have a high number
of other sites linking in to them (Alexa ranking).
• Around two-thirds of the sites contained clearly visible payment pages, and debit/credit
card payment logos were clearly present on all of them. The sites that did not have
clearly visible payment pages and logos, may have payment mechanisms but they were
not visible.
Figure 2-3 : Graphical representation of
Segment 3 – Subscription Community
12 The six business models for copyright infringement – A data driven study of websites considered to be infringing copyrightSegment 4: Music Transaction
The fourth segment contains around 13% of the sites examined. On average these sites
are marginally declining, with an average decline in global page views of 19% per year.
Excluding Segment 3 due to the lack of available data, these sites contain the lowest
average UK user volume, only up to 33K per month.
• The standout feature of these sites is that they are transaction-based: users buy content.
• There are some games and ebooks available but music is by far the most significant
type of content on offer.
• Content hosted on site’s own servers. Relatively large proportion hosted in Russia.
• All have debit/credit card payment logos on any visible payment page.
• Higher than average likelihood of users arriving directly or after visiting search engines.
• Second highest levels of social networking presence and referral (after Live TV
Gateway).
• Small, declining user base.
Figure 2-4 : Graphical representation of
Segment 4 – Music Transaction
13Segment 5: Rewarded Freemium
This segment contains 18% of the sites. These sites have both free and paid options for
accessing content. The segment is on the decline, with an average drop in yearly global
page views of around 4%. These sites have a high volume of UK users, up to 1.5M per
month on one site, and a number of these sites provide financial rewards to contributors
(e.g. for users who have content supplied by them downloaded by others).
• The standout features of these sites are that they offer financial rewards to uploaders
and operate a freemium model.
• These sites offer Freemium services funded through advertising, meaning users can get
basic access for free, and a paid subscription options for enhanced services.
• Electronic payment provider logos were present on 61% of sites, with debit/credit card
payment options present on 46% of sites.
• Users who provide content for others are rewarded financially for their contribution.
• This content is uploaded to the sites’ own servers where it is downloaded by others,
unlike P2P where content is transferred from user to user.
• These sites typically offer music content.
• The user more likely to arrive through links from other websites. Lower than average
levels of search referral, social networking and direct access.
• Large, but declining user base.
• The Netherlands and the United States appear to be the main locations of these sites,
accounting for a 31% and 29% share respectively.
Figure 2-5 : Graphical representation of
Segment 5 – Rewarded Freemium
14 The six business models for copyright infringement – A data driven study of websites considered to be infringing copyrightSegment 6: Embedded Streaming
The final segment, containing 12% of sites, is declining the fastest. Sites in this segment
are on average mid-volume with a range of 6.4K to 470K unique UK visitors per month.
On average, sites in this segment are declining, in terms of global page views, by 33%
per year.
• Provides hosting where users can upload content, and where others can stream the
content from.
• Allows users to embed content on their own sites, on 3rd party sites and on forums.
• Contributors that upload content can receive a financial reward.
• Advertisement funded, with some sites providing the option to donate. 89% of sites carry
ads, with all adverts served by Ad networks not affiliated to the Ad Choices scheme.
• Comparatively high level of hosting in the Netherlands.
Figure 2-6 : Graphical representation of
Segment 6 – Embedded Streaming
15The following sections of this report detail the analysis of the metrics,
the methodology used to sample and segment the data, and the
potential next steps for this research. Detailed appendices are also
presented for reference.
16 The six business models for copyright infringement – A data driven study of websites considered to be infringing copyright3 Analysis
In this section, we present our findings for each of the categories we Figure 3-1 also shows how you will find Live TV content on sites
studied. In all cases, the metric for a given segment is compared to found in the Live TV Gateway segment, with all other segments
the average for all sites and normalised so that the segment with the scoring zero. It also shows how you are more likely to find games
highest likelihood of the characteristic scores 1. and ebooks on sites in the Live TV Gateway segment than anywhere
else, with Live TV Gateway scoring 1 for each of these categories.
Because each category is normalised by a different ratio, it is not
It shows how recorded TV is also quite likely to be found on sites in
possible to compare the normalised values of two metrics: only
this segment, with a score of 0.82, although not as often as on P2P
comparisons between one segment and another within a metric are
Community sites, which scores 1 for this category.
valid. For example the scale of the music coverage metric is very
different to the scale of the software coverage metric, thus cross Figure 3-1 shows how you are very likely to find most types of
comparisons cannot be drawn. content except Live TV on P2P Community sites and to a slightly
lesser depth on Subscription Community sites.
3.1 Content Music Transaction sites seem to focus on music while also having
We looked for a range of popular content on each site to understand some ebooks and games available to their customers. Rewarded
what they offered and the amount of choice the user had available Freemium sites appear to concentrate only on music.
for that content type. In Figure 3-1 we have plotted the type and
coverage of content available from each segment.
Figure 3-1: Chart showing scaled normalised averages of
content coverage metrics for each segment
173.2 Navigation to the Site
We investigated the user’s journey to each site using Kantar Media Social Networking was also more likely to have been accessed prior
Compete data. While this does not show us the page that the user to users arriving at Live TV Gateways and search more likely for
linked from directly, it does allow us to see categories of sites that the Music Transaction sites.
user had visited in the 30 minutes prior to arriving at one of the sites
Embedded Streaming, Rewarded Freemium access was more likely
we were looking at.
from users who had been browsing other pages than was the case
We found that users of Live TV Gateway, Music Transaction and P2P with Music Transaction and Live TV Gateway sites. This suggests
Community sites were more likely to arrive directly, after 30 minutes that these users were led to the sites we examined by links from the
or more of no online activity at all (Direct Access), than they were to sites that they visited.
sites in other segments.
Figure 3-2: Chart showing scaled normalised averages of site navigation method
metrics for each segment
18 The six business models for copyright infringement – A data driven study of websites considered to be infringing copyright3.3 Network Arrangement
We investigated the network arrangements of the sites we looked at. We found that although Live TV Gateways favoured one Central
We categorised sites depending on whether they used P2P or other Server, this was not a server that they appeared to own. Their users
distributed server configurations that break up the raw file and deliver follow links to content that is stored on a central server elsewhere.
pieces of from different sources. The alternative arrangement to that
Music Transaction, Rewarded Freemium and Embedded Streaming
is provided by a central server where the whole file resides ready to
hosted content on their own central servers.
be accessed.
P2P and Subscription Communities rely on links, and client software,
We found that P2P and Subscription Community sites tended to use
to find the various pieces of the file that the user is downloading,
the distributed arrangement while the other four segments favoured
from these distributed locations.
centralised content hosting.
The figure also shows whether the content is available to download
We examined who owned the domain names where the content was
or stream or both.
found and whether the content was hosted by the site itself or stored
on a linked site somewhere else.
Figure 3-3: Chart showing weighting of site network
arrangement metrics for each segment
193.4 Sources of Revenue We looked for evidence to indicate how the sites are funded. Community sites (Subscription and P2P) were the most likely to We looked for payment gateways that supported transactions, solicit donations. subscriptions or donations and whether advertising was present. Advertising is an important source of funding for many sites Figure 3-4 shows the relative likelihood of each source being used as described elsewhere, with Embedded Streaming and P2P by each segment. For example, Music Transaction sites were Communities depending even more on ads than other segments. characterised by their use of transaction based pricing which was not present on other sites. Figure 3-4: Chart showing scaled normalised averages of site source of revenue metrics for each segment 20 The six business models for copyright infringement – A data driven study of websites considered to be infringing copyright
3.5 Community and Social Features
We looked for various features to understand the level of
engagement with users. Subscription Communities were
characterised by their use of a tiered structure whereby the more a
member contributes, the better their level of access.
We looked for evidence of forums and the ability for a user to
comment and interact with other users which helped us to further
indentify sites with a strong emphasis on creating a community. We
studied whether sites paid contributors for content too, either in cash
or in kind.
We found that the Live TV Gateway sites in particular were exploiting
social networks and mobile to reach out to their users.

                    35 - Tiered       86 -         72 -            54 - Content   55 - Forum   52 - Social   31 - Mobile
                    community      Subscription Subscription        comment                      network         site
                                                   cost                                         presence

Figure 3-5: Chart showing scaled normalised averages of community and social
feature metrics for each segment

                                                                                                                           21
3.6 Cost to User, User Base and Growth
We looked at the service types and whether the user had to pay for
access and plotted that against the relative size of the user base and
the growth pattern of each segment.
We found strong indications that free sites are collecting the largest
user bases and growing the quickest. Subscription services appear
to be quite small while freemium services where users can access
some services for free, or pay for enhanced features appear to be
experiencing the sharpest decline.
36 - Financial
reward
Figure 3-6: Chart showing scaled normalised averages of metrics associated with cost
to user, user base and growth for each segment
22 The six business models for copyright infringement – A data driven study of websites considered to be infringing copyright4 Methodology
This chapter provides an overview of the methodology that was used
to derive the segments, and will provide detail of the process shown
in Figure 4-1:
4.1 Section 4.2 – Detica
populated the metrics
against a prioritised
sample of websites
Prioritisation &
Selection
4.3
Figure 4-1: The process used to segment the market into business models
234.1 Copyright infringement market model 4.1.1 Relevant case law and pilot websites
We required a way to identify relevant data to collect that could To populate the model we reviewed UK legislation with specific
be used to effectively segment websites that are seen to infringe interest to this study to understand how the constituent players in
copyright. the market operated and used four pilot sites to understand the
motivations of these players.
We used domain expertise and market research to create a market
model allowing us to describe the websites considered to be We reviewed the Digital Economy Act 2010 and the Copyright,
infringing copyright. This market model looks at the actors in the Designs and Patents Act 1988, as well as the Agreement on Trade-
market, the actors’ personas, and the actors’ motivations. Related Aspects of Intellectual Property Rights (TRIPs) administered
by the World Trade Organisation. Within this legislative framework
Using the motivations we identified a set of attributes that allowed us
the Newzbin judgement1, Newzbin 2 judgement2 and The Pirate Bay
to measure these motivations, finally resulting in a set of metrics we
judgement3 are of particular relevancy.
wanted to calculate for each website. These metrics were calculated
and used in segmentation described in Section 4.3. This process is The four pilot sites selected are described in Table 4-1. PRS for
depicted below in Figure 4-2. Music and Google chose the pilot sites to be representative of a
range of technological implementations and content types.
Pilot site type Technology Primary Content
Torrent index Index, Torrent P2P Music, Film, TV,
Software, Games,
Books, other
Usenet reporting Index, Usenet Music, Film, TV,
Software, Games,
Books, other
Sports streaming Index, Streaming Live Sport
Invite forum Invitation None
Table 4-1: A description of each of the pilot sites used
to test the model
The following sub sections outline the components of the model as
shown in Figure 4-3 and are summarised as follows:
• The key actors in the market that are involved in and impacted by
the websites;
• The personas that actors played in the market (extremes of
character for each actor);
• The motivation that led them to be involved in the market; and
• The attributes that allow us to measure the motivations.
Figure 4-2: Creating the market model and defining the metrics to
enable the segmentation
Actors Personas Motivations Attributes
Have Have Have
The market model forms the foundation of the analysis we undertook. Figure 4-3: The market components that enabled us to build a robust model
We wanted the model to take into account the ecosystem in which
these websites were being used and operated, and therefore the
segmentation would be based on an unbiased and fully rounded set
of metrics. Actors Personas Motivations Attributes
Have Have Have
1 Twentieth Century Fox Film Corporation and others v Newzbin Limited [2010] EWHC 608 (Ch), [2010] All ER (D) 43 (Apr)
2 Twentieth Century Fox Film Corporation and others v British Telecommunications PLC [2011] EWHC 1981 (Ch)
3 Dramatico Entertainment Limited & others v British Sky Broadcasting Limited & others [2012] EWHC 268 (Ch)
24 The six business models for copyright infringement – A data driven study of websites considered to be infringing copyright4.1.2 Actors and personas
We used the pilot sites, listed above, to produce the list of actors
and their interactions. We identified five key actors: Consumers;
Contributors; Rights Holders; Site Owners, and Service providers.
The interactions are described in the model below, Figure 4-4.
Figure 4-4: The actors and their relationships who have
a role in the websites
Further researching the actors, the extreme roles of the actors were
identified as personas. The personas are defined in Table 4-2.
Actor Persona Description
Venture capitalist Interested in making money from operation of the website
Altruist Believes that facilitating the sharing of unlicensed content is a
Website Owner legitimate activity
Innovator Wants to bring new technologies and ideas to market without
core financial motivation
Accidental Doesn’t realise they are sharing content with others
Enthusiast Shares content to impress people and show that they can
Contributor Altruist Believes that facilitating the sharing of unlicensed content is a
legitimate activity
Profiteer Motivated by the incentives offered by being an uploader of
popular content
Unintended Didn’t realise the service was infringing
Casual Uses infringing services because everyone else does
Consumer
Regular Seeks out free services and think they know how to avoid the
associated risks
Amateur Individual artist seeking to release content in a controlled way
Corporate Rights holder representing a group of artists and other entities
Rights Holder
seeking to commercialise content
Independent A manager of ‘a’ band, but not signed to a label
Non-mainstream ad agency An agency which specialises in placing ads on a website which
is not a member of an industry body or regulator
Mainstream ad agency An agency which places ads on a website which is a member of
Service Provider
an industry body or regulators
Payment provider Companies who facilitate transfer of funds through transactions,
donations or subscriptions
Table 4-2: The Actors and their Personas
254.1.3 Motivations and attributes of the model 4.2 Populating the metrics against a prioritised list of
We used our pilot sites and case law to understand the motivations websites
for each of the personas. The motivations were both positive and In this section we describe the construction of a sample list of
negative and were derived from the following questions: websites to be segmented, and describe the process of collecting the
• Website Owner: Why would they set up the website? relevant data to populate the metrics for each site:
• Contributor: Why would they contribute to this service?
• Consumer: Why would they use this service?
• Rights Holder: Why would they want to stop their content being on
the website?
• Service Provider: Why would they provide service to this website?
A full list of motivations against each persona can be found in
Appendix D.
For each motivation we defined as set of attributes that we would like
to measure. The list of these attributes can be found in Appendix E.
4.1.4 Expert review and validation of the metrics selected
We reviewed this model with experts in the copyright infringement
market and their review comments and suggestions were
incorporated into the approach described in the following pages.
Specifically, we gained peer review input from:
• Andrew Clark, Expert Witness in Computer Assisted Crime, Primary
Key Associates
• Simon Morrison, Copyright Policy Manager, EMEA, Google
• Theo Bertram, Policy Manager, UK, Google Prioritisation &
• Frances Lowe, Head of Regulatory and Corporate Affairs, PRS for Selection
Music
• Will Page, Chief Economist, PRS for Music
• Jeremy Penston, Independent Consultant
We mapped these attributes to the available data to create a set of
metrics which could be measured for all websites.
We identified three categories of website data:
• Technical – data relating to the websites technical setup, for
example, the information contained within the WHOIS record.
• Usage – data pertaining to the usage of the website, for example,
visitor figures, demographics or referrals.
• Direct inspection – data captured through visually inspecting the
website and its source code, for example, whether adverts are
present, whether users have to log in to access content or whether
the site has a forum.
Examples of each type of metric are shown below in Table 4-3.
Figure 4-5: Creating the sample list of websites and collecting the data
ID Title Type Calculation / definition
19 A record Technical The country location of the IP
location address of the ‘A’ record for
the website.
4.2.1 Sample websites to be used as part of the analysis
42 Visitor Usage The number of Pageviews
To establish a list of websites for use in this research, we engaged
Change for the website in the month
rights holders representing the creative and content industries. We
(1yr) preceding this research minus
asked them to provide lists of websites which they considered to
the number of Pageviews 12
be infringing copyright. These lists were an input to the modelling
months earlier.
process outlined in this report.
96 Ad Provider Direct Positive (equal to 1) if the
The following representatives of the rights holders were engaged:
Type inspection first display advertisement
on a website has the Ad • The British Phonographic Industry (BPI)
Choices logo on or around it
• The Federation against Copyright Theft (FACT), which was also
and negative (equal to 0) if
representing the British Video Association (BVA) and the Motion
not. Note that this metric is
Picture Association of America (MPAA)
not applicable to sites without
advertising. • The Football Association Premier League (FAPL)
• The Publishers Association (PA)
Table 4-3: A samples of the metrics used in the model
• UK Interactive Entertainment (UKIE)
26 The six business models for copyright infringement – A data driven study of websites considered to be infringing copyrightWe would like to thank these representatives for their help and 4.2.3 Obtaining the data and calculated the metrics
support during this research.
We completed the data collection and metric calculation for the
We held interviews with each of the representatives and obtained in websites in five stages:
addition to their list:
1. User journey URL and search URL capture
• The methodology for construction of their lists; and
2. Automated data capture
• other research or data sources relevant to the research which they
3. Manual data capture
could make available to Detica.
4. Third party data capture
We took the websites obtained and consolidated them, retaining the
grouping provided by the representatives of the right holders. We 5. Metric calculations completed
used Alexa Global Traffic Rank4 to identify the most popular websites For full details of each metric, the data points contained within it and
in the categories, and then calculated the number of websites the details of each stage of the data capture process please consult
required from each category to create a de-duplicated sample list of Appendices G, H and I.
approximately 150 websites.
This sampling process was designed to ensure that the full range 4.3 Identifying six segments in the data
of website types were retained through inclusion of sites from
all stakeholder categories, whilst reducing the overall number of As we have seen in the previous chapters, the 102 data points were
websites to a manageable level for data collection purposes. collected for 257 websites. The data collected varied in nature and
consistency. The chosen method of segmentation needed to be
We formed a sample list containing 153 websites for the ‘Training able to manage numerical (e.g. Revenue=2401), categorical (e.g.
data’. We selected a further 104 websites to be used to validate the Country=SE) and missing data.
segmentation – ‘Validation data’.
4.2.2 A process to transform the collected data into the metrics
Obtaining the required data to populate the metrics was always going
to be a key challenge for this research. Our strategy was to only use
publically available data and automate the collection where possible.
We identified the following data sources to be used to obtain data
points and calculate the identified metrics:
• Data obtained directly from the website or inspection of the website;
• Google – Historic page views, Ad Planner data and Brand Rank;
• Kantar Media Compete – Website referral information;
• Alexa – Reputation Score;
• Robtex/DNS/ WHOIS lookup – IP address and Website data;
• Team Cyrmu Community Services – ASN and Country codes;
• IANA – data on the top level domain, for example .com, .uk, or .tv. Figure 4-6: Collating the metrics, choosing and applying the segmentation
Once the data sources were identified we analysed the data points
available and our ability to calculate the metrics using them. This
resulted in the identification of four groups of metrics:
• Simple metrics: Metrics where the data points are available and
therefore the metric can be calculated simply.
• Proxy metrics: Metrics where data is not available, but where we
use other data points as a good proxy for the metric.
• Excluded metrics: Metrics that we could not calculate with
the available data and therefore had to be excluded from the
segmentation.
• Complex metrics: Metrics that require a number of data points to
allow us to calculate them.
Through this analysis we are confident we obtained a set of metrics
that could be used for our segmentation.
A full list the data used and the details of each of the metric
calculations can be found in Appendices G and H.
4 Alexa, (2012) description, [Online], Available: http://www.alexa.com/help/traffic-learn-more [18 May 2012]
27The purpose of this report was to find structure and patterns in the
websites considered to be infringing copyright, without recourse to
experience, which led us towards a data and algorithmic approach,
based on the pros and cons outlined below:
Figure 4-7: Different segmentation methods that were considered for this report
4.3.1 An algorithmic approach to the segmentation We analysed the second validation set of 104 sites to test the
indicated segmentation solution of six segments by assigning these
There are many algorithmic approaches that could be used. We
to the existing segments.
selected the ‘Random Forests’ algorithm to create a ranking of
similarity for various solutions, along with the use of the ‘Within Sum We did this by rerunning the random forests algorithm using all 257
of Squares’ technique to identify the number of segments. A detailed sites. We then used the resulting similarity matrix to match each
discussion on how and why we selected this approach can be found validation site to the training sites that it was most similar to. We
in Appendix J. then assigned the validation site to the same cluster as its match.
This had the advantage that the validation site could be assigned
4.3.2 Six segments as the natural solution the entire hierarchy of its most similar training site, so a complete
hierarchical clustering of all the new sites was achieved. We found
From the 257 websites, we used 153 websites as the ‘Training’
the result shown in Figure 4-9 when comparing the Within Sum of
set and the remaining 104 websites as the ‘Validation’ set. We
Squares against the number of clusters for the 104 validation web
used the training set of websites to test the optimum number of
sites.
segments needed to classify the market. After we had determined
the similarity matrix for the training set, we started by assuming
three segments, or clusters, and used the ‘With Sum Squares’ to
calculate an understanding of ‘cluster suitability’. We then repeated
this calculation assuming four segments, then five, then six, and
so on until fifteen. We looked for a significant change in the ‘cluster
suitability’ which would highlight to us a segmentation that was
distinct from other segmentations and therefore likely to be the most
representative of the market. We found this significant change when
moving from five segments to six, shown in Figure 4-8.
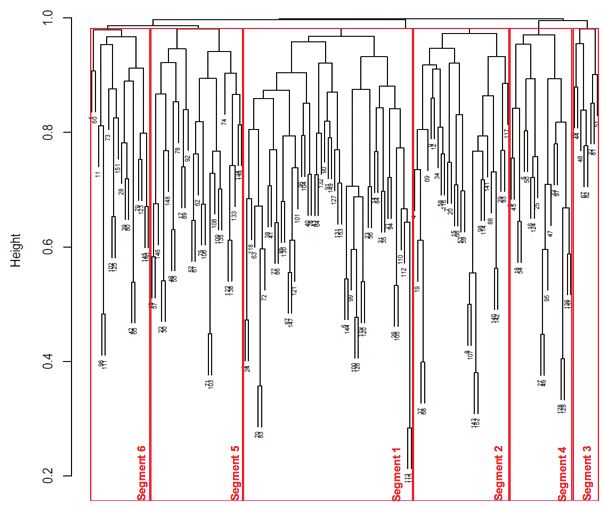
We then reviewed the segmentation into six clusters with the use
of ‘dendrogram’ plots and by validating with the second set of data.
These techniques are discussed in more detail in Appendix J.
28 The six business models for copyright infringement – A data driven study of websites considered to be infringing copyrightFigure 4-8: The ‘Within Sum Squares’ plot on the training data shows a significant
decrease between five and six which suggests a six segment presentation of the market
Training data [153] (primary axis)
Validation data [104] (primary axis)
All sites [257] (secondary axis)
Figure 4-9: The ‘Within Sum Squares’ plot on the validation data and repeated for all the data
confirms the initial six segment representation
When the total Within Sum of Squares per cluster for the combined
257 training and validation sites was then computed for 3 up to 15
clusters, the result obtained also showed a sharp drop when going
from 5 clusters to 6. This confirmed our initial finding of six segments.
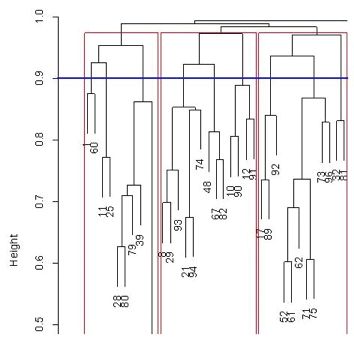
During the clustering, we observed that some of the segments
were better defined than others. We confirmed this by undertaking
Principal Component Analysis (PCA) on the 153 training data
websites; see Appendix K for more details. The PCA provided a view
on how close or different the segments were; the 1st two principal
components give a rough idea of what is happening within the
data. It should be noted that this is a simplification, and the features
distinguishing the other segments are probably being expressed in
higher dimensions.
295 Next steps
Detica recommends that this study is repeated as it is likely to prove 5.3.2 Automated website data collection
valuable for stakeholders and policy makers for two reasons: For this study a number of simple Python scripts were written
1. It will identify trends in a rapidly changing and dynamic market; with the intention of automatically collecting model metrics. This
and was accomplished by fetching Web pages over HTTP using the
appropriate python libraries (for example ‘urllib’). For each site a
2. It will allow for the impacts of industry changes and mitigating
number of HTML pages were required, corresponding to user’s
policy actions to be monitored and evaluated.
journey on the site. Parsing each of our collected website’s publicly
The benefits of this will be to increase the probability of policy available HTML pages we were then able to search for specific
achieving its objectives and to reduce the risk of unintended content including keywords and links to other websites relating to
consequences and unforced errors. specific model metrics.
The above approach contained a number of limitations:
5.1 Repeating the study to understand changes to the
• We required prior knowledge of the website specific user journey
market conditions over time necessary to consume content. Thus in all cases, this information
Chapters 2 and 3 highlight that, once the market is segmented, had to be manually collected and used as an input.
various conclusions can be drawn about the dominant behaviour of
• We observed that complicated websites, e.g. those with a
each of the segments. However, as a result of use of data analytics
significant amount JavaScript, were not always reliably collected –
to define the segments in the first place, no conclusions can be
requiring manual verification.
drawn on the inter-dependencies between the segments. These
inter-dependencies might include movement of consumers from one
5.3.3 Alternative methods
segment to another, shifts in the technology-use between segments
or shifts in advertising spend, for example. A number of alternative approaches to data collection were
considered however given the time constraints of this project these
These inter-dependencies between market segments and changes
were not employed. These are presented below, and may prove
to market conditions are conclusions that can be drawn over time.
more suitable for future studies.
In order to understand how the six segments change over time, we
recommend this study is repeated at intervals in order to assess the • Site specific website data collection
changes from the previous study. This could also provide the basis It may be more robust to write scripts that are unique to each
for any impact assessments that may be required before undertaking website. Whilst this may be more robust in term of collecting metrics,
market changing actions. it is certain to prove time consuming to develop
• Browser automation
5.2 Repeating the study to analyse the cause and
effect of events To ensure that any future capture of website data is consistent, a
browser automation tool could be employed to collect the required
In the same vein as the section above, this study is unable to report HTML pages on a user journey for a particular site.
on the effects of the implementation of certain actions undertaken or
events that happen in the market for material that infringes copyright. For each of the cases listed above, it should be noted that as
individual website change over time, a significant amount of effort
In order to understand the impact on the six segments found, after may be required to ensure that the necessary metrics can still be
the implementation of an action or market changing events, we collected.
recommend this study is repeated in a timely manner to assess the
actual impact.
5.3 Industrialising the study for a wider dataset
In future this report may be provided on a regular basis. This may
need the number of websites sampled to be enlarged and the
processes by which the datasets are collected to be undertaken with
greater automation. We discuss possible enhancements to this study,
below, if it were to be undertaken again.
5.3.1 Industrialisation of Data Capture
The findings present in this report are based on data collected from
153 websites. A further 104 websites were used to independently
validate the presented segmentation result. Whilst we attempted
to automate as much of the data capture as possible, via scripted
website data collection, a significant number of metrics required
either manual collection or verification.
A second key output of this research has been the development of
a metric-based segmentation model; looking forward, this could be
applied to future studies. However, it is likely that additional research
in this space will seek to focus on increasingly large numbers of
websites. This presents a number of challenges given the manual
effort undertaken during the course of this study to capture the
necessary data points. In this section we discuss potential ways to
fully automate or industrialise the data capture process for website
specific metrics.
30 The six business models for copyright infringement – A data driven study of websites considered to be infringing copyrightAppendix Contents
A Categorical metric detailed results 30
B Numeric metric detailed results 35
C Glossary and key to metrics 45
D Actor motivations 46
E Actor attributes 47
F Exclusion of applications 48
G Collected metrics 49
H Proxy and complex metrics 51
I Data collection methods 56
J Algorithm selection 58
K Principal component analysis 60
31A. Categorical metric detailed results 32 The six business models for copyright infringement – A data driven study of websites considered to be infringing copyright
33
34 The six business models for copyright infringement – A data driven study of websites considered to be infringing copyright
35
36 The six business models for copyright infringement – A data driven study of websites considered to be infringing copyright
B. Numeric metric detailed results

                                     37
38 The six business models for copyright infringement – A data driven study of websites considered to be infringing copyright
39
40 The six business models for copyright infringement – A data driven study of websites considered to be infringing copyright
41
42 The six business models for copyright infringement – A data driven study of websites considered to be infringing copyright
You can also read