The growing consumption of bread and baked goods in Indonesia - AN OPPORTUNITY FOR AUSTRALIAN WHEAT - Aegic
←
→
Page content transcription
If your browser does not render page correctly, please read the page content below
The growing consumption of
bread and baked goods in Indonesia
   AN OPPORTUNITY FOR AUSTRALIAN WHEAT

Peter Elliott | Ross Kingwell | Chris Carter
Purpose

AEGIC exists to increase
value in the Australian
grains industry.

Glossary
    AEGIC   Australian Export Grains Innovation Centre
    AH      Australian Hard (a class of Australian wheat)
    APH     Australian Prime Hard (a class of Australian wheat)
    APW     Australian Premium White (a class of Australian wheat)
    ASFT    Australian Soft (a class of Australian wheat)
    ASW     Australian Standard White (a class of Australian wheat)
    CWRS    Canadian Western Red Spring (a class of Canadian wheat)
    DNS     Dark Northern Spring (a class of USA wheat)
    ha      Hectare
    HRW     Hard Red Winter (a class of USA wheat)
    IDR     Indonesia Rupiah
    kcal    Kilocalorie
    kg      Kilogram
    NTD     No-time dough
    RD      Rapid dough
    RSP     Retail sale price
    SME     Small to medium-sized enterprise
    SD      Sponge and dough (baking)
    SWOT    Strengths, Weaknesses, Opportunities, Threats
    USA     United States of America
    WW      Western White (a class of USA wheat)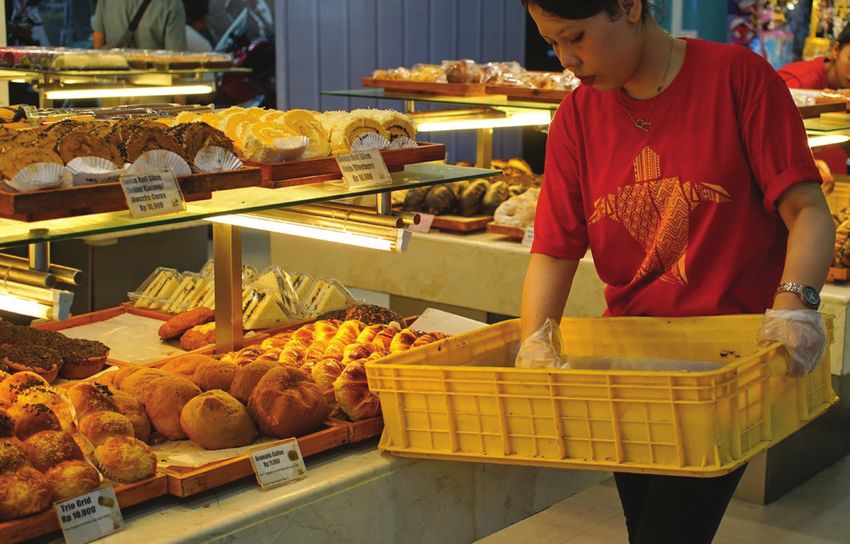
Contents
Summary                                                           04    Strategic considerations                                  30
Recommendations                                                   05       SWOT analysis                                           30
                                                                           Specialisation versus generalisation                    32
Key findings                                                      06       Low-cost entrants                                       33
Key Facts and Figures — Indonesia’s                                        Supplying Indonesia’s bread and baked
bread market                                                      07       products market                                         34
                                                                           Impacts beyond Indonesia in Australia’s
Introduction                                                      10       other wheat markets                                     35
                                                                           Australian wheat industry views                         36
Background — changing demographics
and bread consumption                                             13    Conclusion                                                38
The market for bread and bread                                          References                                                39
products in Indonesia                                             16
                                                                        Appendix — Snapshot of Indonesian
     Indonesia’s bread market — main                                    bread consumption in 2013                                 40
     players and market share                                      16
The popularity of Japanese-style
bread in Indonesia                                                21
     The ‘Funwari’ phenomenon                                      21
Quality and consumer preferences                                  23
     Sweet toothed consumers                                       23
     Australian wheat for the Indonesian
     bread market                                                  23
     Functional requirements of the Indonesian
     bread market                                                  25
     Bread wheat in Indonesia — functional
     requirements                                                  28

                                                                                                            aegic.org.au
                                                                                                                           WHRP19037EN
AEGIC is an initiative of the Western Australian State Government and                      December 2019. All contents copyright @AEGIC
Australia’s Grains Research and Development Corporation                                                               All rights reserved
Summary
     The largest wheat end product segment in Indonesia is currently     While existing Australian bulk grades do not perform like North
     instant noodles, followed by bread and baked products. Almost       American wheat in SD baking, there are two possible ways
     twice as much wheat is used to support instant noodle               forward. Firstly, while Australia does not currently provide a
     consumption compared to bread consumption. Towards 2030, the        CWRS-like bulk grade, there are individual varieties grown that
     higher growth rate in consumption of bread and baked products       either match or exceed the baking performance of North
     will lessen the volume gap between instant noodles and these        American equivalents. It is also likely that some unreleased
     other products. By 2030, only 30 per cent more wheat will be        crosses are similar to DNS quality and these could be drawn
     used for instant noodles compared to bread and baked goods.         upon if a bread-focused bulk grade was to be established. The
                                                                         second more feasible pathway is to continue to encourage
     Indonesia’s per capita consumption of bread is growing strongly,
                                                                         Indonesian end-users to further adopt rapid dough (RD) baking
     which represents a large source of additional demand for
                                                                         methodologies which are better suited to relatively extensible
     imported wheat. Indonesia’s population and per capita income
                                                                         Australian hard wheats. Some of the popular sweet baked goods
     are both increasing, fuelling the import of increasing volumes of
                                                                         and breads manufactured in small-to-medium bakeries use mid
     wheat for its bread and baked goods sector. The Australian share
                                                                         and lower protein wheat, which Australia already produces, in
     of the Indonesian bread market remains relatively small, with
                                                                         reasonable quantities.
     around 0.11mmt used annually (or less than 3% of Australian
     wheat exports to Indonesia).                                        The principal challenge facing Australia, should it choose to
                                                                         pursue supply of high protein wheats, will be its ability to
     Due to the popularity of ‘sponge & dough’ (SD) baking in
                                                                         reliably produce sufficient quantities with the protein levels and
     Indonesia, mostly in the large-scale industrial bakeries, the
                                                                         functionalities required. There is no impediment to Australia
     bread market in Indonesia remains dominated by North
                                                                         breeding improved wheat varieties suitable for these Indonesian
     American grades. Canadian Western Red Spring (CWRS) and to a
                                                                         end users. However, Australia’s climate variability and water-
     lesser extent, Dark Northern Spring (DNS) are viewed as
                                                                         limiting conditions are likely to inhibit its ability to be a reliable
     ‘benchmarks’ by millers. Australia does not presently offer a
                                                                         and affordable supplier of adequate volumes of such wheat.
     grade that competes directly against these North American
                                                                         There are other baked goods, such as cakes and cookies, and
     grades, as high-protein Australian wheat has historically been
                                                                         some styles of bread that either require or can include a higher
     targeted towards Asian noodles, which require distinctly
                                                                         proportion of the kinds of mid or lower protein wheats already
     different functional traits. Bread, and particularly SD bread,
                                                                         widely produced in Australia.
     requires higher protein wheat with comparatively strong dough
     — neither of which are competitive strengths of current             Over the next decade, there is no market segment anywhere
     Australian wheat grades.                                            else in Indonesia, or even further afield in neighbouring Asian
                                                                         markets, that comes close to offering as much volume and
                                                                         margin upside as Indonesia’s bread and baked goods market.
                                                                         Australia’s ability to profit from participating in that market
                                                                         growth requires careful consideration by Australia’s wheat
                                                                         industry.

04           The growing consumption of bread and baked goods in Indonesia: an opportunity for Australian wheat
Recommendations
1 Growing the use of Australian wheat in                         3 Overall, the Australian industry should target
  small-to-medium-sized Indonesian bakeries is                     market segments most likely to use Australian
  an opportunity for Australia in the short to                     wheat
  medium term                                                        The relative attractiveness of the Indonesian bread and
   More than two-thirds of Indonesian bread and baked goods          baked goods market needs to be compared against
   are produced by small-to-medium-sized enterprises                 opportunities in other market segments and geographic
   (SMEs). These bakeries can use flour blends which                 markets. Resources required for breeding and market
   incorporate mid-protein wheat, which Australia already            development are finite, while markets and market
   produces.                                                         segments with likely upside are numerous. The Indonesian
                                                                     bakery segment is multi-faceted, so care is required to
2 Large-scale industrial bakeries are a longer-term                  target segments most likely to include Australian wheat in
  opportunity for Australian wheat                                   their flours.
   This segment is dominated by North American wheat.            4 Ongoing technical engagement and education is
   Australia currently does not have a competitive advantage
   in this segment. In the longer term, Australian industry        needed to support Australian wheat in the
   could breed high protein baking wheats with competitive         Indonesian bread and baked goods market
   yields and functionalities suited to some bread flour             Technical support and collaborative activities between the
   blends in Indonesia. These varieties need to be                   Australian grains industry and end-users form a key part of
   commercially attractive to many farmers over a wide               the value proposition for Australian wheat. In scenarios
   geographical area to ensure Australia becomes a more              where the industry wishes to claim new market share, in a
   reliable and attractive supplier to Indonesian customers.         segment where end-users are unfamiliar with the product-
   The commercial viability of growing reliable quantities of        specific properties of Australian wheat, technical support
   high protein bread wheats will require a co-ordinated             becomes critical.
   approach between growers, breeders, WQA (Wheat Quality
   Australia), logistics and marketers.

                    The growing consumption of bread and baked goods in Indonesia: an opportunity for Australian wheat             05
Key findings
     Bread consumption is growing                                        North American wheat dominates
     Per capita wheat consumption for bread in Indonesia is around       The bread market in Indonesia, especially in large-scale
     4.7kg per year and is forecast to grow to 6.6kg by 2030. An         industrial bakeries, is dominated by North American grades, with
     additional 0.8mmt of imported wheat for bread will be required      DNS and CWRS considered the benchmarks by millers. Australia
     by 2030. By contrast, per capita wheat consumption for instant      does not presently offer a grade that competes directly against
     noodles has plateaued at around 8kg per year and remains a          DNS and CWRS.
     dominant source of wheat demand.
                                                                         North American wheat commands premium prices
     Baked goods are premium foods                                       DNS and CWRS classes attract a premium of generally between
     Compared to instant noodles, bread and other baked goods are        USD$20/t and USD$40/t over Australian Hard (AH) wheat on a
     mostly premium snacks eaten for pleasure rather than satiety.       delivered basis.
     Wheat for some of these end uses has greater scope for
     premiumisation.                                                     Baked goods are an opportunity for Australian wheat
                                                                         Supply of functionally attractive wheat from Australia will help
     Most baked goods are produced by smaller bakeries                   Indonesia to diversify its sources of wheat for the bread and
     More than two-thirds of baked goods in Indonesia are produced       baked goods segment. This will add to Australia’s reputation as
     by small, traditional, family-owned enterprises and similar SMEs.   a supplier of functional wheat for use in a range of wheat
     A further 11% is produced by small boutique bakeries. Large-        products. Australia can also diversify its exposure to different
     scale industrial bakeries produce the remaining 19% of              market segments.
     Indonesia’s baked goods.
                                                                         Australian wheat is a good blending option
     ‘Bread’ has a broad definition                                      Australia’s potential to profit from serving Indonesia’s bread and
     Most Australians perceive bread as pan bread or loaf bread. In      baked goods sector is likely to be as a component of premium
     Indonesia a wider array of products, often containing sugar and     bread flour blends, due to the relatively affordable functionality
     fat, are labelled and viewed as bread.                              of suitable Australian wheat classes.

     High protein wheat is preferred
     Bread-making, especially by large-scale industrial bakeries, uses
     higher protein wheat with comparatively strong dough — neither
     of which are a comparative advantage for Australian wheat.
     Some popular sweet baked goods and breads manufactured by
     SMEs can use lower protein wheat, which Australia already
     produces in large quantities.

06            The growing consumption of bread and baked goods in Indonesia: an opportunity for Australian wheat
Key Facts and Figures
Indonesia’s Bread Market
    Consumption
    The largest wheat end product segment in Indonesia is currently instant noodles, followed by
    bread products. Almost twice as much wheat is used to support instant noodle consumption
    compared to bread consumption. Towards 2030, however, the higher growth rate in consumption
    of bread products will lessen the wheat use gap between instant noodles and bread, with only
    30 per cent more wheat being used for instant noodles compared to bread (Table 1).

 Table 1. Share of wheat demand, volume of wheat demand, and wheat demand per head by product, forecast to 2030

                                                               2019: ESTIMATED                            2030: FORECAST
                                                                Wheat for food                            Wheat for food
                                                         (%)          mmt           kg/hd           (%)        mmt          kg/hd

                 Instant noodles                       36%             2.2           8.3           32%         2.6          8.4

                 Other noodles                         11%             0.7           2.6           14%         1.1          3.6

                 Bread                                 21%             1.3           4.7           25%         2.0          6.6

                 Cakes and biscuits                    15%             0.9           3.4           12%         1.0          3.3

                 Home use                              15%             0.9           3.4           12%         1.0          3.3

                                                               Total wheat use                            Total wheat use
                 TOTAL FOOD                            62%             6.2          22.9           62%         7.9          26.0

                 FEED AND OTHER                        38%             3.8          14.1           38%         4.9          15.9
Source: (OECD – consumption and share by segment, AEGIC – product share estimates as at September 2019)

                        The growing consumption of bread and baked goods in Indonesia: an opportunity for Australian wheat          07
Market share
The Australian share of the Indonesian bread market is small relative to Canada, with the current
volume of Australian grain used to make bread estimated at 0.11mmt annually (Figure 1).
Instant noodles: Bread: Cakes and biscuits:
2.2mmt 1.3mmt 1.0mmt
$550m $377m $235m
United States
0.39mmt
$90.6m
Canada
0.65mmt
$188.1m
Black Sea
Australia 0.23mmt
1.13mmt $67.1m Black Sea Australia
$282.5m 0.27mmt 0.25mmt
United
States Australia $64.5m $58m
0.26mmt 0.11mmt
$75.7m $67.1m
Home Other noodles:
use: 0.7mmt
0.9mmt $172.2m
Black Sea $207m Australia Canada
0.71mmt 0.19mmt 0.13mmt Australia
$177.8m $44.6m $30.3m 0.44mmt
$108.4m
United
Canada Black Sea States Canada
0.3mmt 0.34mmt 0.11mmt 0.2mmt
$74.7m $77.3m $24.4m $48.2m
Figure 1
Estimated breakdown of the volume and value of wheat used in Indonesian food products, by wheat origin, for 2019
Source: AEGIC
08 The growing consumption of bread and baked goods in Indonesia: an opportunity for Australian wheatPopulation
Indonesia’s population has increased from 200 million in 1995 and is expected to reach
300 million by 2035 (Figure 2).
350
300
Population (millions)
250
200
150
100
50
0
1950
1955
1960
1965
1970
1975
1980
1985
1990
1995
2000
2005
2010
2015
2020
2025
2030
2035
Forecast
Female Male
Figure 2
Indonesian population, 1950–2035
The growing consumption of bread and baked goods in Indonesia: an opportunity for Australian wheat 09Introduction
This report is the third in a series focused on Indonesia — Australia’s largest wheat
market, located to our immediate north. The first report (The Indonesian Wheat
Market — Its strategic importance to Australia) provided a general overview, while
the second report (The Indonesian Noodle Market — Its importance to Australian
wheat exports) focused on the market for noodles, which has absorbed more
Australian wheat exports than any other global market. Both reports indicated that
the growing consumption of various wheat-based foods in Indonesia is attributable
to three factors — rising disposable incomes, urbanisation and national food security.
This third report focuses on Indonesian consumption of bread, Indonesian breads come in a wide variety of styles and shapes
bread products and baked goods. The scope of this report thus and often have substantial inclusions of sugar and fat that is
covers a wide range of food products, from sandwich bread uncommon in Australia. Fortunately for Australian wheat, the
through to the various sweet, baked treats that are becoming range of bread types in Indonesia does allow some variety of
increasingly popular as Indonesia urbanises and increases its flour mixes to be used, depending on the bread type and the
per capita wealth. This wide range of products draws on a wide method of bread-making.
range of flour types, and therefore, various wheat grades. As a
Some global context regarding bread consumption is useful to
rule of thumb, bread and bread-like food products typically
note. Bread is an historically important staple food across much
require relatively high-protein wheat, while many of the sweet
of the Western world, with more than 100mmt consumed
baked goods use a range of wheat classes, from mid-protein
globally each year (Figure 3).
wheat through to low-protein soft wheat.
Most Australians perceive bread as pan bread or loaf bread.
However, a wider array of products, often containing sugar and
fat, are labelled and viewed as bread in Indonesia. This is a key
difference between the bread market in Australia and Indonesia.
10 The growing consumption of bread and baked goods in Indonesia: an opportunity for Australian wheat120 50
Consumption (million tonnes)
100 40
Year-on-year %
80 30
60 20
40 4.7% 4.9% 10
3.3% 2.2% 3.3% 2.2% 1.9%
- 0.5% 0.5% 0.2%
20 0
0 -10
2007
2008
2009
2010
2011
2012
2013
2014
2015
2016
2017
Consumption Year-on-year %
Figure 3
The volume (mmt) and annual growth (%) of the global bread market, 2007–2017
Note: : YoY is year on year percentage change
Consumption is dominated by the USA, Russia, UK and Germany. IndexBox has forecast global bread consumption to grow to
Perhaps less well-known is that China, principally due to the 117mmt per annum by 2025 (Figure 5) representing an annual
size of its population, is the world’s second-largest bread growth of 1.6%. Much of this increase comes from countries like
consumer, accounting for around 10% of global bread Indonesia, who have young and increasingly urbanised
consumption. As a group, all these countries account for nearly consumers developing a taste for Western-style bakery foods
half of global consumption (Figure 4). such as bread, cakes and cookies. This growth in consumption
of bread will mostly occur in Asia and will require an extra
While bread consumption is a relatively saturated mature
14mmt of wheat to be produced by 2025.
market in many Western countries, bread consumption in many
Asian countries like Indonesia is in its infancy. However, due to
the prospect of population increase, consumption in Asia (and 2.8%
Japan
further out, Africa) is an emerging source of future 3.0%
consumption growth. Spain 2.9%
3.8% France
Brazil
4.0%
Italy
4.9%
Egypt
33.6%
Others
5.0%
Germany
6.0%
United Kingdom
9.0%
Russia
15.0%
Figure 4 10.0% USA
Countries’ shares of global bread China
consumption in 2017 (Numbers are % shares)
The growing consumption of bread and baked goods in Indonesia: an opportunity for Australian wheat 11120
Global bread consumption (mmt)
100
80
60
40 1.6%
2.2%
20
0
2007
2008
2009
2010
2011
2012
2013
2014
2015
2016
2017
2018
2019
2020
2021
2022
2023
2024
2025
Figure 5
Global bread consumption (mmt) and annual growth (%), actual and projected, from 2007 to 2025
Indonesia is already a globally important importer of wheat, relative importance of wheats required for instant noodles as
principally used in noodle production. However, Indonesia’s per capita consumption of noodles has plateaued (Kingwell et
future bread and baked goods consumption will benefit from a al., 2019). In addition, as 2030 approaches, the nature of
potent combination of population growth plus per capita Australia’s interaction with the Indonesian market is likely to
consumption growth. change, with the growth in Indonesian wheat demand
(~2.1mmt) likely to outstrip growth in the exportable surplus of
In general, the type of wheat required for making bread is
Australian wheat (Kingwell, 2019b).
different from the types of wheat required to make noodles,
cakes and biscuits. Hence, over the next decade, due to the In this AEGIC report we explore the nature of Indonesia’s bread
stronger rate of growth in consumption of bread and baked and baked goods sector and examine the opportunities it might
goods in Indonesia, the profile of Indonesia’s wheat imports will present for Australia’s wheat industry.
change. For example, there will be a gradual decline in the
12 The growing consumption of bread and baked goods in Indonesia: an opportunity for Australian wheatBackground – changing
demographics and bread
consumption
When an individual’s income is enough to safeguard their daily Indonesia’s bread market is growing strongly, as indicated by
caloric requirements, then their diet becomes less focused on retail sales growth (Table 2). In the future, Indonesia’s
survival and more on provision of experiences. Taste and novelty population growth and its per capita income growth (Kingwell et
become increasingly important drivers of consumer behaviour. al., 2018) will further fuel the consumption of bread and bakery
The consumption of bread in Indonesia reflects this goods. Bread-based foods, such as sandwiches, will increase as
phenomenon. a proportion of total calories consumed by the average
Indonesian. A major driver of this will be dietary change where
The historical carbohydrate staple for Indonesia is rice not
bread consumption alters from being a ‘sometimes snack’ (see
bread. As an equatorial tropical country, Indonesia does not
Appendix) to a more commonplace option that complements the
produce wheat. Instead it grows rice and rice remains its main
ongoing dominance of rice and instant noodles.
food staple. In Indonesia, bread is a novelty rather than a
staple. Indonesia’s young, urban and emergent middle and
upper classes consume bread as a snack, usually a sweet treat
from a bakery.
Table 2
Bread consumption in Indonesia: 2013–2018
Unit 2013 2014 2015 2016 2017 2018 2013-18 Growth
Total volume ‘000 tonnes 473 500 526 553 576 599 27%
Retail value IDR billion 4,649 5,151 5,538 5,954 6,260 6,557 41%
Source: Euromonitor (based on sales in main retail outlets)
Note: Other important sources of purchases of bread and bakery products are not included in this table
The growing consumption of bread and baked goods in Indonesia: an opportunity for Australian wheat 13Urbanisation in Indonesia is associated with a gradual dietary There are a range of estimates of Indonesia’s per capita
shift away from a largely rice-centric diet to one where calories consumption of bread and baked goods. For example, Statista
are added from other sources, especially wheat-based noodles. (2019) estimates the average per capita annual consumption of
Indonesia is now the second-largest instant noodle market in bread and bakery products in a broad range of countries,
the world (behind China). While instant noodles often are including Indonesia. They estimate Indonesia’s per capita
marginally cheaper than rice, the consumption of noodles is not consumption of bread and bakery products is ~9kg (Figure 6).
solely due to their affordability but also due to their AEGIC suggests a slightly lower figure for the bread and bakery
convenience. Busy office workers in urban areas prefer to segment, estimating current bread consumption in Indonesia of
consume noodles due to their convenience and affordability. around 4.7kg (in wheat equivalents), with per capita
consumption of other baked goods of ~3.8kg, totalling a lower
If Indonesian diets continue to duplicate the dietary shifts
combined figure of 8.5kg.
already observed over the last two or more decades in the more
developed Asian economies, like Malaysia and Japan, then
sizeable growth in consumption of bread and bakery products is
likely. This growth will be fuelled by both per capita increases in
consumption and a rising population. A modest per capita
growth in coming decades of only 5kg per person in Indonesia
eventually would require import of around 15mmt of wheat for
the Indonesian bread and bakery products sector.
Germany
Spain
United Kingdom
Italy
France
United States
Australia
Canada
Argentina
Brazil
Japan
Malaysia
Indonesia
Thailand
South Korea
Mexico
Philippines
Vietnam
China
Figure 6 India
Per capita annual consumption of
bread and bakery products for 0 10 20 30 40 50 60 70 80
various countries in 2018 Consumption (kg/capita)
Source: Statista 2019
14 The growing consumption of bread and baked goods in Indonesia: an opportunity for Australian wheatThe growing consumption of bread and baked goods in Indonesia: an opportunity for Australian wheat 15
The market for bread and
     bread products in Indonesia
     Indonesia’s bread market — main                                       brands, like Sari Roti and MyRoti, are expected to claim a larger
                                                                           market share in the future.
     players and market share
                                                                           As Indonesia’s overall retail sector continues to modernise and
     A major difference between the bakery sector, the instant noodle      move further towards the ‘supermarket and convenience store’
     sector and flour milling in Indonesia is the degree of relative       model, greater concentration of market share in the larger,
     market fragmentation. Instant noodle and flour production can         industrialised players is expected. These larger businesses have
     be characterised as quasi-oligopolies, with overall market share      the required scale and supply chain infrastructure to meet the
     concentrated in a handful of individual players and their             requirements of this channel. This trend is relevant for any
     dominant retail brands. By contrast, more than two-thirds of          Australian wheat exports aiming to claim a share of this market.
     baked goods in Indonesia are produced by small, traditional,          The processes used to produce, store and distribute bread can
     family-owned enterprises and similar SMEs. A further 11% is           influence the functional traits required of the wheat — right
     produced by small boutique bakeries. Lastly, at present,              down to the ambient temperature and humidity levels in the
     large-scale, industrial enterprises such as Sari Roti and their       bakery.
     competitors (Table 3) have a 19% market. These large retail

     Table 3
     Indonesian bread and baked goods market — main players overview
                                  Market                                                            Main Retail
      Company                                      Annual Sales            Market Capacity                                Ownership
                                  Share                                                               Brand
      Traditional SMEs             68.0%
      Boutique Bakeries            11.2%                                                         BreadTalk
      • PT. BreadTalk                                                                            Holland Bakery
        Indonesia
      • PT. Mustika Cita Rasa
      • others
      PT. Nippon Indosari          18.8%    Year 2018:                  10 plants in Indonesia    Sari Roti         PT. Indoritel Makmur
      Corpindo Tbk.                         • Bread                     (4.06 million pieces      BonChef           Internasional Tbk;
                                              (Rp. 1.510 billion)       per day)                                    Bonlight Investment
      • PT. Prima Top Boga
                                            • Sweet Bread/Buns                                                      Limited; Demeter Indo
      • Sarimonde Foods                                                 1 plant in Philippines
                                              (Rp. 845.3 billion)                                                   Investment Pte. Ltd
        Corporation                                                                                                 (KKR & Co.L.P); Pasco
      • PT. Mitra New Grain                 • Cakes
                                                                                                                    Shikishima
                                              (Rp. 93.14 billion)
                                                                                                                    Corporation; and
                                            • Philippines                                                           Public investors
                                              (Rp. 10.99 billion)
      PT. Swanish Boga                                 n.p.                                       Swanish
      Industria
      PT. Yamazaki Indonesia                           n.p.                                       MyRoti
      PT. Multi Star Rukun                             n.p.                                       Sharon
      Abadi
      PT. Sriboga Bakeries                             n.p.                                       Le Gitt
      Integra
     Note: n.p. not published

16             The growing consumption of bread and baked goods in Indonesia: an opportunity for Australian wheat
Indonesia’s top three players (Nippon, Yamazaki,
Swanish Boga) account for around 26% of total
volume and around 36% by value (Figure 7) of 50
Indonesia’s bread market, indicating that the big
brands are able to extract a premium from
40
consumers compared to their smaller, mostly
Share of value (%)
unbranded competitors. Additionally, Nippon are
expanding both market share by volume, and Others
30
value, at the expense of small (Others) and own Nippon
label brands.
20
Own Label
10 Yamazaki
Swanish Boga
Figure 7 0
Market share by volume and value — bread 0 10 20 30 40 50
and bread products (%). (Dotted line Share of volume (%)
indicates equal share of volume and value.
Brands above the dotted line extract a 2015 2016
premium, brands below, are discounted)
The growing consumption of bread and baked goods in Indonesia: an opportunity for Australian wheat 17Sari Roti today
• More than 4 million bread products produced daily
• 10 factories across Indonesia
• Available in nearly 60,000 individual retail outlets
(including 15000 Salim-owned convenience stores)
• 90% of ‘factory produced bread’ market share
• Nippon Indosari listed on the stock exchange in 2010
• Averages 30% annual sales growth
Figure 8
Nippon Indosari’s dominant Sari Roti brand
The Indonesian bread market is dominated by Nippon Indosari More recently, Japan’s biggest bread maker, Yamazaki, and
(Table 4) and their popular Sari Roti brand of bread products Japan’s biggest trading house, Mitsubishi, have joined up to
(Figure 8). Sari Roti importantly has longstanding ties with the make a concerted push into the Indonesian bread market,
Salim Group who control Indonesia’s largest and second largest becoming the second biggest player behind Nippon Indosari.
flour millers (Bogasari and Interflour). Yamazaki Indonesia is a joint venture between Yamazaki,
Table 4 Mitsubishi and local Indonesian convenience store chain
PT. Nippon Indosari production capacity by factory in 2018 Alfamart. The bread produced by Yamazaki Indonesia is sold
under the MyRoti brand, predominantly in Alfamart’s 5500
Capacity
Location outlets across the country.
(‘000 pieces per day)
Nippon Indosari and Yamazaki Indonesia share their Japanese
Pasuruan 825
milling and bread production know-how with their local entity.
Cikarang Block U 516 Adoption of Japanese processes enables these businesses to
Medan 476 cater to the popularity of softer, Japanese-style bread in
Semarang 443 Indonesia — particularly among young urbanites. Although
Japanese-style bread is popular in Indonesia there are key
Purwakarta 435
differences in both the processes and raw materials used by
Cikande 434 Indonesian bread-makers to ensure that their final product is
Cikarang Block W 349 affordable to produce, while still appealing to local consumers.
Cibitung MM2100 282 Bread in Indonesia, including so-called ‘Japanese-style’ bread, is
comprised of several grades and origins and is subject to
Makassar 156
variability as prices and availability of particular grades alter. At
Palembang 144 any one time, bread in Indonesia is likely to include wheat from
Total 4,059 the USA, Canada, Russia, Ukraine and Argentina. It rarely
contains Australian wheat in any sizeable proportion.
The adoption of Japanese processes in Indonesian milling and
bread production has matured to the point where the
Indonesians now export their own bread products and bread-
making expertise. The popularity of softer, Japanese-style bread
elsewhere in Asia has seen Sari Roti recently joining Monde
Nissin to launch Sari Roti in Philippines. This partnership has
been prominently advertised by Monde Nissin who clearly see
value in the Sari Roti brand (Figure 9).
18 The growing consumption of bread and baked goods in Indonesia: an opportunity for Australian wheatFigure 9
Monde Nissin’s Philippines internet homepage
Growth rates and variety Distribution
Longitudinal datasets on per capita consumption of particular Noodles and bread in Indonesia are distributed and sold to
types of bread and baked goods in Indonesia are rarely consumers in different ways, primarily because of their relative
published; but what reliable datasets do exist (Table 5) reveal shelf-lives. From the moment a loaf of bread is produced, its
strong growth in per capita consumption of bread, cookies and freshness declines. Consumers dislike stale bread, yet a packet
cakes. The fact that so many entrants and market players are of instant noodles can be stored for several weeks without any
contesting for market share is also one indicator of the positive adverse quality implications. While this comparison would
commercial prospects for engaging in the manufacture and apply in any market, Indonesia’s archipelagic layout creates
retailing of bread and baked goods in Indonesia. unique logistics challenges for any major bread and baked
goods producer. These logistics’ constraints favour the
As per capita consumption of bread and baked goods increases,
production and consumption of instant noodles and help
then a greater diversity of product lines is likely, with these
underpin the success of noodle brands like Indomie that rely on
products being sold at a range of price points (Table 6) and
economies of scale of production. Such scale economies cannot
qualities. This myriad of market opportunities will create a
easily apply to the making and distribution of perishable bread
consequent demand for a diverse range of flour types and
and baked goods in an archipelagic country like Indonesia. So,
qualities.
there is no Indofood-style monolithic player in the bakery sector.
Table 5
Yearly per capita consumption of bread (and cake)
Growth Rate
Type UoM 2014 2015 2016 2017 2018
(%)
Toast bread Pack 0.062 – – 0.367 0.366 –
Sweet bread Per 0.1 kg 0.495 – – 1.104 1.122 –
Cookies Per 0.1 kg 0.168 0.353 0.373 0.384 0.438 33.3%
Cake Pieces 0.695 1.245 1.290 1.345 1.431 23.3%
Source: Indonesian Ministry of Agriculture
The growing consumption of bread and baked goods in Indonesia: an opportunity for Australian wheat 19Similar to noodles, however, major urban centres, where income The distribution channels used by the larger packaged bread
and population growth occur, are the commercial heartland of producers in Indonesia strongly favour minimarkets, which are
bread production and consumption. Bread’s perishability and its similar to 7-eleven-style convenience stores (Table 7).
income-linked demand particularly cause it to be more an urban Minimarkets and convenience stores stock perishables like bread
phenomenon — especially in the packaged goods channel. In and baked goods whose consumption mostly occurs daily.
Indonesia’s more dispersed and remote locations bread Minimarket sales account for 71% of the total volume of bread
consumption will gradually increase, but in those distant regions sales by one of Indonesia’s leading packaged bread producers.
bread is more likely to be produced by small or family-run
Although SMEs (mostly small shops) are more numerous than
bakeries, sold directly from those premises or from nearby street
minimarkets (Table 7), the bulk of packaged bread purchasing
markets or mini-marts.
occurs at minimarkets. Due to the perishability of bread and
baked goods, direct sales are another sales outlet whereby sellers
distribute these products directly by tricycle or motorcycle.
Table 6
Examples – Serving sizes and price by brand
Nutrient Type Size (gram) Price (Rupiah) $USD $USD/kg flour used*
Sharon Pancake Dorayaki 65 7,500 0.53 16.3
Sari Roti Sandwiches 46 4,500 0.32 13.8
MyRoti Sandwiches 52 5,000 0.35 13.6
Sari Roti Sweet Bun 70 6,500 0.46 13.1
Sari Roti Pancake Dorayaki 55 5,000 0.35 12.9
Mr. Bread Sandwiches 50 4,500 0.32 12.7
Sari Roti Toast Plain 200 14,500 1.03 10.3
Mr. Bread Toast Sweet 180 12,500 0.88 9.8
Sari Roti Toast Sweet 226 15,000 1.06 9.4
Mr. Bread Toast Plain 220 14,500 1.03 9.3
MyRoti Toast Sweet 235 13,500 0.95 8.1
MyRoti Sweet Bun 58 3,000 0.21 7.3
Source: Indonesian Ministry of Agriculture
* Assumes similar incorporation (50%) of flour within each product
Table 7
Type and number of retail outlets for a leading bread producer in Indonesia
Number of
Category Retail share Retailer
distribution points
Minimarket 71% Indomaret 10,788
Alfamart 9,987
Alfa Midi 885
Star Mart 96
Yomart 71
Distribution 13% Small shops 31,618
Direct Agents 9% Tricycle 2,121
Motorcycle 2,409
Bicycle 494
Supermarket 6% Lion 125
Giant 96
Hero 90
Ramayana 52
Carrefour 76
Institutions 1%
20 The growing consumption of bread and baked goods in Indonesia: an opportunity for Australian wheatThe popularity of Japanese-
style bread in Indonesia
The ‘Funwari’ phenomenon Looking at some of the retail packaging for MyRoti products
(Figure 10) is illuminating.
Typically, a foreign company will decide to enter a new
geographical market in the hope of generating demand for their The Japanese word for ‘fluffy’ (funwari) is an integral element of
products. Fortunately for the Japanese firm, Yamazaki, they have the overall branding message. However, the most notable aspect
been able to establish a promising position in the Indonesian of this packaging is not that it uses fluffiness as a selling point
market because soft and fluffy Japanese-style bread products — it is the fact that it uses the Japanese word for fluffy and not
also suit the Indonesian palate for baked goods. the Indonesian equivalent. Even more surprising is the
packaging for sandwich bread, which takes this one step further
and even uses the Japanese hiragana characters to write funwari
“Japan’s Mitsubishi Corp. has come (ふんわり). The only reason to use these characters is that
there is strong, positive branding associated with Japanese-style
up with a business model to sidestep bread. Specifically, the implicit message is one of authenticity
the country’s shrinking population and quality.
— export Japanese consumption
habits to Indonesia.”
Nikkei Asian Review
Figure 10
Myroti retail packaging with prominent use
of funwari (fluffiness) as a selling point
The growing consumption of bread and baked goods in Indonesia: an opportunity for Australian wheat 2122 The growing consumption of bread and baked goods in Indonesia: an opportunity for Australian wheat
Quality and consumer
preferences
Each bread market across the world has subtle and unique                 Indonesians love sweet foods. The popular sweet bread has a
market requirements, due to their bread-making process, style            sugar content of 24%-28%, whilst sandwich bread has 10%-15%
of bread, ingredients and physical appearance of the bread.              of sugar. Fat is also added to improve the crumb structure,
                                                                         texture, and eating quality (softness) of the bread. Sweet bread
Sweet toothed consumers                                                  contains 16-18% fat whilst sandwiches contain 7-10% of fat.

Indonesian consumers prefer sweetened bread. Sweetened
bread consumption consistently dominates overall bread
                                                                         Australian wheat for the Indonesian
consumption in Indonesia. Along with the typical Western                 bread market
bread-based foods, such as sandwiches and toasted bread,
                                                                         Due to its large population, even modest increases in
Indonesians are consuming growing quantities of sweetened
                                                                         Indonesia’s per capita consumption of bread have the potential
bread, pancakes, dorayaki, pastries and donuts.
                                                                         to absorb a substantial volume of imported wheat. Furthermore,
The relative unimportance of sandwich bread is potentially               Indonesia’s per capita income growth and the sheer number of
relevant from a wheat quality perspective, as the functional             additional middle-class consumers, with a capacity to pay for a
requirements for each segment will be different. Wheat varieties         greater array of bread products, will increasingly affect the
that perform in the sponge and dough (SD) method of making               supply of functionally suitable wheat required to manufacture
pan bread may not be suitable for one of the sweeter (and                those products. If Australian wheat is to capture a meaningful
often, softer) bread-based products popular in Indonesia.                portion of this opportunity, there are some clear challenges that
                                                                         must first be overcome (Table 9).
Most industrial bakeries in Indonesia use semi to fully automatic
bread lines and employ the SD method for making bread. These             While Australian wheat is clearly recognised for its noodle
bakeries currently enjoy a 19% market share in the bread and             performance, Asian buyers mostly do not view Australian wheat
baked goods sector yet a 36% share solely in the bread sector.           as highly suited for bread-making. Bread-making remains
By contrast, the numerous small family-owned SMEs usually use            dominated by North American grades such as DNS (USA), CWRS
manual or semi-automatic bread-making processes largely based            (Canada) and HRW (USA), as these grades are suited to the SD
on the different no time dough method. Included in the                   process used by Indonesia’s principal industrial bakeries whose
bread-making process for some of these SMEs is a dough-                  market share is growing.
breaking machine that improves the bread quality. In general, if
                                                                         For cakes and cookies, this segment also is dominated by US
the bread-making process is semi-automatic then stronger flours
                                                                         WW (Western White). However, there is a reasonable volume of
are used. If the process is manual, then less strong flour is used.
                                                                         Australian wheat being used in cakes and cookies, blended
                                                                         mostly with WW. Australian wheat is often included in a baker’s
                                                                         soft wheat flour for cakes and cookies, but it is rarely the
                                                                         primary grade in this segment and instead plays a supportive
                                                                         role due to either to its cost or lesser functional suitability.

Table 9
Current role and position of Australian wheat in individual Indonesian market segments
                         Yield competitive varieties with             Widespread use and acceptance of
 Segment
                         elite functionality                          suitable Australian wheat varieties
 Noodles                                    4                                           4
 Bread                                      4                                           8
 Baked confectionery                        8                                           4

                       The growing consumption of bread and baked goods in Indonesia: an opportunity for Australian wheat                    23
Indonesian processors are familiar with the functional properties So, why there is a market perception of Australia as being a
of Australian wheat for baked confectionery and some Australian noodle wheat specialist and not a producer of high-protein, DNS
wheat, the APH and AH grades, may be added to bread flour or CWRS equivalent baking wheats? At a fundamental level,
blends when and if those grades are price competitive. In there is one inherent challenge that must be overcome in order
general, in Indonesia’s two fastest growing segments, bread and to become a concurrent supplier of both high-quality noodle
baked confectionery, Australian wheat plays a limited part or, at wheat and baking wheat – the traits that define the ideal noodle
best, supporting role to North American grades. wheat or the ideal baking wheat vary considerably. In fact, not
only are they different, but in a certain sense they are almost
Australia’s current lack of market share in the industrial baked
polar opposites. Most notably, noodles require well-balanced,
goods segment, in particular, is only a bad thing if there was a
more extensible dough, while bread requires stronger, less
fundamental reason why Australian wheat was technically
extensible dough. Of the varieties currently classified as APH,
unsuited for making bread. However, recent collaborations
there is a clear skew towards wheats with balanced dough
between Australian researchers and Indonesian millers and
properties, which is reflective of the historical importance of
end-users have, on several occasions, demonstrated that a
premium Asian noodle markets for Australian wheat. However,
specific Australian variety, grade or blend can outperform the
interspersed within the advanced breeding lines for this wheat
North American equivalent in properly controlled baking tests.
class are elite bread-baking wheats likely to gain APH
Following this research, the problem is not the lack of evidence
classification.
of performance when making bread, but rather a lack of a
reliable, consistent, price-competitive supply of such wheat from It is useful to note that North American wheat is subject to the
Australia. As observed by Dr Steve Jefferies, managing director of equal and opposite problem – their system is set up to capture
GRDC and a former CEO of Australian Grain Technologies: high dough strength wheat and therefore, extensible varieties
have limited avenues to market. According to a study
conducted at Montana State University:
“Our issue is not about genetic
capacity to produce DNS or CWRS “Our results suggest that traditional
functionality. In fact, that’s easy. selection criteria in hard red spring
We can even do much better if we wheat, including tolerance to dough
tried. Our issue is being able to mixing and high loaf volume may
produce consistent quality, efficiently result in reduced dough extensibility.”
segregatable quantities of 14%+
protein wheat.”
If the Australian industry decides to target Indonesia’s growing
baked goods sector, one pre-requisite will be to provide growers
with clear market signals to incentivise their adoption of
high-performance baking wheats. This would need to be
complemented by providing buyers with access to a segregated
pool of bread-specific varieties. The decision whether or not to
target Indonesia’s industrial bread-making sector largely comes
down to which approach delivers maximum long-term net
economic benefit. Calculating this benefit is no simple exercise,
and nor is the outcome obvious. It requires a high-resolution
‘paddock to plate’ understanding of each factor that affects the
cost of production along with an understanding of the value
that buyers place on certain functional traits. The outcome
might be that Australia is better off focusing on mostly on
noodle wheats, for any number of reasons including logistical
inefficiencies, environmental challenges or export market
volatility. Or Australia could attempt to boost its production of
AH wheat to ensure it captures a larger portion of the flour
blend required by small family-owned SMEs that usually use
manual or semi-automatic bread-making processes largely
based on the different no time dough method to which
Australian wheat is better suited.
24 The growing consumption of bread and baked goods in Indonesia: an opportunity for Australian wheatWhatever strategic position the Australian wheat
industry pursues, it will be against the backdrop that
there is no market for wheat anywhere else in
Indonesia, or even further afield in neighbouring Asian
markets, that comes close to offering as much possible
upside as Indonesia’s bread and baked goods market.
Functional requirements of the End use or baking functionality depends on a complex set of
grain attributes and one indicator (e.g. grain protein) is rarely a
Indonesian bread market sufficient indicator of end use functionality. Moreover, even
While Australian wheat is seldom used specifically for its baking when a set of measures is considered, their correlation with end
properties in the Indonesian market, AEGIC has established a use performance is not perfect. A useful example is high
detailed understanding of the Indonesian baking sector’s protein wheat from Kazakhstan, which can reach the 16-19%
functional requirements. For the average Indonesian baker, protein content range. If there was a perfect positive correlation
whether an individual bakery or large manufactured brand, the between protein and baking functionality, Kazakhstan wheat
most important measure is loaf volume. The more bread that would dominate the Indonesian and greater Asian bread
can be produced using a given quantity of flour, the more markets. However, a clear message from end-users is that
revenue can be generated. Kazakhstan wheat, irrespective of protein content, bakes poorly.
In fact, recent feedback suggests that this view applies also to
If loaf volume is a key end, then the means are the functional Ukrainian and Russian wheat to varying degrees. This important
and quality traits that drive loaf volume (e.g. Dowell et al., technical understanding is illustrated in Figure 12 that shows the
2008). Some of the key functional and quality traits for dough rheology and bread quality associated with wheat from
bread-making are displayed in Figure 12. various origins; Kazakhstan, Ukraine, Russia and Australia.
Grain quality and dough-rheological parameters are indicators of
the end product functionality. For example, wheat with protein
content above 13% will usually make better bread than wheat
with only 10% protein and softer white wheat around 10.5%
protein will usually make better udon noodles than hard wheat
at 13%.
Price sensitive Quality sensitive
Continuum
Loaf volume Crumb softness
Loaf symmetry
Figure 11
Price/quality sensitivity continuum
The growing consumption of bread and baked goods in Indonesia: an opportunity for Australian wheat 25Flour protein (%, 14% mb)
14
12
(%)
10
8
6
Water absorption (%)
66
64
62
60
(%)
58
56
54
52
Sponge and dough sp. volume (ml/g)
6.0
5.5
Volume (ml/g)
5.0
4.5
4.0
3.5
3.0
No-Time dough sp. volume (ml/g)
5.5
5.0
Volume (ml/g)
4.5
4.0
3.5
3.0
Figure 12
Kazakhstan 1
Kazakhstan 2
Ukraine 1
Ukraine 2
Ukraine 3
Ukraine 4
Russia 1
Russia 2
Russia 3
Russia 4
APH
APW
AH
ASW
Baking performance —
Australian wheat
v Black Sea wheat
Source: AEGIC
26 The growing consumption of bread and baked goods in Indonesia: an opportunity for Australian wheatFigure 12 illustrates some of the complexity of the relationship Although prices are positively correlated with protein, the
between protein and baking performance. correlation is not perfect and other factors contribute to
explaining the differences in prices. In Figure 13 the protein
Looking at the Australian grades (APH, APW, AH, ASW — in
content at an equivalent moisture basis is plotted against an FOB
orange) in isolation, there is a reasonably strong positive
price for each origin. The trend line on the chart indicates the
correlation between protein content and water absorption
expected price as a linear function of protein. So, although
inasmuch as APH and AH have the highest protein content and
Australian grades have lower protein than North American, EU
the best water absorption. However, perhaps more tellingly,
and Black Sea milling grades, they also importantly sit above the
despite containing more than 20% extra protein, the APH and
trend line, indicating there is a willingness to pay for quality,
APW wheats used in this study by AEGIC have roughly similar
above the pure value of the protein content of these wheats. This
water absorption.
suggests there is already an awareness that protein content is
Looking across all the wheat samples in Figure 12, protein not a sole accurate measure of the utility of Australian wheats.
content appears to be a poor indicator of baking performance.
Some useful observations and implications flow from Figure 13:
This is most notable in the Kazakhstan samples, which, despite
having higher than average protein content, have poor water • North American high protein grades attract a premium over
absorption and loaf volume. Perhaps the single most interesting all other grades. However, grades from other origins at a
comparison is between the ‘Kazakhstan 1’ sample and the ASW range of protein levels do not attract prices solely
sample from Australia. Despite having 3% less protein content, attributable to their protein level. For example, over the
ASW achieved 2% better water absorption, roughly similar period 2015-2019 Black Sea milling wheat at around 11.1%
sponge and dough (SD) volume and 20% greater rapid dough protein traded at a discount of around $20 to APW-F, which
(RD) volume. contained only 10.5% protein.
So, why are such findings of relevance and importance for • Canadian wheat (CWRS) traded at a significant discount to
Australian wheat? Australian wheat is unlikely to prevail in any American DNS, despite both having roughly the same protein
‘highest protein wins’ scenario against Black Sea wheat, which is content.
produced on rich, black, highly fertile chernozem soil. Similarly,
• DNS, used primarily for baking, attracted a premium of
protein comparisons between Australian wheat and North
$40-$50 over Australian APW.
American grades such as DNS see Australia lagging well behind
in the protein content stakes. Therefore, the prospect for use of • To generate the very high premiums requires either producing
Australian wheat in the Indonesian and wider Asian bread wheats with protein levels between 13.5% and 14% or
markets hinges on Asian end-users having accurate and producing elite baking wheats that perform similarly to such
adequate technical knowledge about how best to use Australian high protein wheats, yet which have lower protein levels.
wheat for baking. Hence, continuously
demonstrating to potential end-users that
lower protein Australian wheats can have
equivalent baking performance to some 100
higher protein wheats can be an
expensive yet sound investment by the 90 DNS-14G
Australian wheat industry. Fortunately, 80
Price spread to Black Sea
DNS-14P
despite some long-held views, market
feed wheat ($USD)
70 APH-B DNS-13.5
indicators are emerging of a willingness to
pay for performance rather than solely for AH-F
60 CWRS-Stl
protein superiority. CWRS-V
50 APW-PA
ASW-PA APW-F DNS-14L
40 ASW-F
SW HRW
30 ARG EUB
20 SRW EU1
EUF BSM
Figure 13
Protein content and FOB price difference 10
BSF
to Black Sea feed wheat ($USD) for the 0
period 2015–2019. Based on data from the 8 9 10 11 12 13 14 15
International Grains Council (2019).
Protein content @ 11%mb
Note: the acronyms near each point describe
the type of wheat being sold (e.g. BSF = Black
Sea Feed wheat; EUF = European Union Feed Australia North America EU Black Sea + South America
wheat)
The growing consumption of bread and baked goods in Indonesia: an opportunity for Australian wheat 27Bread wheat in Indonesia — functional 4. Wet gluten
requirements Both quality and quantity are important when looking at wet
gluten numbers. Wet gluten content is strongly influenced by
Grain quality and dough-rheology are essentially a means to an environmental and seasonal factors and is closely correlated
end, so understanding what quality and functional traits for with the protein content of the wheat grain. When water is
baking are most sought after by end-users is important to added to wheat flour most of the proteins in the flour
understand (e.g. Dowell et al., 2008). These main traits, in hydrate to form gluten. In bread-making, strands of gluten
descending order of importance for Indonesian bread-making, are: form a network that traps air bubbles produced through
fermentation that then allows the dough to rise.
1. High protein (relative to noodle wheat in
particular) 5. Water absorption
Protein content is an important measure because, unlike Water absorption differs from the other drivers as it is largely
dough-rheological data, protein content can be quantified at a commercial issue, rather than a technical or end-product
the grower’s point of delivery, via an NIR (near infrared) quality factor. Just as milling yield determines how much
machine. Protein content is a key indicator of likely flour can be produced (and sold) from a given quantity of
functional performance. However, because the correlation wheat, so water absorption is a key determinant of the
between protein content and baking performance is volume of bread that can be produced from a given quantity
imperfect, protein content can function as a useful initial of flour.
filter, but in isolation is insufficient as reliable indicator of
likely baking performance. 6. Loaf symmetry
Like most food products, the consumer has an idealised
Protein content is important for processors for several
image of the perfect bread loaf, which will invariably be
reasons, and in particular, the relationship between protein
symmetrical. All things being equal, consumers therefore
content and end-product texture. Generally-speaking, for
loaves that are not misshapen. Loaf symmetry depends on
Asian noodles, higher protein means firmer texture. This is
gluten quality and wet gluten content (see #4).
why APH is valued for its ability to produce elite yellow
alkaline noodles (YAN) such as ramen, which are relatively 7. Crumb texture
firm, while soft white noodles (Udon) typically require
Crumb texture is one of the most important sensory
relatively lower protein levels. Similarly, soft, fluffy cakes
attributes. It is a measure of softness that is determined by
generally require even lower protein content. In terms of
bread-cell measures such as the number, shape, size and
baking, higher protein is associated with better dough
thickness of each cell within the loaf. Crumb texture is only
stability and therefore, better end-product appeal.
partly driven by wheat quality traits, as bakery processing
Protein content is also a useful indicator of likely milling methods can affect crumb texture.
properties, as higher protein wheat tends to be easier to grist
The above-mentioned wheat quality requirements of the
at the milling stage. Softer wheats can ‘fluff’ up and cause
Indonesian bread market need to be placed in historical context.
blockages in milling.
In Indonesia, large-scale industrial bread makers rely on the
2. Dough strength sponge and dough (SD) process that involves a fermentation
stage for sponge mixing, followed by a dough-mixing stage.
Dough strength is a critical component of end-product
Bread made using the SD process is widely regarded as having
composition, shape and texture, particularly for long
superior quality characteristics such as softer crumb and better
fermentation baking methods such as sponge and dough
shelf-life. However, the reasons why this process is used widely
(SD), which are common across much of Asia. Baking in
in Indonesia are not solely related to end-product quality.
general typically requires stronger dough than noodles.
Historically, Indonesian industrial scale bakers have favoured
3. Dough stability this bread-making process for two main reasons. Firstly, after
World War II, the Indonesians had ready access to abundant,
Dough stability indicates the time required for the mixed
stable supplies of North American wheat grades that required
dough to form its maximum consistency and is often a useful
use of the SD process. Those reliable supplies of wheat
indicator of dough strength. Stability of a dough indicates its
supported the growth of bread production in Indonesia.
tolerance to over- or under-mixing. A good quality dough has
Secondly, the US Wheat Associates and similar Canadian
a stability of 4 to 12 minutes. For industrial dough mixing too
organisations provided strong technical and educational support
short or too long mixing times are not desirable.
for the use of North American wheat grades in bread-making.
Millers’ familiarity and competence in using these North
28 The growing consumption of bread and baked goods in Indonesia: an opportunity for Australian wheatYou can also read