Evolution of networks of protein domain organization - Nature
←
→
Page content transcription
If your browser does not render page correctly, please read the page content below
www.nature.com/scientificreports
OPEN Evolution of networks of protein
domain organization
M. Fayez Aziz & Gustavo Caetano‑Anollés*
Domains are the structural, functional and evolutionary units of proteins. They combine to form
multidomain proteins. The evolutionary history of this molecular combinatorics has been studied
with phylogenomic methods. Here, we construct networks of domain organization and explore
their evolution. A time series of networks revealed two ancient waves of structural novelty arising
from ancient ‘p-loop’ and ‘winged helix’ domains and a massive ‘big bang’ of domain organization.
The evolutionary recruitment of domains was highly modular, hierarchical and ongoing. Domain
rearrangements elicited non-random and scale-free network structure. Comparative analyses of
preferential attachment, randomness and modularity showed yin-and-yang complementary transition
and biphasic patterns along the structural chronology. Remarkably, the evolving networks highlighted
a central evolutionary role of cofactor-supporting structures of non-ribosomal peptide synthesis
pathways, likely crucial to the early development of the genetic code. Some highly modular domains
featured dual response regulation in two-component signal transduction systems with DNA-binding
activity linked to transcriptional regulation of responses to environmental change. Interestingly,
hub domains across the evolving networks shared the historical role of DNA binding and editing,
an ancient protein function in molecular evolution. Our investigation unfolds historical source-sink
patterns of evolutionary recruitment that further our understanding of protein architectures and
functions.
The biological functions of genes manifest through the proteins or functional RNA molecules they encode. In
evolution, novel functions appear when genes produce new genes by duplication, mutation, recombination,
fusion and fission, or when genes are generated de novo. Research has attempted to quantitatively describe the
origins of these processes of molecular diversification and how they increase molecular complexity over the
course of evolution, for instance through pathways of protein domain organization1,2. Protein domains are struc-
roteins3–5, sometimes in unusually complex a rrangements6,7.
tural and functional units of evolution that make up p
They fold into compact 3-dimensional (3D) atomic structures that arrange alpha-helical and beta-sheet structure
elements into tightly packed conformations of the polypeptide chain8. The Structural Classification of Proteins
(SCOP)9 and its extended version S COPe10 are popular taxonomy gold standards of domain structure. SCOP
definitions can be used to scan genome sequences for motifs of domains and study how they combine in p roteins6.
In SCOP, the structure of domains exhibiting similar 3D arrangements of secondary structures and thus identi-
cal topologies have been classified as folds (F)9. Within folds, protein domains whose structure and functional
features indicate a common evolutionary origin are further grouped into fold superfamilies (FSF). These FSFs
sometimes hold multiple evolutionarily related families, which unify domains with pairwise amino acid identities
of more than 30% (Supplementary Fig. S1A). As of March 9, 2021, 276,231 annotated SCOPe domains populate
the 175,282 protein structures of the Research Collaboratory for Structural Bioinformatics Protein Data Bank
(RCSB-PDB). We note that the cornerstone of the SCOP domain hierarchy is common ancestry, i.e. the existence
of shared-and-derived features in domain sequence, structure and function. Homology is also central to many
other domain taxonomies, including CATH11, CDD12, ProDom13, Pfam14, and the meta-database InterPro15. Most
databases benefit from machine learning. For example, SCOP and Pfam depend on the identification of conserved
regions in protein sequences through sequence alignment and background knowledge, which are then used to
build probabilistic hidden Markov models (HMMs) of linear sequence analysis. For example, SCOP uses HMMs
of structural recognition to recurrently enrich the d atabase16 in a framework that increases alignment-quality
and stability of family and superfamily relationships. A similar framework drives the Pfam database but focuses
exclusively on sequence information. One difficulty is that not all domains fold into discrete structural entities
within the space of possible folds17. Some popular domains overlap within a continuum. This ‘gregariousness’
complicates domain classification, demanding the exploration of super-secondary structural motifs as candidate
lower-level units of structure, function and evolution18.
Evolutionary Bioinformatics Laboratory, Department of Crop Sciences, University of Illinois, Urbana, IL 61801, USA.
*
email: gca@illinois.edu
Scientific Reports | (2021) 11:12075 | https://doi.org/10.1038/s41598-021-90498-8 1
Vol.:(0123456789)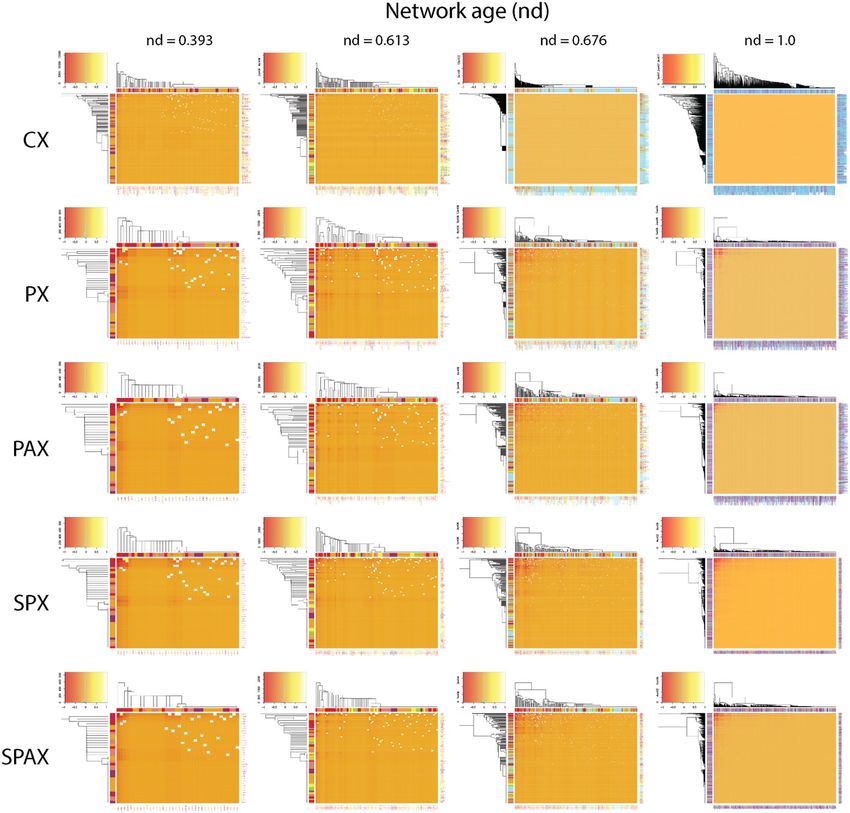
www.nature.com/scientificreports/
Domain structures appear repeatedly in the protein molecules, singly or in combination with other domains7.
More than two-thirds of protein sequences are longer than an average domain length, a vast majority of which
are multidomain proteins19. A study of protein structures in 749 genomes showed that the lengths of orthologous
protein families in Eukarya were almost double the lengths found in Bacteria and A rchaea20. This variance among
lengths results from shorter prokaryotic nondomain sequences that link domains to each other in proteins and
have evolved reductively in prokaryotes but not in eukaryotes. The arrangement of domains along the sequence
of multimeric proteins is referred to as ‘domain organization.’ Both the structure and organization of domains,
which have been collectively termed protein domain ‘architecture’, are considered far more evolutionarily con-
served than protein s equence7,21–23. In addition, some domain combinations make up functional units that recur
in different protein contexts24. They have been termed supradomains (Supplementary Fig. S1B). Thus, domains
and supradomains behave as modules, parts that interact more often with each other than with other parts or
modules of the system.
Comparative genomic approaches allow to study the modular landscape of domain organization. For example,
the evolutionary placement of domains in multiple architectural contexts can be quantified by counting distinct
neighbors25, domain adjacencies26, or consecutive domain triplets27 in proteins. These measures of ‘versatility’,
‘promiscuity’ or ‘mobility’ (reuse) of domain building blocks depend on both domain size and abundance. Smaller
domains are more likely to be used in multidomain proteins and are therefore more m obile27,28, an observation
supported by a Menzerath-Altmann’s law of domain organization driven by an economy of scale29. Similarly,
highly abundant domains appear more versatile, prompting abundance-based normalization of domain versatil-
ity measurements when studying intrinsic combinatorial properties and variation across lineages and biological
functions30–32.
In order to retrace past events in architectural evolution, statements of history (phylogenies) proposed directly
from genomic data must be used to build chronologies of first evolutionary appearance of domains and domain
architectures. Unfortunately, protein sequence has limited power in deep retrodictive exploration7,21–23. Fur-
thermore, while structure is conserved over longer evolutionary timescales, a general metric for global pairwise
comparison of structures does not yet e xist33. Thus, the systematic classification of protein structure has been
unable to unify the widely divergent folded structures at any level of abstraction (e.g. FSFs in a ‘galaxy’ of f olds34),
likely because different neighborhoods in protein sequence space contain different structures and f unctions35.
Construction of a ‘periodic table’ of idealized structural representations of f olds36 has not alleviated this difficulty
due to an absence of rules of structural transformation that would explain the comparative framework. Numerous
efforts to dissect the evolution of domain architectures have recently been r eviewed37. To overcome limitations
and produce global evolutionary views of the protein world, the focus shifted from molecules to proteomes. Trees
of proteomes were first reconstructed from a proteomic census of structural domains (beginning with ref.38), and
were later used to trace character-state changes along their branches to establish possible domain origins39,40.
This approach, however, was restricted to domain structures and architectures appearing after the common
ancestor of the proteomes surveyed in the trees. A much more effective way to create truly global chronologies
of the protein world was the reconstruction of phylogenomic trees of domain organization (beginning with
ref.41). These phylogenies take advantage of powerful serial homologies defined by the proteomic abundance
of domains42 or architectures7,43 defined at F and FSF levels. Phylogenomic trees of domain structures helped
uncover the natural history of biocatalysis by tracing chemical mechanisms in enzymatic r eactions44, analyze the
optimization and increase of protein folding speed derived from a flexibility-correlated factor known as contact
order (the average relative distance of amino acid contacts in the tertiary structure of proteins)45, and study the
history of an ‘elementary functionome’ with a bipartite network of elementary functional loop sequences and
structural domains of p roteins46. This last study revealed two initial waves of functional innovation involving
founder ‘p-loop’ and ‘winged helix’ domain structures, and the emergence of hierarchical modularity and power
law behavior in network evolution. Phylogenomic trees of domain architectures and their associated chronolo-
gies of molecular accretion showed that architectural diversification evolved through gradual accumulation of
domains (singly occurring domains), domain pairs (two different domains), multidomains (numerous domains,
with occasional repetition) and domain repeats (domains of one type that are repeated)7. The diversification
began with a few single-domain architectures earlier in the timeline, followed by an increasing rate of accretion
that culminated in a massive “big bang” of domain organization. The accumulation of architectures continued
to date but with a decreasing rate7,46.
Here, we explore the evolving interactome of protein domain organization. We generate a chronology that
captures the historical development of domain and multidomain interactions with a graph theoretical approach6
of time-varying (evolving) network structure. The chronology was calibrated with a molecular clock of protein
structures, which transforms times of origin of domain architectures into geological timescales of billions of
years (Gy)47. Five distinct composition- and topology-based ‘operative’ criteria of connectivity defined nodes
and links of the evolving networks. This strategy identified connectivity distributions in a series of 169 growing
networks, hubs of evolutionary recruitment acting as donors and acceptors, and structural adaptations of evolving
networks to modular, random and scale-free properties. In particular, we discover a pattern of connectivity driven
by fusions and fissions, respectively, with densely linked older and younger architectures from the evolutionary
timeline sandwiching a period of sparse connectivity. This supports a biphasic or hourglass pattern previously
observed in protein e volution48 and follows a model of module e mergence49. We thus reveal remarkable patterns
of emergence of hierarchy, modularity and structural cooption in evolving networks.
Scientific Reports | (2021) 11:12075 | https://doi.org/10.1038/s41598-021-90498-8 2
Vol:.(1234567890)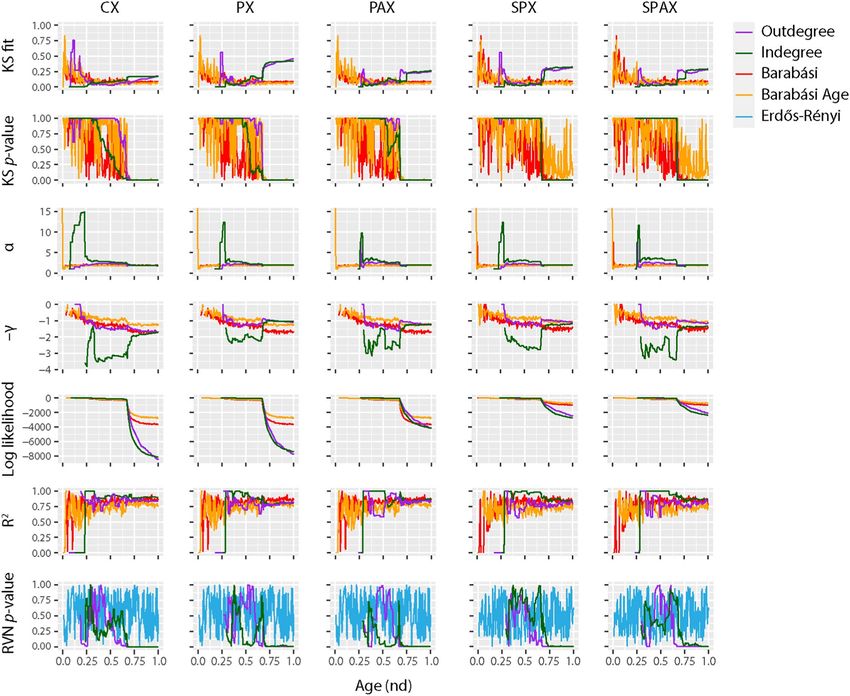
www.nature.com/scientificreports/
Results and discussion
Construction of evolving networks. We build a time series of networks of domain organization embed-
ding evolutionary information derived from the sequence and structure of millions of protein sequences encoded
in hundreds of genomes. The goal is to unfold the history of how single-domain and multidomain proteins share
domain make-up and how recruitment processes shape protein evolution. An ‘entity set’ of domains, suprado-
mains, and multidomains were first extracted from the genomic census of fold structure and domain organiza-
tion. This set of component parts of proteins, mostly recurrent, defined the nodes of the networks, which were
labeled with concise classification strings (ccs) describing SCOP domain constituents (Fig. 1A). We define supra-
domains as sub-combinations of domains that appear in the census and are often used as evolutionary building
blocks of multidomains. The definition is more inclusive than that of ref24.
The growing interactions among contemporary architectures are constrained by domain make up and domain
arrangement in the protein chain. These evolving interactions were captured with five different operative criteria
for timed network generation defined by composition, pairwise occurrence, adjacency, and splicing of domain
parts in a protein molecule, where: (1) composition describes makeup (component parts) of the molecular whole;
(2) pairwise occurrence describes appearance of parts in sets of two; (3) adjacency refers to their geometrical or
spatial arrangement (topology); and (4) splicing refers to the rearrangement of parts by operations of joining and
excision that decompose structures (Fig. 1B). The Composition Network (CX) linked domain and supradomain
to multidomain nodes (in a partially bimodal fashion) when proteins shared compositional makeup. The Pairwise
Network (PX) connected domain to supradomain nodes when components occurred in pairs in a protein. The
Pairwise Adjacency Network (PAX) connected domain to supradomain nodes when components occurred in
pairs that were adjacent. The Spliced Pairwise Network (SPX) linked domain nodes to each other when their
pairs were present in domain-spliced proteins. Lastly, the Spliced Pairwise Adjacency Network (SPAX) linked
domain nodes to each other when their adjacent pairs were present in the domain-spliced proteins (Fig. 2).
Finally, we mapped the time or origin (age) of individual architectures onto the nodes of networks built using
these five operative criteria (Supplementary Fig. S2). We did so for each of the 169 time-events of the timeline.
Network construction has been illustrated with connectivity details of the most ancient domains (Supplementary
Fig. S3) and further described in Sect. 1 of Supplementary Text. Networks showcased time directionality, con-
nectivity distributions, and network layouts:
1. Time Directionality Mapping ages onto networks helped follow their evolutionary growth, as nodes and
links accumulated over time since the origin of proteins to the present. The timeline of networks imposed
a time directionality on network links, making them arcs (directed edges with arrows pointing from older
to younger nodes) of directed graphs (Fig. 1C). The ages of arcs were borrowed from the youngest of the
component nodes involved in a link (Supplementary Fig. S3B).
2. Degree Distributions The number of links connected to a node define that node’s ‘degree’. The degree dis-
tribution is a ‘composability’ attribute of a network and the entity set represented by its nodes, a design
principle describing the inter-relationship of components of a system. In network evolution, the appearance
of a new node may trigger establishment of one or more arcs from existing (older) nodes. Furthermore,
outdegree describes the number of outward links and indegree the number of inward links from a node. As
the timeline progresses, older nodes gain higher outdegrees as compared to the higher indegrees of recent
nodes (Fig. 1C), polarizing the network with arcs depicting ‘arrows of time’ (Supplementary Figs. S2 and
S3). The chronological appearance of architectures (domains, supradomains and multidomains) as network
connectivity expands along the timeline causes degree to accumulate in the evolving networks (Fig. 2).
Multiple interactions of nodes along the timeline diversified connectivity, a feature captured and quantified
by weighted degree. Interestingly, box-and-whisker’s plots of weighted outdegree and indegree demonstrate
bimodal degree distributions typical of biological systems49,50 (Supplementary Fig. S4). The yin-yang patterns
of contractions and expansions of architectural innovation are evident from the distributions of modern
outdegrees and indegrees (Supplementary Fig. S5). In particular, the cumulative outdegree and indegree
scattergrams demonstrate an hourglass (or bimodal) pattern of linkage development unfolding in evolution
(Supplementary Fig. S6).
3. Time Event-based ‘Radial’ and ‘Waterfall’ Layouts The growth of a network evolving at discrete temporal
intervals can be modeled with Discrete Event Simulation (DES) t ools51–53. Borrowing the DES rationale, we
modeled the evolution of directed networks of domain organization with time flowing from one event to
another as discrete evolutionary ‘time steps’, typical of a step function. The progression of events was visual-
ized with two types of layouts, a vertical representation we coined ‘waterfall’ layout that had nodes arranged
top-down by age and a concentric ‘radial’ representation of growing networks that unfolded time-events of
protein evolution from center to periphery (Fig. 1C). Network clusters comprising of hubs and their cohe-
sive neighbors were segregated to improve differentiation along the horizontal axis. The waterfall and radial
layouts made evolutionary recruitment evident as time events progressed downward or outward, respectively
(Figs. 2 and 3).
Early history of modern domain organization. The accumulation of links connecting domain, supra-
domain and multidomain proteins in evolving CX, PX, PAX, SPX and SPAX networks played back the compli-
cated history of domain recruitments that drive the evolution of domain organization. Figure 2 shows networks
in radial layout at representative time-events defining boundaries of the three epochs of the evolving protein
world (‘architectural diversification’, ‘superkingdom specification’ and ‘organismal diversification’, sensu7,42). Net-
works grew in time and became increasingly complicated tangles, massively expanding after a “big bang” of
Scientific Reports | (2021) 11:12075 | https://doi.org/10.1038/s41598-021-90498-8 3
Vol.:(0123456789)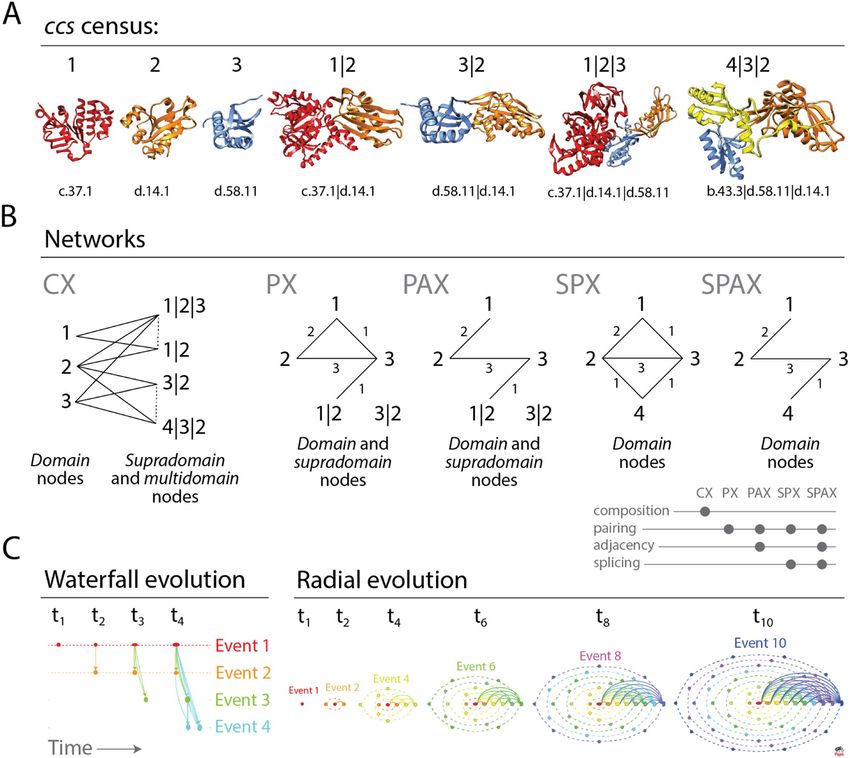
www.nature.com/scientificreports/
Figure 1. Networks of protein domain organization. (A) The genomic census of structural domains and their
combinations defines SCOP concise classification string (ccs) descriptors of domains, supradomains and multidomains
that are building blocks of networks. We illustrate the census with a sample from the entire entity set, comprising
of 3 domains (1, 2 and 3), 2 supradomains (1|2 and 3|2) and 2 multidomains (1|2|3 and 4|3|2) that are common
in dehydratase enzymes and elongation factors. ccs identifiers of structural domain constituents defined at fold
superfamily (FSF) level are listed below the atomic models visualized in ribbon format with Chimera. (B) Five
operative criteria for network generation capture the interactions among protein architecture nodes as networks grow
in evolution. CX is a partial bipartite network (projection-decomposable) that connects domain nodes to supradomain
and multidomain nodes (which can connect to each other; hatched links) when present in multidomain proteins. PX
connects domain and supradomain nodes when multidomain proteins are ‘decomposed’ into pairs of architectures,
regardless of topological constraints. PAX borrows the PX criterion but respects topological constraints. SPX connects
domain nodes spliced from architectures when domain pairs are present in proteins. SPAX connects domain nodes
when adjacent domain pairs are present in proteins. (C) Chronological development of evolving networks. In ‘waterfall
evolution’ layout, time progresses from left to right as ‘discrete events’ of network evolution progressively unfold the
appearance of nodes and links (time-directed arrows known as arcs) from top to bottom, colored according to their
age. Arc multiplicities describe link cardinality. Source-sink recruitments of architectures are visualized by horizontal
and vertical elongations of node symbols, which describe their outdegree and indegree, respectively. As networks grow,
the symbols of older nodes widen by outdegree accumulation, while those of younger nodes grow tall by indegree
accumulation. In ‘radial evolution’ layout, the time-variant network grows by accumulating nodes in concentric rings
(orbitals), each reflecting a time event. We illustrate radial evolution with 6 snapshots of a network growing to a size
of 55 nodes as it unfolds from time t1 to t10. Nodes (n) in orbitals (r) grow at r + 1 rate and only one node per orbital
connects to single nodes in each of the other orbitals. Thus, outward links (o) of an orbital are o = t–r–1, where t is the
current time. Inward links (i) of an orbital are i = t–o–1 = r. Finally, total links of a network at any time are t(t − 1)/2. The
width and height of symbols represent the outdegree and indegree of nodes, respectively. Symbol sizes are shifted by 10
for a better visualization of nodes.
Scientific Reports | (2021) 11:12075 | https://doi.org/10.1038/s41598-021-90498-8 4
Vol:.(1234567890)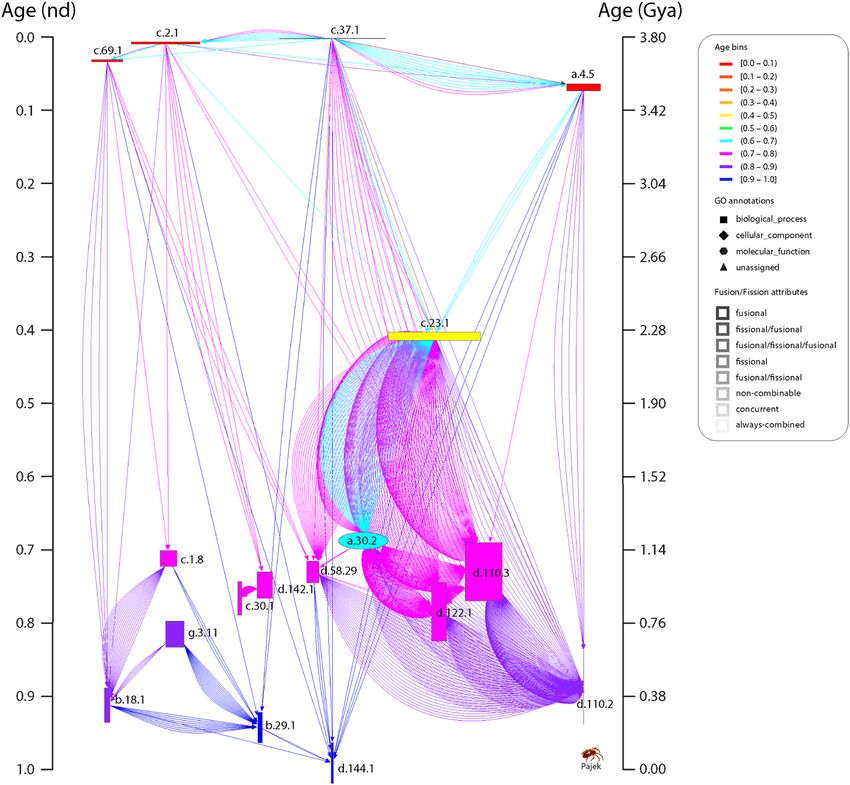
www.nature.com/scientificreports/
domain combinations during the organismal diversification epoch. Movies described the evolutionary growth
of these networks (Supplementary Video 1).
To illustrate the versatility of the waterfall visualization strategy, we dissected the early origin of proteins with
the SPX network. Two major waves of structural innovation arising from ancient ‘p-loop’ and ‘winged helix’
domains were observed in the waterfall diagrams of a highly connected (reduced) subnetwork visualization of
the SPX network (Fig. 3), matching similar recruitment waves observed in the study of evolutionary networks of
elementary functionomes46 and m etabolites54. Waves originated in primordial α/β/α-layered sandwich, β-barrel
and helical bundle structures identified in an earlier structural phylogenomic study as part of the most ancient 54
protein domain families55. However, most of the connectivity of these major pathways was established during the
organismal diversification epoch less than 1.5 Gy ago (nd ≥ 0.6) and hence was fully developed relatively recently
in evolution. The ‘p-loop’ and ‘winged helix’ waves embedded the major gateways of enzymatic recruitment we
previously reported for metabolism54. The first gateway was mediated by the c.37 P-loop hydrolase fold and
originated in the energy interconversion pathways of the purine metabolism subnetwork. The second pathway
was mediated by the a.4 winged helix fold and originated in the biosynthesis of cofactors and the metabolic sub-
network of porphyrin and chlorophyll54,56,57. The congruent realization of these evolutionary patterns with data
sources of different types is remarkable (Supplementary Video 2). It strongly supports the historical statements
we propose. Further information can be found in Sect. 2 of Supplementary Text.
Network analysis of cooption mechanisms of recruitment. The networks of domains (SPX and
SPAX) elicited 161 unique time-events along the evolutionary timeline, out of a total 169 events expected for
networks of domains, supradomains and domain combinations (CX, PX and PAX) (Supplementary Tables 1–5).
The node and connectivity distributions among the time-event bins of the evolving networks highlight the wide-
spread, growing and recurrent combinatorial recruitment process that incorporates domains and their combi-
nations into protein scaffolds and drives structural evolution (Fig. 2). Indeed, the largest hubs representing the
most popular domains in the highly connected SPX subnetwork appeared not only early in evolution but also
in the modern protein world (Fig. 3). Similar to the evolution of elementary functions46, domain innovation
also developed early during the first ~ 1.8 Gy of protein history (Fig. 3). The combinatorial recruitment process
however spanned the entire timeline (Supplementary Fig. S2). In terms of origins, the first donor and acceptor
composition event occurred in protein evolution with the appearance of a link in the CX network connecting
domain c.2.1 to domain combination c.2.1|a.100.1, ~ 3.54 Gya (nd = 0.069). The first donor and acceptor pair
occurred in the pairwise PX and SPX networks ~ 3.12 Gya (nd = 0.179), ~ 0.42 Gy later (Δnd = 0.11). The pairing
event involved domains c.37.1 and d.14.1. The first adjacent donor and acceptor pair of the adjacency-based
PAX and SPAX networks appeared ~ 2.90 Gya (nd = 0.237), ~ 0.22 Gy later (Δnd = 0.06). The adjacently paired
nodes were domains c.37.1 and c.23.16. These observations highlight a remarkable tendency of domain organi-
zation to gradually but recurrently constrain pairwise occurrences in multidomain proteins. The evolutionary
history of donors and acceptors of domain organization is hence associated with a highly optimized process of
cooption. To explore this combinatorics, we first dissected the network connectivity with bar plots that describe
the chronological accumulation of links along the evolutionary timeline (Supplementary Fig. S7). This made
general patterns quantitative and source-sink relationships explicit. Second, we analyzed the per unit donor/
acceptor ratio in the evolving networks to highlight pairwise cooption and composability, respectively (Supple-
mentary Fig. S8). Specifically, domain acceptors (represented by network indegree) of SPX increased in number
to a global average of 8.63 (± 0.15) sinks per domain in evolution. Domain donors (represented by network
outdegree) of SPX reached a higher global average of 9.7 (± 0.56) sources per domain, indicating significant reu-
tilization of relatively ancient domains. In contrast, the average number of donors and acceptors in the evolving
CX network plateaued at 3.41 ± 0.34 sources and 3.43 ± 0.05 sinks per domain/multidomain, respectively. This
showed uniform source/sink evolutionary rates as proteins acquired higher composability with time. Third, an
inferential analysis of cooption-based source-sink relationships maturing at modern times revealed an inde-
pendence of patterns from the selected network generation criteria (Supplementary Fig. S9). Primarily, the com-
position events yielding source domains and supradomains were dominant, with the number of events almost
doubling in the CX network from the origin to the organismal diversification epoch ~ 1.5 Gya (nd = 0.6). How-
ever, the pairwise cooption events of the SPX domain network, e.g., doubled in number and reached relatively
comparable levels in evolution only after delays of ~ 0.6 Gy (Δnd = 0.15) and ~ 2.1 Gya (nd = 0.75), respectively.
Moreover, the number of cooption events yielding sink domains in SPX almost tripled by the beginning of the
organismal diversification epoch. In contrast, the number of CX sinks reached that level only halfway along
that evolutionary epoch. These divergent patterns indicate a frustrated dynamics of network growth. The early
adoption of composability of domains and supradomains in multidomains seems to have preceded the pairwise
cooption of domains in protein history, leading to the numerous recruitment pathways of the modern protein
world. A discussion on the source-sink relationships impacted by domain fusion and fission processes can be
found in Sect. 3 of Supplementary Text.
Hubs in network evolution. Network hubs are at the heart of network connectivity and could chaperone
network evolution26. We ranked modern domains and domain combinations of age nd = 1 as hubs based on the
99.9th percentile of indegree and outdegree. Hubs were annotated with domain organization attributes, including
SCOP domain descriptions, age, fusional/fissional information, and GO terms. We also associated hubs with age
ranks reflecting their order of evolutionary appearance in the timeline.
The most notable donor hubs for all networks types were the carrier protein domains e.23.1, a.28.1 and c.69.1,
which are involved in Non-Ribosomal Peptide Synthesis (NRPS), whether directly or indirectly through other
pathways (Table 1). These domains diversified later in evolution yielding cofactor-binding molecular switches
Scientific Reports | (2021) 11:12075 | https://doi.org/10.1038/s41598-021-90498-8 5
Vol.:(0123456789)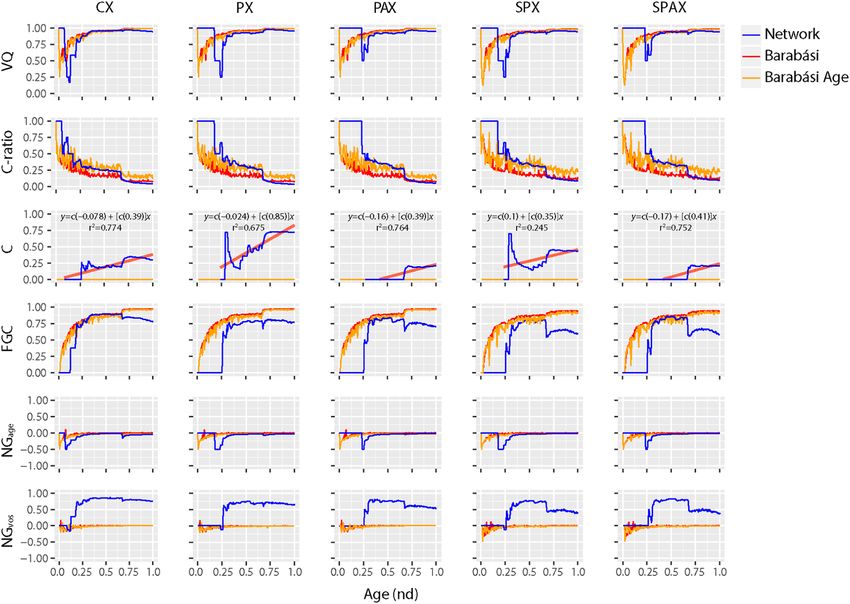
www.nature.com/scientificreports/

          Scientific Reports |   (2021) 11:12075 |   https://doi.org/10.1038/s41598-021-90498-8   6

Vol:.(1234567890)
www.nature.com/scientificreports/
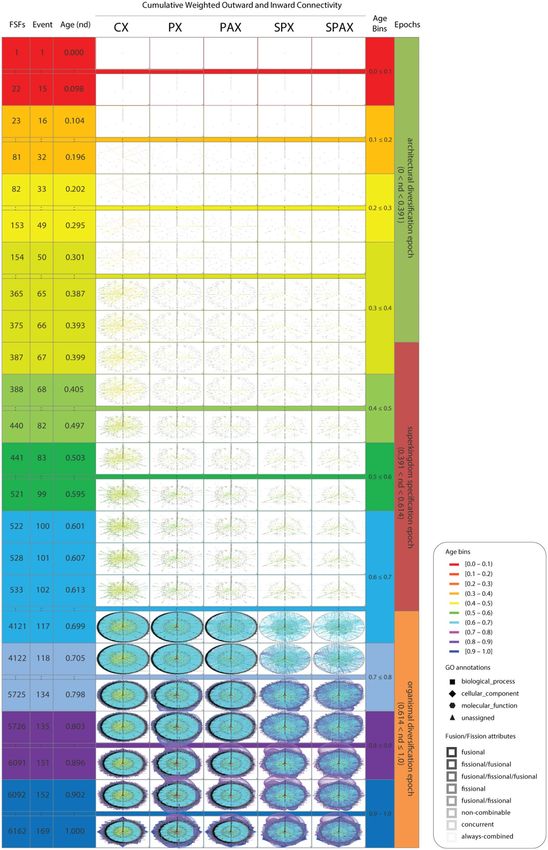
◂Figure 2. Evolving networks in radial evolution layout. Snapshots of network growth describe the evolution
of 6162 domain, supradomain and multidomain architectures or 1643 domains spliced from them. They
represent 24 out of 169 time events of the evolutionary timeline, which are indexed with evolutionary age (nd,
ranging from 0.0 to 1.0), age bin (one of 10), and one of the 3 epochs of protein evolution 42. Age bins were
custom RGB color-coded to highlight the flow of time, from top to bottom. The evolving CX, PX, PAX, SPX and
SPAX networks reveal the gradual evolutionary accumulation of nodes and links. The sizes of the horizontal
and vertical axes of the node symbols depict outward and inward weighted connectivity, respectively, with all
weighted degree vectors shifted by 10 for visualization and inclusion of 0-degree nodes. The curved arcs describe
recurring interactions between architectures that are accumulating along the successive events of the timeline.
Arcs symbolize the flow of time from ancient to recent architectures and are color-coded according to the age
of the more recent of the component nodes involved; arcs between contemporary nodes are excluded. Since, in
pairwise networks the age of the most recent parent node could be assigned to the arc, the connectivity-defining
pairing events are absent in the first (red) and the first and second (red, orange) bins of the PX and SPX and the
PAX and SPAX networks, respectively. The angles of multiple arcs emerging from nodes are incremented by
2 to avoid overlap. Node RGB colors represent age. Grey-scale color of node borders depict fusional/fissional
properties. Node shapes describe GO categories. High-resolution figures and Pajek network files are available at
https://github.com/gcalab/SciRep.
and barrel s tructures55. Ancient NRPS pathways of domain accretion have been associated with a model that not
only described stabilization and decoration of membranes by primordial alpha-helical bundles and beta-sheets,
but also explained primordial protein synthesis and genetic code specificity chaperoned by ancient forms of
aminoacyl-tRNA synthetase (aaRS) catalytic domains and NRPS modules. NRPS even preceded the emergence
of the ribosome, acting as scaffold for nucleic acids and the modern translation function. In particular, the PX
and PAX networks highlight the central evolutionary role of these novel emerging cofactor structures in the
NRPS pathways. Thus, our findings made explicit that our connectivity criteria of generating networks of domain
organization were at the cornerstone of the early development of genetic code and supported the evolutionary
model of early biochemistry based on phylogenomic information and network structure.
Domains c.30.1, b.1.1, d.142.1 and g.3.11 (0.723 < nd < 0.977) were the most prominent acceptor hubs
(Table 2). These structures are integral parts of two-component signal transduction systems that are common in
microbes. The highly modular domains feature dual response regulator proteins involved in the two-component
signal transduction system comprising of an N-terminal response regulator receiver domain and a variable
C-terminal effector domain with DNA-binding activity. These proteins are transcriptional regulators in bacteria
and some protozoa, detecting and responding to environmental changes, e.g. nitrogen fixation. These evolving
interactions of microbes with the environment mediated by two-component systems have apparently influenced
the evolutionary process of cooption. Three acceptor hubs that were significant in PX with indegree > 250 (fol-
lowing behind the 99.9th percentile in other networks) were Nucleotide cyclase (d.58.29), Spermadhesin, CUB
domain (b.23.1), and Fibronectin type III (b.1.2) (nd = 0.723–0.809). See Sect. 4 of Supplementary Text for
additional donor/acceptor hub information, and Sect. 5 for cooption events occurring during the ‘big bang’ of
domain organization.
Emergence of preferential attachment in network evolution. Genomic-centric processes such as
duplication, recombination, fusion and fission shape patterns of molecular complexity2. Many of these patterns
can be explained with large ‘scale-free’ networks that grow by following the preferential attachment p rinciple58.
These self-organizing and highly inhomogeneous networks attach links to highly connected hub-like nodes in
a ‘rich-get-richer’ fashion, lacking a characteristic scale, irrespective of the properties of individual nodes or
systems59. This pattern of network expansion, which is remarkably popular in biology60, is sharply distinct from
that of the Erdős–Rényi random network model61,62. In a scale-free network, the probability P(k) of nodes con-
necting with neighboring k nodes (i.e. the ratio of nodes with k links) decays as a power law, P(k) ~ k–γ, with γ
defined as the exponent of power law decay. The frequency distributions of node-connectivity in biomolecular
networks have γ typically ranging 2.1–2.463. Thus, scale-free properties drive degree distributions with heavy
tails, where very few nodes have high degree values.
Our statistical analyses of the featured indegree distributions along the timeline of growing networks uncov-
ered interesting patterns of power law dynamics (Fig. 4). The scale-free patterns were established early on in
protein evolution, primarily evident in the CX composition network. These patterns were remarkably divergent
from evolving networks connected at random (RVN p value > 0.05). While power law behavior generally declined
as the networks evolved (KS p-value < 0.05, α < 2.5), it somewhat sustained after the ‘big bang’ but only in CX and
not in the pairwise networks (KS fit and γ closer to 0 and 2 in CX, respectively). A log linear regression model
of CX produced the highest absolute value for γ of 3.81 among the five networks, which was achieved early
along the evolutionary timeline (nd ~ 0.25). This value of γ was much higher than values reported for metabolic
networks (γ ~ 2.2)60. Remarkably, the γ was maintained at ~ 3 before and after the ‘big bang’, while remaining
at ~ 2 until modern times with a minimum value of 1.7. The other four networks generated primarily with the
pairwise criterion apparently deviated from the power-law behavior, especially after the ‘big bang’. For instance,
the γ of PX and PAX peaked at 2.4 (nd ~ 0.35) and 3.2 (nd ~ 0.38), respectively, slightly later than CX. We also
noted a transition in γ from 2.1 in PX and 2.7 in PAX prior to the ‘big bang’ to 1.6 in both after the big bang,
plateauing at ~ 1 until the present. In the SPX and SPAX networks, γ reached a peak even later in time than PX
and PAX with values of 2.8 (nd ~ 0.54) and 3.4 (nd ~ 0.66), respectively. These values transitioned from 2.4 in
SPX and 2.8 in SPAX from before the big bang to 1.6 and 1.7 after the big bang, respectively, plateauing at ~ 1 in
Scientific Reports | (2021) 11:12075 | https://doi.org/10.1038/s41598-021-90498-8 7
Vol.:(0123456789)www.nature.com/scientificreports/
Figure 3. An extant SPX network in waterfall layout describing the evolution of spliced domains with the
largest (100th percentile) network connectivity. The SPX network of 1,643 spliced domains was reduced with
the restrictive criterion of excluding nodes with combined outdegrees and indegrees ≥ 99% of those of the rest of
the nodes. The set of arcs (arched arrows symbolizing flow of time) was also reduced to pairing events between
domains in the 100th percentile connectivity and excluded those between contemporary nodes. Nodes are
arranged top-down and colored according to age (nd) on a relative 0-to-1 scale that describes evolutionary time
events. Ages are also time-calibrated with a molecular clock of FSF domains, which uses fossils and microfossils,
geochemical, biochemical, and biomarker d ata47. FSF origin is given in billion years ago (Gya). Nodes were
labeled with SCOP ccs domain descriptors. To showcase source-and-sink relationships, node symbol sizes were
scaled proportional to the weighted outdegree and indegree along the horizontal and vertical axes, respectively.
Weighted degrees were scaled as × 2 + 2 to include 0-degree nodes for better visualization. The modular spread of
nodes was based on VOS clustering (see methods). Arcs are color-coded according to the age of the more recent
of the component nodes involved; no arcs were present in the ancient-most age bin (red) of the timeline. Angles
of multiple arcs emerging from nodes are incremented by 2 to avoid overlap.
both the networks. As expected, the average γ based on less representative outdegree of each of the five networks
remained low (1 ± 0.05).
We noticed biphasic patterns when -γ was plotted over network connectivity, with two minima at nd ~ 0.37
and ~ 0.67. Moreover, the scale-free tendency of adjacency networks seemed comparatively higher than that of
networks lacking the adjacency restriction. For instance, the average values of γ for the PAX and SPAX networks
(1.87 ± 0.06 and 2.13 ± 0.07, respectively) were relatively higher than those for the corresponding parent PX and
SPX networks (1.61 ± 0.05 and 1.89 ± 0.06, respectively). This suggests that proximity in amino acid sequence
plays a major role in rendering the power-law behavior of evolving networks of domain organization. Overall, the
average γ of CX (2.56 ± 0.06) remained the highest along the evolutionary timeline, indicating that composition
strongly elicits the preferential attachment property. A complementary transition from random to non-random
behavior (RVN p value: 1 → 0) in ancient networks (nd ~ 0.3) implies deviation from randomness as biological
networks evolve. Remarkably, this transition event coincides with the origin of a processive ribosome. Such
Scientific Reports | (2021) 11:12075 | https://doi.org/10.1038/s41598-021-90498-8 8
Vol:.(1234567890)www.nature.com/scientificreports/
Out Fusional/
Age rank Label Node age Network(s) degree fissional Description GO name
1013,
PX, PAX, fissional/ Regulation of multicellular organismal develop-
388 c.23.1 0.4046243 390, CheY-like
SPX fusional ment
330
607,
PX, SPX, 380,
PAX, SPAX, 376,
CX 314,
[CX, PX, 271
P-loop containing nucleoside
1 c.37.1 0.0000000 SPX, PAX, [109, fusional Positive regulation of reproductive process
triphosphate hydrolases
SPAX] 97, 74,
{CX, PX, 64, 64]
SPX, PAX, {34, 32,
SPAX} 26, 23,
23}
Fissional/ Homodimeric domain of signal
2446 a.30.2 0.6820809 PX 578 Alkene binding
fusional transducing histidine =
PX 452
48 e.23.1 0.1445087 Fusional Acetyl-CoA synthetase-like Regulation of primary metabolic process
[PX] [74]
PX 427
NAD(P)-binding Rossmann-fold Pyridine-containing compound metabolic
2 c.2.1 0.0057803 [PX, CX, [117, Fusional
domains process
SPX] 80, 66]
Fissional/
1518 d.110.3|a.30.2 0.6763006 PX 423 N/A N/A
fusional
283 a.28.1 0.3526012 PX 416 Fusional ACP-like Cell periphery
Fissional/
2543 d.110.3& 0.6820809 PX 369 N/A N/A
fusional
Fissional/
858 d.110.2|d.110.3 0.6763006 PX 357 N/A N/A
fusional
Fissional/
187 c.30.1|d.142.1 0.3179191 PX 352 N/A N/A
fusional
Regulation of multicellular organismal develop-
8 c.69.1 0.0346821 PX 327 Fusional Alpha/beta-Hydrolases
ment
Fissional/ PYP-like sensor domain (PAS Regulation of cellular macromolecule biosyn-
4777 d.110.3 0.7225434 PX 325
fusional domain) thetic process
Class I glutamine amidotransferase- Positive regulation of oxidative phosphorylation
17 c.23.16 0.0809249 PX 315 Fusional
like uncoupler activity
Fusional/
4465 d.122.1|c.23.1 0.7109827 PX 291 fissional/ N/A N/A
fusional
Fissional/
1599 d.110.3|d.110.2 0.6763006 PX 262 N/A N/A
fusional
Cyclic-guanylate-specific phosphodiesterase
443 c.1.33 0.5028902 PX 253 Fusional EAL domain-like
activity
Table 1. Domains and domain combinations scoring > = 99.9th percentiles of 249.916, [63] and {23}, based on
combined outdegrees of the five networks at time points 1.0, [0.676] and {0.671}, respectively. The square and
curly brackets denote values from the events after and before the big bang, respectively. N/A, not applicable.
biphasic patterns are common in biology and have explained the emergence of biological m odules49 in meta-
bolic networks of Escherichia coli50, networks of elementary f unctionomes46, and molecular ancestry networks
of enzymes64. Section 6 of Supplementary Text further discusses scale-freeness and randomness of networks.
Emergence of hierarchical modularity. Modular networks embed sets of communities (closely-knit
modules) that establish links preferentially within themselves and do so sparsely with the rest65. Network
modularity usually offsets the power-law behavior of biological networks by distributing node degrees within
communities66–68. However, both scale-free properties and modular structure may co-exist in a network when
modules coalesce hierarchically60. A primary index of modularity is the average clustering coefficient (C), defined
as a node-averaged ratio of triangles (graph cycles of length 3) to triads (the connected graph triples) of the net-
work, not taking into account the weights or direction of the node-links60,69,70 (Fig. 5). The adjacency PAX and
SPAX networks both showed the lowest C (averaged over nd) with a value of 0.09 ± 0.009. The composition CX
network had a relatively higher C of 0.2 ± 0.009. However, the non-adjacency pairwise PX and SPX networks had
the highest C values of 0.5 ± 0.02 and 0.32 ± 0.014, respectively. These values were still lower than those reported
for metabolic networks (C = ~ 0.6)60,68,71. Hence, the networks supposedly evolved more random smaller mod-
ules connected by various inter-modular links, rather than stronger larger modules with few interconnections.
Also, the evolution of modular structure appeared better consolidated by pairwise (PX and SPX) and to a lesser
degree composability (CX) constraints rather than by adjacency (PAX and SPAX). Comparing patterns of modu-
larity of evolving networks to those of randomness (given by RVNp value) indicated complementary transitions
between the two behaviors over the evolutionary timeline (Figs. 4 and 5).
Scientific Reports | (2021) 11:12075 | https://doi.org/10.1038/s41598-021-90498-8 9
Vol.:(0123456789)www.nature.com/scientificreports/
Age rank Label Node age Network(s) In degree Fusional/fissional Description GO name
PURINE-containing com-
6044 d.110.2 0.8728324 PX, PAX, SPX 766, 295, 267 fissional GAF domain-like
pound catabolic process
Regulation of cellular mac-
PYP-like sensor domain
4777 d.110.3 0.7225434 PX 735 Fissional/fusional romolecule biosynthetic
(PAS domain)
process
ATPase domain of HSP90
Nucleic acid metabolic
5529 d.122.1 0.7745665 PX 701 Fissional/fusional chaperone/DNA topoi-
process
somerase =
5038 a.30.2|d.122.1 0.7341040 PX 550 Fusional/fissional/fusional N/A N/A
CoA-dependent acyltrans- Monocarboxylic acid
5101 c.43.1 0.7398844 PX 445 Fissional/fusional
ferases catabolic process
5664 d.110.3|a.30.2|d.122.1 0.7919075 PX 439 Fusional/fissional N/A N/A
6150 c.43.1& 0.9768786 PX 432 Fusional/fissional N/A N/A
Pyrimidine-containing
5304 c.30.1 0.7572255 PX 375 Fissional/fusional PreATP-grasp domain compound biosynthetic
process
Regulation of mesoderm
6148 b.1.1 0.9768786 PX 370 Fissional Immunoglobulin
development
4848 e.23.1|a.28.1 0.7225434 PX 367 Fusional/fissional N/A N/A
Pyrimidine-containing
Glutathione synthetase
5095 d.142.1 0.7398844 PX 359 Fissional/fusional compound biosynthetic
ATP-binding domain-like
process
Positive regulation of
5731 g.3.11 0.8034682 PX 317 Fissional/fusional EGF/Laminin
receptor activity
4118 c.43.1&|e.23.1|a.28.1 0.6994219 PX 287 Fusional/fissional/fusional N/A N/A
Regulation of primary
4758 d.58.29 0.7225434 PX 272 Fissional/fusional Nucleotide cyclase
metabolic process
5521 d.110.3|d.58.29 0.7745665 PX 266 Fusional/fissional N/A N/A
c.43.1&|e.23.1|a.28.
4855 0.7225434 PX 265 Fusional/fissional N/A N/A
1|c.43.1&
4763 a.30.2|d.122.1|c.23.1 0.7225434 PX 263 Fusional/fissional/fusional N/A N/A
Spermadhesin, CUB Regulation of anatomical
5768 b.23.1 0.8092486 PX 261 Fissional/fusional
domain structure size
Regulation of CD4-
5759 b.1.2 0.8092486 PX 259 Fissional/fusional Fibronectin type III positive, alpha–beta T cell
activation
2886 c.43.1|e.23.1|a.28.1 0.6878613 PX 258 Fusional/fissional/fusional N/A N/A
[1620] c.43.1&|e.23.1 0.6763006 PX 28 Fusional/fissional/fusional N/A N/A
[1223] d.142.1|c.24.1 0.6763006 PX 25 Fusional/fissional/fusional N/A N/A
[1311] a.28.1|c.43.1& 0.6763006 PX 25 Fusional/fissional/fusional N/A N/A
[1032] e.23.1|a.28.1|c.43.1&|e.23.1 0.6763006 PX 23 Fusional/fissional/fusional N/A N/A
[283] a.28.1 0.3526012 PX, SPX, PAX, SPAX 22, 22, 21, 21 Fusional ACP-like Cell periphery
d.142.1|a.92.1|c.30.1|d.14
[1556] 0.6763006 PX 22 Fusional/fissional/fusional N/A N/A
2.1|c.24.1
e.23.1|a.28.1|c.43.1&|e.23
[1085] 0.6763006 PX 21 Fusional/fissional/fusional N/A N/A
.1|a.28.1
Regulation of epithelial cell
{672} a.4.1 0.6647399 PX, CX 8, 7 Fissional/fusional Homeodomain-like differentiation involved in
kidney development
Heterocycle metabolic
{324} c.73.1 0.3641618 PX 6 Fissional/fusional Carbamate kinase-like
process
c.73.1|d.58.18&|c.2.
{460} 0.5202312 CX 5 Fusional/fissional N/A N/A
1|d.81.1
b.113.1|a.156.1|g.39.
{734} 0.6705202 CX 5 Fusional/fissional N/A N/A
1|c.37.1
{13} c.2.1|a.100.1 0.0693642 PX 5 Fusional/fissional/fusional N/A N/A
Ribosomal protein S5 NUCLEIC acid phospho-
{58} d.14.1 0.1791908 PX, SPX 5, 5 Fusional
domain 2-like diester bond hydrolysis
Fibroblast growth factor
Glucocorticoid receptor-
receptor signaling pathway
{270} g.39.1 0.3468208 PX 5 Fissional/fusional like (DNA-binding
involved in ureteric bud
domain)
formation
Regulation of multicellular
{388} c.23.1 0.4046243 PX 5 Fissional/fusional CheY-like
organismal development
Table 2. Domains and domain combinations scoring > = 99.9th percentile of 247.977, [20] and {5}, based on
combined in degrees of the five networks at time points 1.0, [0.676] and {0.671}, respectively. The square and
curly brackets denote values from the events after and before the big bang, respectively. N/A, not applicable.
Scientific Reports | (2021) 11:12075 | https://doi.org/10.1038/s41598-021-90498-8 10
Vol:.(1234567890)www.nature.com/scientificreports/
Figure 4. Statistical descriptors of power law and random behavior. Six indicators of preferential attachment
were studied along the evolutionary timeline to explore processes of network growth, with network age (nd)
indicated on a relative 0-to-1 scale. Outdegree and indegree connections were cumulative and weighted in
evolving networks. Barabási (red) and Barabási-Age (orange) networks were included as control sets. The
Barabási model specifies the probability of preference of an old node as P i ~ kiα while the Barabási-Age model
grants heavier power law properties to older nodes (exhibiting smaller nd) with Pi ~ (kiα)(liβ), where ki is the
indegree of node i of the current event, α is the preferential attachment exponent (α = 1 for linear preferential
attachment), li is the age of node i, i.e. the number of events elapsed since the node was added, with maximum
number measured by the ‘aging.bin’ parameter, and β is the aging exponent (β = 1 for linear increases in
probability of preference of an older node with high li). Power law indices include: (1) the KS fit statistic that
compares the input degree data distribution with the fitted power law distribution (smaller scores denote better
fit); (2) the KS p value, which rejects the null hypothesis that degree data was drawn from the fitted power-law
distribution when less than α = 0.05; (3) the exponent of the fitted power-law distribution (α); (4) the slope of
power-law linear regression model (γ); (5) the log-likelihood of the fitted parameters; and (6) the coefficient of
determination (R2) that measures the percentage of degree data that fits the linear model. The randomness of
the evolving networks was quantified by the p value of an approximated beta distribution from the rank version
of von Neumann’s Ratio Test for R andomness89 (RVNp value). The alternate hypothesis was non-randomness.
Comparative graphs of strictly random Erdős–Rényi control networks of corresponding sizes at the given time-
events were also plotted. Lower KS fit, higher KS p value, higher α, lower −γ and near-zero likelihood, given
lower RVNp value, support power law behavior.
In order to dissect the modular behavior of evolving networks, we studied the regression patterns of C
against network size N and evolutionary age nd. For typical scale-free models, C declines sharply with increas-
ing N (C ~ N-coefficient), while the coefficients are as high as 0.7572. Instead, highly modular networks are typically
independent of N60. In our networks, C regressed by N with very low coefficients (CX, 0.000036; PX, 0.00007;
Scientific Reports | (2021) 11:12075 | https://doi.org/10.1038/s41598-021-90498-8 11
Vol.:(0123456789)www.nature.com/scientificreports/
Figure 5. Network modularity. Six indicators of modularity were studied along the evolutionary timeline
to explore the evolution of network structure, with network age (nd) indicated on a relative 0-to-1 scale.
Modularity indices include the VOS Quality (VQ) index, the Clustering ratio (C-ratio), the average Clustering
Coefficient (C), the Fast-Greedy Community (FGC) index, and the Newman-Girvan index defined by age
(NGage) or VOS clustering (NGVOS). Modularity calculations required cumulative, undirected, and weighted
connectivity input. The Barabási (red) and Barabási-Age (orange) models (see caption of Fig. 4) were included
as control sets. The regressions of C with age (nd) are shown as linear models (red lines) for each network
together with supporting determination coefficients (R2).
PAX, 0.000035; SPX, 0.00016; SPAX, 0.00016). In contrast, the regression of C with age (C ~ nd-coefficient) produced
significantly higher coefficients (CX, 0.39; PX, 0.85; PAX, 0.39; SPX, 0.35; SPAX, 0.41) (Fig. 5). As expected73,
the reference power-law (Barabási) networks that were used as control showed a C of zero. Our data strongly
suggests the existence of a highly modular structure that is independent of network growth but is strongly
constrained by history, especially when considering the pairwise interactions of the PX network. The rise of the
modularity index with emerging power-law degree distribution during certain periods of network evolution
indicated a parallel formation of complex hierarchical module clusters with scale-free properties, not distinct
from those present in metabolic networks60. Our networks of domain organization showed a slight lag between
an onset of scale-free organization (measured with KS fit and γ indegree statistics) and a delayed emergence of
modular behavior (measured with C), occurring during early protein evolution. This was followed by intermit-
tent periods of hierarchical modularity spanning across the middle of the evolutionary timeline. Remarkably, the
evolving networks showed again a prominent biphasic pattern of hierarchical modularity involving two peaks of
modularity (higher statistic C) coinciding with increased power-law behavior (valleys of KS fit and -γ curves), at
nd ~ 0.37 and nd ~ 0.67, respectively (Figs. 4 and 5). The modularity heatmaps and dendrograms of select phases
of network evolution confirm these biphasic patterns (Fig. 6), which were markedly distinct from the long-tailed
clustering patterns of preferential attachment (Supplementary Fig. S10). As identified e arlier46, the timing of this
switch coincides with the early development of genetic code specificity in the emerging ribosomal aaRS catalytic
domains, which was facilitated by the OB-fold s tructure74. These counteracting and delicately balanced trends of
modularity and preferential attachment suggest that the emergence of scale-free behavior of the partial bipartite
CX network must have impacted the hierarchical modular structure of the modern pairwise networks of domain
organization (PX, PAX, SPX, SPAX) (Supplementary Video 3). A detailed account of our testing and verification
of this conjecture is explained in Sect. 7 of Supplementary Text.
Scientific Reports | (2021) 11:12075 | https://doi.org/10.1038/s41598-021-90498-8 12
Vol:.(1234567890)www.nature.com/scientificreports/
Figure 6. Evolution of modularity and hierarchical organization of networks over select events of the evolutionary
timeline. NGage pairwise modularity v alues65, scaled by log10 of network-wide absolute modularity values, were
used as input for the calculation of Euclidean distance m atrices87, which were visualized as heatmaps. Heatmap
tiles represent modular strength between any two architectures relative to the respective strength of their linkages
to other architectures of the network. The embedded dendrograms that define the order of rows and columns of
the heatmaps were generated by hierarchical clustering of the distance matrices with the Ward’s minimum variance
method88. The height of dendrograms represents dissimilarity between clusters while the clades show grouping
rearrangements of architectures. The top-left insets depict frequency histograms of the heatmap modularity values
scaled from − 1 to 1 (i.e. disassortative to assortative). The four panels describe growth of each evolving network
(left-to-right). Network age corresponds to the middle approximate boundaries of the three evolutionary epochs of
the protein world (Supplementary Fig. S2), i.e., end of ‘architectural diversification’ (nd = 0.393), end of ‘superkingdom
specification’ (nd = 0.613), onset of the ‘big bang’ of domain organization at the start of ‘organismal diversification’
(nd = 0.676); and the present (nd = 1). Nodes were age-sorted ascendingly within clusters and labelled using standard
SCOP nomenclature9. In the case of SPX and SPAX, nodes correspond to 1643 domains mapped to the entity set of
6162 architectures. The color-coding of bands and labels identifies the age of architectures (Supplementary Fig. S2).
The relatively ’flatter’ heatmap and ’skewed’ dendrogram patterns of CX (typically at nd = 0.667 and nd = 1.000) are
an artifact of unweighted distance matrices of CX, which contrast with the weighted ones of pairwise criterion-based
networks. The most prominent clades correspond to the modules of the most ancient domain structures harboring
the two major waves of architectural innovation. We also generated heatmaps of power-law control networks of
corresponding sizes at the given time-events (Supplementary Fig. S10). When compared to the pairwise networks, the
combined heatmap and dendrogram patterns of CX suggest a hidden switch from scale-freeness to modular behavior,
eventually giving rise to hierarchical modularity with visible emergence of modules within modules.
Scientific Reports | (2021) 11:12075 | https://doi.org/10.1038/s41598-021-90498-8 13
Vol.:(0123456789)You can also read