TRANSPORT VOLUME 4 - Department of State Development
←
→
Page content transcription
If your browser does not render page correctly, please read the page content below
AQUIS RESORT AT THE GREAT BARRIER REEF PTY LTD

ENVIRONMENTAL IMPACT
STATEMENT

   VOLUME 4
CHAPTER 24
TRANSPORT

24. TRANSPORT
24.1 ROAD NETWORK
24.1.1 Existing Situation
Performance of a road link has been expressed in the context of Level of Service (LoS), a traffic
engineering parameter used to describe the performance of a road link or intersection. The
Department of Transport and Main Roads Planning and Design Manual describes LoS as ‘a qualitative
measure of such factors as speed, trip time, interruptions, interference, freedom to overtake, ability to
manoeuvre, safety, comfort, convenience and vehicle operating costs.’ This is most simply expressed
in terms of the traffic volumes experienced by the road link, or degree of saturation at an intersection.
Figure 24-1 provides a visual representation of typical LoS conditions to provide a point of reference.
LoS A LoS B LoS C
LoS D LoS E LoS F
Figure 24-1 LoS reference photographs.
The Department of Transport and Main Roads (DTMR) would ideally trigger upgrade of road links
when the links are consistently operating at a LoS D or worse. Notwithstanding this, the decision to
upgrade is subject to the availability of funding and the competing demands for available funds.
a) State Controlled Road Network
The state controlled road network for the Cairns environs is managed and operated by DTMR. A
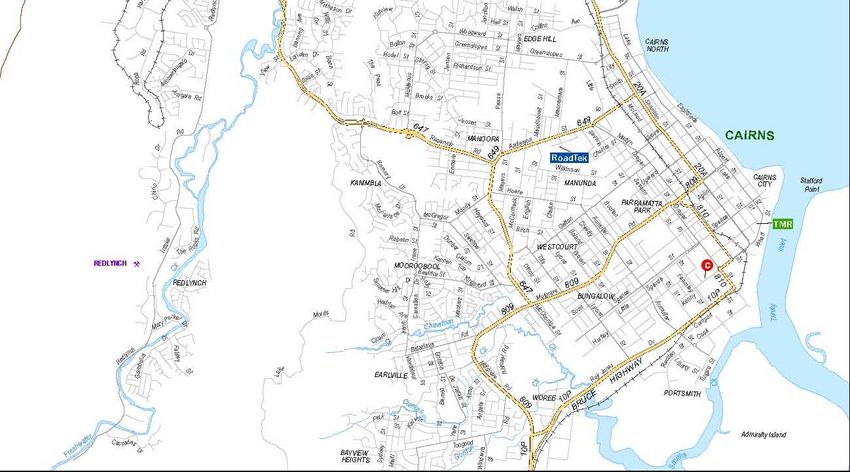
network map for the Cairns area is provided in Figure 24-2.
Aquis Resort at The Great Barrier Reef Revision: Final
Environmental Impact Statement - June 2014 Page 24-1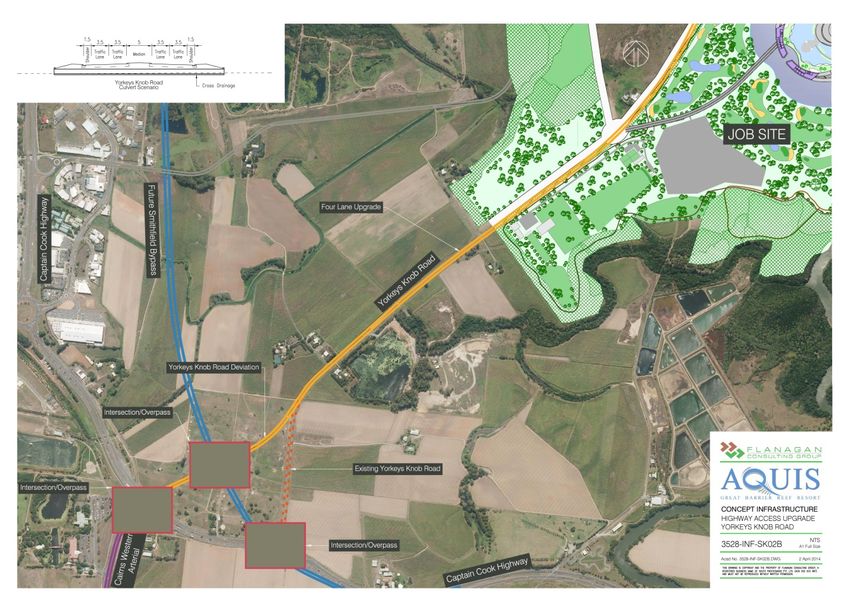
Aquis
                                             Project
                                             Site

Figure 24-2 DTMR Gazetted Road Network in Cairns environs.

Source: Queensland Department of Transport and Main Roads.

The state managed road network fulfils an important freight and transport task for Cairns and the state
of Queensland, providing capacity and connectivity across and between major nodes of economic
activity.

The Bruce Highway is the major entry to the city from the south, and is the primary road freight route
and passenger transport corridor from the southern suburbs to the port and the city.

Mulgrave Road provides connectivity to the Cairns Western Arterial Road and the Cairns City from the
Bruce Highway.

Aquis Resort at The Great Barrier Reef                                                     Revision:   Final
Environmental Impact Statement - June 2014                                                 Page        24-2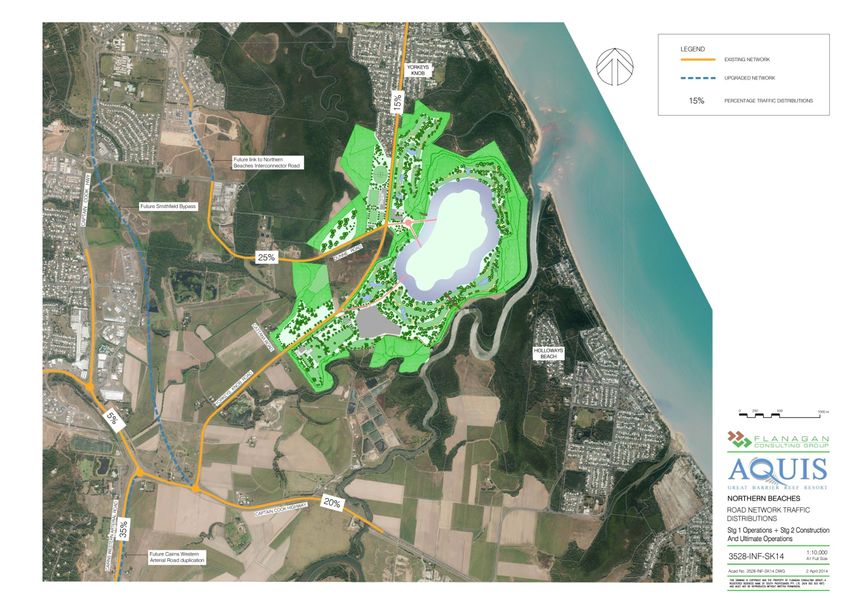
The Cairns Western Arterial Road conveys traffic to and from the western and southern suburbs of
Cairns to the northern suburbs.

Captain Cook Highway provides direct linkage between the Cairns City, Northern Beaches of Cairns
and destinations further north to Port Douglas, Mossman and Daintree.

Due to the narrow linear development footprint of Cairns, the DTMR road network conveys a large
proportion of the daily commuter and freight movements through the region. The DTMR and CRC
have a regional road network model known as the Cairns Strategic Transport Model (CSTM). The
CSTM is a four-step (i.e. trip generation, trip distribution, and mode choice and traffic assignment)
strategic transport model for the Cairns area. It includes all the roads within the Cairns region (with the
exception of minor ‘dead-end’ streets) from Gordonvale in the south to the northern beaches areas in
the north and also extends west as far as Kuranda. It also includes the road network within the Cairns
Central Business District (CBD) and Cairns Airport. The model is used as a tool to forecast future
traffic volumes across the road network in line with changes in land use and demographics and to
model the effects of new developments.

Captain Cook Highway

The Captain Cook Highway is a four lane divided arterial highway that services the Northern Beaches
of Cairns and providers the transport link to Port Douglas and communities further north. The Captain
Cook Highway primarily conveys traffic between the Northern Beaches and the Cairns CBD / Aeroglen
/ North Cairns and the Airport.

When considering existing capacity and performance of the Captain Cook Highway, the route can be
considered as five links as follows:

Mulgrave Road to Airport Avenue (Sheridan Street)

Sheridan Street carries 40 000 vehicles per day (vpd) and operates at capacity during the peak
periods, resulting in significant queuing and delays at a LoS of E/F. It is configured as a four-lane
urban type cross section and capacity is generally affected by the number of intersections and
associated operational ‘friction’ created by property accesses, on street car parking, cross and turning
movements.

DTMR and CRC have undertaken planning studies that have examined the opportunity for six laning
of Sheridan Street and rationalisation of intersection functionality to increase capacity and to
encourage the utilisation of the parallel local street network to share traffic flows. Council is currently
constructing the Lake Street connection to Airport Avenue which will remove some airport traffic off
Sheridan Street. DTMR has no current funding commitment to ongoing upgrading of Sheridan Street.

Airport Avenue to Barron River

Airport Avenue to the Barron River has fewer intersections and operates more efficiently due to limited
access and prohibition of on street car parking. It is configured as a four-lane rural type cross section
and carries 37 000 vpd and operates typically at LoS ‘C’ during peak periods. DTMR has no plans to
undertake further upgrading of this section of the Captain Cook Highway.

Barron River to Captain Cook Highway / Cairns Western Arterial Intersection (Caravonica
Roundabout)

Barron River to Caravonica Roundabout conveys 35,000 vehicles per day. It has large roundabout
controlled intersections at Machans, Holloways and Yorkeys Knob Beach Roads and at the
intersection of the Cairns Western Arterial Road and the Captain Cook Highway. The link is configured
as a four-lane rural type cross section and operates at LoS B during peak periods. DTMR has no
plans to undertake further upgrading of this section.

Aquis Resort at The Great Barrier Reef                                                         Revision:   Final
Environmental Impact Statement - June 2014                                                     Page        24-3
DTMR has advised that the existing cross drainage structures on this segment are deteriorating and
are being monitored for structural performance that may lead to future replacement or upgrading.

The current capacity and traffic demands predicted for the Barron River to Caravonica Roundabout
portion of the Captain Cook Highway are illustrated in Figure 24-3.

Figure 24-3 Captain Cook Highway: AADT Vs LoS (2015-2034).

The traffic predictions have been sourced from the DTMR Cairns Traffic Network Model and indicate
that Captain Cook Highway between Barron River and Caravonica Roundabout will function at LoS B
to C up to 2034.

Caravonica Roundabout to Intersection of Captain Cook Highway / Kennedy Highway (Smithfield
Roundabout)

The Caravonica Roundabout to Smithfield Roundabout portion of the Captain Cook Highway is
configured as a four-lane rural type section and carries the order of 45,000 vpd. The Caravonica
Roundabout is the point of convergence of the Captain Cook Highway and the Cairns Western Arterial
Road, and the short link is a focal point of traffic movements of traffic from the Northern Beaches and
the Atherton Tablelands to Cairns CBD and the broader urban environs.

This section currently operates at Level of service D/E. DTMR is currently preparing a business case
study examining the implementation of the Smithfield Bypass which creates a route to the east of
Smithfield and links the Macgregor Road Roundabout to the Yorkeys Knob Roundabout. This will
reduce the demand on the Caravonica Roundabout to the Smithfield Roundabout and improve the
level of service on the existing route.

Aquis Resort at The Great Barrier Reef                                                    Revision:   Final
Environmental Impact Statement - June 2014                                                Page        24-4

Smithfield Roundabout to McGregor Road Roundabout

The Smithfield Roundabout is the confluence of significant traffic streams contributed by the Captain
Cook Highway and the Kennedy Highway. This segment is configured as a four-lane median
separated rural type section and carries in the order of 45,000 vehicles per day. It includes exit and
entry ramps associated with access to the Regional Shopping Centre and a signalised four way
intersection at Stanton Road. Significant delays and queuing are experienced on the approaches to
the Stanton Road Intersection and Smithfield Roundabout. This segment operates at a LoS E/F in the
AM and PM peaks.

As noted, DTMR is currently preparing a planning study to examine the benefits of implementation of
the Smithfield Bypass. It is anticipated this will significantly improve level of service on this link. No
funding commitment has been made by DTMR for the implementation of the Smithfield Bypass.

Cairns Western Arterial Road

The Cairns Western Arterial Road (CWAR) is an arterial highway that services the Northern Beaches
and inner western suburbs of Cairns, providing connectivity to the city and suburbs to the south.

The capacity and performance of the Cairns Western Arterial Road can be considered as two
segments.

Pease Street to Freshwater Creek Bridge

This segment represents the existing four-lane divided section urban type section of CWAR which
operates at a LoS B and C in the peak periods. There are several major at grade intersections on this
road situated at Pease Street, Enmore Street, Ramsay Drive / Park Ridge Drive, Loridan Drive / View
Street and the Brinsmead – Kamerunga Road. ,

The intersection with Pease Street is a signalised T intersection and currently experiences significant
queuing, but not excessive delay, on the inbound lanes in the AM peak. The Enmore Street
intersection is a signalised four way intersection and operates satisfactorily in the peak periods. The
Ramsay Dr / Park Ridge Drive intersection is an unsignalised four way intersection and has been
constrained to limit the opportunity for cross movements and right turn manoeuvres in response to
safety issues. The Ramsay Drive / View Street signalised intersection operates adequately in the peak
periods.

The unsignalised T intersection at the Brinsmead – Kamerunga Road coincides with a four-lane to
two-lane merge on CWAR just prior to the Freshwater Creek Bridge. Whilst CWAR does not
experience delay at this intersection there can be significant delay on the Brinsmead – Kamerunga
Road right turn approach in peak periods and observation identifies that there are safety issues with
this manoeuvre. There is a bottle neck at Freshwater Creek Bridge where traffic flows merge from
four lanes to two lanes at the bridge. DTMR has no current plans for upgrade of this section.

Freshwater Creek Bridge to Captain Cook Highway

This section of the CWAR is configured as a two-lane undivided rural type section. The link has
several major intersections including the Redlynch Connection Road, Kamerunga Road, Harley Street,
Stoney Creek Road and the Lake Placid Road. The intersection at the Redlynch Connection Road
Intersection is signalised and has a four-lane divided configuration. This intersection generally
operates adequately in the peak periods. The Kamerunga Road T intersection is unsignalised and has
an accident record and safety issues. The Harley Street intersection is configured as 4 way signalised
and operates with excessive queuing in the AM peak. The Stoney Creek T intersection is unsignalised
and has safety issues that are mitigated by queuing from the Harley Street intersection in the AM peak
allowing access onto CWAR by courteous drivers providing a gap. The signalised T intersection to
Lake Placid also experiences significant delay on CWAR in the AM peak. This on occasions is from

Aquis Resort at The Great Barrier Reef                                                        Revision:   Final
Environmental Impact Statement - June 2014                                                    Page        24-5
queuing extending back from the Harley Street intersection but is also created by the ‘green time’
required on the Lake Placid Road.

This link also crosses several major features with bridge structures including Freshwater Creek,
Kuranda Rail / Redlynch to Freshwater Connection Road and the Barron River.

The current LoS and traffic demands predicted for this segment are illustrated in Figure 24-4 which is
based upon traffic forecast data generated from the DTMR network model.

Figure 24-4 CWAR–AADT Vs Capacity (2015-2034).

Figure 24-4 demonstrates the segment from Freshwater Creek Bridge to the Caravonica Roundabout
currently operates at LoS E and will be at LoS F in the near future. The segment is approaching
capacity and requires upgrade. DTMR has no funding commitment to upgrade of the Cairns Western
Arterial Road.

Aquis Resort at The Great Barrier Reef                                                    Revision:   Final
Environmental Impact Statement - June 2014                                                Page        24-6

Yorkeys Knob Roundabout

The Yorkeys Knob Roundabout forms the juncture of Yorkeys Knob Road and Captain Cook
Highway. Table 24-1 summarises the current performance of the Yorkeys Knob Roundabout.

             TABLE 24-1 CURRENT PERFORMANCE OF YORKEYS KNOB ROUNDABOUT

                                                              APPROACH
                       EXISTING PERFORMANCE                              LOS
                                                              VOLUME
                       Yorkeys Knob Road / Captain Cook Highway
                       AM Peak
                       Captain Cook Highway (to Cairns CBD)       2000         A
                       Captain Cook Highway (to Smithfield)       840          A
                       Yorkeys Knob Road                          520          B
                       PM Peak
                       Captain Cook Highway (to Cairns CBD)       1040         B
                       Captain Cook Highway (to Smithfield)       1960         A
                       Yorkeys Knob Road                          480          A

Analysis indicates that the intersection operates at an average LoS B in the AM and PM peaks.

DTMR has advised there is planning to meter the roundabouts at the intersections of Yorkeys Knob,
Machans Beach and Holloways Beach Roads by signalisation of the approaches. These works are
currently underway.

Caravonica Roundabout

The Caravonica Roundabout controls traffic at the intersection of the Captain Cook Highway and the
Cairns Western Arterial Road. The roundabout is configured to allow south bound traffic on the
Captain Cook Highway and north bound traffic exiting the CWAR to bypass the intersection and merge
with the departure lanes of the roundabout.

Table 24-2 summarises the current performance of the Caravonica Roundabout.

               TABLE 24-2 CURRENT PERFORMANCE OF CARAVONICA ROUNDABOUT

                       EXISTING PERFORMANCE                   APPROACH   LOS
                                                              VOLUME
                       Cairns Western Arterial / Captain Cook Highway
                       AM Peak
                       Captain Cook Highway (to Cairns CBD)       2200         A
                       Captain Cook Highway (to Smithfield)       850          A

                       Cairns Western Arterial                    1050         A
                       PM Peak
                       Captain Cook Highway (to Cairns CBD)       980          A
                       Captain Cook Highway (to Smithfield)       1820         B
                       Cairns West Arterial                       1117         A

Aquis Resort at The Great Barrier Reef                                                 Revision:   Final
Environmental Impact Statement - June 2014                                             Page        24-7
Analysis indicates the intersection operates at an average LoS B in the AM and PM peaks.

b)      Local Road Network

Yorkeys Knob Road

Yorkeys Knob Road is configured as a two-lane rural road that services the township of Yorkeys Knob
and operates at a LoS B. The link experiences poor flood immunity. CRC has plans for the upgrade of
the Yorkeys Knob Road to improve immunity to 10% annual exceedance probability (AEP). There is
no funding commitment within the next five years for this work to proceed.

The current LoS and traffic demands predicted for Yorkeys Knob Road from 2015 to 2034 are
illustrated in Figure 24-5.

Figure 24-5 Yorkeys Knob Road traffic forecast Vs LoS (2015-2034).

The analysis shows that Yorkeys Knob Road operates at LoS B will be approaching LoS D by 2034.
This is based upon current traffic volumes with a compound growth rate of 1% annually to reflect
incremental redevelopment and densification of Yorkeys Knob over time.

Dunne Road

Dunne Road is a two-lane rural road which provides an alternative route for local trips between
Yorkeys Knob and Smithfield avoiding the need to access via the Captain Cook Highway and also
provides access to the Smithfield Waste Transfer Facility, Marlin Coast Wastewater Treatment Plant
and the Cattana wetlands. Dunne Road has a deficient horizontal geometry and has poor flood
immunity. Similar to Yorkeys Knob Road, CRC plan to upgrade Dunne Road to improve immunity of

Aquis Resort at The Great Barrier Reef                                                 Revision:   Final
Environmental Impact Statement - June 2014                                             Page        24-8
the link to 10% AEP. There is no funding commitment within the next five years for this work to proceed. The Northern Beaches Interconnector is planned by CRC as a four-lane sub-arterial road to provide an alternative route for the movement of local traffic between Poolwood Road and McGregor Road and consequently reduce local trips on the Captain Cook Highway. Dunne Road is not currently identified as a southern extension of the Northern Interconnector. Figure 24-6 illustrates the current and predicted demands and LoS on Dunne Road. Figure 24-6 Dunne Road: annual average daily Traffic LoS (2015-2034). Dunne Road currently experiences low traffic volumes. A compound growth rate of 1% has been adopted to mimic that occurring on Yorkeys Knob Road. The analysis shows that Dunne Road currently operates at LoS A and is likely to be near LoS B by 2034. 24.1.2 Impacts a) Road Transport Task The staged construction and operations of Aquis Resort will evolve over a number of distinct phases and timelines which are described as follows: Construction Stage 1 (2015 to 2018) Operations Stage 1 only (2019 to 2020) Operations Stage 1 coincident with Construction Stage 2 (2020 to 2023) Operations Ultimate – Stages 1 + 2 (2024 onwards). Aquis Resort at The Great Barrier Reef Revision: Final Environmental Impact Statement - June 2014 Page 24-9
The traffic volumes and distributions resulting from each of these phases overlap where the phases
are initiating or winding down. Hence the analysis of traffic impacts for Aquis has been considered as
a continuum from the commencement of construction in mid-2015 through to 2034 (10 years from
commencement of operations of the ultimate stage).
Trip Generations
Trip generations are created as a consequence of the need to move materials and construction
workers, guests, visitors, staff and back of house deliveries. The transport of construction workers and
operational staff are significantly the dominant trip generators.
Construction
During the construction phases traffic generation will most significantly be created by the movement of
construction workers to and from site, the transport of construction materials to site and the export of
surplus earthworks materials offsite.
Stage 1 construction will involve a peak workforce of 3,750, and Stage 2, 3,500 workers. Trip
generation modelling has been prepared on the basis of workers travelling by vehicle, bicycle and by
foot adopting an assumed modal split of:
Vehicle : 90% at an occupancy of 1.5 pax/car
Bicycle : 6%
Pedestrian : 4%
In order to manage the movement of the large volume of workers to and from site, the proponent will
require the managing contractor to adopt a staggered 10-hour shifting arrangement described in Table
4-1.
TABLE 24-3 CONSTRUCTION STAFF SHIFTING ARRANGEMENTS
Proportion of
Staff Shifting Distributions
Staff
Shift 1 Start 6am - 7am 40%
Shift 1 Finish 3pm - 4pm 40%
Shift 2 Start 7am – 8am 35%
Shift 2 Finish 4pm - 5pm 35%
Shift 3 Start 8am - 9am 25%
Shift 2 Finish 5pm - 6pm 25%
Peak daily movements by construction staff are estimated to be 5,250 for Stage 1 and 4,900 for Stage
2.
Aquis Resort at The Great Barrier Reef Revision: Final
Environmental Impact Statement - June 2014 Page 24-10For the transport of construction materials, Table 24-4 and Table 24-5 provide a summary of the
anticipated quantum of construction materials to be moved for each stage of construction and the
expected traffic generation and spectrum of heavy vehicle types.
TABLE 24-4 STAGE 1 CONSTRUCTION MATERIAL TRIPS
Vehicle Usage
Vehicle Type Truck
Material
Trips –
Material Quantity per
Total Material (No. of Axles, Excl-
Material Quantity per Truck Trip –
Quantities udes
Truck Trip Conversion
Austroads Class Return
to Tonnes
No.) Trips
342,00 3 Three Axle Truck (3 3
Concrete m 100% 5 m 12 tonnes 68 400
0 Axle, Class 4)
Semi-Trailer (6 Axle,
Reinforcement 51,000 tonnes 100% 25 tonnes 25 tonnes 2040
Class 9)
Semi-Trailer (6 Axle,
Steel 6,000 tonnes 100% 25 tonnes 25 tonnes 240
Class 9)
Truck & 4-Axle Dog 3
50% 19 m 29 tonnes 7895
(7Axle,Class 10)
Quarry 300,00 3
m
Materials 0
Semi-Trailer (5 Axle, 3
50% 15 m 22.5 tonnes 10 000
Class 8)
Semi-Trailer (5 Axle,
Asphalt 25,000 tonnes 100% 23 tonnes 23 tonnes 1087
Class 8)
115,00 2 Large Rigid Truck (2 2
Glass m 100% 154 m 6 tonnes 747
0 Axle, Class 3)
3 Semi-Trailer (6 Axle, 3
Timber 12,000 m 100% 20 m 14 tonnes 600
Class 9)
1,310, 2 Semi-Trailer (6 Axle, 2
Plasterboard m 100% 3570 m 25 tonnes 367
000 Class 9)
2,800, 3 Truck & 4-Axle Dog 3
Earthworks m 50% 19 m 29 tonnes 147 368
000 (7Axle,Class 10)
Precast Semi-Trailer (6 Axle, 3
6,350 tonnes 100% 20 m 14 tonnes 454
Products Class 9)
Semi-Trailer (6 Axle,
Various 15,000 tonnes 100% 25 tonnes 25 tonnes 2946
Class 9)
TOTAL 242,143
Of the 242 143 construction materials trips to and from site, 60% relate to the haulage of 2.8 million m3
of excavated material.
Aquis Resort at The Great Barrier Reef Revision: Final
Environmental Impact Statement - June 2014 Page 24-11TABLE 24-5 STAGE 2 CONSTRUCTION MATERIAL TRIPS
Vehicle Type Truck
Material
Trips –
Vehicle
Material Quantity per
Usage
Total Material (No. of Axles, Excl-
Material Quantity per Truck Trip –
Quantities udes
Truck Trip Conversion
Austroads Class Return
to Tonnes
No.) Trips
Three Axle Truck (3
Concrete 228 000 m3 100% 5 m3 12 tonnes 45 600
Axle, Class 4)
Reinforce- Semi-Trailer (6 Axle,
37 000 tonnes 100% 25 tonnes 25 tonnes 1480
ment Class 9)
Semi-Trailer (6 Axle,
Steel 4000 tonnes 100% 25 tonnes 25 tonnes 160
Class 9)
Quarry Truck & 4-Axle Dog
70 000 m3 50% 19 m3 29 tonnes 1842
Materials (7Axle,Class 10)
Semi-Trailer (5 Axle,
50% 15 m3 22.5 tonnes 2333
Class 8)
Semi-Trailer (5 Axle,
Asphalt 6000 tonnes 100% 23 tonnes 23 tonnes 261
Class 8)
Large Rigid Truck (2
Glass 105000 m2 100% 154 m2 6 tonnes 682
Axle, Class 3)
Semi-Trailer (6 Axle,
Timber 8 000 m3 100% 20 m3 14 tonnes 400
Class 9)
Semi-Trailer (6 Axle,
Plasterboard 1 050 000 m2 100% 3570 m2 25 tonnes 294
Class 9)
Earthworks Truck & 4-Axle Dog
235 000 m3 50% 19 m3 29 tonnes 12 368
Excavation (7Axle,Class 10)
Precast Semi-Trailer (6 Axle,
1000 tonnes 100% 20 m3 14 tonnes 71
Products Class 9)
Semi-Trailer (6 Axle,
Various 10000 tonnes 100% 25 tonnes 25 tonnes 2946
Class 9)
TOTAL 68 438
Peak daily movements of materials for each stage of construction are 585 trips each way for Stage 1
and 132 for stage 2.
Operations
The operational phases of the Aquis Resort will create a traffic spectrum that will be dominated by the
movement of guests and the transport of staff to and from the resort. The Aquis Resort will respond to
these demands in several ways.
Aquis Resort at The Great Barrier Reef Revision: Final
Environmental Impact Statement - June 2014 Page 24-12Operation of Stage 1 will require peak staffing of 10,684 to cater for a maximum occupancy of 6,000
guests, and for ultimate operations a peak staffing of 19, 811 to cater for a maximum occupancy of
11,250 guests. Trip generation modelling has been undertaken on the basis of the transport modal
splits shown in Table 24-6.
TABLE 24-6 OPERATIONS TRANSPORT MODAL SPLITS
Mini- Heavy
Coach Taxi/Limo Car Bicycle Pedestrian
Bus Vehicle
In House
90% 10%
Guests
Visitors from
other Guest 50% 50%
Houses
In House
Guests on 100%
Day Trips
Cairns
30% 70%
Residents
Staff 90% 6% 4%
Back of
House 100%
Deliveries
In order to manage the large volume of staff movements the proponent will require the hotel and
casino operators to adopt a staggered eight-hour shifting arrangement described in Table 24-7.
TABLE 24-7 OPERATIONS STAFF SHIFTING ARRANGEMENTS
Staff Shifting Distributions
Shift 1 Start 6am - 9am
Shift 1 Finish 1pm - 3pm
Shift 2 Start 1pm - 4pm
Shift 2 Finish 8pm - 10pm
Shift 3 Start 8pm – 10pm
Shift 3 Finish 5am – 7am
Aquis Resort at The Great Barrier Reef Revision: Final
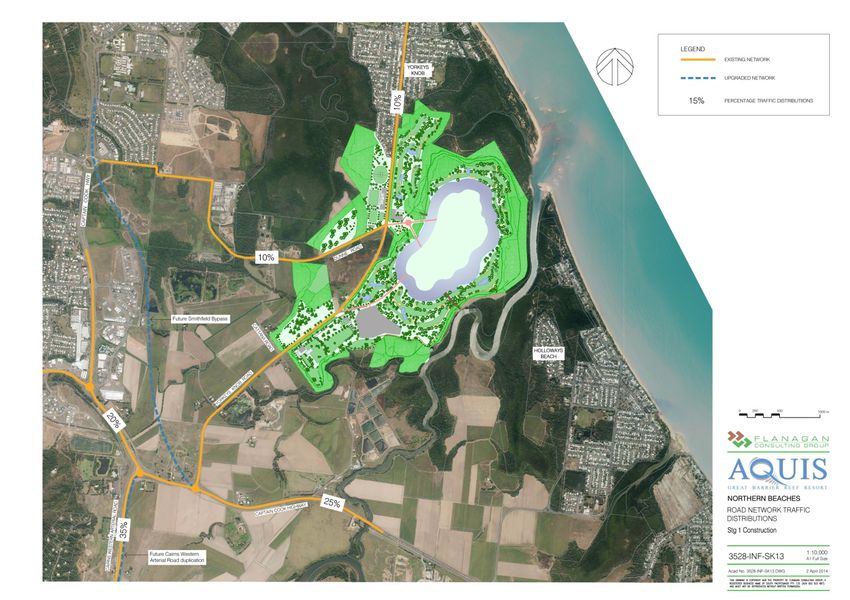
Environmental Impact Statement - June 2014 Page 24-13Distribution of construction and operational traffic onto the adjacent road network is shown in Figure 4-1 and Figure 24-8. Figure 24-7 Stage 1 Construction Traffic Distributions. Aquis Resort at The Great Barrier Reef Revision: Final Environmental Impact Statement - June 2014 Page 24-14
Figure 24-8 Stage 2 construction, Stage 1 and ultimate operations traffic distributions. The distributions reflect anticipated desire lines for the movement of workers, staff and materials. The first two years of Construction of Stage 1 is largely defined as an earthworks excavation process and includes the excavation and disposal of approximately 2.8 million cubic metres of material from the site. A number of potential sites have been identified to receive the material, the most significant being the Cairns Airport. In establishing the network distributions, it is assumed elements of new or augmented road network planned for upgrade by DTMR and CRC have proceeded and are operating. For example, it is assumed that the Northern Beaches Interconnector is in place by 2020 to facilitate the movement of northern beaches resident staff onto Dunne Road and to Aquis Resort. The external state and local road network elements assessed for impacts arising from the development include: Captain Cook Highway (DTMR) Cairns Western Arterial Road (DTMR) Intersection of Yorkeys Knob Road and Captain Cook Highway (DTMR) Intersection of Cairns Western Arterial Road and Captain Cook Highway (DTMR) Yorkeys Knob Road (CRC) Dunne Road (CRC). Aquis Resort at The Great Barrier Reef Revision: Final Environmental Impact Statement - June 2014 Page 24-15
A further strategic level assessment of impacts on the Cairns Regional Road Network has been
undertaken using the current Cairns Strategic Transit Model (CSTM) to establish the ‘ripple effect’ the
development may create across the local road network.

Based upon the trip generations, modal splits and traffic distributions described above, an analysis of
the traffic impacts on elements of the state road network has been conducted and compared against
LoS thresholds prescribed by DTMR in section 5.15 of the Road Planning and Design Manual
(RPDM). The analysis has been undertaken over the period of 2015 (commencement of construction
of stage 1) through to 2034 (10 years from commencement of operations of the ultimate development
in 2024).

b)      State Controlled Network

Captain Cook Highway (Barron River to Caravonica Roundabout)

Figure 24-9 illustrates the predicted annual average daily traffic (AADT) on the Captain Cook Highway
as a consequence of the traffic loads imposed by Aquis from 2015 to 2034.

Figure 24-9 Captain Cook Highway – AADT with Aquis.

The red and blue dotted lines reflect the traffic generated during the Aquis construction stages; the
green dotted line is the daily traffic generated by the operational phases over time; the purple solid line
is the baseline traffic generation on the Captain Cook Highway based upon current DTMR growth
models and the doted light blue line is the accumulated traffic loads of the Aquis construction,
operational traffic volumes and baseline traffic arising from normal Cairns background demands.

The plot demonstrates this portion of the Captain Cook Highway operates on average at LoS B at
2015 and in the absence of Aquis will continue to be at LoS B to C by 2034. With the Aquis traffic
demands overlayed, LoS B to C is maintained at 2034. Hence the Aquis Resort impacts on the
operating efficiency and capacity of the Captain Cook Highway link on average are not significant.

Aquis Resort at The Great Barrier Reef                                                       Revision:    Final
Environmental Impact Statement - June 2014                                                   Page        24-16
In relation to the operating peak periods, the construction and operations of Aquis will be managed to
mitigate impacts on the peak periods experienced on the Captain Cook Highway. Aquis will have an
AM peak between 6 am and 7 am and a PM peak between 2 pm and 3 pm which is not coincident with
the Captain Cook Highway commuter peaks of 8 am to 9 am and 5 pm to 6 pm. The benefit of this
operating regime is that by operating non-coincident peaks, Aquis can utilise latent capacity in the
network. To illustrate this, Figure 24-10 shows the AM (8 am to 9 am) and PM (5 pm to 6 pm) peak
traffic volumes for the Captain Cook Highway, with and without Aquis demand.

Figure 24-10 Captain Cook Highway AM and PM coincident peaks.

Aquis Resort at The Great Barrier Reef                                                   Revision:    Final
Environmental Impact Statement - June 2014                                               Page        24-17
Figure 24-10 demonstrates that for the AM and PM Captain Cook Highway peaks, Aquis demands
are relatively low and the capacity is being consumed on the contra-direction of flow.

The Aquis Resort demands do not impact upon LoS outcomes for the Captain Cook Highway during
the traditional AM and PM peaks.

Figure 24-11 shows the Aquis peak AM (6 am to 7 am) and PM (2 pm to 3 pm) peak traffic generated
on the Captain Cook Highway with and without Aquis traffic loads.

Figure 24-11 Aquis AM and PM non-coincident peaks on Captain Cook Highway.

Aquis Resort at The Great Barrier Reef                                              Revision:    Final
Environmental Impact Statement - June 2014                                          Page        24-18
Figure 24-11demonstrates for the AM and PM Aquis Resort peaks that the demands increase the
non-coincident peak flows on the Captain Cook Highway, however the LoS is still generally maintained
at A. The Aquis Resort demands do not significantly impact upon LoS outcomes for the Captain Cook
Highway as it occurs in non-coincident peaks.

Cairns Western Arterial Road (Freshwater Creek Bridge to Caravonica Roundabout)

Figure 24-12 illustrates the predicted annual average daily traffic (AADT) on the Cairns Western
Arterial Road with and without the planned 4 lane upgrade.

Figure 24-12 CWAR AADT Level of Service with / without 4 lanes.

Aquis Resort at The Great Barrier Reef                                                   Revision:    Final
Environmental Impact Statement - June 2014                                               Page        24-19
This section of the CWAR is currently at or approaching LoS E and F and warrants upgrading to four
lanes in the absence of the Aquis Resort. Overlaying Aquis resort demands on the traffic profile will
significantly exacerbate the current performance problems with CWAR.

The second plot demonstrates the benefits of upgrading CWAR to four lanes by 2019. LoS can be
improved from LoS E to B immediately and by 2034 the link would still be operating at LoS C to D.

In relation to peak hour impacts, Figure 24-13 shows the AM (8am to 9am) and PM (5pm to 6pm)
peak traffic volumes for the CWAR with and without Aquis Resort. This figure is in two parts.

Aquis Resort at The Great Barrier Reef                                                    Revision:    Final
Environmental Impact Statement - June 2014                                                Page        24-20
Figure 24-13 CWAR traditional AM and PM peak hour impacts.

The figures demonstrate the AM and PM Aquis Resort peaks increase the non-coincident peak flows
on the four-lane upgraded CWAR, however the LoS is maintained at B to C. The Aquis Resort
demands have minimal impact upon LoS outcomes for the four-lane upgraded CWAR.

Intersection of Captain Cook Highway / Yorkeys Knob Road

The performance of the Yorkeys Knob Road roundabout over time is difficult to predict with certainty
as the configuration and functional demands on the intersection will be a subject to DTMR planning
outcomes for the Smithfield Bypass and the timing for its implementation.

On the assumption that the roundabout maintains current functionality with no significant change to
traffic patterns other than those imposed by Aquis, Table 24-8 summarises the impacts on Yorkeys
Knob Road roundabout to 2034.

Aquis Resort at The Great Barrier Reef                                                   Revision:    Final
Environmental Impact Statement - June 2014                                               Page        24-21
TABLE 24-8 IMPACTS OF AQUIS OPERATION TRAFFIC ON YORKEYS KNOB ROUNDABOUT

EXISTING INTERSECTIONS
                                                                       DEGREE    QUEUE      AVERAGE
Aquis RESORT OPERATIONAL                     APPROACH
                                                           LOS         OF SATUR- LENGTH DELAY
TRAFFIC                                      VOLUME
                                                                       ATION     (95TH) (m) (s)
2034 ‘10 YEAR HORIZON’
Yorkeys Knob Road / Captain Cook Highway
AM Peak
Captain Cook Highway (to Cairns CBD)            2527             F         1.35        2203           325
Captain Cook Highway (to Smithfield)            1290             A         0.54         34                8
Yorkeys Knob Road                               2014             F         2.47        2184           915
PM Peak
Captain Cook Highway (to Cairns CBD)            1396             B         0.60         65                15
Captain Cook Highway (to Smithfield)            2262             F         1,87        3615           801
Yorkeys Knob Road                               1615             E         1.04         302               72

The analysis demonstrates the Yorkeys Knob Roundabout will become dysfunctional and require
upgrade in order to maintain acceptable LoS outcomes to 2034.

The stage 1 construction phase will create proportionally high right turn movement onto Yorkeys Knob
Road in the AM peaks which is expected to create delays for traffic travelling inbound to Cairns on the
Captain Cook Highway. The result will be motorists electing to use CWAR as an alternative route
which is not desirable given the current poor performance of CWAR.

Augmentation or reconfiguration of the roundabout is the appropriate response to this issue; however
in the absence of DTMR planning outcomes it is not possible at present, to define the likely
reconfigured intersection. The proponent will engage and work with DTMR to arrive at a solution that
meets agreed performance outcomes.

Intersection of Captain Cook Highway / Caravonica Roundabout

Similar to the Yorkeys Knob roundabout, the performance of the Caravonica roundabout over time is
difficult to predict with certainty as the configuration and functional demands on the intersection will be
subject to the planning outcomes for the Smithfield Bypass and the timing for its implementation.

On the assumption that the roundabout remains functional with no significant change to traffic patterns
other than those imposed by Aquis, Table 24-9 summarises the impacts on Caravonica roundabout at
2034.

Aquis Resort at The Great Barrier Reef                                                        Revision:        Final
Environmental Impact Statement - June 2014                                                    Page            24-22
TABLE 24-9 IMPACTS OF AQUIS OPERATIONAL TRAFFIC ON CARAVONICA ROUNDABOUT
EXISTING INTERSECTIONS
DEGREE QUEUE AVERAGE
Aquis RESORT OPERATIONAL APPROACH
LOS OF SATUR- LENGTH DELAY
TRAFFIC VOLUME
ATION (95TH) (m) (s)
2034 ‘10 YEAR HORIZON’
Caravonica Roundabout
AM Peak
Captain Cook Highway (to Cairns CBD) 2527 B 0.90 184 14
Captain Cook Highway (to Smithfield) 1290 F 2.50 3270 1400
Cairns Western Arterial 2360 A 0.61 21 6
PM Peak
Captain Cook Highway (to Cairns CBD) 1396 B 0.93 224 20
Captain Cook Highway (to Smithfield) 2262 F 2.29 4417 1183
Cairns Western Arterial 2120 E 1.98 687 680
The analysis demonstrates the Caravonica Roundabout experiences significant delay and will require
upgrade in order to realise acceptable LoS outcomes.
Broader Road Network Impacts
Understanding impacts on the broader Cairns Road Network is an important aspect of gauging the
‘ripple effect’ a development the size and scale of Aquis can generate on the broader road network.
The Cairns Strategic Transport Model (CSTM) prepared by Bitzios Consulting for the DTMR and CRC
is an effective and recognised tool for establishing regional road network impacts arising from
development including Aquis.
The model underwent an update in 2013 which included an update of the road network and
demographic data including population and employment data for both the 2011 and 2031 models.
During this process the model also underwent a thorough revalidation to ensure fitness for purpose in
undertaking strategic assessments for new road projects and major developments. The model
validation focussed on the key/major road corridors such as the Bruce, Kennedy and Captain Cook
Highways across a number of screen lines but also included detailed validation for the CBD and
Cairns Airport. The CSTM is an appropriate model in terms of providing a strategic level assessment
of impacts on the major road corridors. The impacts on the local road network need to be viewed with
a little more caution.
The traffic demands and associated demographic data associated with operating and servicing Aquis
have been overlayed onto the 2031 model and a suite of maps were generated which communicate
the impacts created by Aquis above and beyond the current 2031 predictions.
The 2031 predictive modelling includes anticipated infrastructure upgrades as provided by CRC and
DTMR in the development of the model. This includes future four-lane upgrades of Cairns Western
Arterial, Yorkeys Knob Road, Dunne Road, the Northern Beaches Interconnector and Smithfield
Bypass.
Mapping data is presented for the ‘Construction Stage 1’, ‘Operation Stage 1 + Construction Stage 2’
and ‘Ultimate Operations’ stages for:
Links where 5% or more vehicles per day increase is forecast
Links tipped over capacity AM Peak
Links tipped over capacity PM peak.
Aquis Resort at The Great Barrier Reef Revision: Final
Environmental Impact Statement - June 2014 Page 24-23The 5% figure represents a threshold defined by DTMR where the development is considered to have the potential to create ‘impact’ on the network. The assessment as to the ‘tipping over capacity’ establishes whether the impact has the potential to result in the need for more capacity to be provided on the network beyond that already planned. As the original CSTM model established for DTMR has been developed around the 2011 and 2031 baseline and 20 year planning window, the assessment of Aquis Resort impacts are related to these timelines. The 2011 and 2031 do not align specifically with the Aquis Resort construction and operational milestones, but it does provide a good ‘first pass’ of potential impacts. As such the stages considered relate to the CSTM modelling milestones as follows: Construction Stage 1 : 2011 CSTM Model Construction Stage 2 and Operations Stage 2 : 2031 CSTM model Ultimate Operations : 2031 CSTM model. Further development of the CSTM model is expected by the DTMR to more specifically reflect the Aquis timelines. The refined model will form the basis for establishing a decision framework to a proposed infrastructure agreement between the proponent and DTMR. The maps generated for each of the above stages are provided in Figure 24-14 to Figure 24-21. Those routes highlighted in red line work identify where thresholds are being exceeded. Figure 24-14 illustrates there are segments of the network where the 2011 AADT volumes are exceeded by more than the 5% threshold as a consequence of Aquis. The Captain Cook Highway is highlighted as the most impacted by the stage 1 construction which is anticipated given the large earthworks haulage task proposed to Cairns Airport. (As noted above, the efficacy of the predicted volumes and thus impacts on the lower hierarchal roads in the network need to be interpreted with some caution.) Aquis Resort at The Great Barrier Reef Revision: Final Environmental Impact Statement - June 2014 Page 24-24
Figure 24-14 Network where 5% increase in background traffic threshold is exceeded (Stage 1 Construction).

Aquis Resort at The Great Barrier Reef                                                          Revision:    Final
Environmental Impact Statement - June 2014                                                      Page        24-25
Figure 24-15 AM network peak where capacity is exceeded (Stage 1 Construction).

Aquis Resort at The Great Barrier Reef                                            Revision:    Final
Environmental Impact Statement - June 2014                                        Page        24-26
Figure 24-16 PM network peak where capacity is exceeded (Stage 1 Construction).
Figure 24-15 and Figure 24-16 indicate the capacity of the network in 2011 will not be exceeded by
the construction of Stage 1 of Aquis. This suggests that Stage 1 of construction of Aquis can be
accommodated within existing road infrastructure capacity.

Aquis Resort at The Great Barrier Reef                                                 Revision:    Final
Environmental Impact Statement - June 2014                                             Page        24-27
Figure 24-17 Network where 5% increase in background traffic threshold is exceeded (Stage 1 Operations and
Stage 2 Construction).

Aquis Resort at The Great Barrier Reef                                                         Revision:    Final
Environmental Impact Statement - June 2014                                                     Page        24-28
Figure 24-18 AM network peak where capacity is exceeded (Stage 1 Operations and Stage 2 Construction).

Aquis Resort at The Great Barrier Reef                                                       Revision:    Final
Environmental Impact Statement - June 2014                                                   Page        24-29
Figure 24-19 PM network peak where capacity is exceeded (Stage 1 Operations and Stage 2 Construction).

Figure 24-17 illustrates that there are segments of the network where the predicted 2031 AADT
volumes are in excess of the 5% threshold as a consequence of Aquis. Of the State Road Network,
the Captain Cook Highway and Cairns Western Arterial are highlighted.

Aquis Resort at The Great Barrier Reef                                                        Revision:    Final
Environmental Impact Statement - June 2014                                                    Page        24-30
Figure 24-18 and Figure 24-19 indicates that the capacity of the proposed network in 2031 will not be
exceeded by the operation and construction of Aquis. This reflects that Aquis fits within the planning
framework for road infrastructure capacity to 2031.

Figure 24-20 Network where 5% increase in background traffic threshold is exceeded (Ultimate Operations :
2031).

Aquis Resort at The Great Barrier Reef                                                          Revision:    Final
Environmental Impact Statement - June 2014                                                      Page        24-31
Figure 24-21 AM network peak where capacity is exceeded (Ultimate Operations: 2031).

Aquis Resort at The Great Barrier Reef                                                 Revision:    Final
Environmental Impact Statement - June 2014                                             Page        24-32
Figure 24-22 PM network peak where capacity is exceeded (Ultimate Operations: 2031).

Figure 24-20 illustrates that there are segments of the network where the predicted 2031 AADT
volumes are in excess of the 5% threshold as a consequence of Aquis ultimate operations.

Aquis Resort at The Great Barrier Reef                                                 Revision:    Final
Environmental Impact Statement - June 2014                                             Page        24-33
Figure 24-21 and Figure 24-22 indicate that the capacity of the proposed network in 2031 will not be
  exceeded by the operations of Aquis. This reflects that Aquis fits within the planning framework for
  road infrastructure to 2031.

  Pavement Impacts

  The DTMR Traffic Impact Assessment methodology requires that there be consideration of the
  impacts arising on the pavement assets. This is triggered by the threshold defined by DTMR where
  the development causes greater than 5% more Equivalent Standard Axles (ESAs) than predicted for
  the network in the absence of Aquis. In order to assess the magnitude of the pavement impact of the
  Aquis Resort on the State Controlled Road network, the increase in ESAs are assessed against the
  background ESAs to determine additional costs that may be required for the pavement rehabilitation
  and / or maintenance.

  A detailed assessment of likely pavement impacts has been undertaken for the Aquis construction and
  operational stages of Aquis on the Captain Cook Highway and the Cairns Western Arterial to 2034
  and these are discussed below.

  The total ESAs associated with transporting construction materials for the development are
  summarised in Table 24-10. These values were determined by adopting assumed truck types (and
  typical vehicle ESAs), likely payload per trip, and truck volumes. The ESA information for each vehicle
  class (unloaded and fully loaded) has been obtained from material provided separately by DTMR. It is
  noted that ESA adjustments have been made for all trips carrying loads below the maximum allowable
  payload.

                                 TABLE 24-10 CONSTRUCTION ESA CALCULATION

         Vehicle Type     Vehicle ESA (per   Material          Truck                   ESAs
         (No. of Axles,         trip)        Qty per           Trips
Material
         Austroads Class Fully              Truck Trip         (One      Loaded      Unloaded
                                   Unloaded (Tonnes)           Way)                                   TOTAL
         No.)            Loaded                                           Trips        Trips
             Three Axle Truck (3
Concrete                                3.7    0.5    12      114 000     421 800     57 000          478 800
             Axle, Class 4)
Reinforc-    Semi-Trailer (6 Axle,
                                        5.1    0.51   25        3520      17 952       1795            19 747
ement        Class 9)
             Semi-Trailer (6 Axle,
Steel                                   5.1    0.51   25        4955       400         204                  604
             Class 9)
             Truck & 4-Axle Dog
                                        7.2    0.53   29        9827      70 754       5208            75 962
Quarry       (7Axle,Class 10)
Materials    Semi-Trailer (5 Axle,
                                        5.9    0.52   22.5     12 333     72 765       6413            79 178
             Class 8)
             Semi-Trailer (5 Axle,
Asphalt                                 5.9    0.52   23        1348       7953        701              8654
             Class 8)
             Large Rigid Truck (2
Glass                                    3     0.54    6        1429       4287        772              5059
             Axle, Class 3)
             Semi-Trailer (6 Axle,
Timber                                  5.1    0.51   14        1000       5100        510              5610
             Class 9)
Plaster-     Semi-Trailer (6 Axle,
                                        5.1    0.51   25        661        3371        337              3708
board        Class 9)
             Semi-Trailer (6 Axle,
Various                                 5.1    0.51   25        5892      30 049       3004            33 053
             Class 9)
             Semi-Trailer (6 Axle,
Precast                                 5.1    0.51   25        525        2678        268              2946
             Class 9)
Earthworks Truck & 4-Axle Dog
                                        7.2    0.53   29      159 736    1 150 100    84 660         1 234 760
Excavation (7Axle,Class 10)
Totals                                                                   1 787 209    160 872        1 948 081

  Aquis Resort at The Great Barrier Reef                                                        Revision:     Final
  Environmental Impact Statement - June 2014                                                    Page         24-34
The road network will experience an additional 2 million ESAs of loading over the eight year
construction period. Approximately 65% of the additional ESAs is related to the transport of the 2.8
million cubic metres of earthworks exported from site.
The estimated ESAs have been assigned to the State Controlled Road network taking into
consideration the traffic assignments as well as the construction vehicle class likely to travel on a
particular route.
Therefore, the estimated ESAs during the eight-year construction period have been assigned to the
external DTMR road network for construction materials as follows:
43% to / from Cairns Western Arterial
57% to / from the Captain Cook Highway.
The estimated ESAs for exporting of the surplus earthworks have been assigned to the external road
network as follows:
0% to / from Cairns Western Arterial
100% to / from the Captain Cook Highway (south) – based upon delivery of materials to Cairns
Airport.
Taking the above into consideration, the additional ESAs over the construction period on the adjacent
State Controlled Road network is summarised in Table 24-11.
TABLE 24-11 CONSTRUCTION ESA DISTRIBUTION
STATE CONTROLLED ESAs (8 YEAR CONSTRUCTION PERIOD)
ROAD To Site From Site TOTAL
Captain Cook Highway 411,812 1,189,199 1,601,011
(South of Yorkeys Knob
Road towards Cairns)
Captain Cook Highway 310,109 37,115 347,224
(Yorkeys Knob Road to
CWAR)
Captain Cook Highway 36,152 4,344 40,496
(North of CWAR)
Cairns Western Arterial 273,957 32,771 306,728
Road
In order to appreciate the increase in ESAs on the State Controlled Road network, a comparison is
made against the background ESAs for that period. It is anticipated that construction will commence in
mid-2015 and be completed in 2023. Therefore, for comparison purposes, 2015 to 2023 have been
selected as the design years for comparing base and design ESAs for construction traffic.
Aquis Resort at The Great Barrier Reef Revision: Final
Environmental Impact Statement - June 2014 Page 24-35The base, proposed and percentage increase in ESAs on the State Controlled Road network for each
segment are summarised in Table 24-12.
TABLE 24-12 CONSTRUCTION INCREASE IN ESA
Existing Average ESAs Proposed Construction ESAs Percentage Increase
State (8 Years) (8 Years) in ESAs
Controlled
Road From From To From
To Site TOTAL To Site TOTAL TOTAL
Site Site Site Site
Captain
Cook
Highway
(South of
4 521 895 4 339 485 8 861 470 411 812 1 189 199 1 601 011 9.1% 27.4% 18.1%
Yorkeys
Knob Road
towards
Cairns)
Captain
Cook
Highway
3 881 410 4 229 985 8 111 395 310 109 37 115 347 224 8.0% 0.8% 4.3%
(Yorkeys
Knob Road
to CWAR)
Captain
Cook
Highway 5 908 715 6 417 430 12 327 145 36 152 4344 40 496 0.6% 0.1% 0.3%
(North of
CWAR)
Cairns
Western
3 095 930 2 841 525 5 937 455 273 957 32 771 306 728 8.8% 1.1% 5.2%
Arterial
Road
The DTMR threshold of 5% above base levels dictates as to whether a development will meet criteria
for impact on the pavement life. Those network segments that are impacted include:
Captain Cook Highway (East of Yorkeys Knob Road – Inbound and Outbound)
Captain Cook Highway (Yorkeys Knob Road to CWAR – Inbound)
Cairns Western Arterial (Inbound).
The haulage of the surplus earthworks materials to Cairns Airport is strongly reflected by the 27.4%
increase in ESAs on the Captain Cook Highway south.
Aquis Resort at The Great Barrier Reef Revision: Final
Environmental Impact Statement - June 2014 Page 24-36The total ESAs associated with the heavy vehicle trips for the operational stages of Aquis Resort
(which includes servicing vehicles, HOVs transporting guests) are summarised in Table 24-13.
TABLE 24-13 OPERATIONAL ESA GENERATION
Vehicle Type Vehicle ESA (per
Loading Status Total ESAs/Day
(No. of Axles, trip) Trips
Use Austroads Class Fully (One
No.) Way) From From
Loade Unloaded To Site To Site TOTAL
Site Site
d
HoV for
Arriving / Bus (2 axle, Class Loade
Departing 3 0.54 77 Loaded 231 231 462
3) d
Guests
HoV for
Bus (2 axle, Class Loade
Guest Day 3 0.54 76 Loaded 193 193 386
3) d
Trips
Trucks for
Three Axle Truck Loade
Servicing 3.7 0.5 360 Empty 1332 180 1,512
(3 axles, Class 4) d
(Rigid)
Trucks for
Servicing Semi –Trailers (6 Loade
5.1 0.51 360 Empty 1836 183 2020
(Semi - Axle Class 9) d
Trailer)
873 TOTAL 3592 787 4380
Based on the above there will be an additional 4,380 ESAs on the network during each day of
operation of Aquis from 2023.
The operational ESAs generated by Aquis are distributed across the adjacent road network as follows:
Captain Cook Highway (South): 60%
Captain Cook Highway (North): 15%
Cairns Western Arterial: 25%.
The distribution has been derived based upon the likely sources and direction from which heavy
vehicle carried goods and services will be delivered to site. For example it is anticipated a large
portion of the heavy vehicle trips will be guests from the airport and food and beverage which will
come from the south along the Captain Cook Highway.
No information has been available from DTMR as to the forecast ESAs on the adjacent network and
as such these have been predicted based upon existing commercial traffic volumes and growth rates
and is detailed below:
1. Applying a base traffic growth rate of 2% p.a. (compound) to the 2011 AADT volumes to
establish the 2015 to 2034 base traffic volumes. AADT volumes on Cairns Western Arterial and
Captain Cook Highway (south of Cairns Western Arterial) were estimated by utilising available
peak hour and AADT data obtained on Captain Cook Highway, just north of Cairns Western
Arterial. A directional split of 50%/50% was assumed for all road segments where daily traffic
data was not available.
2. Adopting a heavy vehicle percentage of 5.95% northbound and 5.69% southbound, which is
consistent with the heavy vehicle percentages measured on Captain Cook Highway just north of
Cairns.
3. Applying an average of 3.2 ESAs/truck. This rate is generally accepted by DTMR for all State
Controlled Roads excluding the Bruce Highway.
Aquis Resort at The Great Barrier Reef Revision: Final
Environmental Impact Statement - June 2014 Page 24-37Utilising the base ESAs derived through the above methodology and the additional ESAs generated
by Aquis, the percentage increase in ESAs has been derived and is provided in Table 24-14.
TABLE 24-14 OPERATIONAL INCREASE IN ESA
STATE EXISTING AVERAGE PROPOSED DAILY ESAs PERCENTAGE INCREASE
CONTROLLED DAILY ESAs IN ESAs
ROAD To Site From TOTAL To Site From TOTAL To Site From TOTAL
Site Site Site
Captain Cook
Highway (South
3190 2927 6117 2157 474 2631 67.6% 16.1% 43.0%
of Yorkeys
Knob Road)
Captain Cook
Highway
2738 2984 5722 1436 313 1749 52.4% 10.5% 30.6%
(Yorkeys Knob
Road to CWAR)
Captain Cook
Highway (North 4169 4527 8695 539 118 657 12.9% 2.6% 7.6%
of CWAR)
Cairns Western
2184 2004 4178 896 195 1091 41.0% 9.7% 26.1%
Arterial Road
When compared against the DTMR threshold of 5% above base level ESAs , those network segments
that are impacted include:
Captain Cook Highway (South of Yorkeys Knob Road – Inbound and Outbound)
Captain Cook Highway (Yorkeys Knob Road to CWAR – Inbound and Outbound)
Captain Cook Highway (North of CWAR – Inbound)
Cairns Western Arterial (Inbound and Outbound).
The pavement impacts associated with the operation of Aquis will be relatively significant and will
need to be catered for as part of the infrastructure agreement between the proponent and DTMR.
c) Local Road Network
Traffic impacts on elements of the local road network were assessed and compared against LoS
thresholds prescribed by DTMR in section 5.15 of the Road Planning and Design Manual (RPDM).
The analysis was undertaken over the period of 2015 (commencement of construction of stage 1)
through to 2034 (ten years from the commencement of operations of the ultimate development).
Aquis Resort at The Great Barrier Reef Revision: Final
Environmental Impact Statement - June 2014 Page 24-38Yorkeys Knob Road Figure 24-23 illustrates the predicted annual average daily traffic (AADT) on the Yorkeys Knob Road as a consequence of the Aquis Resort imposed traffic loads relative to LoS. Figure 24-23 Annual average daily traffic on Yorkeys Knob Road with Aquis Resort. The red and dark blue dotted lines reflect the traffic loads imposed during the Aquis construction stages; the green dotted line is the daily traffic generated by the operational phases over time; the purple solid line is the baseline traffic generation on the Yorkeys Knob Road based upon current DTMR and Council growth models and the dotted dark blue line is the accumulated traffic loads of the Aquis construction, operational and baseline loads. The plot demonstrates the Yorkeys Knob Road at 2015 operates at LoS B, and in the absence of Aquis will be at LoS D by 2034. With the Aquis traffic loadings imposed, Yorkeys Knob Road will exceed LoS E/F which renders the link unserviceable. Hence the Aquis Resort impacts on the operating behaviour of the Yorkeys Knob Road are significant. The anticipated response to this outcome will be four-lane upgrading of Yorkeys Knob Road. Aquis Resort at The Great Barrier Reef Revision: Final Environmental Impact Statement - June 2014 Page 24-39
In relation to the operating peak period, the construction and operations of Aquis will be managed to
mitigate impacts on the peak periods experienced on the surrounding road network. Figure 24-27
shows the AM (8 am to 9 am) and PM (5 pm to 6 pm) peak traffic volumes for Yorkeys Knob Road
with and without Aquis Resort and, Figure 24-28 shows the AM (6 am to 7 am) and PM (2 pm to 3
pm) peak traffic generated with and without Aquis. This figure is in two parts.

Aquis Resort at The Great Barrier Reef                                                    Revision:    Final
Environmental Impact Statement - June 2014                                                Page        24-40
Figure 24-24 Yorkeys Knob Road AM peak (8 am – 9 am) and PM peak (5 pm – 6 pm).

Aquis Resort at The Great Barrier Reef                                            Revision:    Final
Environmental Impact Statement - June 2014                                        Page        24-41
Figure 24-25 Yorkeys Knob Road non-coincident AM peak (6 am – 7 am) and PM peak (2 pm – 3 pm).

The plots illustrate that in the coincident and non-coincident peaks level of service D and E is being
achieved by 2034, reflecting the need for Yorkeys Knob Road to be upgraded.

Aquis Resort at The Great Barrier Reef                                                      Revision:    Final
Environmental Impact Statement - June 2014                                                  Page        24-42
It has been estimated 10% of travel demands generated by construction workers and staff will have an
origin from the Yorkeys Knob community. This equates to approximately 1600 trips per day at full
operations of the development. It is anticipated that approximately one third of these trips will be by
passive transport given the convenience of the close proximity of the development to Yorkeys Knob,
and as an outcome off road facilities would be provided to meet this need. The balance 1200 trips per
day by motor car would be spread across three work shifts and this would equate to 400 trips per shift
change spread across a two-hour window, generating 200 trips per hour in the peaks. This impact will
be minor in the context of road capacity and traffic movements across the Yorkeys Knob road network.

Dunne Road
Figure 24-26 illustrates the predicted annual average daily traffic (AADT) on Dunne Road as a
consequence of the Aquis Resort imposed traffic loads compared with LoS.

Figure 24-26 Annual average daily traffic on Dunne Road with Aquis Resort.

The plot demonstrates Dunne Road at 2015 operates at LoS A, and in the absence of Aquis will be at
LoS B by 2034.

With the Aquis traffic loadings imposed, Dunne Road will not exceed LoS C at 2034 which is an
acceptable outcome. Hence the Aquis Resort impacts on the operating behaviour of Dunne Road are
not significant.

In relation to the operating peak period, the construction and operations of Aquis will be managed to
mitigate impacts on the peak periods experienced on the surrounding road network. Figure 24-27
shows the AM (8 am to 9 am) and PM (5 pm to 6 pm) peak traffic volumes for Dunne Road with and
without Aquis Resort and, Figure 24-28 shows the AM (6 am to 7 am) and PM (2 pm to 3 pm) peak
traffic generated with and without Aquis.

Aquis Resort at The Great Barrier Reef                                                    Revision:    Final
Environmental Impact Statement - June 2014                                                Page        24-43
Figure 24-27 Dunne Road AM Peak (8 am – 9 am) and PM Peak (5 pm – 6 pm).

For both the AM and PM Dunne Road peaks, the figure demonstrates the Aquis demands are
relatively low and the capacity is being consumed on the contra-direction of flow. The Aquis Resort
demands do not impact upon LoS outcomes for Dunne Road.

Aquis Resort at The Great Barrier Reef                                                    Revision:    Final
Environmental Impact Statement - June 2014                                                Page        24-44
Figure 24-28 Dunne Road non-coincident AM peak (6 am – 7 am) and PM Peak (2 pm – 3 pm).

The figure demonstrates for both the AM and PM Aquis Resort peaks that the Aquis demands
increase the non-coincident peak flows on Dunne Road, however the LoS is still generally maintained
at A or B. The Aquis Resort demands do not impact upon LoS outcomes for Dunne Road.

Aquis Resort at The Great Barrier Reef                                                    Revision:    Final
Environmental Impact Statement - June 2014                                                Page        24-45
You can also read