Using information and technology to improve efficacy of welfare programs: Evidence from a field experiment in India
←
→
Page content transcription
If your browser does not render page correctly, please read the page content below
Using information and technology to improve efficacy of
   welfare programs: Evidence from a field experiment in
                           India ∗
                 Upasak Das†‡              Amartya Paul§               Mohit Sharma¶
                                         September 13, 2019

                                                 Abstract

      Does information dissemination among beneficiaries of welfare programs mitigate imple-
      mentation failures that undermine these programs? We present experimental evidence on
      this question in the context of the rural public works program in India. A noble interven-
      tion that involves accessing micro level online administrative information of the program
      and disseminating it to the beneficiaries was implemented in parts of the state of Telan-
      gana. Using baseline and endline survey as well as administrative data, we evaluate the
      impact of this intervention on awareness of the provisions, process, delayed payments and
      uptake of the program in terms of days worked. The design of the intervention ensured
      us to examine the effect of spillovers from the intervention as well as look at the impact
      of heterogeneous intensity of treatment. The findings indicate a positive and significant
      impact on raising awareness levels, improving the process mechanism and reducing last
      mile payment delays. However no significant impact was observed on delays that do not
      occur at the local level and on uptake as well. The impact of spillovers is also found to be
      largely positive, however no major difference in impact is found because of the heteroge-
      neous treatment intensity.

      Keywords: Information, Welfare program, implementation, randomization, delay of pay-
      ments, MGNREGS

      JEL Codes: C93, D73, H53

   ∗ We thank the Libtech team along with Anuradha De, Nidhi Aggarwal and Astha Ahuja of CORD for

their comments, suggestions and help with the preparation of data. We also thank seminar participants at the
University of Calcutta and Indian Statistical Institute, Kolkata for their comments. The project is funded by
Tata Trust.
   † Corresponding author (email: upasak@sas.upenn.edu)
   ‡ Upasak Das is a post-doctoral fellow at the Social Norms Group in the University of Pennsylvania.
   § Amartya Paul is a doctoral student at the Centre for Development Studies, Trivandrum.
   ¶ Mohit Sharma is a research associate at the Collaborative Research and Dissemination (CORD), New Delhi.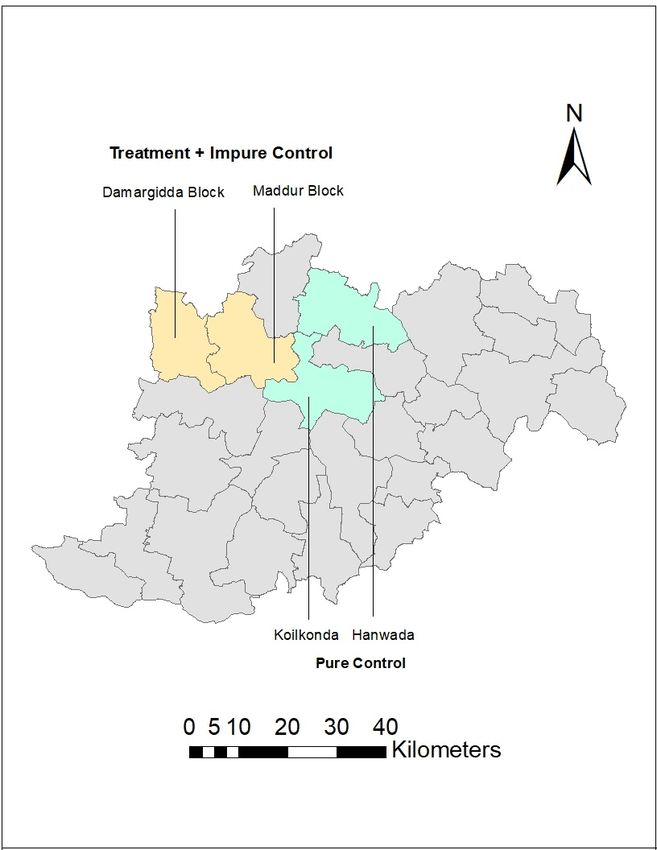
1     Introduction

“Knowledge is power. Information is liberating. Education is the premise of progress, in every

society, in every family.” − Kofi Annan

    It has been well recognized that welfare interventions including conditional cash transfer

programs, public work programs and food distribution programs have been effective in provid-

ing social security to the deprived population across developing countries (Von Braun, 1995;

Subbarao, 2001; Gilligan et al., 2009; Miller et al., 2011; Glewwe and Kassouf, 2012; De Brauw

and Hoddinott, 2011). Despite success of these programs in producing sizable impact on welfare

outcomes, it has been argued that much of it also depends on how the programs are imple-

mented at the local level. Limited institutional capacity to implement these programs often is

cited as the reason for them to fail or not produce the desirable impact (Pritchett, 2009). For

example, elite capture of welfare programs due to multiple market failures has been evident

where the benefits are disproportionately enjoyed by the better off population at the cost of

the deprived ones (Bardhan and Mookherjee, 2000). Similarly, implementation deficiencies,

transaction cost and previous experience of the beneficiaries including delayed payments may

actually discourage the poor to take optimal benefits out of these programs (Skoufias, 2005;

Narayanan et al., 2017).

    The implementation failures often undermine the program and one key reason for prevalence

of such failures arguably has been the dearth of the correct information among the beneficiaries

which makes it impossible for them to hold the functionaries accountable (Drèze and Sen, 2013).

Literature has emphasized the pivotal role of information in efficient functioning of the markets

and proper provisioning of public goods and services (Stigler, 1961; Jensen, 2007; Gisselquist

and Niño-Zarazúa, 2013; Dal Bo and Finan, 2016; Protik et al., 2018). Notably as Banerjee

et al. (2018) indicate, information plays an important role in better rural public service delivery,

which suffers because of rent seeking behavior of the implementing authorities. This largely

happens due to information asymmetry that can often be utilized by them for their own benefit

resulting in hefty welfare losses for the intended deprived population.

                                                 1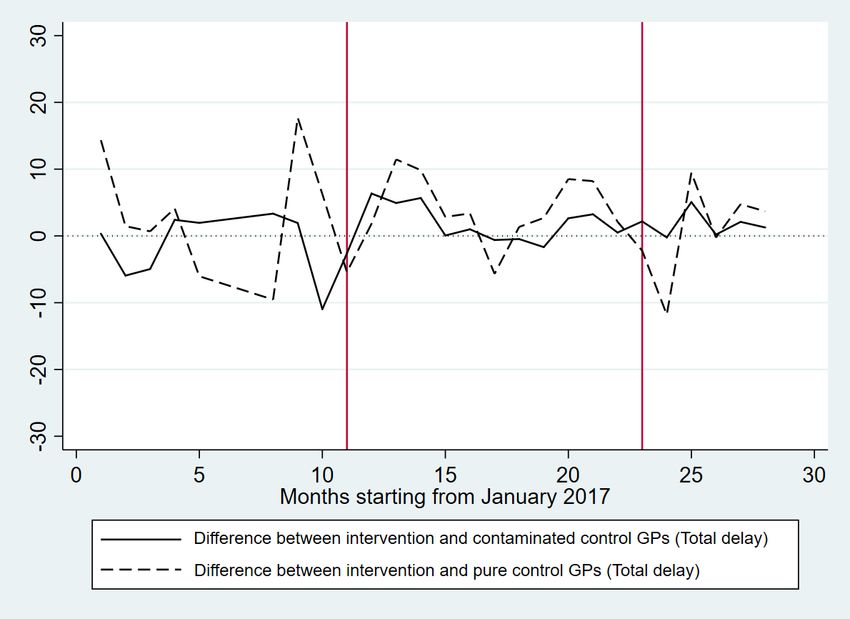
However, it is not exactly clear if providing information to the citizen acts like a magic bullet.

It may happen that citizens would not be able to make use the information to demand their

entitlements. Further even if the information is provided, the implementing authorities may not

care about the demands. Hence, gauging whether dissemination of information improves service

delivery is an empirical question (Banerjee et al., 2018). Literature has found mixed evidence on

this. For example, Banerjee et al. (2018) found dissemination of information increased receipts

of benefits in a subsidized rice program in Indonesia. However, Ravallion et al. (2013) found no

such effects on similar outcomes related to the Mahatma Gandhi National Rural Employment

Guarantee Scheme (MGNREGS) in India apart from enhancing awareness.

   This paper experimentally evaluates an intervention based on accessing information from

public website and passing the same to the beneficiaries of the MGNREGS, which is a public

works program implemented in India since 2005. In other words, the intervention harnesses

public micro-level administrative records available online on MGNREGS and disseminate the

information to beneficiaries or a group of beneficiaries. The main component of the intervention

is as follows: after the information on wages, once it gets credited to the bank or postal accounts

gets updated, the names of the relevant individuals are listed and then pasted at core junctions

of the village. In addition, the intervention attempted to spread awareness on various provisions

of the program through local meetings and mobile phone calls. The intervention was rolled out

randomly in parts of the southern state of Telangana in India. We make use of this randomized

design and examine the impact of the intervention on different outcomes related to the program

including awareness, process mechanism, participation in local meetings, delayed payments and

uptake in terms of days worked among others. The design of the intervention and survey also

allowed us to look at the effect of spillovers from the intervention and evaluate differential

impact of the heterogeneous treatment intensity.

   The findings reveal that the intervention has been successful in enhancing awareness and

encouraging the beneficiaries to attend local meetings and raising concerns about MGNREGS

in these meetings. We did not find significant impact of the intervention in reducing delay in

                                                 2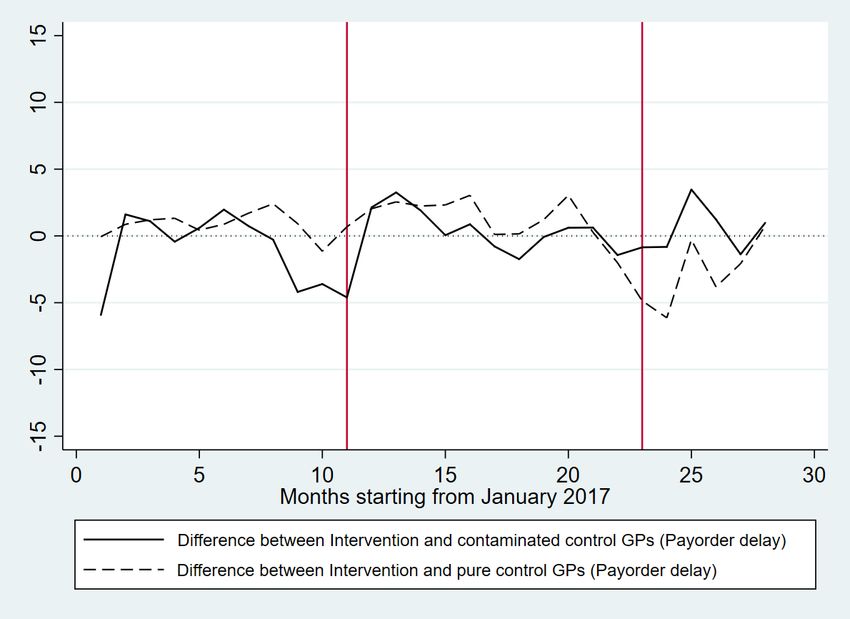
payments that occur at higher levels but a definite impact on the last mile delay in payments

because of the wage credit list pasting. Interestingly, the gains are found to converge to the

pre-intervention level within three months of conclusion of the intervention. Finally, we did

not find significant impact on uptake possibly because of the short duration of the intervention

and local level conditions, which prompted the authorities to take decisions that discouraged

workers from demanding work. In terms of the effects of spillover, we found positive results on

some of these indicators while being negligible for other indicators.

   Notably we look at the possible impact of differential treatment intensity. However we

deviate from the existing studies on randomized experiments that intend to examine the het-

erogeneous impact of differential intervention intensity. Unlike these studies, which randomly

allocate units to heterogeneous intensity of treatment, we do not randomize it. Rather we allow

the intensity to grow organically or naturally differing on account of variations in the charac-

teristics of the units (in our case, the unit is GP). Because of randomized selection of GPs, the

distribution of these characteristics is likely to be similar and hence there would be no specific

GP level characteristics that may systematically alter the outcome variables. We argue such an

approach would enhance the external validity of our intervention without introducing biasness

in the estimates. The findings indicate no significant difference in the impact of heterogeneous

treatment intensity. Notably we did not find higher effect for mobile phone owners and the

literate population possibly indicating that the nature of the intervention is inclusive.

   The paper contributes to four strands of literature. Firstly, it provides evidence that tech-

nology based interventions can be effective in improving efficacy of safety net programs. This

works through direct dissemination of information to the beneficiaries as well as encouraging

them to hold the implementing authorities to be more accountable (Björkman and Svensson,

2009; Nagavarapu and Sekhri, 2016). With respect to this, improving last mile service delivery

becomes important and our paper complement that by Muralidharan et al. (2018), who find

significant gains in reduction of delay in payments under a cash transfer program implemented

in Telangana in 2018. Secondly, the paper extends the growing literature on mobile phone

                                                3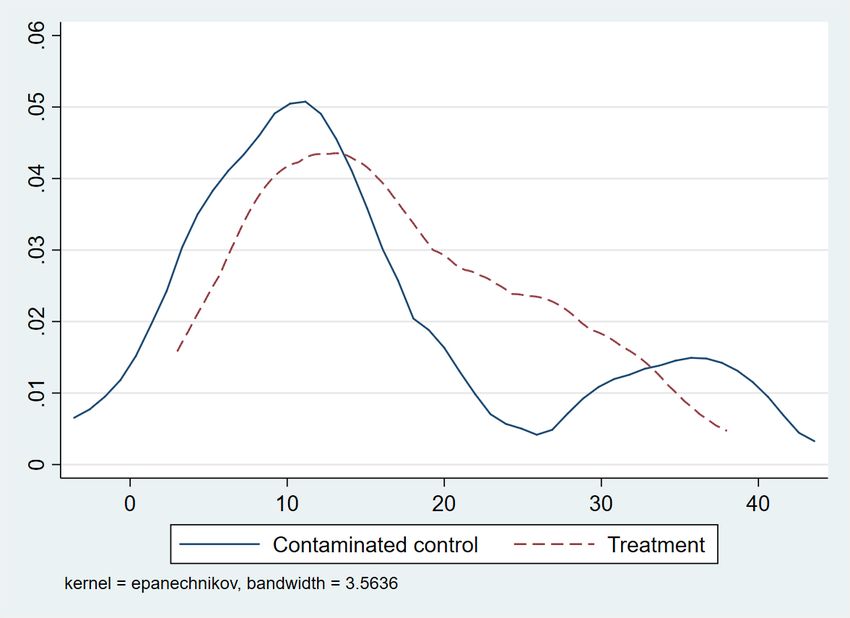
usage, which has been found to be effective in increasing income, improving better farming

practices and reducing price dispersion among others (Jensen, 2007; Labonne and Chase, 2009;

Aker, 2010; Aker and Mbiti, 2010; Cole and Fernando, 2012; Debnath and Sekhri, 2016). This

paper gives evidence on the role of mobile phones in improving accountability and efficacy

of public works programs. Thirdly, the design of the survey and randomization allow us to

gauge the impact of the intervention not only on the treated villages but also on the adjoining

non-treated villages, thereby making it possible to measure the impact of spillovers of the treat-

ment. Hence, the paper contributes to the set of literature that examines spillover effects of

welfare interventions (Miguel and Kremer, 2004; Chong et al., 2013; Alik-Lagrange and Raval-

lion, 2019). Lastly, the study contributes to the growing research on MGNREGS and shows

how a simple intervention can be effective in improving implementation and service delivery

under the program. On this note, the significance of the study lies in finding ways to increase

accountability among local level implementers. Our intervention can be a useful alternative for

Civil Society Organizations (CSO) and other program implementing authorities to engage in

for better public service delivery in MGNREGS and even other programs.

    The structure of the paper is as follows. Section 2 describes the MGNREGS program in

brief. Section 3 describes the intervention and then discusses the design or roll out of the

intervention with respect to the evaluation strategy. The next section describes the survey

and section 4 discusses the estimation strategy. Section 5 presents the main findings from the

regressions and analysis. The final section concludes with a discussion.

2    MGNREGS

The project examines the impact of information dissemination to the beneficiaries of a public

works programme called the MGNREGS. Introduced on 23rd August 2005, initially it was

implemented in 200 rural districts of India and then was extended to the whole country since

2008. Under this Act, any adult from a household living in rural areas, willing to do unskilled

                                                4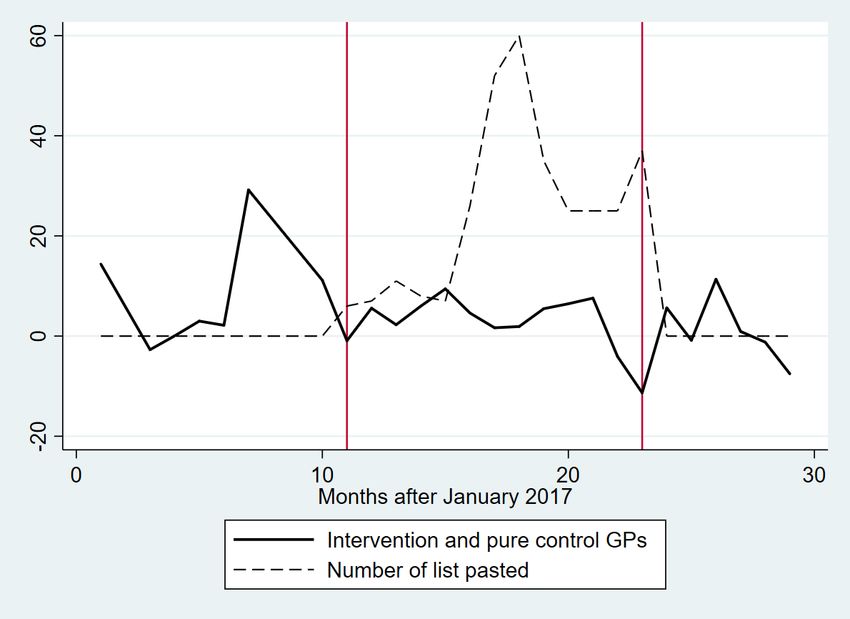
manual labour at statutory minimum wage is entitled to be employed for at least 100 days a year

on public works. For this the members willing to work would have to apply for registration.

After verification of the place of residence and age of the adult members, the household is

issued a job card, which is mandatory under the program. An application has to be made if the

household wants work, indicating the time and duration of the work. Against this application,

work would be provided within 15 days, failing to which an unemployment allowance has to

be paid. Further, the wages have to be given within 15 days after completion of the work

otherwise a delayed compensation needs to be paid. The democratically elected village head

and his/her office is responsible for implementation of the program at the Gram Panchayat

(GP) level1 . However, in the state of Telangana, the responsibility lies with an employee of the

state government called the Field Assistant (FA).

    A number of studies have examined the welfare impacts of the program. These include

positive impact on poverty, women empowerment, infant nutrition, dietary intake, education,

and reduction in distress-led migration and violence among others, which underlie the impor-

tance of the program (Afridi et al., 2017; Das, 2015a; Dasgupta et al., 2017; Deininger and

Liu, 2013; Imbert and Papp, 2015; Nair et al., 2013; Khera and Nayak, 2009). Despite these

positive effects, studies have presented a number of administrative problems that the program

has suffered from, which often undermined the potential benefits. Firstly, substantial propor-

tion of rural households is found not to have got work despite seeking (Dutta et al., 2012; Liu

and Barrett, 2013; Das, 2015c). In addition, delay in payments has been massively prevalent

which often discourages workers from demanding work under the program (Narayanan et al.,

2017, 2019). Arguably, one major reason for these implementation failures has been dearth of

correct information among the beneficiaries because of which the local authorities cannot be

made accountable. Studies have found abysmally low levels of awareness on the entitlements

of the program across the country (Dreze and Khera, 2009; Das et al., 2012; Das, 2015b). Ac-

cordingly our intervention intervenes in enhancing awareness, giving information about process
   1A GP is the primary unit of the three tier structure of the local self-government in the rural parts of India.
A single GP consists of a number of villages.

                                                        5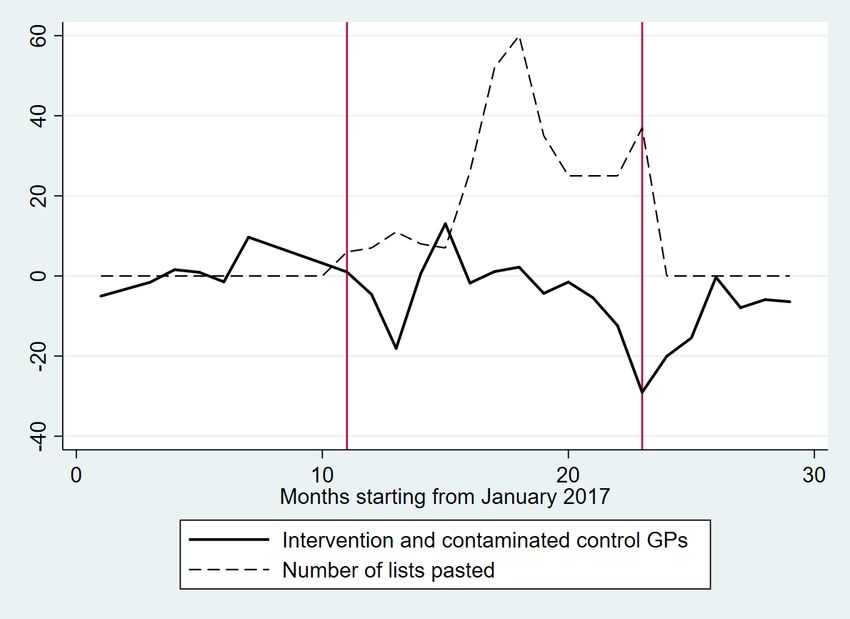
delays and disseminating online public data that can help the beneficiaries to hold the local

authorities accountable. We expect this would improve uptake of the program, resolve some of

the process related problems and finally reduce delays in payments. A detailed explanation of

the intervention is presented in the following section.

3      Intervention design and data

3.1      Intervention description

The intervention has been developed by the LibTech team, which consists of researchers, social

activists and engineers interested in improving public service delivery in India 2 . The project

started back in 2012 under the aegis of the Program on Liberation Technology at the Stanford

University and covered parts of the deprived areas of Chhattisgarh, Jharkhand and Telangana.

    The current intervention that is being evaluated has been rolled out in randomly selected

GPs of the Damaragidda and Maddur blocks from the Mahbubnagar district in Telangana with

the name Upadhi Hami Phone Radio. The intervention was carried out for 13 months from

November 2017 to November 2018. The different ingredients of the intervention are as fol-

lows. Firstly, information about various rights and entitlements guaranteed under MGNREGS

were disseminated through periodic voice broadcasts over mobile phones. These broadcasts

included information on different procedures and processes that can help workers to access

their entitlements. Local level meetings are also arranged with the intervention team to discuss

these provisions. In addition, the intervention team arranges special broadcasts by eminent

and well known people on important days like the national Independence Day and the state

formation day to attract their attention. For instance, on the MGNREGS implementation day,

the Project Director of the Mahbubnagar district addressed the workers over the Upadhi Hami

Phone Radio broadcast system.

    One important part of the intervention involved pasting the wage credited information in
    2 More   details on the team can be found from http://libtech.in/ (accessed on June 30, 2019)

                                                         6
core junctions of the villages (GP headquarters or market place) and publicizing the information
through voice broadcasts over mobile phones. The objective of the exercise is to reduce the last
mile time delay in disbursement of MGNREGS wages after it is credited in to workers accounts.
The delay in this last mile wage disbursement happens because the workers are often not aware
when their wages are credited in their accounts and the officials use it to exploit the workers.
The Branch Post Master (BPM) often collects cash from their office and may keep it with herself
for her personal needs for extended period before disbursing the wages. The bank officials on the
other hand may refuse the workers to pay the money to avoid overload. Further in the absence
of the information on whether wages have been credited in their account, the beneficiaries make
multiple visits to banks or post offices in anticipation of the money. In this situation, timely
dissemination of such information when the wage is credited increases transparency and hence
accountability of the BPMs in the fear of backlash. With this information, the workers can
also avoid making multiple trips to the banks thus allowing her not to compromise on her daily
wage work.
3.2 Intervention design
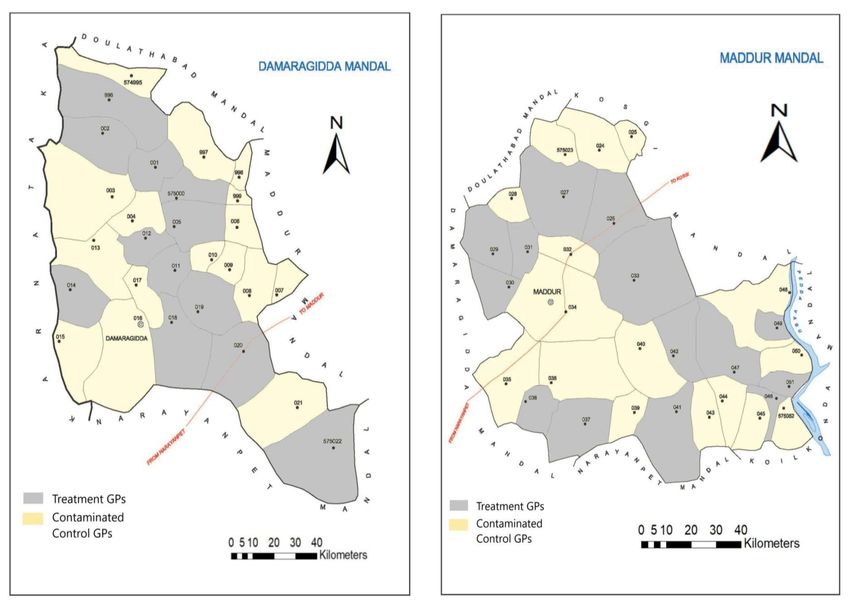
The intervention was rolled out randomly at the GP level in the Damaragidda and Maddur
blocks of the Mahbubnagar district of Telangana. Because of the possible differences across
the blocks, the randomization is stratified across the blocks. Accordingly, we intervened in 12
randomly selected GPs out of the 22 GPs of the Damaragidda block and 14 GPs out of 27
in the Maddur block. Please note that we left out Mogala Madaka GP of the Damaragidda
block from evaluation as it is adopted by the local Member of Parliament. Hence the 26 GPs
form our intervention group and the remaining GPs in these two blocks constitute the control
group (23 GPs). We further consider two other blocks within the Mahbubnagar district, Han-
wada and Koilkonda, broadly based on the similar geographic and demographic characteristics.
These two blocks are close to Damaragidda and Maddur block and in terms of the population
characteristics, they are similar as well. Since these blocks were not at all intervened, the GPs
7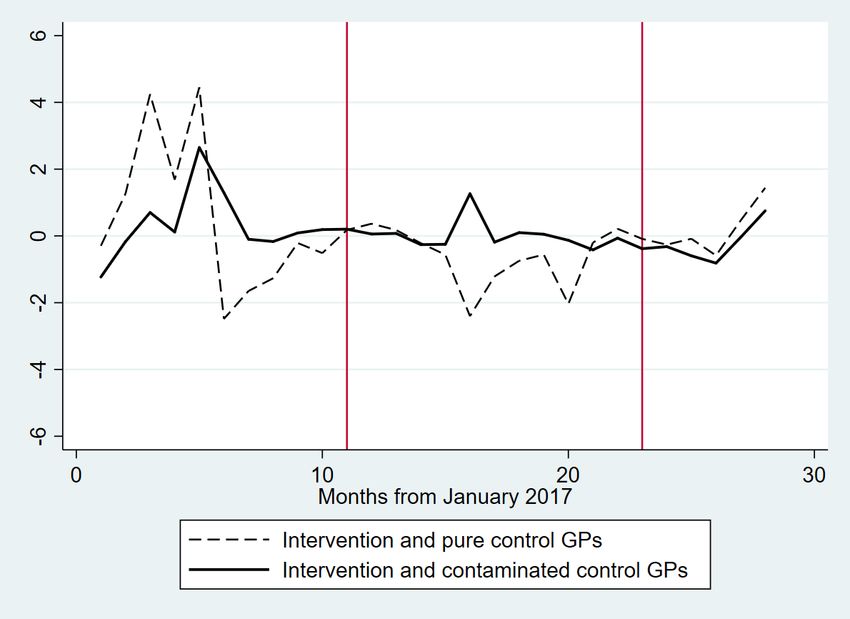
in these two blocks are the other set of controls. The basic characteristics of these four blocks

taken from the Census 2011 are presented in table 1. The block map of the Mahbubnagar

district is shown in figure 1, which also marks the four studied blocks. The intervened GPs

along with the two set of control GPs from these four blocks are shown in figure 2.

   [Table 1 here]

   [Figure 1 here]

   [Figure 2 here]

   It may be noted that the control GPs located within the same intervening block are closer

to the treated GPs and there is a possibility of flow or spillover of the intervention into these

GPs. The spillover may come from the beneficiaries as well as the local functionaries including

the FA. For example, the information disseminated as a part of the intervention may get shared

with the villagers in the adjoining GPs which are not intervened because of the proximity of

the two set of GPs. Similarly the FA from an intervention GP may learn certain provisions

about the program and spread it across her network that includes FAs from the control GPs

located within that block. This is particularly possible because FAs within a block often meet

at the block office for monthly meetings and have to mandatorily maintain WhatsApp group

among themselves. Hence gains from some of the interventions in the intervention GPs may

flow to the adjoining control GPs within the same block. Because of these possible spillovers,

the control GPs within the same block are likely to be contaminated and hence they are referred

as “Contaminated Control GPs”. However, in the control GPs that are located in Hanwada

and Koilkonda, the chances of spillovers can be assumed to be negligible. Because of being

located in the non-intervention blocks, the GPs in these blocks are far off from the intervention

GPs. Further, the chances of interaction between FAs within these blocks with those from the

intervention blocks are less, which has been confirmed from the survey as well. Out of the 96

FAs, only 2 reported of having some connection with FAs from other blocks. Therefore we

assume that spillover can flow across GPs within the same block and not across the blocks.

Accordingly, we refer these GPs from Hanwada and Koilkonda as the “Pure Control GPs”.

                                               8
One of the criticisms of randomized experiments in social science has been external validity

which raises concerns about the validity of the causal estimates in a different setting (Angrist

and Pischke, 2008; Deaton and Cartwright, 2018; Athey and Imbens, 2017). An obvious concern

revolving this issue is that the protocols and the different components of the intervention may

not be carried out in a different setting because of various factors including those related to

local politics, geography and social dynamics among others. For example, any community

led intervention may not work well in a community where social ties and networks are not as

strong (Cameron et al., 2019). Hence, moving from a controlled setting to a more natural one,

the validity of the treatment effect may be compromised. Accordingly, to ensure and improve

scalability and external validity, we did not randomize the treatment intensity across GPs but

rather let it grow organically and naturally within the GP. In other words, the intensity of the

intervention was allowed to vary depending on the local dynamics as discussed. Except for

the list of interventions, nothing was pre-fixed and the intensity depended on the GP centric

factors including how cooperative the FA is, location of the GP, and the caste composition and

dynamics within the GP. Hence it was higher in a GP which is geographically accessible or has

a supportive FA. In other words, the intensity varied across the GPs that were intervened, but

remained uniform within the GP. The advantage is such design ensures that the intervention

is reasonably scalable and hence our estimations and inferences might be more valid externally

without them being biased.

   Notably in appendix fig. A1, we show that the distribution of a set of GP level characteristics

(caste and gender composition, population, proportion of mobile phone owners, education of

the FA, pre-intervention average days of work under MGNREGS and average delays along

with distance from the nearest town) is similar across the intervention and the contaminated

control GPs. Further, we also statistically test the equality of distribution through Kolmogorov

Smirnov test and for none of the tests, we are able to reject the null hypothesis of equality of

the distributions (Appendix table A.1)3 .
  3 Details  about the test can be accessed from https://ocw.mit.edu/courses/mathematics/18-443-statistics-
for-applications-fall-2006/lecture-notes/lecture14.pdf (accessed on August 3, 2019)

                                                    9
3.3 Survey Design
The data used in the paper to evaluate the impact of the intervention is based out of two
waves of household survey. The baseline survey was conducted in September to October, 2017
before the start of the intervention. The endline survey was conducted from December 2018 to
February 2019 after thirteen months of exposure to the intervention. The same households and
respondents that were surveyed in the baseline survey were also surveyed during the endline
survey. Additionally a midline survey was conducted to get a stock of the nature and status
of the intervention. We use the midline survey to contextualize the empirical findings from the
regressions.
For the baseline survey, within each Gram Panchayat (GP), among the job card holders,
approximately 15 households (after adequate power calculations) were randomly chosen among
the list of households who have worked at least once in 2016-17. The total number of GPs
surveyed from the four blocks in each wave is 96 and the total number of households surveyed
is 1444 and 1352 in baseline and endline survey respectively. Some households are left out in
the second phase since the respondents were not found even after three visits. A week long
(mid line) visit was made to the respective treatment blocks to understand and to take stock of
the intervention process from both the beneficiaries and intervention implementing authorities.
Further, we gathered qualitative information about the implementation of MGNREGS. More
specifically, we visited two GPs each from Damaragidda and Maddur blocks and conducted
twelve interviews which included four qualitative group discussions with the beneficiaries. We
also conducted separate interviews with the two local intervention functionaries at the block
level and the one who heads both of them.
The survey questionnaire covered a wide range of household information starting from de-
mographic, socio-economic and a detailed set of information on MGNREGS. Apart from the
general questions on the program, some specific questions were asked to get a clear picture on
awareness of the beneficiaries about the scheme and the entitlements (including delay compen-
sation, unemployment allowance, minimum days of work entitlement and wage rates among
10others), process related information including that on bank/ postal accounts and also their
attendance in local level meetings. During endline, in addition to these common set of ques-
tions to all the respondents of the respective households, we ask a set of additional intervention
related questions only to the households belonging to the GPs that are intervened. These
include qualitative/ subjective questions on their perception about the impact of MGNREGS
in the last one year. It also included some objective questions on the intervention including
those on getting mobile phone calls and attendance in local meetings among others. Apart
from the household survey, information on the FA from each GP was gathered. Besides, a GP
questionnaire was administered to capture salient characteristics of these GPs.
The tablet based survey was executed by using Google form in the first phase. However,
in the second phase we have used KoBoToolbox, an android based ODK-interface application
developed by the Harvard humanitarian initiative4 . The survey team consisted of enumerators
who have completed at least higher secondary education and were conversant in Telugu as well
as the local dialects. However, the midline survey was conducted by the authors.
3.4 Outcome Variables
The paper evaluates the impact of the intervention discussed on a set of outcome variables that
gives an indication of the level of awareness, process mechanism, delay in payments and uptake
of the program in terms of the number of days of work. The first set of variables included six
indicators of awareness levels: (i) whether the respondent knows about the work entitlement
of 100 days every year to each household (ii) whether the respondent knows about the process
of work application in MGNREGS (iii) whether the respondent knows about unemployment
allowance been given in case of not receiving work (iv) whether the respondent knows about
the number of days after completion of work within which the payment has to be made (15
days); (v) whether the respondent knows the correct wage rate (Rs. 197 for baseline and Rs.
205 for endline) and (vi) whether the respondent knows about delay compensation. Please note
4 More information can be obtained from https://www.kobotoolbox.org/(accessed on June 30, 2019)
11that these outcomes are binary in nature5 .
Further, we calculate an index of awareness using two methods for each respondent based
on the responses on the first five questions. We consider the first five variables as we did not
collect the relevant information for the sixth variable (on delay compensation) in the endline
survey. The first method is a simple average of all the five responses and hence can take five
values: 0, 0.2, 0.4, 0.8, 1. The second method is a weighted average where the weights are
proportional to the inverse of the probability of being aware about that particular indicator
among the sampled respondent in the baseline. Hence if large proportion of the respondents is
not aware of a particular entitlement, being aware of that entitlement gets a higher weightage.
In our case, the probability of knowing about unemployment allowance among the respondents
is lowest among the five indicators of awareness and hence gets the highest weightage. Most
respondents know about the entitlement of 100 work days under MGNREGS every year and this
indicator accordingly gets the lowest weightage. Both these indices of awareness are continuous
in nature.
The next set of variables indicates process related information and the respondent’s atten-
dance in local meetings and raising concerns about MGNREGS. The objective is to examine
the impact of the intervention on improvement in the process of the program implementation
and attendance in meetings and raising concerns about the program. These variables include:
(i) whether the jobcard is updated by FA in the last one year before the survey; (ii) ) whether a
receipt was received for work application in the last one year before the survey (iii) whether the
respondent had to travel more than once for withdrawing wages from bank/ postal accounts
last time they worked; (iv) whether any members attended the Gram Sabha (GS) meetings6 ;
(v) whether any members attended the social audit meetings and (vi) whether concerns about
MGNREGS was raised in the GS meetings. All these six indicators are binary in nature.
The variables on delay and uptake are used directly from the online administrative data on
5 Based on the distribution, we consider the range of Rs. 180 to 200 as the correct wage during baseline and
Rs. 202 to 220 during the endline.
6 The Gram Sabha (GS) is a forum which is used by the people to discuss local governance, and make need-
based plans for the village.
12MGNREGS. The specifics of these variables have been discussed in the “Results” section.
3.5 Control variables
In the regressions, we include a set control variables measured during baseline to increase the
precision of the estimates. The control variables allow us to control for minor differences in the
characteristics of the individuals and their households that may account for the differences in the
outcomes variables. The list of control variables measured includes gender, age and education
of the respondent since they are directly associated with the outcome variables. The economic
conditions of the household matter as well since economically better off households are expected
to be better aware and extract relatively higher gains from the intervention. Accordingly,
we include variables like type of households (non-cemented or not), land cultivated by the
household in acre, number of livestock that include ox, bullocks and cows, main occupation
of the household (casual labour or not) and whether the household has a toilet or not. An
increase in the number of adult members in the household may indicate more individuals who
can work under MGNREGS and hence we include this as a control variable in the regression.
Further, because of the fact that media can influence awareness levels and transparency in
the proceedings of any programs locally, we include whether the household members watch
television. In addition, since caste is one of the major barriers of social inclusion, we introduce
whether the respondent belongs to the Scheduled Caste/ Schedule Tribe (SC/ST) community
(Sundaram and Tendulkar, 2003; Deshpande, 2011). Possession of mobile phones is also added
as a control variable.
3.6 Randomization process
As indicated earlier, the intervention was randomized at the GP level in two blocks. The ran-
domization process is stratified across blocks to control for the systematic differences across the
two blocks. To ensure success of this randomization for the sample of 1352 respondents that
were surveyed across two waves, we compare the baseline characteristics across the respondents
13from treated and contaminated control GPs. Table 2 gives the results from the difference in
means test between the respondents from the two groups. We find that the mean levels of none
of the thirteen outcome variables are statistically significant at 5% level. We look at 17 control
variables that include the characteristics of the respondent and their households. Four variables
that include proportion of respondents who are illiterate, mean age, proportion of houses which
are non-cemented and proportion of households whose main occupation is casual labour are
found to be significantly different in the two arms. While this imbalance is likely to bias the
estimate, our regression strategy controls for these household and respondent characteristics
and also the outcome variable measured during the baseline along with the block fixed effects.
Hence we minimize the bias when we estimate the impact of the treatment.
[Table 2 here]
4 Estimation Strategy
To estimate the impact of the intervention on the outcomes variables pertaining to MGNREGS
as discussed, we make use the randomized experimental design. The advantage of the ran-
domized experiment is to control the bias that may occur due to selection in and out of the
program. In other words, since the intervention is randomly allocated across the GPs, there
are no underlying variables that may alter the outcome variables and also affect whether the
GP is treated or not. In this way, we would get rid of the selection or omitted variable bias
that may yield biased estimates of the impact.
Despite our survey design having a baseline and endline survey, we do not use the Difference
in Difference methodology to obtain the causal estimate. Instead we make use of the Analysis
of Covariance (ANCOVA) to estimate the treatment effect which controls for the lagged value
of the outcome variables that we gathered during the baseline survey. McKenzie (2012) indi-
cates when autocorrelation of outcomes is low, ANCOVA estimates can be preferred over the
14Difference in Difference estimates. Such approach averages out the noise and increases power.
Intuitively, the Difference in Difference estimate overcorrects for the baseline imbalances when
the autocorrelation is low. However, ANCOVA leads to more efficient causal estimation as it
adjust for these imbalances according to the degree of correlation (Hidrobo et al., 2016). Since
the autocorrelation of the outcome variables is low and most of the variables of interest are
binary in nature, we estimate the following probit model:
P rob(Yij1 = 1) = φ(α + β.Tj + χ.Yij0 + λ.Xi + δ.Bij ) (1)
Here Yij1 is the binary outcome variable of interest for individual i, from GP, j, which is
the cluster in our case at endline. Yij0 is the same variable at baseline. These binary outcomes
include a set of awareness and process related variables as discussed. Tj is the treatment
dummy variable which equal 1 if the GP, j is in the treatment arm. Xi is the vector of control
variables that include baseline individual and household level characteristics of individual, i.
Bij is the vector of block level dummies. In all the regressions, the standard errors are robust
and clustered at the GP level, which is the level of randomization in our case. β is the estimate
of the causal impact of the intervention.
Notably, for the some of the outcome variables of interest, the type of the variable is con-
tinuous instead of binary. For estimating the impact of treatment on these variables, we use
pooled Ordinary Least Square (OLS) regressions.
To calculate the effect of the spillover, we categorize the control GPs into two groups: the
control GPs within the intervening blocks of Damaragidda and Maddur, which we refer as
contaminated control and the controls GPs from the non-intervening blocks also referred as
pure control GPs (in the Hanwada and Koilkonda block). Accordingly two dummy variables
are generated for control GPs: one for the contaminated control and the other for the pure
control. We specifically make this adjustment to estimate the impact of the spillovers and pure
treatment effect. If the pure control GPs are taken as the reference group, the marginal effect
associated with the contaminated control GP dummy gives us the estimate of the spillover
15effect and that association with the treatment dummy would give us the estimate of the pure
treatment effect. Formally we estimate the following probit model:
P rob(Yij1 = 1) = φ(α + βT .Tj + βs .Cjc + χ.Yij0 + λ.Xi + δ.Bij ) (2)
Here everything remains same except Cjc which is the dummy for contaminated GPs. The
βT and βS are the estimators and they measure the pure treatment effect and the spillover
effect respectively. To test whether these estimators are statistically different from each other,
the test of equality has been conducted and the resulting p-values have been reported. This
test tests whether the treatment effect is indeed greater than the spillover effect.
To calculate the treatment intensity, we take five indicators at the GP level for all the GPs
in the treatment arm. These indicators of intervention intensity are as follows:
(i) Number of phone calls made per phone number collected within the GP
(ii) Number of phone calls received per phone number collected within the GP
(iii) Number of messages sent per phone number collected within the GP
(iv) Number of times, the list with the names of wage beneficiaries has been pasted in the GP
(v) Proportion of respondents within the GP who knows at least one of the three main persons
involved in the intervention process.
Using these five indicators, we calculate the intensity of treatment using the Principal Com-
ponent Analysis (PCA) and normalize it in the range of [0,1]. To measure the impact of these
two categories of intervention intensity, we estimate the following pooled probit model:
P rob(Yij1 = 1) = φ(α + βT .Tj + βint .IT + χ.Yij0 + λ.Xi + δ.Bij ) (3)
Here IT indexes the normalized intensity of treatment calculated and βint gives the average
estimate of the impact of intensity of treatment controlling for the treated GPs. Please note
that for the non-intervened GPs, the value of IT is taken to be 0.
16It should be noted that though the assignment of GPs in the treatment and control arm
within the Damaragidda and Maddur block has been random, the intensity of the treatment has
not been randomly fixed. As discussed, it depends on GP level factors including the geography,
accessibility and cooperativeness of the local level implementers. However, we argue since
the assignment has been random, the distribution of these GP level factors is similar across
the treatment and control arm. In fact we show that the distribution across the GPs in the
intervention and contaminated control arm is similar (Fig A.1 and Table A.1). In terms of
location, 20 (out of 23) contaminated control GPs are situated in the roadside whereas for
treatment GPs, it is 22 (out of 26). Further, in the regression model, we are controlling for
the lagged value of the outcome variable, along with the economic and social characteristics of
the individuals and households which are likely to be correlated with these GP level factors.
It is because of these reasons that βint is the unbiased estimators of heterogeneous intensity of
treatment.
5 Results
5.1 Impact of pooled treatment
As discussed, we first show the effect of the intervention on the discussed six outcomes of
awareness of the respondents controlling for their responses in the baseline survey as well
as their own and household characteristics along with the two awareness indices. The six
outcome variables of awareness are binary in nature and accordingly we run probit regression
to estimate the impact of the treatment on these indicators. For the awareness indices, we
use pooled OLS regression to estimate the impact controlling for the index value during the
baseline and the individual and household characteristics. It should also be noted that the
information about awareness of the entitlement of delayed payment compensation was not
collected during the baseline survey. Hence to estimate the impact of the intervention on this
indicator, we use a pooled probit model but did not control for the baseline level awareness of
17delayed compensation. The assumption is at the baseline, there is no significant difference in
awareness levels between respondents in the treatment and control arm. Intuitively this makes
sense as we did not find significant difference between the treatment and the control arm for
all the other five indicators of entitlement awareness (Table 2).
The estimation results are presented with two different specifications to estimate equation
1 and 2. The first specification incorporates treatment as a dummy and takes the value of 1
for the treated GPs. The second specification categorizes the control GPs into two groups: the
contaminated control group and the pure control group. The pure control GPs are taken as the
reference group. Further, we also compare the treatment GPs with the contaminated control
GPs.
Table 3 presents the estimation results from pooled regression as depicted in equation 1
and 2. The coefficients of the probit model are changed to the marginal effects which are
calculated at the mean value of the independent variables and presented. The first five columns
show the impact of the intervention of the five questions on awareness of the entitlements.
The next two columns (6 and 7) show the causal estimates on the two indices of awareness
and the last column shows the impact on awareness on delayed payment compensation. The
findings indicate a definite positive and significant impact of the intervention on awareness. We
find about 20 to 30 percentage point increase in the probability of being aware of the different
entitlements. Notably, our results indicate significant spillover impact on some of the indicators
of awareness. However, the effect size is found to be lower as we observe the probability of being
aware for respondents from a contaminated control GP is 7 to 15 percentage points more than
the probability of the respondent from a pure control GP. Net of spillover effect, the effect size
of increase in probability of being aware in these entitlements lies in the range of about 12 to
36 percentage points.
This finding is substantiated by the qualitative discussions that we had during the midline
survey in May 2018. In three out of the four intervention GPs that we visited, the villagers
seem to be aware of the existing MGNREGS wage rate and work application procedure. Some
18among them attributed this to the mobile phone calls from the intervention team. One among
them echoed “We came to know of different provisions of MGNREGS through the Upadhi Hami
Phone Radio which we otherwise would not have known. This has helped us to demand correct
wages from the FA.”
In the next table (table 4), the results from the pooled probit regression to estimate the
impact on the process and attendance in community meetings is documented. Column 1 to 3
show the results of the impact of three process mechanism variables already discussed. Column
(4), (5) and (6) show the causal impact on community meetings namely attendance in GS
meetings, social audit and raising concerns on MGNREGS in the GS meetings respectively.
The findings reveal consistent and significantly positive impact on the probability of re-
ceiving a receipt for work application (at 5% level) as we find around 10-13 percentage points
increase in the probability because of the intervention. Similar effect was found on the prob-
ability of travelling to banks/ post offices as we find 10-14 percentage points reduction in the
probability due to the intervention. The impact on attendance in Gram sabha and social audit
meetings seem to be robust and the findings indicate a 12-14 and 16-27 percentage point in-
crease respectively. The probability of raising concerns on MGNREGS in the GS meeting also
seems to be significantly higher in the treatment GPs. Unlike earlier case, we find no spillover
effect on these process variables.
However, it is worthwhile to note that the chances of participation in social audit meetings
and MGNREGS being discussed in the GS meetings is higher for the contaminated control
GPs in the intervention blocks in comparison to the pure control GPs of the non-intervention
blocks. This might be because of discussions among villagers within and across adjacent GPs
about MGNREGS and the GS meetings being a platform to discuss the grievances. In other
words, it is possible that some households benefitted discussing MGNREGS concerns in the GS
meetings in the treatment GPs and this information got spread in the adjacent control GPs.
Accordingly, in control GPs of the intervention blocks, beneficiaries started raising concerns
on MGNREGS in their GS meetings. Such type of spillovers are unlikely to take place across
19GPs located in different blocks and hence we do not see such an effect in the pure control GPs
located in the non-intervention blocks.
[Table 3 here]
[Table 4 here]
5.2 Impact of treatment intensity
As discussed, we use pooled probit and OLS regression model to estimate the causal impact
of the heterogeneous levels of treatment (equation 3). Like in the other case, we show results
for two samples of respondents: (i) treatment GPs and all control GPs and (ii) treatment GPs
and contaminated control GPs from the intervention blocks.
The results from the regression which show the impact of the treatment levels on awareness
of entitlements and process mechanisms are shown in table 5 and 6 respectively. For most of
the indicators, no significant impact of intensity of treatment is found controlling for the other
confounders as well as whether the respondent comes from a treated GP. However for couple
of variables on awareness and frequency of travel to banks/ post offices, we find a significant
impact. One standard deviation in the intensity of treatment is found to increase the probability
of the respondents being aware of work entitlement and process of work application by close
to 17 and 20 percentage points respectively while the same increase is found to decrease the
probability of traveling more than once to banks and post offices by close to 13 percentage
points. We find similar effect when we compare the treated GPs with the contaminated control
GPs. In other words, although the intervention is found to have a significant effect of awareness,
process related mechanisms and participation in local meetings, the impact of intensity of
treatment seems to be limited.
[Table 5 here]
[Table 6 here]
205.3 Impact on delay
One of the main ingredients of our intervention has been crawling of publicly available mi-
cro level administrative data on MGNREGS and using it to improve implementation of the
program. A major problem that has been raised time and again in MGNREGS has been the
prevalence of delayed payment. Extant literature and field reports across the country has re-
ported extensive delayed payments under the program which undermines its efficacy (Basu and
Sen, 2015; Masiero and Maiorano, 2018; Narayanan et al., 2017).
The system of payment under MGNREGS in Telangana is as follows. After the work gets
completed, there is a physical verification of the work largely by the office of the Block Devel-
opment Officer (BDO). Post verification, a Fund Transfer Order (FTO), which is analogous to
a payorder is generated at the local level. The FTO is then approved by the central ministry,
which sends its details to payment intermediaries. These payment intermediaries are responsi-
ble for electronic transfer of wages. The final payment status is reflected in the public website
and gives information on the credited date of the wages in the relevant bank or postal office for
payments which are not rejected 7 .
As evident, large part of this payment process is done at the block and the central/ state
level. Hence gains on reduction of delay in payment because of the intervention are likely to
be limited. However it can still facilitate the verification process of the works. Though the
verification of work is done at the block level, the local level FAs can influence the block level
authorities to speed up the process of verification. Because of the fact that the intervention
team works alongside the FA on many issues, the process of verification by the FA may speed
up though the team do not directly intervene on this. Therefore, generation of the FTO or
the payorder may be faster. Accordingly using jobcard level data from all the GPs of the four
blocks, we test if the intervention has been influential in earlier generation of payorder.
For this purpose, we collect the data on work completion date starting from January 2017
till April 2019 and the corresponding payorder generation date for all job cards from the four
7 Refer to Narayanan et al. (2019) for a more vivid description of the payment process.
21blocks. Next, for all the payments made, we calculate the month-wise mean time difference
between the work completion date and the payorder generation date for each job card starting
from January 2017 till April 2019. We call this time difference as the payorder delay and is
measured in days.
The average monthly difference in payorder delay between the intervention and the two
types of control GPs (contaminated and pure) is calculated and then plotted against the months
starting from January 2017 till April 2019 (Figure 3). The period of intervention from November
2017 till November 2018 is also marked in the plot. A relative drop in reduction in payorder
generation delay indicates a corresponding drop in the intervention GPs in comparison to
the corresponding type of control GPs. However what we observe is a inconsistent drop in
the payorder delay during the intervention that seems to indicate the negligible effect of the
intervention. Our discussions with the FA and the intervention supervisors indicate that much
of the responsibility of payorder generation remains with the officials at the block level. Even
if an FA wants to fasten this process, it would be largely dependent on block level officials who
are directly responsible for verification of the works only after which the payorder is generated.
Since the intervention is highly localized and did not involve block level officials, as expected
the impact is found to be negligible.
[Figure 3 here]
Similarly, we examine if the intervention actually had an effect on total delay in payments,
which we define as the number of days between the work completion date till the date when the
wage got credited in the bank or postal account. Figure 4 presents similar plots as shown in
figure 3 for every month starting from January 2017. As one would expect, no consistent drop
in total delay is observed during the intervention period in either of the two plots indicating
absence of impact of the intervention on total delay.
[Figure 4 here]
225.4 Impact on last mile delay
Apart from the delay in payments which is largely dependent on the higher level officials at the
block, state and the central level, one further problem surrounding payments is the associated
last mile delays. Due to various reasons including corruption and lack of information among
others, the money is not debited from bank/postal accounts once it is credited though the
beneficiaries would want to. In other words, it is often the case that the beneficiaries are not
informed about the money after being credited in their account and hence the beneficiaries do
not immediately get the money for various reasons. This last mile delay is not trivial as data
shows a mean last mile delay of more than 44 days in 2016 for beneficiaries who maintain postal
accounts in these four blocks with delays extending for months in some cases.
Our intervention allows the technical team to crawl the available public data and provide
information on the credited date that is the exact date when the money is credited in the bank
or postal account of the beneficiary. Once the payment is credited in the postal/ bank accounts,
the intervention team pastes the list of beneficiaries in places that are easily accessible to all in
the GP. Further the broadcast is made through mobile phones to inform the beneficiaries that
the payments have been credited in their account. This piece of intervention is expected to
reduce last mile delays as the beneficiaries having postal accounts would start demanding the
credited wages from the BPMs. They would also have to travel less to the banks for getting the
wage. The fact that our intervention has been found to have a significant effect on reduction
in number of trips to the banks/ post offices for wage collection indicates its success.
The theoretical framework can be conceptualized as follows. Consider M amount of money
has to be disbursed by the BPM but she holds it for time period, t before distributing it to the
beneficiaries. Hence her earnings is the interest earned given by I(t) = M (1 + r)t − M , where
r is the interest rate and r > 0. Here I(t) is a convex function of t. Now consider that the
probability of the BPM being caught and punished is given by p(t), where p0 (t) > 0, p00 (t) > 0,
and p(t) → 1 for large t. The fine imposed is also assumed to be a function of t and is denoted
by F (t) such that F 0 (t) > 0 and F 00 (t) > 0. Hence the expected fine at t would be p(t).F (t).
23The BPM would delay till time period, t if I(t) > p(t).F (t). The graphical representation
would look as follows:
[Figure 5 here]
Here we consider two situations: pre-intervention and post-intervention periods, denoted by
the subscript 1 and 2 respectively. t∗1 is the equilibrium time period till when would the BPM
hold the money that needs to be distributed in the absence of treatment. Since the intervention
essentially increases the level of p(t), there would be an outward shift of p(t).F (t) as well and
hence t∗2 would be the new equilibrium during the intervention, which would shift towards left
as the intensity of treatment increases.
Notably, the crawled RN6 data allows us to get information on the credited and debited
date for all jobcards from the GPs which use postal accounts to disburse the MGNREGS
money to the beneficiaries8 . We use this data to calculate at month-wise mean difference in
the credited and debited dates across all these GPs that use postal accounts starting from
January 2017 from when the data is available9 . Next, the difference between the intervention
GPs and contaminated control GPs and pure control GPs are plotted for all the month starting
from January 2017 and presented. Figure 5 presents the difference between the intervention
and contaminated control GPs and figure 6 gives the difference between the intervention and
pure control GPs. This difference is observed across all the months starting from January
2017. Further we plot the total number of list pastings done in the intervention GPs over these
months to look at the possible causal effect on last mile delays.
The findings reveal sizeable positive impact of the intervention when the intervention and
the contaminated control GPs are compared on reduction of these delays. The observations
from figure 6 reveal prior to the intervention, the difference in delay across the treatment and
the control GPs remained close to zero. However after November 2017 (month number 11)
when the intervention started, the number of lists pasted in the early months have been low
and ranged between 6 to 11 every month till March 2018. Since April 2018, the number of
8 The RN6 table in the micro level public data gives the information on credited and debited date.
9 Respondents in 70 out of the 96 GPs surveyed have postal accounts.
24list pasted increased to 26 and went up to 60 till November 2018. It is during this period
that we observe consistently lower last mile delay in the intervention GPs in comparison to the
control GPs in the same blocks. Interestingly, we find a positive association of the number of
list pastings and the reduction in last mile delay. When we compare the intervention GPs with
the pure control GPs in Hanwada and Koilkonda blocks (figure 7), we also observe a decrease
in levels of last mile delayed payments. This becomes evident when the last mile delay during
months just before the intervention (June to October 2017) is compared to that in June to
October in 2018 during the implementation phase of the intervention.
[Figure 6 here]
[Figure 7 here]
One may argue that the intervention had limited effect on delay in payments as it only
affects the last mile local level delays. While we agree the intervention had limited impact on
reduction in delayed payment at higher levels, a reduction in last mile delay is also significant
from the point of view of the beneficiary. A look into last mile delays before the start of the
intervention in postal accounts shows an average delay of about 23 days from December 2016
to October 2017 which crosses 100 days in some cases. In fact in December 2016 and July
2017, the average last mile delay was 41 days and 35 days respectively. Hence reduction in
delay duration even if it is last mile in nature is significant and it is here that our intervention
assumes importance.
Indeed our qualitative work during the midline survey seem to indicate that many bene-
ficiaries of the program received messages related to the money credited in their bank/postal
account which can result in reduction of last mile delay in payments. One of the respondents
reported: ‘Earlier we were not aware of the amount of money credited in our account. We used
to ask the FA but he was not able to respond. Therefore we had to make multiple trips to the
bank. Now we get the information through phone calls. Even if we miss the call, we can see our
names through the list pasted in GP office. This has helped us a lot’. We seem to get a similar
picture from the endline survey data as well which gathered information from the respondents
25You can also read