Saratoga Springs TRANSPORTATION MASTER PLAN 2021
←
→
Page content transcription
If your browser does not render page correctly, please read the page content below
Saratoga Springs
T R A N S P O R TAT I O N M A S T E R P L A N

                    2021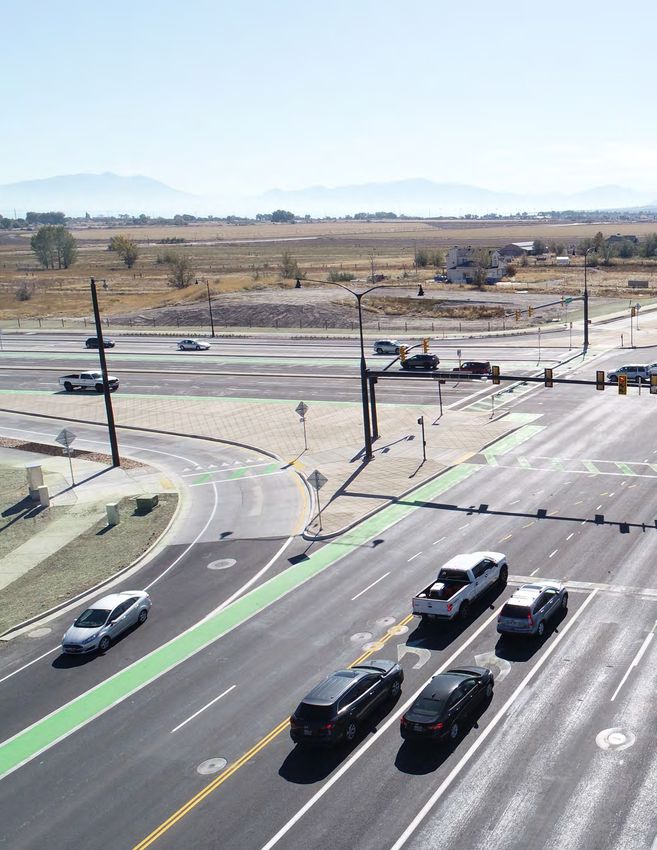
Ta b l e o f C o n t e n t s
       1 executive summary                                                                                            1
       2 where we are                                                                                                 6
       Zoning and Land-use...................................................................................6
       Demographics................................................................................................8
       Transportation System ............................................................................. 12
       Safety.......................................................................................................... 17
       Active Transportation............................................................................... 23
       Transit. ....................................................................................................... 25
       3 where we’re going                                                                                        27
       Model Years and Results. ........................................................................ 30
       Recommended 2050 Roadway Network................................................. 34
       Summary of What the Future Holds. ..................................................... 37
       4 what we heard                                                                                            40
       Community Input ....................................................................................... 40
       5 Recommendations                                                                                          47
       Future Functional Classifications.......................................................... 47
       Standards and Cross-sections. ............................................................... 49
       Access Management ................................................................................. 52
       Traffic Calming. ........................................................................................ 54
       Traffic Impact Studies............................................................................... 55
       Transit. ....................................................................................................... 58
       6 what’s the plan                                                                                          60
       Capital Facilities ...................................................................................... 60
       Funding ..................................................................................................... 65

i   Saratoga Springs Transportation Master Plan
Ta b l e s a n d Fi g u r e s
Table 1-1: Roadway Projects.......................................................................................................... 3
Table 1-4: Signals & Roundabout Projects................................................................................... 5
Figure 2-2: Historic and Future Population.................................................................................. 8
Figure 2-3: Population Age Distribution....................................................................................... 9
Table 2-1: Population and Households......................................................................................... 9
Figure 2-4: Total Jobs within Saratoga Springs........................................................................ 10
Table 2- 2: Largest Employers in Saratoga Springs................................................................. 10
Figure 2-5: Inflow/Outflow Commuting Patterns...................................................................... 11
Figure 2-6: Mobility vs. Access...................................................................................................... 12
Table 2-3: Roadway Classification............................................................................................... 14
Table 2-4: Intersection Level of Service Criteria....................................................................... 15
Table 2-5: Daily Level of Service Capacity................................................................................. 17
Figure 2-9: Severity of Crash Chart ............................................................................................ 17
Figure 2 11 : Manner of Crashes Chart....................................................................................... 19
Figure 2 13: Bicycle Crash Severity Chart ................................................................................. 21
Figure 2 14: Pedestrian Crash Severity Chart .......................................................................... 21
Figure 3-2: Saratoga Springs Projected Growth....................................................................... 29
Figure 4-1: Respondents’ mode of transportation usage....................................................... 40
Figure 4-2: Respondents’ perception of overall transportation safety in the city............. 42
Figure 4-3: Respondents’ perception of overall congestion in the city................................ 42
Figure 4-4: Respondents’ desire for transportation improvements in the city................... 44
Figure 4-5: Respondents’ desire for transportation projects in the city.............................. 44
Figure 4-6: Respondents’ opinions of the most significant transportation issues............. 45
Figure 5-2: 7-Lane Major Arterial Cross-section....................................................................... 49
Figure 5-3: 5-Lane Major Arterial Cross-section....................................................................... 50
Figure 5-4: Alternative 5-Lane Major Arterial Cross-section.................................................. 50
Figure 5-5: 5-Lane Minor Arterial Cross-section....................................................................... 50
Figure 5-6: 3-Lane & 2-Lane Collector Cross-section ............................................................. 51
Figure 5-7: Local Street Cross-section ....................................................................................... 51
Figure 5-8: Mobility vs. Access...................................................................................................... 53
Table 5-1: Existing and Proposed Active Transportation Facilities in Miles........................ 56
Table 6-1: Roadway Projects........................................................................................................ 62
Table 6-4: Signals & Roundabout Projects................................................................................. 64

                                                                           Saratoga Springs Transportation Master Plan                     ii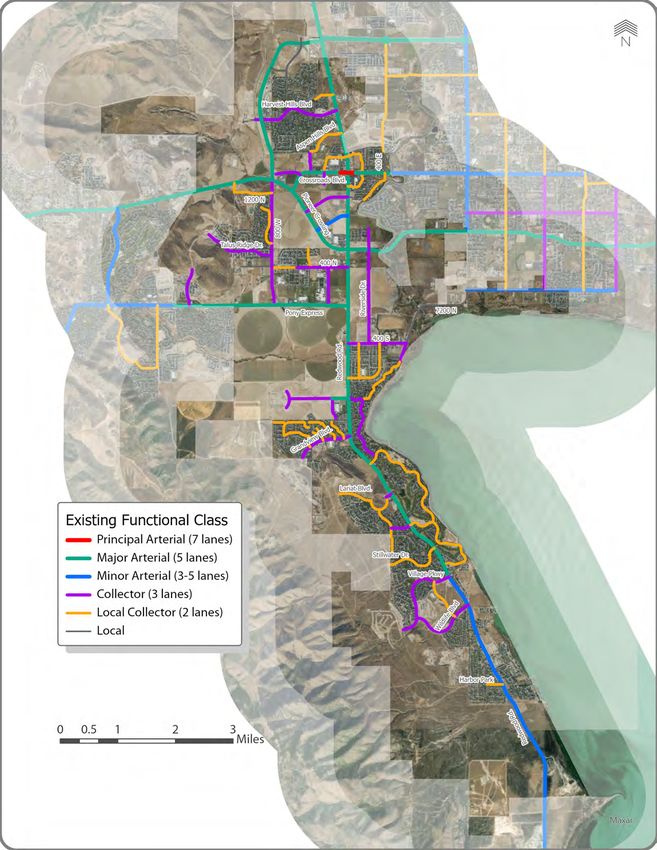
Maps
      Figure 1-1: Draft Projects................................................................................................................ 2
      Figure 1-2: Traffic Signals and Roundabouts.............................................................................. 4
      Figure 2-1: Current Land-use.......................................................................................................... 7
      Figure 2-7: Existing Functional Classification............................................................................ 13
      Figure 2-8: Map of Level of Service ............................................................................................ 16
      Figure 2-10: Crashes by Severity.................................................................................................. 18
      Figure 2-12: Crashes by Manner of Collision............................................................................. 20
      Figure 2-15: Bicycle and Pedestrian Crashes............................................................................. 22
      Figure 2-16: Existing Active Transportation............................................................................... 24
      Figure 2-17: Existing Transit.......................................................................................................... 26
      Figure 3-1: General Land-use Plan............................................................................................... 28
      Figure 3-3: 2030 No Build LOS...................................................................................................... 31
      Figure 3-4: 2040 No Build LOS...................................................................................................... 32
      Figure 3-5: 2050 No Build LOS...................................................................................................... 33
      Figure 3-6: MAG TransPlan 50 Highway Projects..................................................................... 36
      Figure 3-7: Year 2050 Planned LOS............................................................................................. 38
      Figure 3-8:2050 LOS with Freeway.............................................................................................. 39
      Figure 4-7: Map of Transportation Issues from Survey........................................................... 46
      Figure 5-1: Future Functional Classifications ............................................................................ 48
      Figure 5-9: Future Active Transportation................................................................................... 57
      Figure 5-10: Future Transit............................................................................................................ 59
      Figure 6-1: Draft Projects.............................................................................................................. 61
      Figure 6-2: Traffic Signals and Roundabouts............................................................................ 63

iii    Saratoga Springs Transportation Master Plan
1 executive summary

Saratoga Springs was incorporated in December of 1997 and became a city in 2001. Since its inception, Saratoga
Springs has experienced continuous rapid growth and is now home to well over 30,000 residents, close to doubling its
2010 US Census population of 17,781 just a decade ago.

In 2020, new developments of residential roads and homes can be seen across the city, and large businesses like
Costco are being constructed to meet the demand for this rapidly growing population. The City’s location, on the
western edge of the Wasatch Front and nestled along Utah Lake, is attractive to its current and future residents and
offers a feeling of getting away from the hustle and bustle that exists along the eastern side of the central valley and
the I-15 Corridor.

For Saratoga Springs to continue to provide an atmosphere that retains a bucolic feel, its transportation system
must be designed to handle the demand for mobility placed upon it. At its core, mobility and transportation is about
moving people and goods. But, what makes a truly resilient transportation network, one which can meet the demand
of its users, is access and choice. This Transportation Master Plan (TMP) looks at Saratoga Springs’ projected growth
combined with the city’s unique geography to determine what is needed to ensure residents continue to have both
access to their origins and destinations and choice of how to get there.

This TMP provides a recommended project list as guidance for officials and residents as the City plans for growth. Each
new development brings more residents and traffic, while available land for the transportation network becomes
more finite. Recommendations from this TMP are derived from traffic modeling and analysis out to 2050 that have
incorporated specific opportunities and challenges unique to Saratoga Springs to help ensure that the occurring
growth is predicated by prudent and throughly-informed decisions.

Figure 1-1 is map of the recommended transportation improvements organized by phase. Tables 1-1, 1-2, and 1-3 are
the phased lists of these projects. Developer-driven projects are unphased and should be built as development occurs.
Intersection improvements are mapped in Figure 1-2 and listed in Table 1-4.

                                                                 Saratoga Springs Transportation Master Plan               1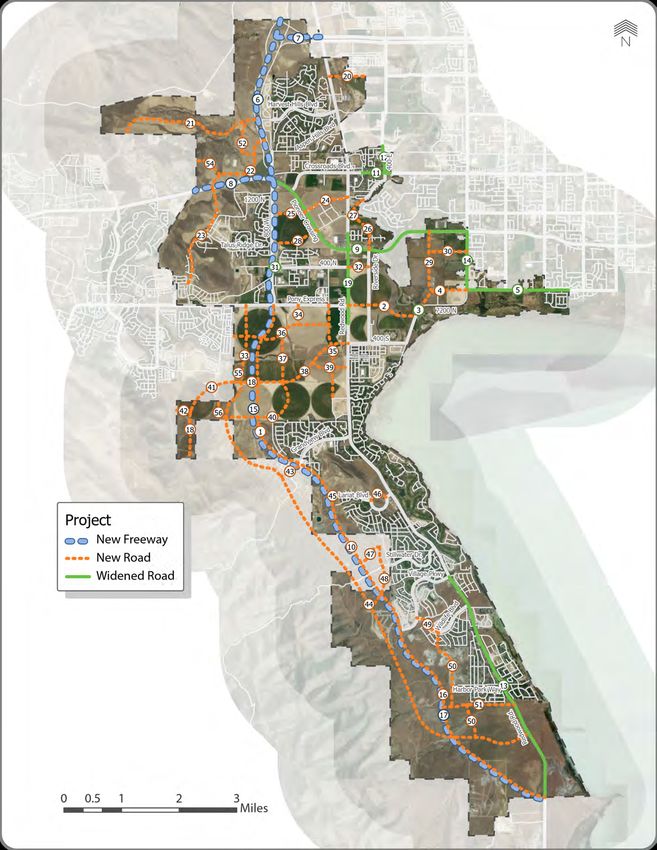
Figure 1-1: Draft Projects

2     Saratoga Springs Transportation Master Plan
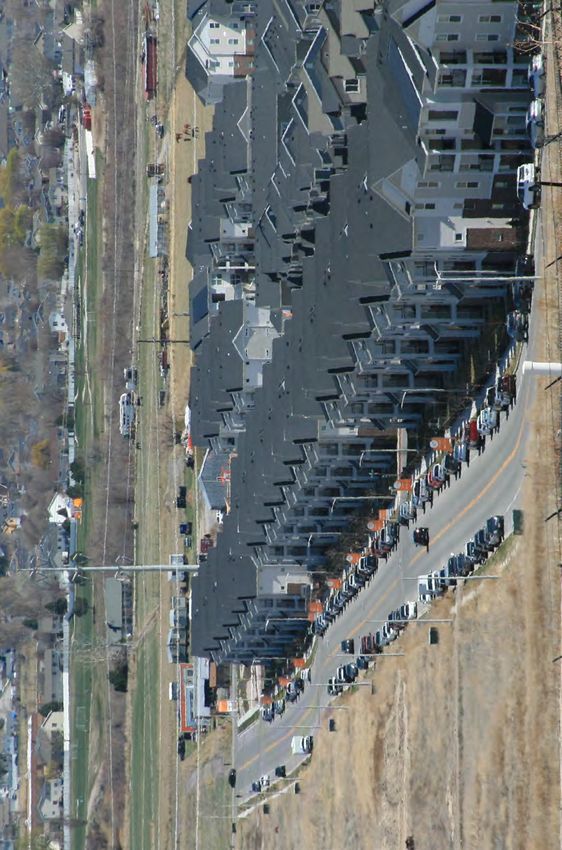
Table 1-1: Roadway Projects
ROADWAY PROJECT
Project # Location Project Type Functional Class Jurisdiction
1 Foothill Boulevard: Pony Express to Lariat Boulevard New Road Minor Arterial Saratoga Springs/MAG
2 Pony Express: Redwood Road to Jordan River New Road Major Arterial Saratoga Springs/MAG
3 Pony Express: Jordan River Widening Major Arterial Saratoga Springs/MAG
4 Pony Express: Jordan River to Saratoga Road New Road Major Arterial Saratoga Springs/MAG
5 Pony Express: Saratoga Road to Eastern City Boundary Widening Major Arterial Saratoga Springs/MAG
6 Mountain View Corridor: Northern City Border to Cedar Fort Road (SR-73) New Road Freeway UDOT
7 2100 North Connection: Eastern City Border to Mountain View Corridor New Road Freeway UDOT
8 Cedar Fort Road (SR-73) Freeway: Mountain View Corridor Frontage to Western City Border Widening Freeway UDOT
9 Pioneer Crossing (SR-145): Eastern City Border to Cedar Fort Road (SR-73) Widening Principal Arterial UDOT
10 Foothill Boulevard: Lariat Boulevard to Hunter Boulevard New Road Minor Arterial Saratoga Springs/MAG
11 Crossroads Boulevard: Commerce Drive to Eastern City Border Widening Principal Arterial Saratoga Springs/MAG
12 400 East: Crossroads Boulevard to Northern City Boundary Widening Major Arterial Saratoga Springs/MAG
13 Redwood Road (SR-68): Fairview Boulevard to Southern City Border Widening Major Arterial UDOT
14 Saratoga Road: Pony Express to Pioneer Crossing (SR-175) (Saratoga Springs Portion) Widening Minor Arterial Saratoga Springs
15 Foothill Freeway: Cedar Fort Freeway (SR-73) to Stillwater Drive New Road Freeway UDOT
16 Foothill Boulevard: Hunter Boulevard to Redwood Road New Road Freeway Saratoga Springs/MAG
17 Foothill Freeway: Stillwater Drive to Redwood Road New Road Freeway UDOT
18 Hidden Valley Highway: Foothill Boulevard to Western City Border New Road Major Arterial Saratoga Springs/MAG
19 Redwood Road (SR-68): North Border to Grandview Boulevard Widening Principal Arterial UDOT
20 2400 North: Redwood Road (SR-68) Eastern Border New Road Collector Saratoga Springs
21 Wild Hills Boulevard: Western City Boundary to Mountain View Corridor New Road Minor Arterial/Collector Saratoga Springs
22 Mount Saratoga Boulevard New Road Collector Saratoga Springs/MAG
23 Mt. Saratoga Boulevard: Cedar Fort Road (SR-73) to Quail Hill Road New Road Collector Saratoga Springs
24 Medical Drive : Pioneer Crossing to Redwood Road New Road Collector Saratoga Springs
25 Medical Drive: Foothill Boulevard to Pioneer Crossing New Road Collector Saratoga Springs
26 Riverside Drive: End of Existing to Pioneer Crossing New Road Collector Saratoga Springs
27 Market Street: Redwood Road (SR-68) to Riverside Drive New Road Collector Saratoga Springs
28 Market Street: Foothill Boulevard to Pioneer Crossing New Road Collector Saratoga Springs
29 500 East: Pony Express to Pioneer Crossing (SR-175) New Road Collector Saratoga Springs
30 550 North: 500 East to Saratoga Road New Road Collector Saratoga Springs
31 400 North: Foothill Boulevard and Grand Sierra Way New Road Collector Saratoga Springs
32 400 North: Redwood Road (SR-68) to Riverside Drive New Road Collector Saratoga Springs
33 Bonneville Drive: Pony Express Pkwy to 1100 South New Road Collector Saratoga Springs
34 500 West: Pony Express to Brookwood Drive New Road Collector Saratoga Springs
35 200 West: Pony Express to Founders Boulevard New Road Collector Saratoga Springs
36 Brookwood Dr: Western Boundary to 200 West New Road Collector Saratoga Springs
37 Ensign Drive: Brookwood Drive to 800 South New Road Collector Saratoga Springs
38 Hidden Valley Drive: Redwood Road to Foothill Boulevard New Road Collector Saratoga Springs
39 New Road: Redwood Road to Hidden Valley Drive New Road Collector Saratoga Springs
40 1100 South: Ensign Drive to Bonneville Drive New Road Collector Saratoga Springs
41 Hidden Valley Drive: City Boundary to City Boundary New Road Minor Arterial Eagle Mt./MAG
42 Hidden Valley Drive: Foothill Boulevard to West Boundary New Road Collector Saratoga Springs
43 Grandview Boulevard: Existing to Bonneville Drive New Road Collector Saratoga Springs
44 Bonneville Drive: 1100 South to Redwood Road (SR-68) New Road Collector Saratoga Springs
45 Lariat Blvd: End of Existing to Foothill Boulevard New Road Local Collector Saratoga Springs
46 Ring Road: Finish Loop Roadway New Road Local Collector Saratoga Springs
47 New Road: Hunter Drive to Foothill Boulevard New Road Collector Saratoga Springs
48 Hunter Drive: New Road to Bonneville Drive New Road Collector Saratoga Springs
49 Wildlife Blvd Extension to Village Parkway Widening Collector Saratoga Springs
50 New Road: Bonneville Drive to Wildlife Boulevard New Road Collector Saratoga Springs
51 New Roadway: Redwood Road to Foothill Boulevard New Road Collector Saratoga Springs
52 Between Wild Hills Boulevard & Mount Saratoga Boulevard New Road Collector Saratoga Springs
Pedestrian Grade- TIF Active / Alpine School
53 Redwood Road at Approx. 4300 South NA
Separated Crossing District
54 1500 North: Eagle Mountain to Mount Saratoga Boulevard New Road Collector Saratoga Springs
55 New Road: Silver Lake Parkway to Bonneville Drive New Road Collector Saratoga Springs
56 New Road: Eagle Mountain to Bonneville Drive New Road Collector Saratoga Springs
Saratoga Springs Transportation Master Plan 3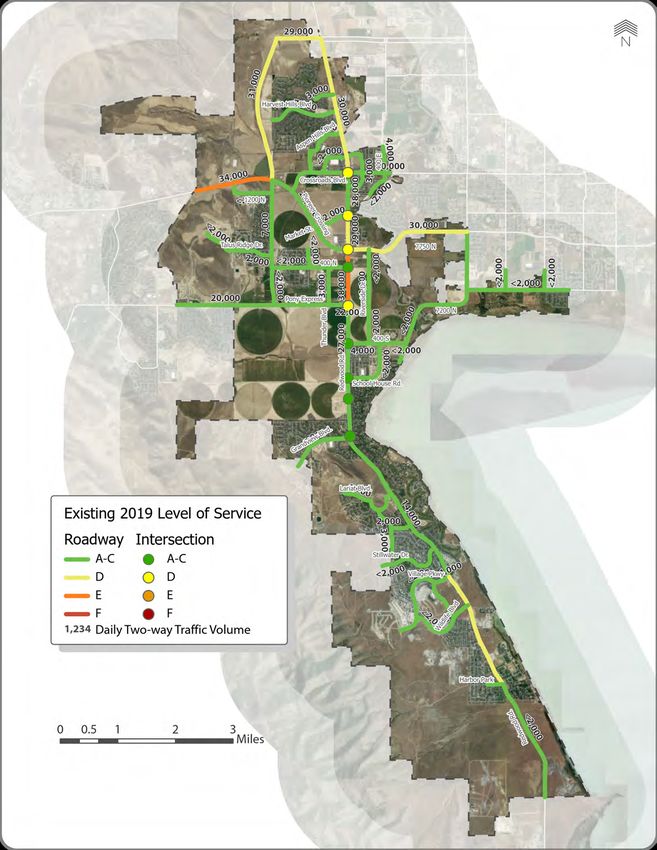
Figure 1-2: Traffic Signals and Roundabouts

4       Saratoga Springs Transportation Master Plan
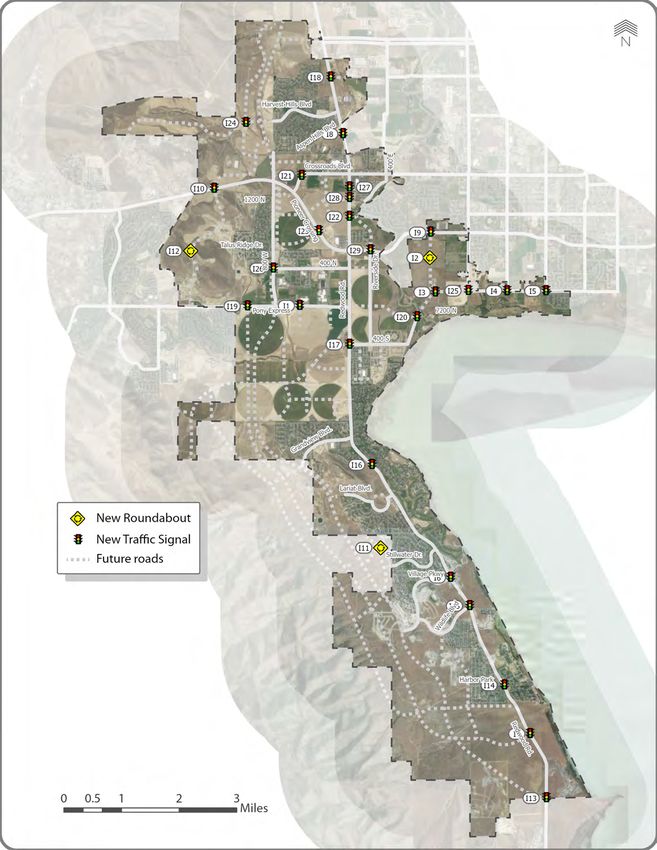
Table 1-4: Signals & Roundabout Projects

                                     SIGNALS & ROUNDABOUTS
  Project #          Type                               Location                         Jurisdiction
     I1        New Traffic Signal      Pony Express Parkway 200 West and 600 West            UDOT
     I2        New Roundabout                     500 East and 550 North                Saratoga Springs
     I3        New Traffic Signal        Pony Express Parkway and Saratoga Road              UDOT
     I4        New Traffic Signal          Pony Express Parkway and 1700 West                UDOT
     I5        New Traffic Signal          Pony Express Parkway and 1100 West                UDOT
     I6        New Traffic Signal       Redwood Road (SR-68) and Village Parkway             UDOT
     I7        New Traffic Signal       Redwood Road (SR-68) and Bonneville Drive            UDOT
     I8        New Traffic Signal     Aspen Hills Boulevard and Redwood Road (SR-68)         UDOT
     I9        New Traffic Signal         Pioneer Crossing (SR-145) and 500 East             UDOT
     I10       New Traffic Signal            SR-73 and Mt. Saratoga Boulevard                UDOT
     I11       New Roundabout                   Hunter Drive and New Road               Saratoga Springs
     I12       New Roundabout         Talus Ridge Drive and Mount Saratoga Boulevard    Saratoga Springs
     I13       New Traffic Signal      Redwood Road (SR-68) and Foothill Boulevard           UDOT
     I14       New Traffic Signal       Redwood Road (SR-68) and Harbor Parkway              UDOT
     I15       New Traffic Signal      Redwood Road (SR-68) and Wildlife Boulevard           UDOT
     I16       New Traffic Signal     Redwood Road (SR-68) and Centennial Boulevard          UDOT
     I17       New Traffic Signal          Redwood Road (SR-68) and 400 South                UDOT
     I18       New Traffic Signal         Redwood Road (SR-68) and 2400 North                UDOT
     I19       New Traffic Signal       Pony Express Parkway and Bonneville Drive            UDOT
     I20       New Traffic Signal        Pony Express Parkway and Saratoga Road              UDOT
     I21       New Traffic Signal          Crossroads Boulevard and 1400 North          Saratoga Springs
     I22       New Traffic Signal        Market Street and Redwood Road (SR-68)              UDOT
     I23       New Traffic Signal       Market Street and Pioneer Crossing (SR-145)          UDOT
     I24       New Traffic Signal          Wild Hills Boulevard and Tanuki Drive        Saratoga Springs
     I25       New Traffic Signal             Pony Express and Saratoga Road            Saratoga Springs
     I26       New Traffic Signal            Foothill Boulevard and 400 North           Saratoga Springs
     I27       New Traffic Signal*      Commerce Drive and Redwood Road (SR-68)              UDOT
     I28       New Traffic Signal*       Medical Drive and Redwood Road (SR-68)              UDOT
     I29       New Traffic Signal      300 East approx. and Pioneer Crossing (SR-145)        UDOT

* Until the Foothill Freeway is connected to Grandview Boulevard or points south only one
  of these intersections will be signalized.

                                                           Saratoga Springs Transportation Master Plan     5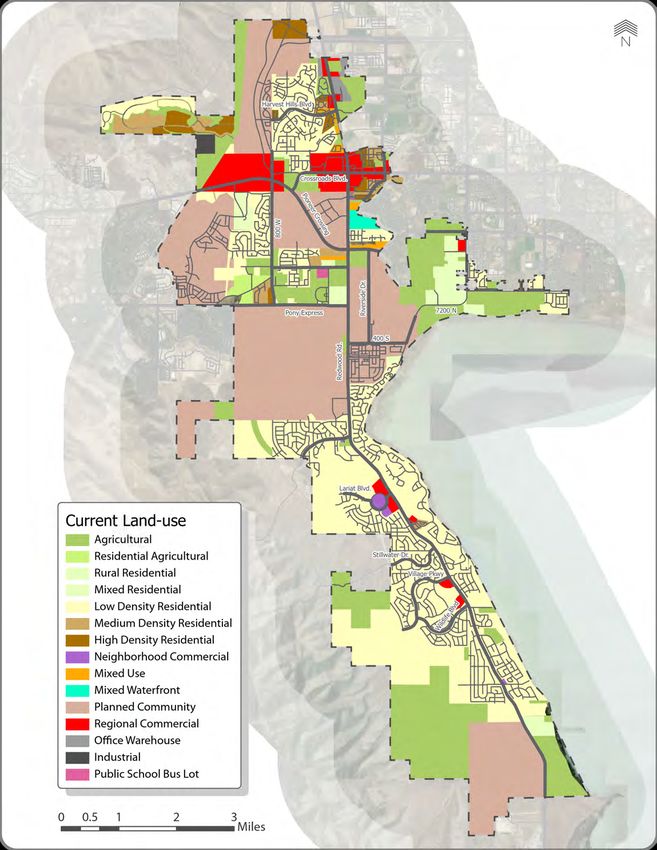
2 where we are

This chapter evaluates the existing transportation system within Saratoga Springs and establishes the framework
for the development of the TMP. This analysis includes a description of the land-use as well as the demographics
of Saratoga Springs and how these factors affect the transportation system within the city. This chapter details the
existing conditions as of 2020.

ZONING AND LAND-USE
In order to analyze the transportation system and plan for future growth, it is essential to understand zoning and
land-use patterns within the area. Travel is a daily requirement for most of the public as people travel from their
homes to work, shopping, schools, health care facilities, and recreational opportunities. Zoning and land-use patterns
must function cohesively with the transportation system to support a high quality of life and promote economic
development within Saratoga Springs.

Saratoga Springs zoning is mostly residential, and currently there are many more households than jobs. This is
consistent with the General Plan that encourages single-family-residential as the predominant housing type. This
zoning and land-use pattern is consistent with other communities in northern Utah County. While Saratoga Springs is
largely zoned for single-family residential, there are several areas of regional commercial zoning along Redwood Road,
with a major commercial area located near the intersection of Crossroads Boulevard. Large areas are also zoned for
planned communities which allow for a mixture of land-uses and housing types on properties of more than 500 acres.
The existing land-use within Saratoga Springs is shown in Figure 2-1.

6       Saratoga Springs Transportation Master Plan
Figure 2-1: Current Land-use

                               Saratoga Springs Transportation Master Plan   7
DEMOGRAPHICS
Population
Saratoga Springs experienced significant population growth over the last several decades, with the population
increasing from just over 1,000 people in 2000 to an estimated 27,247 residents in 2018. This represents more than a
3100 percent increase in population which has transformed the character of Saratoga Springs from a rural community
to a suburban city. This trend is expected to continue encouraged by current zoning and land-use policy as illustrated
in Figure 2-2. Steady population growth is anticipated into the future with a projected population of more than
130,000 people by year 2050.
Figure 2-2: Historic and Future Population
Source: US Census Bureau, Population Estimates Program, Kem C. Gardner Policy Institute
City Population and Housing Estimates
The age of residents also impacts how they interact with the
transportation system. Saratoga Springs has a relatively high
population of children with 41 percent of the population
under 15. The transportation needs of these younger
residents are different than other age-groups, because they
are reliant on others for car-related mobility. These young
residents may also require additional bike, pedestrian, and
trail amenities to feel comfortable biking or walking.
While there are fewer residents in older population groups
(4 percent over 65), the mobility needs of these residents
will continue to expand as the population grows and ages.
New homes rise up and closer to Redwood Road in As with younger-population-age groups, the transportation
Saratoga Springs. Residential-zoned areas are being system should support mobility options for residents that
filled in quickly as the City’s population rises. may chose not to drive or be unable to drive.
8 Saratoga Springs Transportation Master PlanFigure 2-3: Population Age Distribution
85 years and over
80 to 84 years
75 to 79 years
70 to 74 years
65 to 69 years
60 to 64 years
55 to 59 years
50 to 54 years
45 to 49 years
40 to 44 years
35 to 39 years
30 to 34 years
25 to 29 years
20 to 24 years
15 to 19 years
10 to 14 years
5 to 9 years
Under 5 years
0 500 1,000 1,500 2,000 2,500 3,000 3,500 4,000
Source: US Census Bureau, 2013-2017 American Community Survey 5-Year Estimates
Housing
Although population is an important indicator in developing a TMP, housing provides a broader picture of how
residential growth will affect transportation demand. The number of trips on the transportation network is estimated
largely on the number and size of households. Table 2-1 summarizes the household sizes in Saratoga Springs since
2000. In 2018 the average household size in Saratoga Springs was 4.19 persons per household, which is higher than
the statewide average of 3.19 persons per household. In general, larger households make more trips than smaller
households, so they have a comparatively-larger impact on the transportation system.
Table 2-1: Population and Households
AVG. HOUSEHOLD
YEAR POPULATION HOUSEHOLDS
SIZE
2018 27,347 6,516 4.19
2010 14,692 3,624 4.05
2000 1,003 301 3.33
Source: US Census Bureau, American Community Survey 5 year estimates for 2018 & 2010, Kem C. Gardener Policy Institute for 2000
While 2018 is the most up-to-date year that the US Census provides household data, the Saratoga Springs Building
Department maintains a more current online “Residential Units Dashboard“ for the city. At the time of writing this
there are 7,906 occupied housing units in Saratoga Springs. This dashboard is a valuable resource for understanding
current conditions in this rapidly growing municipality. This data can be viewed at: https://ssgis.maps.arcgis.com/
apps/opsdashboard/index.html#/5bce1949b0c24f64a94d843a8ee05647
Housing in Saratoga Springs comes in all
types and accommodates all ages.
Saratoga Springs Transportation Master Plan 9Employment
There were approximately 2,800 jobs within Saratoga Springs in 2017, which is the most up-to-date data available
from the US Census Bureau Center for Economic Studies. Since 2002, about 2,700 jobs have been added within the city
representing an increase of over 3400 percent. This job growths reflects the continued development of the city to a
more-suburban environment with increased employment opportunities within the community.
Figure 2-4: Total Jobs within Saratoga Springs
Source: U.S. Census Bureau, OnTheMap Application and LEHD Origin-Destination
Employment Statistics (Beginning of Quarter Employment, 2nd Quarter of 2002-2017).
The largest employers within Saratoga Springs are Walmart, Smith Marketplace, and as of the summer of 2020, Costco,
all of which are located off Redwood Road. While these retailers are the largest individual employers, education
services are the largest industry sector within city. Table 2-2 lists top employers. Schools are three of the six largest
employers within the city.
Smiths Marketplace, at the intersection of
Table 2- 2: Largest Employers in Saratoga Springs Redwood Road and Pioneer Crossing is a major
employer in Saratoga Springs.
NAME EMPLOYEES
Smith’s Marketplace 250 - 499
Walmart Supercenter 250 - 499
Costco 250 - 499
Lakeview Academy of Science 100 - 249
Saratoga Springs City 100 - 249
Vista Heights Middle School 100 - 249
Westlake High School 100 - 249
Fat Cats 50 - 99
Source: FirmFind,
Department of WorkForce Services, State of Utah.
Costco opened in August of 2020 and was
constructed on a vacant field along Redwood
Road. In the background is FatCats, an
entertainment center in Saratoga Springs that
offers bowling and movies.
10 Saratoga Springs Transportation Master PlanAlthough employment within Saratoga Springs has increased recently, there are still more residents who live within
the city, but are employed elsewhere. There were approximately 11,250 residents who commuted to a job outside
of the city in 2017, while only 2,295 people commuted to Saratoga Springs from another community for work. There
were about 494 residents who both lived and worked within the city. These existing commuting patterns help the
City make informed decisions about transportation investments because people commuting into and out of Saratoga
Springs for work have a greater impact on transportation system demands due to the frequency and length of their
trips.
Figure 2-5: Inflow/Outflow Commuting Patterns
Residents leaving for
work
5 0
1 , 2
1
Workers living
in Saratoga
Springs
5 494
, 2 9
2
People coming in for
work
Saratoga Springs Transportation Master Plan 11TRANSPORTATION SYSTEM
The transportation network in Saratoga Springs supports the overall community transportation vision. However, there
are opportunities to modify and improve the current system to make a transportation network that more efficiently
meets the needs of the future. In addition to new capacity, many of the improvements in the transportation network
will involve making the system more accessible, safer, and inclusive to an array of age and mode of choice.
Street Network Figure 2-6: Mobility vs. Access
Roadway functional classification is a means to categorize
Mobility vs. Access Functional
Classification how a roadway functions and operates based upon a
}
Complete combination of the roadway characteristics. Streets provide
Access
Freeway for two distinct and competing functions: mobility and land
Control
Mobility
Expressway access. As mobility increases, land access decreases, and
vice versa, as shown in Figure 2-6. Both functions are vital,
Strategic Arterial
and no trip is made without both. In Saratoga Springs,
Increasing Mobility
Principle Arterial street facilities are classified by the relative amounts of land-
Collector
access service they provide. There are four primary
classifications, with descriptions in Table 2-3 on page 14 and
Local
in the following text:
Access
Cul-de-sac
Unrestricted Freeways & Expressways – Freeway and expressway
Access
Increasing Access
facilities are provided to service long distance trips between
cities and states. No land access is provided by these
facilities. I-15 is a freeway near Saratoga Springs, but there
are currently no freeways or expressways directly located in Saratoga Springs.
Arterials – Arterial facilities are designed to serve a high level of mobility providing fast flowing through-traffic
movement, but offer a low-level of land-access service. The traffic controls and facility designs are primarily intended
to provide efficient through movement. Redwood Road/S.R. 68 and Pioneer Crossing are arterials in Saratoga Springs.
Arterials frequently provide the most direct route from one point to another, not only for vehicles, but for pedestrians
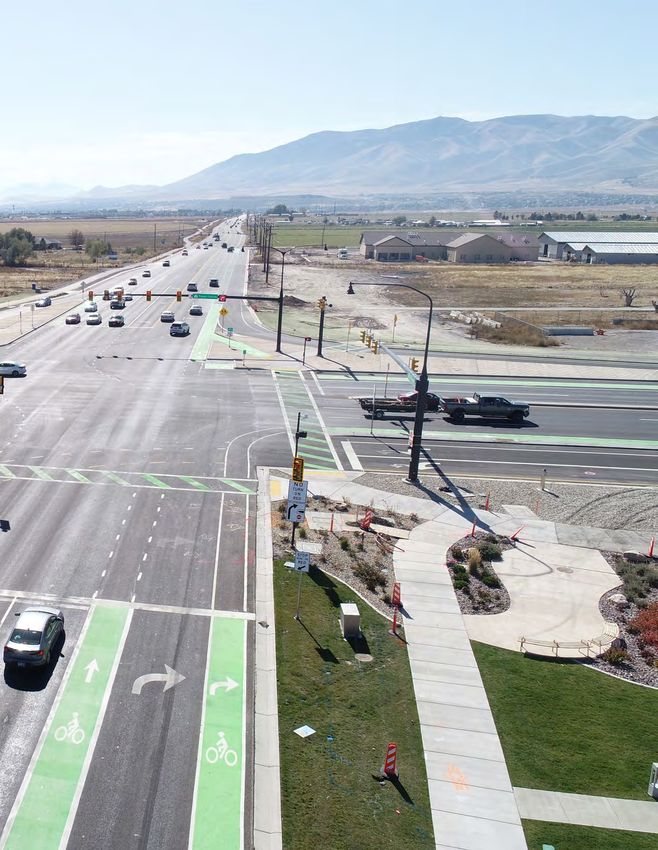
and bicyclists as well. These roads may offer wide shoulders that can accommodate buffered or separated bike lanes
and also choice locations for bus stops.
Collectors – Collector facilities are intended to serve both short through-trip and land-access functions in relatively
equal proportions. For longer trips requiring high mobility, such facilities are inefficient. Instead, they are used
more for local trips requiring increased access to destinations. For the bicyclist or pedestrian, collectors can offer a
comfortable level of safety and a number of route choices because of the balance between lower vehicle speeds and
the variety of available access options to potential destinations.
Local Roads/Residential Streets – Residential facilities primarily serve land-access functions. Local road design
and control measures facilitate the movement of vehicles onto and off of the street system from land parcels. Through-
movement is difficult and is discouraged by both the design and control of this facility. This level of street network is
likely to provide the highest level of comfort to bicyclists and pedestrians. Local roads will have the lowest speeds and
be mostly absent of large vehicles. The safety and comfort of local roads is also due to a quieter environment since
there are less vehicles and slower speeds, as well as being removed from roadway air pollution that is associated with
higher traffic volumes.
It should be noted that roadway functional classification does not necessarily define the number of lanes required for
each roadway’s capacity. For instance, a collector street may have two, three, or four lanes, whereas an arterial street
may have up to nine lanes for motorized traffic. The number of lanes is a function of the expected automobile traffic
volume on the roadway and serves as the greatest measure of roadway capacity for vehicles. The existing functional
class network in Figure 2-7 is separated into functional classes by access as well as the general right-of-way width.
12 Saratoga Springs Transportation Master PlanFigure 2-7: Existing Functional Classification
Saratoga Springs Transportation Master Plan 13Table 2-3: Roadway Classification
FUNCTIONAL CLASSIFICATION
CHARACTERISTIC FREEWAY & RESIDENTIAL
EXPRESSWAY ARTERIAL COLLECTOR STREET
Collect & distribute traffic
Traffic movement, land
Function Traffic movement
access
between streets & arterials, land Land Access
access
Typical percent of
Surface Street System Not applicable 5 - 10 percent 10-20 percent 60-80 percent
Mileage
Continuity Continuous Continuous Continuous None
Spacing See City’s Engineering Standards and Specifications
Typical percent of
Surface Street System Not applicable 40 - 65 percent 10-20 percent 10-25 percent
Vehicle Miles Carried
Restricted: Some movements
Limited: Major generators
Direct Land Access None
only
prohibited; number & spacing of Safety controls access
driveways controlled
Minimum Roadway See City’s Engineering Standards and Specifications
Intersection Spacing
Speed Limit See City’s Engineering Standards and Specifications
Parking Prohibited Discourages Limited Allowed
Supplements capacity
of arterial street system Through traffic should
Comments & provides high-speed
Backbone of Street System
be discouraged
mobility
Parking Prohibited Discouraged Limited Allowed
Supplements capacity
of arterial street system Through traffic should
Comments & provides high-speed
Backbone of Street System
be discouraged
mobility
Traffic Volume
Traffic data is typically shown as the number of vehicles per day or an average daily volume. Data collection was
completed as part of the transportation plan. This included traffic data from Saratoga Springs and UDOT, as well as
new traffic counts to document traffic volumes and speeds. These volume data provide the basis to calibrate the travel
demand model (TDM) and to identify any capacity deficiencies that may exist today.
The highest traffic volumes in Saratoga Springs are on Redwood Road south of Pioneer Crossing. This segment of
Redwood Road is a five-lane arterial with a posted speed of 50 miles per hour and is designed to move regional
traffic through town. While Redwood Road experiences high traffic volumes through much of the city, this segment
has average traffic volumes in excess of 38,000 vehicles/day with some individual days above 40,000 vehicles/day. In
addition to Redwood Road, both SR-73 and Pioneer Crossing experience daily traffic volumes above 30,000 vehicles/
day.
14 Saratoga Springs Transportation Master PlanLevel of Service
Level of Service (LOS) describes the operating performance of an intersection or roadway. LOS is measured by delay
and is reported on a scale from A to F, with A representing the best performance and F the worst. For unsignalized
intersections, LOS is reported based on the average vehicle delay for the worst approach. While for signalized
intersections, an overall LOS is reported for the entire intersection based on the average delay of all vehicles. Table 2-3
provides a brief explanation for each LOS and the associated average delay per vehicle for signalized intersections.
Table 2-4: Intersection Level of Service Criteria
AVERAGE DELAY (SECONDS/VEHICLE)
LEVEL OF
TRAFFIC CONDITIONS SIGNALIZED UNSIGNALIZED
SERVICE
INTERSECTION INTERSECTION
A Free Flow Operations / Insignificant Delay 0 ≤ 10 0 ≤ 10
B Smooth Operations / Short Delays > 10 and ≤ 20 > 10 and ≤ 15
C Stable Operations / Acceptable Delays > 20 and ≤ 35 > 15 and ≤ 25
D Approaching Unstable Operations / Tolerable Delays > 35 and ≤ 55 > 25 and ≤ 35
E Unstable Operations / Significant Delays Begin > 55 and ≤ 80 > 35 and ≤ 50
F Very Poor Operations / Excessive Delays Occur >80 >50
Source: Highway Capacity Manual 2016, Transportation Research Board National Research Council, Washington D.C.
Roadway LOS is typically displayed in the relationship between the traffic volume and the roadway capacity, or a
V/C ratio, where V=volume and C= capacity (this is generally presented in a number of vehicles per day as shown in
Figure 2-8). Roadway LOS is a planning tool to quantitatively evaluate roadways to accommodate existing and future
vehicle demand. Generally, LOS D is the planning goal for urban roadways. Some congestion occurs at LOS D, but
the transportation system is assumed to be adequate (not failing) at this level. LOS D was identified as the planning
goal for Saratoga Springs in the peak traffic hours, meaning that LOS E and F are unacceptable. Although LOS D is
a planning goal, roadway LOS may vary on a street-by-street basis. Table 2-4 summarizes the daily maximum traffic
volumes for LOS C through LOS E.
Saratoga Springs Transportation Master Plan 15Figure 2-8: Map of Level of Service 16 Saratoga Springs Transportation Master Plan
Table 2-5: Daily Level of Service Capacity
      FUNCTIONAL
                                        LANES            LOS C          LOS D         LOS E
     CLASSIFICATION
                                            3                12,400     15,100         17,700
             Arterial                       5                28,500     32,800         40,300
                                            7                43,000     50,500         63,400
                                            2                9,700      12,100         14,500
           Collector
                                            3                10,800     13,400         16,100

While the TDM is used to predict future traffic and LOS, it can also be used to estimate current conditions where
vehicle counts are not available. The existing functionally-classified roadway network was modeled with a 2019 base
year to estimate the current LOS on these roadways. Figure 2-8 is a map that summarizes the existing traffic volumes
and LOS within Saratoga Springs. Green roads have little or no traffic congestion, corresponding to LOS A, B or C, while
yellow roads have peak-hour traffic congestion, and red roads have significant traffic congestion.

Currently, Redwood and Pioneer Crossing experience congestion during the peak hours. During these periods there
can be delays and queuing at the signalized intersections along the corridor. There are minimal delays on the other
roadways in Saratoga Springs.

SAFETY
Crash data from 2014 through 2018 for vehicles, bicycles, and pedestrians were analyzed for Saratoga Springs. These
data were utilized to identify potential crash hotspots and high-risk areas to address the overall safety of residents.

In the past five years, there have been 1,541 reported crashes in Saratoga Springs, of these, 7 were fatal. These fatal
crashes were on the major roadways through the city, including Redwood Road (3), Crossroads Boulevard (2), Pioneer
Crossing (1), and Pony Express (1). These roads accounted for 70 percent of all crashes in Saratoga Springs and had the
majority of the serious injury (69 percent), and minor injury (70 percent) crashes on them, as well. Figure 2-9 is a graph
of crash severity and Figure 2-10 shows the location of these crashes.

 Figure 2-9: Severity of Crash Chart

                                                 No Injury, 73%

                                                 Fatal 1%

                                                 Serious Injury, 1%

                                                 Minor Injury, 7%

                                                 Possible Injury, 18%

Source: UDOT. These data may be protected under 23 USC 409

                                                                           A vehicle turns left after traffic passes by. Safety
                                                                           is a key factor when designing points of access
                                                                           to destinations.

                                                                            Saratoga Springs Transportation Master Plan           17
Figure 2-10: Crashes by Severity Source: UDOT. These data may be protected under 23 USC 409 18 Saratoga Springs Transportation Master Plan
As shown in Figure 2-11, front-to-rear (or rear-end) crashes were the most common collision representing 42 percent
      of all crashes, followed by angle crashes (turning vehicles) at 21 percent. These manners of collisions are indicative of
      congested traffic conditions such as those found on the major roads through the city. The capacity and safety im-
      provements specified in this master plan are designed to reduce these crashes.
      Figure 2 11 : Manner of Crashes Chart
                                                                   Front to Rear, 42%

                                                                   Head On, 3%

                                                                   Sideswipe Same , 8%

NER                                                                Parked Vehicle, 6%

                                                                   Angle, 21%

                                                                   Single Vehicle, 17%

      Source: UDOT. These data may be protected under 23 USC 409

      Front-to-rear crashes are the most common type of accident in Saratoga Springs.
      These can occur at intersections when drivers are moving at variable speeds and may
      also be distracted.

                                                                                  Saratoga Springs Transportation Master Plan   19
Figure 2-12: Crashes by Manner of Collision
Source: UDOT. These data may be protected under 23 USC 409
20 Saratoga Springs Transportation Master PlanBicycle and Pedestrian Crashes
There were 10 recorded crashes between motor vehicles and pedestrians and four crashes between motor vehicles
and bicycles from 2014 through 2018. Of these bicycle and pedestrian crashes, there were no fatalities and only two
of the pedestrian crashes had serious injuries as shown in Figures 2-13 and 2-14. The locations of these crashes are
dispersed throughout the City, as shown in the map on Figure 2‐15. For the most part these were on lower volume
roadways with only two pedestrian crashes on Redwood Road and two on Pioneer Crossing.
Figure 2 13: Bicycle Crash Severity Chart Figure 2 14: Pedestrian Crash Severity Chart
Possible Injury 40%
No Injury, 20%
Possible Injury, 75%
E PEDESTRIAN Serious Injury, 20%
Minor Injury, 25%
Minor Injury, 20%
Source: UDOT. These data may be protected under 23 USC 409 Source: UDOT. These data may be protected under 23 USC 409
People jog along a paved street separated trail
next to Redwood Road. Using elements such as a
park strip to provide separation between vehicles
and pedestrians creates a safe environment with a
high level of comfort for users.
Saratoga Springs Transportation Master Plan 21Figure 2-15: Bicycle and Pedestrian Crashes
Source: UDOT. These data may be protected under 23 USC 409
22 Saratoga Springs Transportation Master PlanACTIVE TRANSPORTATION
An active transportation (AT) network is a key component of a transportation system because it provides mobility
options for all residents. Making walking and biking safe and convenient is a key goal of any transportation plan. The
benefits of a practical and accessible AT network are broad and range from improving physical and mental health,
decreasing noise and air pollution, providing a low-cost mode choice, to increasing the property values along the AT
network. More transportation choices improve connectivity throughout the community by providing more access
to both specific and regional origins and destinations. While freeways and expressways favor mobility, a robust AT
network provides its own accessibility options that can connect people to neighborhoods, downtowns, parks, schools,
places of work and worship, shopping centers, etc.
Saratoga Springs has a developing trail network with a range of AT options throughout the city, as illustrated
in Figure 2‐16. On May 5, 2020 Saratoga Springs adopted their Parks, Recreation, Trails, and Open Space
Master Plan. This document, which provides extensive existing conditions analysis, can be found at: http://
www.saratogaspringscity.com/DocumentCenter/View/143/Parks-Recreation-Trails-and-Open-Space.
A bicyclists rides along the east side of Redwood
Road using a designated striped bike lane. While
this five lane road has a speed limit that varies from
45 to 55 mph, throughout the city, the bike lane
creates an environment of comfort by providing
distance from vehicles and a defined area marked
by engineering designs specific for bicyclists.
Appropriate design requires the consideration of
variables such as speed, conflicts at intersections,
and available Right-of-Way (ROW). Designated
bike lanes can be physically buffered, painted
green, signed and striped, or potentially remain
an unaltered roadway shoulder that already offers
enough width to provide a reasonable level of
safety and comfort to a certain percentage of
bicyclists. Roads that offer bike lanes in Saratoga
are Redwood Road, Pioneer Crossing, and Pony
Express.
Two people bicycle along a paved street separated
trail located along the west side of Redwood
Road. This option for AT offers a much higher level
of comfort to bicyclists (and pedestrians) than
the designated bike lanes along the shoulder of
Redwood. These paved paths are found along
high speed arterials like Redwood Road and Pony
Express, allowing for bicyclists and pedestrians
to travel farther distances in safety and comfort.
They are also being constructed by contractors
in neighborhood developments across the City,
like Harvest Hills Boulevard and along and off of
Ring Road. These paths can provide seamless AT
connections between local roads and arterials
when they are designed to link together as they do
between Parkway Boulevard and Redwood Road.
Saratoga Springs Transportation Master Plan 23Existing
Bike Lane
Figure 2-16: Existing Active Transportation
24 Saratoga Springs Transportation Master PlanTRANSIT
Saratoga Springs is served by Utah Transit Authority’s (UTA) bus route 806, which runs from Eagle Mountain across
Saratoga Springs to the Lehi Frontrunner Station and Utah Valley University (UVU). Currently, the bus runs only
Monday through Friday, with no transit service offered on the weekends. The UTA 806 makes stops in Saratoga Springs
at 478 West Harvest Hills Boulevard, the Harvest Hills Church Park & Ride, and the intersection of Highway 73 and
Redwood Rd.
The 806 travels eastbound towards UVU during morning hours and travels westbound towards Eagle Mountain in the
afternoon and early evening. The 806 averaged 88 daily riders in 2015 putting the utilized capacity of the bus under
20 percent. The predictability of the bus was at 91 percent. Over the past five plus years, there has been a 16 percent
decrease in ridership. Current data from the early (pre-Covid -19) months of 2020 show there are now 74 average daily
riders.
UTA offers Vanpool service in Saratoga Springs. The service provides various size vans for rent to groups of individuals
and companies. Vanpool functions as an interim transit option for areas like Saratoga Springs that may not yet have
the demand for frequent public transit. This service provides residents access to transportation options beyond a
single-occupancy vehicle when public transit options like the 806 bus are unavailable. In Saratoga Springs, where
bus service is limited, vanpool can allow workers to get to and from their jobs during hours and days bus service is
unavailable.
A UTA Vanpool vehicle sits
outside of the Walmart in
Saratoga Springs.
Saratoga Springs Transportation Master Plan 25Figure 2-17: Existing Transit 26 Saratoga Springs Transportation Master Plan
3 where we’re going

This chapter discusses the background and assumptions used to forecast transportation-related growth in Saratoga
Springs. Using TDM techniques, in conjunction with projected socioeconomic, population, and employment trends,
future transportation demands were forecast. Transportation system improvements that are committed or planned
by agencies such as Utah Department of Transportation (UDOT) and Mountainland Associated of Governments (MAG)
were included in the transportation forecasting prior to identifying additional transportation projects within Saratoga
Springs. MAG is the Metropolitan Planning Organization (MPO) for Utah County and is responsible for coordinating
transportation planning in the region.

Future Growth
Most of the projected socioeconomic data used in this study comes from the Land-Use Element of the General Plan.
The General Plan was last updated in 2017 and is shown in Figure 3-1. To allow for growth, this Plan reflects significant
changes across a variety of land-uses, including agriculture, residential, industrial and commercial. This planned
land-use provides the basis for the projected socioeconomic data used in this study and comes from land-use
modeling completed by MAG. MAG recently updated their Regional Transportation Plan (RTP), TransPlan 2050, which
is the foundational plan for the development of the future regional transportation system. The 2019-2050 RTP, also
know as TransPlan50 (available at https://www.mountainland.org) was adopted in 2019. The RTP is a guide to maintain
and enhance the regional transportation system for urbanized Utah County. As part of this process, MAG modeled
future land-use changes based upon allowed development the transportation system. The output was then used to
determine what will be needed for the future functional roadway network. These socioeconomic assumptions were
further refined for this TMP update to better reflect existing and planned land-use within Saratoga Springs.

                                                               Saratoga Springs Transportation Master Plan            27
Figure 3-1: General Land-use Plan 28 Saratoga Springs Transportation Master Plan
Figure 3-2 summarizes the anticipated growth over the next 30 years. The future we are planning for revolves around
significant population and employment growth. The projected 2050 population in Saratoga Springs is over 130,000
people. It is anticipated that there will be an additional 140,000 people in Eagle Mountain that will pass through
Saratoga Springs to travel to destinations throughout the Wasatch Front. Job growth is also expected to increase
substantially over the next 30 years. While population is anticipated to increase by over 400 percent, employment is
forecast to increase by more than 1,100 percent, with more jobs than households being added after 2030.

Figure 3-2: Saratoga Springs Projected Growth

Travel Model Development
Projecting future travel demand is a function of projected land-use and socioeconomic conditions. The MAG TDM was
used to predict future traffic patterns and travel demand. The TDM was modified to reflect better accuracy through
the Saratoga Springs area by creating smaller Traffic Analysis Zones (TAZ) and a more accurate and extensive roadway
network. Existing conditions were simulated in the TDM and compared to the observed traffic count data to get a
reasonable base line for future travel demand. Once this effort was completed, future land-uses and socioeconomic
data were input into the TDM to predict the roadway conditions for the horizon year 2050. Year 2050 was selected as
the planning year horizon to be consistent with the regional planning process.

Land-use’s Effect on Transportation
The rapid growth that Saratoga Springs has experienced is expected to continue in the coming years. Population is
projected to more than triple over the next thirty years, resulting in increased transportation system demands. These
increased demands will require new and improved transportation facilities. Additionally, Saratoga Springs is currently
a bedroom community with many more households than jobs after 2030. While the city has a mix of residential,
commercial, and industrial land-uses near the intersection of Pioneer Crossing and Redwood Road, these land-uses
will increase and develop in additional areas. These new commercial, retail, and office developments are expected
to result in more jobs than households. Saratoga Springs will no longer be a bedroom community offering more
opportunities for people to shop and work within the community. These changes will require transportation options
for people to walk, bike, or take transit for these shorter distance trips, changing how people commute in the future.

                                                               Saratoga Springs Transportation Master Plan           29
MODEL YEARS AND RESULTS
Projected Traffic Volumes & Conditions
The resulting outputs of the TDM consist of traffic volumes on all of the classified streets in the city and surrounding
area. These forecasted traffic volumes were used to identify the need for future roadway improvements to
accommodate growth. The following two scenarios were analyzed in detail for the years 2030, 2040, 2050 to assess the
travel demand and resulting network performance in the city:
» No-build
» Recommended Roadway Network
No-Build Conditions
A no-build scenario is intended to show what the roadway network would be like in the future if no action were taken
to improve the roadway network. The TDM was again used to predict this condition by applying the future growth and
travel demand to the existing roadway network. Interim year growth assumptions were also modeled to understand
how congestion grows over time. Figure 3-3 and Figure 3-4 show the 2030, 2040, and 2050 no-build model LOS,
respectively. These maps show growing congestion on Pioneer Crossing, Pony Express, Redwood Road, and other
corridors as the population and employment increases without improvements to the transportation system. This
growing congestion is visible in the expansion of orange and red roadway segments.
As shown in, Figure 3-5 if no improvements are made to the transportation system, projected traffic volumes for
the planning year 2050 will significantly worsen the LOS of many streets and intersections throughout the city. The
following list includes the streets expected to perform at LOS D or worse:
LOS D (Peak Congestion but Acceptable) LOS E or Worse (Unacceptable)
Harvest Hills Boulevard (Mountain View 2100 North
Road to Redwood Road) Crossroads Boulevard
1200 North (Hillside Drive to Foothill Pioneer Crossing
Boulevard)
400 North (200 West to Redwood Road)
145 North (Saratoga Road to 1100 West)
Pony Express
Colt Drive (Spring Meadows Drive t
Ring Road) 400 South
Saratoga Road
Ring Road
Mountain View Road
Foothill Boulevard
Redwood Road
30 Saratoga Springs Transportation Master PlanFigure 3-3: 2030 No Build LOS
Saratoga Springs Transportation Master Plan 31Figure 3-4: 2040 No Build LOS 32 Saratoga Springs Transportation Master Plan
Figure 3-5: 2050 No Build LOS

                                Saratoga Springs Transportation Master Plan   33
RECOMMENDED 2050 ROADWAY NETWORK
Transportation system improvements will need to be made to preserve the quality of life and to maintain an
acceptable LOS on city streets and at intersections. These improvements will also provide a sound street system that
will support the city’s economic base.
The future analysis can be split into two sections. The first are regional projects included in MAG’s RTP. These projects
may be funded in part by MAG. After determining where the improvements occur with the addition of the MAG
projects, the second section includes the rest of the projects necessary to improve the roadway network to LOS D, or
better, and to build the transportation system necessary to accommodate future land-use plans
New growth requires
new roadway capacity
improvements to maintain
the LOS in Saratoga Springs.
The recommended 2050 roadway network will provide the access and capacity for the growth anticipated in the
commercial, retail, and office sectors as well as family housing. The built environment in Saratoga Springs is quickly
expanding as seen in the photo above where three houses are in three separate stages of construction on a new
development. All three face the new Mountain View Corridor, while their backyards overlook the city and Utah Lake.
Without additional improvements to Mountain View Corridor and other high travel speed routes, these arterials will
experience more congestion until, ultimately they will perform at an unacceptable LOS and reduce the quality of life
for the residents of Saratoga Springs.
34 Saratoga Springs Transportation Master PlanREGIONAL TRANSPORTATION PLAN
Saratoga Springs is not alone in improving the roadway network. MAG, in cooperation with UDOT, provides financial
assistance for projects included in their RTP. If a roadway is included on the RTP and is owned and operated by UDOT,
full financial responsibility falls to UDOT. It is important to include these projects in the RTP as well as coordinate with
UDOT to ensure these projects are implemented. If the roadway is on the RTP and not owned by UDOT, Saratoga
Springs may be able to apply for funding through MAG, in which case, the City will only be responsible to match 6.77
percent of the total cost of the project. The projects within Saratoga Springs included on the RTP are shown in Figure
3-6, and below is a list of the RTP projects to be completed in various phases. An interactive map can be viewed on
MAG’s website www.mountainland.org:
Phase 1:
Cory Wride Freeway Lehi Main ST
» New freeway, frontage roads » Widen to 5 lanes
» Mountain View Corridor to Ranches Parkway » Commerce Drive to Lehi 500 W
Foothill Boulevard Pioneer Crossing
» New 3 lane road » Widen to 6 lanes
» Cory Wride Freeway to Stillwater Drive » Redwood Road to Lehi 2300 W
Lehi 2100 N Freeway Pony Express Parkway
» New freeway » New and widen to 5 lanes
» SR-194 Mountain View Corridor to I-15 » Redwood Road to Vineyard Connector
400 East / Lehi 3600 West Triumph Boulevard/Lehi 2300 W
» New and widen to 5 lanes » New and widen to 5 lanes
» Crossroads Boulevard to Clubhouse Drive » Timpanogos HWY to Lehi 1900 S
Phase 2:
Foothill Boulevard Mt. Saratoga Boulevard
» New 4 lane road » New 3 lane road
» Stillwater Drive to Redwood Road » Cory Wride Freeway to Harvest Hills Boulevard
Foothill Freeway North Lakeshore Freeway
» New freeway » New freeway (location TBD)
» Cory Wride Freeway to Stillwater Drive » Foothill Freeway to I-15
Harvest Hills Boulevard
» New 3 lane road
» Sunflower Way to Spring Run Drive
Phase 3
Foothill Freeway Mountain View Freeway
» Convert to freeway » Widen to 8 Lanes
» Stillwater Drive to Redwood Road » Cory Wride Highway to Porter Rockwell Parkway
Hidden Valley Road Utah Lake Bridge
» New 5 lane road » New freeway bridge (location TBD)
» East Expressway to Redwood Road » Redwood Road to I-15
Saratoga Springs Transportation Master Plan 35You can also read


