Manual for Operationalizing Impact-based Forecasting and Warning Services - (IBFWS) - United Nations ESCAP
←
→
Page content transcription
If your browser does not render page correctly, please read the page content below

Manual for Operationalizing
Impact-based Forecasting
and Warning Services
(IBFWS)
Contents
Acknowledgements                                                                                3
Overview                                                                                        4
Manual Introduction                                                                             4
Learning Outcomes                                                                               5

Module 1: Introduction to impact-based forecasting                                              6
     Introduction                                                                               6
     What is impact-based forecasting?                                                          7
     Methodological approach                                                                    8
     Collaboration with users and practitioners                                                 9
     Current practices                                                                          9
     Opportunities                                                                             17
     Challenges                                                                                18
     Impact-based forecasting conceptual framework of the manual                               19

Module 2: Impact-based forecasting for typhoons                                                22
     Introduction to data layers                                                               23
     Preparing hazard layers                                                                   23
     Assessing population exposure to typhoons                                                 27
     Assessing the vulnerability of the population exposed to typhoons                         31
     Assessing agricultural exposure to typhoons                                               32
     Assessing energy powerplants exposure to typhoons                                         35
     Assessing critical infrastructure exposure to typhoons                                    39
     Assessing economic stock exposure to typhoons                                             41
     Assessing possible convergence with COVID-19 and potential impacts on the health system   43

Module 3: Impact outlooks using seasonal forecasts                                             46
     Preparing the seasonal forecast data layer                                                46
     Assessing population exposure to potential drought risk                                   51
     Assessing agricultural exposure to potential drought risk                                 54
     Assessing possible convergence with the COVID-19 and waterborne diseases                  58

Annex I: Types and scales of data used                                                         64

Annex II: List of potential exposure and vulnerability indicators                              66

Annex III: QGIS User Guide Calculating Population Exposed to Typhoon Molave                    68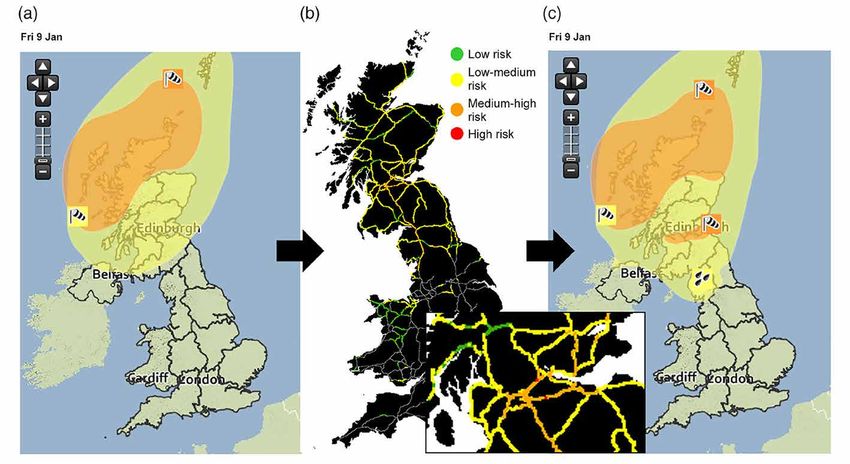
Acknowledgements
This training manual is prepared to support the Viet Nam Meteorological and Hydrological Administration
(VNMHA) in building capacity to provide impact-based forecasting and warning services, with generous
financial support from WMO (Climate Risk Early Warning Systems-Canada Fund).

Members of the core authors team consisted of Sanjay Srivastava, SungEun Kim, Lam Hoang, Jin Rui Yap,
Jaehee Hwang, and Maria Bernadet Dewi. Valuable advice, reviews and inputs were received from following
experts: Ananda Kumar Das (India Meteorological Department); Mamoru Miyamoto (International Centre
for Water Hazard and Risk Management); Le Ha (Viet Nam Meteorological and Hydrological Administration);
Samuel Muchemi; Taoyong Peng; Anne-Claire Fontan; Jun Yu (WMO); Anshul Agarwal (Regional Integrated
Multi-Hazard Early Warning System for Africa and Asia); Yuichi Ono (Tohoku University); and Bui Minh
Tuan (Vietnam National University).

The graphic design and layout were created by Jeff Williams. Natacha Pitaksereekul provided administrative
assistance to the authors team.

                                                                                                      3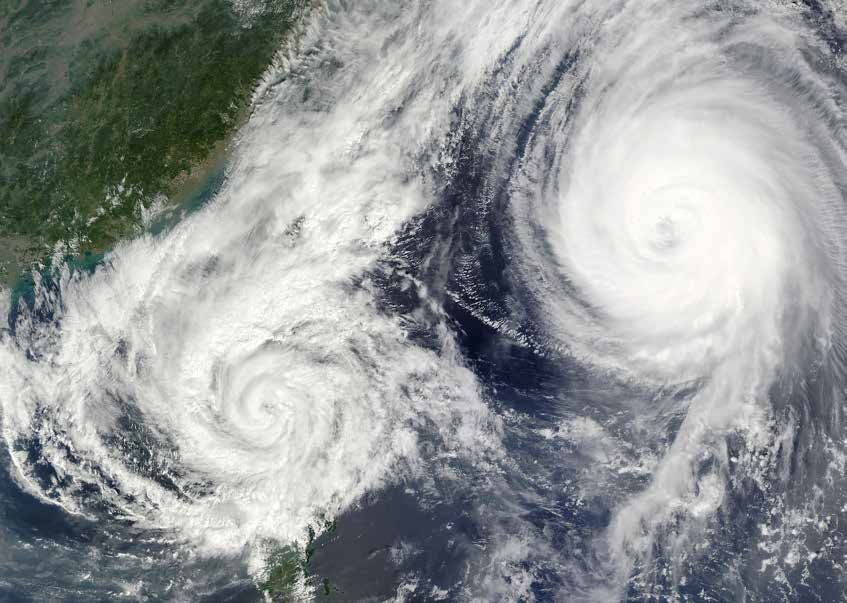
Manual for Operationalizing
Impact-based Forecasting and Warning Services (IBFWS)

Manual for Operationalizing
Impact-based Forecasting and Warning Services (IBFWS)
Overview
In line with the WMO Guidelines on Multi-hazard Impact-based Forecast and Warning Services, many
National Meteorological and Hydrological Services (NMHS) agencies have begun exploring impact-based
forecasting and warnings as a means to communicate risks and impacts to the public and sector end-
users. Impact-based forecasting is a structured approach for combining hazard, exposure, and vulnerability
data to identify risk and support decision-making, with the ultimate objective of encouraging early action
that reduces damages and loss of life from natural hazards.

Traditionally, governments have employed hazard-focused warnings to communicate impending extreme
weather conditions. However, while providing scientifically accurate information is important, it is critical
to communicate what people need to know to effectively respond to hazard risks. This indicates a need
to communicate specific and relevant potential consequences with respect to local contexts, not just for
public end-users, but as well for different sectors and agencies. The development of this communication
entails synthesizing weather information with quasi-static information on exposure and vulnerability
profiles to identify the range of risks in an area. The identification of different levels of risks and impacts
enables the issuance of different warnings to encourage adequate responses by relevant users to reduce
damage and losses.

Manual Introduction
This manual was developed under the project “Operationalizing Impact-based Forecasting and Warning
Services (IBFWS)”, to support the capacity of the Viet Nam Meteorological and Hydrological Administration
(VNMHA) to provide impact-based forecasting and early warning services. The objective is to introduce
impact-based forecasting and the substantive steps for producing an impact-based forecast, with a focus
on the local context of Viet Nam. This will be covered over 3 modules in the training manual.

  •    Module 1 discusses what impact-based forecasting is, why it is used, and provides examples of
       successful implementation and use of impact-based forecasting by governments across the world.

  •    Module 2 introduces the steps required for producing an impact-based forecast for typhoons.

  •    Module 3 guides steps to develop impact outlooks based on anomalies in seasonal forecasts (e.g.,
       lower-than-usual rainfall) which may contribute to the exacerbation of slow-onset disasters such as
       droughts.

This manual is prepared based on data collected from various sources for demonstration purposes. An
explanation of the various data types, the data sets used, and potential other data sets that can be used
are available in Annexes I and II of this manual. This manual is intended to demonstrate the concepts of
impact-based forecasting using example data. However, higher resolution data and additional indicators
can be used as appropriate.

   4
Module 1
                                                                           Introduction to Impact-based Forecasting

Learning Outcomes
By completing the training contained in this manual, users are expected to understand the following:

  •   Benefits of impact-based forecasting

  •   A methodological framework of impact-based forecasting

  •   How to produce and interpret impact-based forecasting using GIS software

  •   Information and data required, and their potential sources

The software used to produce the examples in Modules 2 and 3 is QGIS. However, as the objective of this
manual is to guide the substantive steps required to produce an impact-based forecast, it is expected that
the user can adapt the steps in this manual in accordance with other GIS software such that the same
impact-based forecasting steps and outcomes can be achieved.

                                                                                                             5
MODULE 1
INTRODUCTION TO
IMPACT-BASED FORECASTING
Objective: To understand what impact-based forecasting is.
Module 1 introduces the concept of impact-based forecasting and provides an overview of the methods
and approaches to generate impact-based forecasts.

Contents
     •       Introduction
     •       What is impact-based forecasting?
     •       Methodological approach
     •       Collaboration with users and practitioners
     •       Current practices
     •       Opportunities
     •       Challenges
     •       Impact-based forecasting conceptual framework of the manual

Introduction
Viet Nam has a tropical monsoon climate, which produces large amounts of rain in short time periods,
associated with typhoons and thunderstorms. The country recorded a total of 237 disaster events between
1970 and 2020 in the EM-DAT project database, which resulted in over 18,000 loss of lives and close to
97 million people affected. Extreme climate events (storms, floods, and droughts) were responsible for
almost 95 percent of fatalities and 99.9 percent of people affected during this period (Figure 1).1

Such disaster events cause high fatalities and wreak havoc on lives and livelihoods. The country is expected
to face an average of 4-6 typhoons every year.2 With an estimated 70 percent of the population living in
coastal areas and low-lying deltas, Viet Nam faces high exposure to the risk of flooding.3 In addition,
slow-onset disasters also cause substantial economic and social impacts. According to the Asia-Pacific
Disaster Report 2019, more than half of Viet Nam’s average annual loss can be attributed to recurrent
droughts.

1.       Data source: EM-DAT, https://www.emdat.be/ (Accessed on 31 January 2021)
2.       Source: https://www.vietnam-briefing.com/news/typhoon-season-vietnam-how-to-prepare-your-business.html/
3.       Source: Country Profile for Vietnam, GFDRR, https://www.gfdrr.org/en/publication/country-profile-vietnam

         6
Module 1
                                                                                     Introduction to Impact-based Forecasting

The Sendai Framework for Disaster Risk Reduction 2015-2030 calls for substantially increasing the
availability of and access to multi-hazard early warning systems and disaster risk information and
assessments to people by 2030. To better address the impacts of natural hazards, it is essential to improve
multi-hazard early warning systems and to understand their potential impacts in advance. Oftentimes,
multiple hazards may coincide, such as when typhoons trigger floods, which further cause landslides.

Figure 1: Fatalities and the number of affected by disaster type in Viet Nam (1970 – 2020)

                           Fatalities                                                Affected
 14000                                                                  60

                                                             Millions
 12000                                                                  50
 10000
                                                                        40
     8000
                                                                        30
     6000
                                                                        20
     4000
     2000                                                               10

        0                                                                0
              storm         flood       drought     others                   storm   flood       drought        others

Data Source: EM-DAT (Accessed on 31 January 2021)

What is impact-based forecasting, and why is it important?
Impact-based forecasting is a structured approach for combining hazard, exposure, and vulnerability data
to identify risk and support decision-making, with the ultimate objective of encouraging early action that
reduces damages and loss of life from natural hazards. Traditionally, governments have employed hazard-
focused warnings to communicate impending extreme weather conditions. However, while providing
scientifically accurate information is important, it is critical to communicate what people need to know to
effectively respond to hazard risks.4 This indicates a need to communicate specific and relevant potential
consequences with respect to local contexts, not just for public end-users, but as well for different sectors
and agencies.

Moving from broadcasting what the weather will be to what the weather will do entails synthesizing weather
information (such as weather forecasts) with quasi-static information on exposure and vulnerability
profiles (such as geodemographic and essential facility maps) to identify the range of risks faced over
an area (Figure 2). It is critical that the exposure and vulnerability profiles are up to date, as this directly
influences the insights gained from the impact-based forecasting process. The identification of different
levels of risks and impacts enables the issuance of different warnings to encourage adequate responses
by relevant users to reduce damage and losses. This approach is rooted in the understanding that clear
communication of hazard impacts can effectively influence the risk perception of a user to facilitate the
acceptance and personalization of warning messages.

4.    Weigold, (2001)

                                                                                                                         7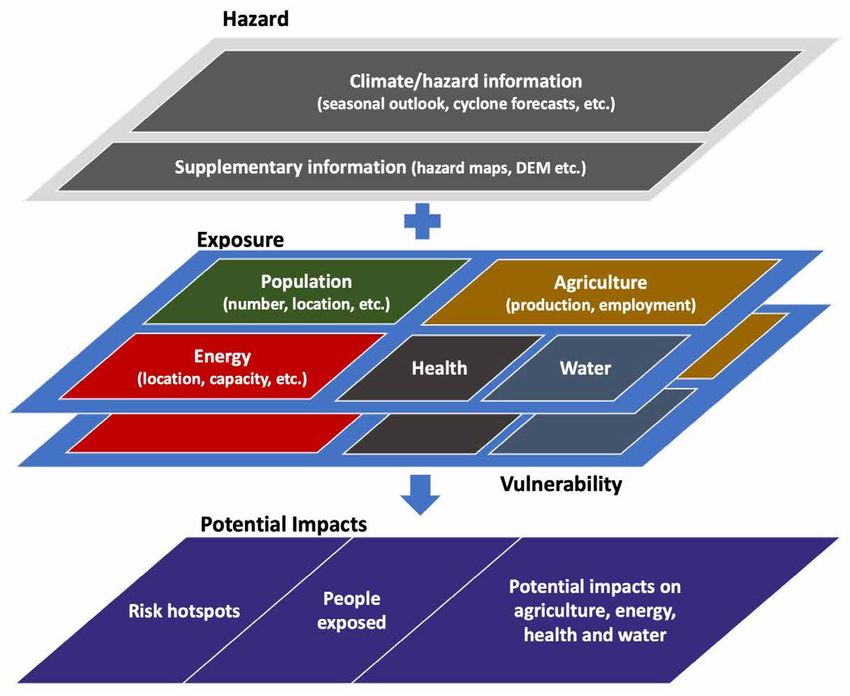
Manual for Operationalizing
Impact-based Forecasting and Warning Services (IBFWS)

Figure 2: Moving from traditional forecasting to impact-based forecasting5

Impact-based forecasters consider a range of contextual factors and uncertainties when generating
forecasts. The randomness of weather events creates the need for forecasters to manage the uncertainty
such as by implementing scenario-based approaches. For example, by accounting for the impacts that may
occur given most likely scenarios as well as reasonable worst-case scenarios, forecasters can develop
robust impact-based warnings that may effectively mitigate damages and losses under a broad range of
outcomes. Uncertainty is also often accounted for in risk matrices that combine the likelihoods (unlikely
to very likely) and estimated impacts (minor to severe) of hazard occurrence. These risk matrices are then
used to communicate the level of risk experienced by users in different sectors over a geographic area.

Contextual factors include whether a location has been struck by recent extreme weather conditions,
as this can influence the ability of local users to recover from yet another extreme weather event. Other
contextual factors include consideration of the type of location where extreme weather is expected to
occur (e.g., farmlands, densely populated areas, informal settlements) as well as whether significant
events are expected to take place concurrently (e.g., elections, sporting events). These factors come
together to influence the number of people as well as the magnitude and types of impact that is expected
to occur. Such considerations are critical given the variation in vulnerabilities across an area. This variation
in vulnerabilities means that weather conditions that can cause severe impacts in some areas may result
in limited and minor impacts elsewhere. An example of this is when heavy rainfall may cause flooding
and severe damage to infrastructure in informal settlements with inadequate drainage infrastructure, as
compared to formal settlements with well-planned and constructed drainage facilities.

Methodological approach
In line with the WMO Guidelines on Multi-hazard Impact-based Forecast and Warning Services, many
National Meteorological and Hydrological Services (NMHS) agencies have begun exploring impact-based
forecasting and warnings. The approach as outlined in the WMO guidelines starts with first generating
weather forecasts. Subsequently, thresholds for significant events (e.g., flooding) should be identified,
alongside thresholds for significant impacts as agreed upon with users and practitioners. The weather

5.   Powerpoint presentation (Introduction to Impact-based Severe Weather Warning System) by the South African Weather Service
     under the Viet Nam WMO CREWS-Canada Sub-Project Training Workshop on Impact-based Forecast and Warning Services, on 30
     November 2020

     8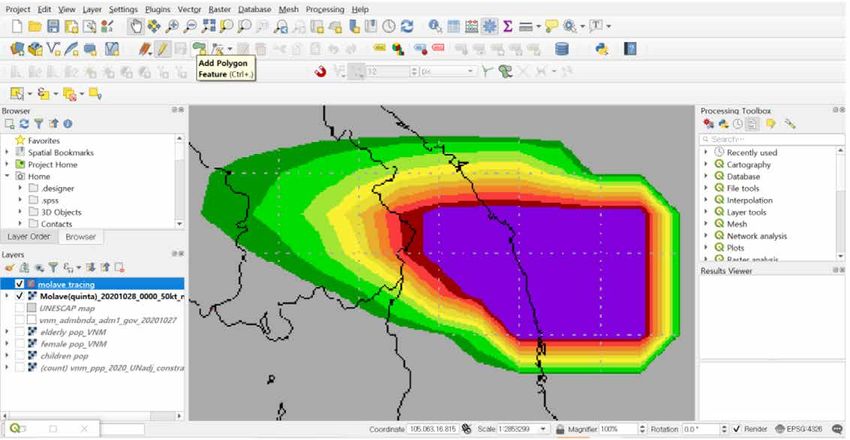
Module 1
                                                                            Introduction to Impact-based Forecasting

forecasts and thresholds will be considered in conjunction with contextual factors and socio-economic
exposure and vulnerabilities to generate impact forecasts.

This process of determining potential impacts may incorporate the use of quantitative hazard impact
models (e.g., the Surface Water Flooding Model and Vehicle Overturning Model by the United Kingdom
Meteorological Office) to identify impacts. However, such models require quantification of the processes
that come together and cause the final impact, which can be challenging. An alternative approach may be to
determine impacts based on heuristics and past experiences of emergency management stakeholders on
the ground. After identifying potential impacts, forecasts and warnings are to be provided to communicate
the impending risks and estimated impacts to users of early warning information.

Figure 3: Step-by-step development of effective impact-based forecasting systems

Collaboration with user sectors
WMO guidelines highlight that the process of forecasting actual impacts requires strong collaboration with
partner agencies. Given that severe impacts are often triggered by extreme hydrometeorological events,
NMHS agencies play a unique role in facilitating or supporting impact-based forecasting, particularly
through a partnership with other user sectors and agencies. Collaborations enable NMHS agencies to
leverage the experience and expertise of other non-weather-related agencies (e.g., agriculture, disaster
risk management, energy, health, and water management) in defining impact thresholds, exposure, and
vulnerabilities. Collaborative actions should include data collection and sharing, consultation involving
the selection of indicators and impact thresholds, and interpretation of results. This directly supports the
development of meaningful targeted warnings that assist those organizations in decision-making and
management of their activities.

Current practices
This section includes multiple examples of how impact-based forecasting systems are implemented in
various countries in the region and the world. Each example is included to highlight a key feature of the
implemented system.

PAGASA in the Philippines: A comprehensive data management system
As part of the endeavor of the Philippine Atmospheric, Geophysical, and Astronomical Services
Administration (PAGASA) to advance impact-based forecasting and early warning services, the agency
has developed an integrated system called GeoRiskPH, which combines database management with
analytics for impact-based forecasting. Data is collected from PAGASA assets, such as field stations and
weather radars that generate weather or hazard forecasts, and channeled into the GeoRiskPH database.

                                                                                                              9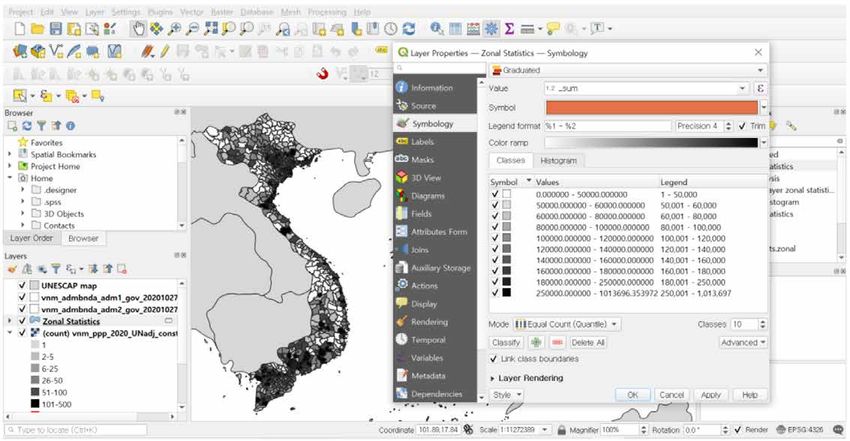
Manual for Operationalizing
Impact-based Forecasting and Warning Services (IBFWS)
Beyond data collection, PAGASA also works on developing hazard maps for floods, typhoons, and storm
surges. Such hazard data can be analyzed within the integrated system alongside data on exposure and
vulnerabilities to estimate risks. The various data layers are processed into warnings that are tailored
towards the needs of specific agencies. The insights gathered are then disseminated to the public to
stimulate early action.
Furthermore, the Philippines has enacted a Disaster Reduction and Management Act which mandates
the formation of a multi-sectoral National Disaster Risk Reduction and Management Council (NDRRMC),
in coordination with subnational-level committees. NDRRMC includes representatives from relevant
agencies responsible for coordinating early action within their respective sectors. PAGASA works with the
NDRRMC and subnational committees to increase disaster preparedness among local communities and
sectoral stakeholders.
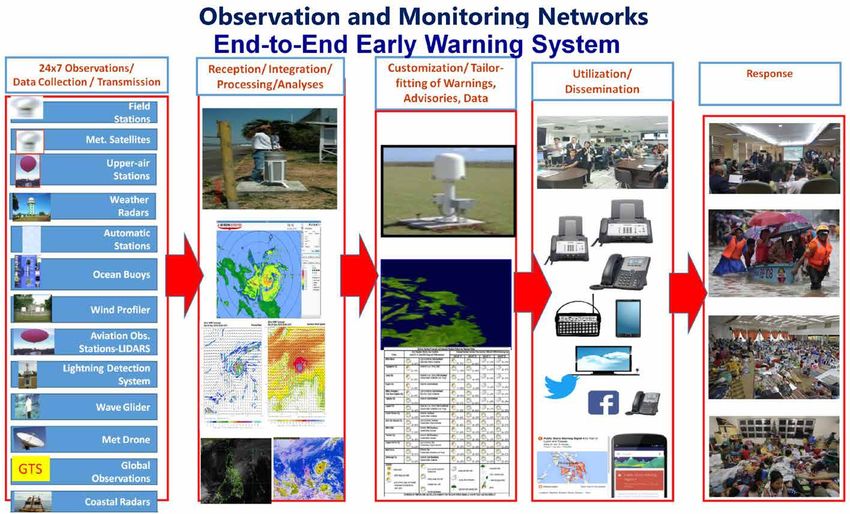
Figure 4: PAGASA’s system for impact-based forecasting6
6. Powerpoint presentation by DOST-PAGASA for the Joint Workshop on Strengthening Multi-Hazard Early Warning Systems and Early
Actions in Southeast Asia in Bangkok, Thailand on 18-20 February 2020
10Module 1
Introduction to Impact-based Forecasting
Figure 5: PAGASA’s end-to-end approach to impact-based forecasting7
Disaster preparedness in Indonesia: The importance of collaboration and communication
In Indonesia, the BNPB (Indonesian National Board for Disaster Management) and the BMKG (Meteorology,
Climatology, and Geophysical Agency) work together to produce hazard and response matrices. The BMKG
provides hydrometeorological forecasts with different levels of hazard likelihood, while the BNPB provides
geospatial economic and population data and estimates the different levels of impact. Together, these
agencies align strategies to communicate potential hazards and risks to the public.
In a push to focus on early education for disaster preparedness in local communities, the government
also introduced a strong public outreach and awareness program in schools and local communities. One
example of this is the Tagana network, comprised of “Disaster Prepared Cadets” that facilitate programs
such as the Tagana Goes to School Program or the Village’s Disaster Preparedness Program. Another
example is MOSAIC, a program to strengthen Indonesian communities’ understanding of climate and
weather. The MOSAIC program seeks inputs and facilitates workshops for various groups in disaster
management as well as specific sector agencies (e.g., agriculture, health, and forestry).
The agencies also provide various avenues for conveying information on disaster risk to the public, such as
through dedicated cell phone applications, newspapers, radio broadcasting services, and so on. However,
the government also draws on the potential for the public to act as a source for information. For example,
www.petabencana.id enables crowdsourcing of information on disasters from the public. Other avenues
for the public to contribute critical information to strengthen the government’s disaster preparedness
include social media outlets as well as volunteer networks such as the Tagana network.
7. Ibid.
11Manual for Operationalizing
Impact-based Forecasting and Warning Services (IBFWS)
Figure 6: Nature of the BMKG and BNPB collaboration8
The UK Meteorological Office: Quantifying impacts via model-based methods
The UK Meteorological Office (UKMO) has issued impact-based warnings since 2011, which are based
on a combination of the severity of potential impacts and the likelihood of those impacts occurring, as
determined using a risk matrix. This provides a qualitative indication of the types of impacts expected for
each weather type and impact level.9
(a) Vehicle OverTurning (VOT) model
The UKMO implements a model-based approach for identifying impacts, using the Vehicle OverTurning
(VOT) model (Figures 7 and 8). The VOT model was developed to test the hypothesis that risk models
can be run in real-time for short-term weather-related hazards. The UKMO collaborated with the Transport
Research Group at Birmingham University to use a mechanical model to calculate accident gust speeds
for different vehicle types. The objective was to provide a consistent assessment of potential risk to road
users in Great Britain during high-wind events by highlighting areas of the road network that are at risk of
disruption due to vehicle overturning.
8. Powerpoint Presentation by Indonesia Agency for Meteorology Climatology and Geophysics for the Joint Workshop on
Strengthening Multi-Hazard Early Warning Systems and Early Actions in Southeast Asia in Bangkok, Thailand on 18-20 February
2020
9. UK Met Office, 2017
12Module 1
Introduction to Impact-based Forecasting
Figure 7: Weather warnings provided by the National Severe Weather Warning Service10
• The approach starts with a definition of the hazard. The WMO Guidelines define a hazard as a
hydrometeorological-based, geophysical or human-induced element that poses a level of threat to
life, property, or the environment.
• Subsequently, vulnerability is quantified. Defined as the susceptibility of exposed elements in the
WMO Guidelines, the vulnerability of a location is defined in terms of factors such as the number of
lanes, road orientation, and altitude of the road section.
• The next step is to quantify exposure, which refers to who and what may be affected in an area in
which hazardous events may occur. In this case, the exposure may be quantified as the total volume
of traffic traversing a particular location.
• Finally, the risk of a vehicle overturning is calculated by multiplying all three equally weighted
components of hazard, vulnerability, and exposure together.
10. https://www.metoffice.gov.uk/weather/guides/warnings/
13Manual for Operationalizing Impact-based Forecasting and Warning Services (IBFWS) Figure 8: Visualization of impact forecasts from the VOT model11 This approach is an example of combining probabilistic hazard information (i.e., on wind gust and direction) with vulnerability and exposure data to produce impact forecasts, thereby facilitating the identification of parts of the network that are likely to experience vehicle-overturning incidents (Figure 9). Figure 9: Color-coded risk matrix used to convey the severity of warnings 11. Hemingway & Robbins, 2020 14
Module 1
                                                                                       Introduction to Impact-based Forecasting

(b) Surface Water Flooding model
A similar approach that is being developed by the UKMO is the Surface Water Flooding model, which builds
forecasts based on UKMO predictions of likely rainfall. These probabilistic rainfall forecasts are converted
into surface water runoff using a Grid-to-Grid model by the Centre of Ecology & Hydrology (Figure 10).
Impact and vulnerability conditions are combined with the runoff model output to produce scenario maps
of flood impact severity. These maps form the basis for country-wide risk scores linking potential impacts
and likelihoods.

Figure 10: Overview of the Surface Water Flooding Hazard Impact model produced by the Flood Forecasting
Centre in collaboration with the UK Meteorological Office12

The South African Weather Service: Defining impact thresholds qualitatively
In 2020, the South African Weather Service (SAWS) introduced a new severe weather warning system
that provided impact-based warnings rather than threshold-based warnings (Figure 11). In identifying
hazard impacts, SAWS adopted a qualitative approach as opposed to a model-based approach whereby
hazard forecasts are translated into qualitative and selected impacts by emergency managers on the
ground. This approach means that emergency managers make the choices on which impacts deserve to
be communicated, and which ones are left out.

  •   Like the approaches discussed in the previous examples, the SAWS approach first starts by
      generating a weather forecast.
  •   The forecasted impact levels are then determined based on impact tables generated in close
      collaboration with relevant stakeholders (including disaster managers from each district nationwide)
      through stakeholder workshops.
  •   Once the forecasted level of impact is determined, the district disaster managers are contacted prior
      to the issuance of the impact-based weather warnings.
  •   Lastly, the impacts are verified and evaluated in collaboration with local disaster managers as well
      as published media reports.

12. http://www.naturalhazardspartnership.org.uk/science/hims/surface-water-flooding/

                                                                                                                         15
Manual for Operationalizing Impact-based Forecasting and Warning Services (IBFWS) Figure 11: Warnings on the South African Weather Service13 The Australian Bureau of Meteorology: Managing insufficient data availability Impact-based Forecasting for the Coastal Zone: East-Coast Lows was a project focused on the wind impact on residential buildings. However, the Bureau of Meteorology (BOM) lacked data for determining the relationship between building damage and weather conditions, which can then be used to forecast levels of impact from a hazard. To address this, the BOM processed available records on past damage to residential properties caused by all kinds of hazards, retaining only those records related to the hazard of interest. These records were then analyzed in conjunction with relevant data on hydrometeorological conditions and events to identify damage curves and vulnerability relationships. The derived relationships were then used to forecast potential impacts on residential properties. The Republic of Korea & Bangladesh: Targeted warnings for user sectors The Republic of Korea (ROK) has pilot-tested a system for generating impact-based forecasts and warnings for heatwaves and cold waves. This is based on model-based probabilistic forecasts of thermal indices. The forecasts are converted from grid-point alerts to areal alerts for 165 regions, with risk maps updated twice a day for the following 3 days (Figure 12). The forecasts, warnings, and recommended actions provided by this system are broken down into specific sectors, such as public health, industry, and agriculture. 13. https://www.weathersa.co.za/home/warnings 16
Module 1
                                                                                        Introduction to Impact-based Forecasting

Figure 12: Impact-based forecasting in the Republic of Korea14

Similarly, Bangladesh is initiating efforts to administer IBFWS via the Multi-Hazard Risk Vulnerability
Assessment Mapping and Modelling (MRVA) program (Sai, Cumiskey, Weerts, Bhattacharya & Haque Khan,
2018). Rather than using quantitative approaches to define and forecast impacts, they used a community-
based approach by directly soliciting inputs from stakeholders of interest. Impacts are delineated per
sector in terms of crop damages, school closures, and disaster management warnings (e.g., households
or roads inundated, power blackouts). This approach of targeting forecasts and warnings towards specific
stakeholders yields the benefit of encouraging effective mitigation actions within targeted sectors.

Opportunities
Impact-based forecasting enables anticipatory actions and revolutionizes responses to weather and
climate crises, providing national and local authorities the opportunity to anticipate and coordinate
preemptive measures to mitigate the impacts resulting from climate-related events and hazards. The
increasingly advanced and widespread use of data collection technologies and methods has led to an
abundance of high-resolution data which will further strengthen the accuracy of impact-based forecasts.

14. Second KMA/WMO Workshop on Impact-based forecasts in Asia. Seoul, Republic of Korea, 19-21 November 2018

                                                                                                                          17
Manual for Operationalizing Impact-based Forecasting and Warning Services (IBFWS) Where data is lacking, advanced tools in data analytics, including machine learning and artificial intelligence, may be used to fill in the gaps based on historical as well as existing and available data. An example is the Specialized Expert System for Agro-Meteorological Early Warning (SESAME) tool implemented by Regional Integrated Multi-Hazard Early Warning System for Africa and Asia (RIMES) in Myanmar. SESAME integrates location-specific weather forecasts, historical climate data, and location-specific prioritized crop information to translate climate information of different timescales into agricultural plans and decisions. Such a system helps users to arrive at location- and crop-specific cost-effective strategies and measures to manage potential impacts from extreme weather and climate events. The SESAME system is also operational in Cambodia, Sri Lanka, and Papua New Guinea. Decision-support systems offer opportunities for close collaboration between NMHS agencies and other stakeholders in a country. The SESAME system in Myanmar demonstrates this clearly, where the Department of Meteorology and Hydrology hosts the system but the Department of Agriculture uses it. By capitalizing on the expertise of NHMS in developing weather and hydrometeorological hazard forecasts, impact-based warnings can be generated and capitalized upon to inform measures that can strengthen the resilience of communities and reduce losses suffered by nations as a whole. Challenges There are multiple challenges involved in the production of effective and accurate impact-based forecasts. Primarily, the limitations are related to the limited availability of data with high resolution and coverage. The lack of directly relevant data was a notable challenge in the IBF project by the Australian Bureau of Meteorology, as described above. In that project, the lack of damage survey data made it challenging to identify the vulnerability-exposure relationship which was needed to identify communicable impacts from hazards. Ultimately, the project team implemented a sophisticated data filtering approach on existing data to obtain the relevant information required to facilitate impact-based forecasting. Another challenge pertains to the quality and varying resolutions of input data on forecast outputs. For example, the UKMO used the 2km resolution of wind gust forecasts in conjunction with the VOT, which precluded the accurate modelling of local-level turbulence. As another example of how varying data inputs may change data outputs, the Australian Bureau of Meteorology found that the impact forecasts switched from none to moderate after switching from a 21-hour forecast to a 3-hour forecast. These challenges must be carefully considered when producing impact-based forecasts. Additionally, up-to-date data on vulnerability and exposure profiles is required to strengthen the quality of impact forecasts and risk assessments. As demonstrated in this manual, this data is used to generate impact-based forecasts, which in turn directly informs the responses taken by the NMHS and other relevant agencies. Unfortunately, the necessary up-to-date information may not always be readily available. Finally, the seasonal forecast data (for example, as discussed in Module 3) is probabilistic in nature. This necessitates careful interpretation of not just the potential impacts identified, but also the other information which are used for monitoring and assessment of potential risks. The communication of these impact outlooks to the user sectors must also ensure a strong understanding of the probabilistic nature of the results. 18
Module 1
                                                                                            Introduction to Impact-based Forecasting

Impact-based forecasting conceptual framework of the manual
The examples included in this manual demonstrate the myriad ways in which IBFWS can be developed
and implemented. Figure 13 provides a visualization of the impact-based forecasting concept that will be
employed in the following modules of this manual.

Figure 13: Components of an impact-based approach to forecasting15

Input data layers encapsulating information on hazards, exposure, and vulnerability are gathered and
combined. Each data layer should be in GIS format and typically consists of maps explicating the forecasted
geographic extents of the hazard phenomena or the distribution of entities of interest (exposure) as well as
information on the state of those entities (vulnerability). By overlaying these data layers and identifying the
locations where hazards intersect with up-to-date locations of highly exposed and/or vulnerable entities,
users can identify hazard hotspots which may then be targeted for monitoring and preventive measures
that have the potential to greatly mitigate damage and losses.

This training manual aims to provide a step-by-step guideline for overlaying these layers and subsequently
deriving the insights required for a risk assessment that forms the backbone of impact-based forecasts.

15. ESCAP (2021) Overview of the work of the secretariat and the United Nations system at the regional level. ESCAP/CDR/2021/INF/1

                                                                                                                              19
Manual for Operationalizing Impact-based Forecasting and Warning Services (IBFWS) References EM-DAT: The Emergency Events Database - Université catholique de Louvain (UCL) - CRED, D. Guha-Sapir - www.emdat.be, Brussels, Belgium. ESCAP (2021) Overview of the work of the secretariat and the United Nations system at the regional level. ESCAP/CDR/2021/INF/1 Hemingway, R., & Robbins, J. (2020). Developing a hazard‐impact model to support impact‐based forecasts and warnings: The Vehicle OverTurning (VOT) Model. Meteorological Applications, 27(1), e1819. Richter, H., Arthur, C., Wilke, D., Dunford, M., Ebert, B. & Wehner, M. (2020). impact-based forecasting for the coastal zone - East Coast Lows: annual report 2019-2020, Bushfire and Natural Hazards CRC, Melbourne. Sai, F., Cumiskey, L., Weerts, A., Bhattacharya, B., & Haque Khan, R. (2018). Towards impact-based flood forecasting and warning in Bangladesh: a case study at the local level in Sirajganj district. Natural Hazards and Earth System Sciences Discussions, 1-20. Weigold, M.F. (2001). Communicating science: A review of the literature. Science communication, 23(2), 164-193. World Meteorological Organization (WMO) (2015). WMO Guidelines on Multi-hazard Impact-based Forecast and Warning Services. [online]. World Meteorological Organization. Available at: https://public. wmo.int/en/media/news/wmo-updates-guidelines-multi-hazard-impact-based-forecast-and-warning- services [Accessed 1 March 2021]. United Kingdom Met Office (UKMO) (2017) What are the National Severe Weather Warning Service Impact tables? [online]. Met Office. Available at: http:// www.metoffice.gov.uk/guide/weather/severe-weather- advice [Accessed 26 March 2021]. United Nations Economic and Social Commission for Asia and the Pacific (ESCAP) (2019). Asia-Pacific Disaster Report 2019 _____________________ (2021). Asia-Pacific Disaster Report 2021 (forthcoming) 20
Module 1
Introduction to Impact-based Forecasting

                                  21
MODULE 2 IMPACT-BASED FORECASTING FOR TYPHOONS Viet Nam experiences frequent typhoons (tropical cyclones), which can incur significant impacts on people and their livelihoods and result in huge economic losses. Strategic use of weather forecasts and climate indicators, together with exposure and vulnerability information, can inform early warnings that stimulate early action and reduce disaster impacts. This module helps users to understand various datasets on exposure and vulnerability that can be used in conjunction with typhoon forecasts to garner important insights for disaster risk management. The module also demonstrates how to identify exposure and vulnerability hotspots and assess potential impacts from typhoons using examples within a Viet Nam context. Objective: To produce impact-based forecasting for typhoons. Module 2 provides guidance to produce impact-based forecasting using typhoon forecasts with examples from Viet Nam Contents • Introduction to data layers • Preparing hazard layers • Assessing population exposure to typhoons • Assessing the vulnerability of the population exposed to typhoons • Assessing agricultural exposure to typhoons • Assessing energy powerplants exposure to typhoons • Assessing critical infrastructure exposure to typhoons • Assessing economic stock exposure to typhoons • Assessing possible convergence with COVID-19 and potential impacts on the health system 22
Module 2
                                                                                                           Impact-based Forecasting for Typhoons

Introduction to data layers
The three required categories of data used for impact-based forecasting are hazards, exposure, and
vulnerability data layers.

     •     Hazards data should comprise the geographic coverage and magnitude of the hazards as this
           enables delineation of the areas of concern. Examples of such data would include weather forecasts
           or flood maps that identify the potential heights of floodwaters under various flood return periods.
           Given the focus of this module, a case study of Typhoon Molave is employed. Two maps describing
           the hazards are used: firstly, a map consisting of typhoon track and maximum wind speeds is
           used as the example hazard layer. The threshold wind speeds for each category of severity should
           be identified, and the spatial extents of each category delineated in GIS vector format. Secondly,
           probabilistic forecasts1 for maximum rainfall associated with the typhoon, in GIS raster format.

     •     The exposure data layer should answer the question: where are the entities of concern? These entities
           may be the general population or critical infrastructures, such as power plants, telecommunication
           towers, and key transportation hubs (e.g., maritime ports or airports). Focus can also be given to
           the capacities of facilities providing access to basic services (such as health and education) to
           ensure that these facilities will not be overburdened. Other exposure data may be on the distribution
           of fishery, aquaculture, and agricultural production, or similar production data relevant to economic
           wellbeing. In this module, we examine exposure data related to population distribution, agricultural
           production, as well as the characteristics of facilities related to energy infrastructure and healthcare.

     •     The final data layer relates to the condition or state (vulnerability) of the exposed entities. For
           example, it would be useful to know where certain vulnerable groups (i.e. elderly populations) within
           the exposed population are located for more targeted interventions and early warnings. Hazard
           incidence may have a disproportionate impact on such population groups. This module showcases
           how vulnerability data can be used to identify potential hotspots for targeted interventions. This data
           can cover population structure (e.g., female, children, and elderly populations) and human development
           indicators such as the Subnational Human Development Index (SHDI). Other vulnerability indicators
           include access to basic services and high burdens on local healthcare system capacities.

     •     Other contextual data required for the analysis include vector data (shapefiles) delineating the
           national and subnational boundaries of the country of interest. In this manual, we make use of
           shapefiles delineating the national, provincial, and district division boundaries of Viet Nam.

Preparing hazard layers
The basic hazard data layers would be weather forecasts produced by NMHS agencies. This data depicts
the spatial extent and magnitude of the event, such as the total amount of rainfall or maximum wind speeds.
For this module, data from Viet Nam Meteorological and Hydrological Administration (VNMHA) and the
National Oceanic and Atmospheric Administration (NOAA) are used to demonstrate some examples.
The examples are based on Typhoon Molave, which made landfall on 28 October 2020 and caused an
estimated total of US$430 million in damages (Figure 1).2 In the following example, the typhoon wind field
map was redrawn from NOAA data, and thus may contain some inaccuracy.

1.       A probabilistic forecast consists of a set of probabilities representing the probability of occurrence of a set of potential future events,
         as opposed to a deterministic forecast, which “predicts” one specific outcome as the forecast. For example, a 70% probabilistic
         forecast for 100mm rainfall over 24 hours indicates a 70% probability of 100mm of rainfall occurring over 24 hours.
2.       https://www.bloomberg.com/news/articles/2020-11-01/vietnam-estimates-typhoon-molave-caused-430-million-of-damage

                                                                                                                                              23
Manual for Operationalizing
Impact-based Forecasting and Warning Services (IBFWS)
Figure 1: Typhoon Molave tracks (left) and forecasted maximum wind speed categories map
at a select point in time (right)
Data Source: VNMHA and NOAA
How to:
üü In this example, the NOAA image characterizing a snapshot of Typhoon Molave conditions was converted
to raster data using the Raster ¨ Georeferencer tool in QGIS (Figure 2, left). Annex III of this manual
contains additional detail on this process.
üü This was converted to vector data by creating a new Shapefile layer and adding polygons in accordance
with the newly georeferenced raster layer.
üü The resulting shapefile consists of multiple overlapping vectors, each indicating a different wind speed
category (Figure 2, center).
üü These vectors can be processed to be non-overlapping vectors by first using the Polygon Self-Intersection
tool in QGIS, and subsequently removing the overlapped portions of the vectors by editing the attribute
table of the layer (Figure 2, right).
Figure 2: View of typhoon wind speed categories (left), with overlapping polygons (center)
and non-overlapping polygons (right)
Data Source: NOAA
24Module 2
Impact-based Forecasting for Typhoons
Similarly, the exposure to extreme rainfall associated with typhoon occurrence can be quantified. The
following examples make use of probabilistic forecasts for rainfall associated with Typhoon Molave
provided by the VNMHA in .NC file format (Figures 3). These data layers can be combined to produce a
single map containing all hazard types, to identify areas where multiple extreme rainfall events coincide
(Figure 4).
Figure 3: Probabilistic forecast for 50 mm and 100mm rainfall over 24 hours with 24 hour lead time (left),
48 hour lead time (center), and 72 hour lead time (right)
Data Source: VNMHA
Figure 4: Probabilistic forecast for 50 and 100 mm rainfall over 24 hours, with 24 hours,
48 hours and 72 hours lead time combined
Data Source: VNMHA
25Manual for Operationalizing
Impact-based Forecasting and Warning Services (IBFWS)
How to:
üü To process the multiple probabilistic rainfall layers, the Vector ¨ Polygonize tool can be used to convert
each raster image to vector data.
üü Subsequently, the field calculator is used on the newly vectorized features to assign labels to each polygon
based on predefined categories using the CASE expression (Figure 5).
üü In this example, rainfall probabilities above 50% are categorized as high probability, and 50% and below as
low probability.
üü Subsequently, the newly vectorized data layers can be merged (Vector ¨ Merge tool) to form a single data
layer.
Figure 5: The expression used in the Field Calculator for categorizing the rainfall probabilities
The column “DN” stands for “Digital Number”, indicating the vector record of the corresponding raster value. In
this example, the DN column indicates the probability of rainfall exceeding a certain threshold.
26Module 2
Impact-based Forecasting for Typhoons
Assessing population exposure to typhoons
(a) Preparing the population exposure data layers
The exposure and vulnerability datasets should convey the spatial distribution of entities of interest. This
example examines the exposure and vulnerability of populations and vulnerable population groups. Such
information can be derived from government datasets (e.g., census or other national statistical data).
In this manual, Worldpop gridded population data is used.3 The Worldpop database further contains
estimated population breakdown by gender and age groups. For example, there are data layers for male
and female populations aged 65 to 70, 70 to 75, and so on. (Figure 6). To obtain the spatial distribution
of population groups such as female, children (i.e., aged 15 and below), and the elderly (i.e., aged 65 and
above), the disaggregated data sets should first be merged by summing the values in each data layer.
Figure 6: Spatial distribution of the overall population (upper left), female population (upper right),
the elderly population (lower left), and population of children (lower right)
Data Source: Worldpop
3. Lloyd, Sorichetta & Tatem, 2017
27Manual for Operationalizing
Impact-based Forecasting and Warning Services (IBFWS)
How to:
üü To aggregate the population values, the Raster ¨ Merge tool in QGIS can be used on the individual raster
files.
üü Subsequently, the Zonal Statistics tool can be used on the gridded population datasets and the
administrative boundary shapefiles, with “Sum” selected as the Statistic to Calculate, to sum the grid cell
values (indicative of the size of population) within each underlying vector data feature of interest.
üü In this case, each data feature in the administrative shapefile layer should represent an administrative area.
This adds a column to the hazards data layer containing total population size in each administrative area.
(b) Visualizing areas with high population exposure to hazards
Once the hazard layer and demographic layer are prepared, the hazard maps can be overlaid with the
population distribution maps to identify areas with large populations exposed to a hazard. As a hazard
poses a higher risk if the hazard extent overlaps with more exposed entities, this helps identify the urgency
of implementing measures to manage the potential hazard.
As an example, Figure 7 identifies areas likely to face strong winds with the distribution of total population
and population subgroups across the country. In this case, a large population size along the coast is likely
to face 25.7 m/s wind speeds from Typhoon Molave.4
Figure 7: Hazard extents overlaid with population distribution maps
4. Scale 10 in Beaufort scale
28Module 2
Impact-based Forecasting for Typhoons
Data Source: Worldpop and NOAA
(c) Calculating the size of the population exposed to hazards
To identify the areas with large population exposure, it is possible to calculate the total population (or sub-
groups of the population) residing in the areas expected to face strong winds. The exposed population
can be assessed as a proportion of the total population to contextualize the magnitude of exposure. In
the case presented here, as of 27 October 2020, approximately 4.5 million people (or 4.55% of the total
population) have a more than 50% probability of facing 25.7 m/s wind speeds (Figure 8).
Figure 8: Total population in each category of forecasted extreme wind speed probability
Probability (%) of
Population exposed Total population % of population exposed
strong wind (25.7m/s)
> 90 2,412,500 2.48%
71 - 90 874,091 0.90%
97,411,255
50 - 70 1,134,937 1.17%
< 50 2,627,150 2.70%
How to:
üü Using the categorized vector data for probabilistic rainfall categories, apply the Zonal Statistics tool using
the gridded population datasets and the hazards layer.
üü Next, apply the Zonal Statistics tool with “Sum” selected as the Statistic to Calculate.
üü This adds a column to the hazards data layer containing total population size in each hazard category.
29Manual for Operationalizing
Impact-based Forecasting and Warning Services (IBFWS)
How to:
üü To estimate the sizes of the population exposed to extreme winds, use the Zonal Statistics tool with the
gridded population data and the forecasted extreme wind speed probability layer.
üü In this case, the hazards layer consists of features corresponding to the spatial extents of ranked 25.7 m/s
wind speed probabilities).
üü The population in each vector feature can then be summed to obtain the sizes of populations exposed to
each wind speed probability (Figure 9).
Figure 9: Number of population groups exposed
Probability (%) of
Population exposed Female (%) Children (%) Elderly (%)
strong wind (25.7m/s)
> 90 2,412,500 1,285,118 (53.3) 610,637 (25.3) 141,424 (5.9)
71 - 90 874,091 410,900 (47.0) 213,793 (24.5) 41,600 (4.8)
50 - 70 1,134,937 602,119 (53.1) 312,810 (27.6) 66,836 (5.9)
< 50 2,627,150 1,386,955 (52.8) 706,693 (26.9) 151,661 (5.8)
(d) Identifying administrative areas with high hazard exposure
As shown above, using probabilistic forecasts for extreme rainfall with multiple lead times makes it
possible to visually identify the regions with a high potential of sustained extreme rainfall. However, it
may be of further interest to decision-makers to know the names of administrative areas (e.g., districts
or provinces) that face a substantial threat, as risks and recommended mitigative actions can then be
conveyed to the relevant subnational and local officials.
Beyond simply identifying the names of districts or provinces that face each type of hazard, it is also
necessary to identify locations where these threats can concatenate, thereby with a higher probability
of being affected. This information can be presented in the form of a matrix whereby the areas facing a
low (e.g., 50 mm/24 hours for the next 48 hours) or high (e.g. 100 mm/24 hours for the next 48 hours)
sustained exposure to hazards can be categorized and shown as in Table 1.
Table 1: (Selected) Regions facing high probabilities of above 50mm rainfall per day
48-hour lead time
50 mm / 24 hr 100 mm / 24 hr
Thua Thien Hue, Quang Nam, Quang Ngai, Kon Thua Thien Hue, Quang Nam, Quang Ngai, Kon
24- hour 50 mm / 24 hr
Tum, Gia Lai, Da Nang city, Binh Dinh Tum, Gia Lai, Da Nang city, Binh Dinh
lead time
100 mm / 24 hr Quang Nam, Quang Ngai, Kon Tum, Binh Dinh Quang Nam, Quang Ngai, Kon Tum, Binh Dinh
30Module 2
Impact-based Forecasting for Typhoons
How to:
üü To identify the names of regions facing high risk, use the Dissolve tool on the categorized probabilistic
rainfall data, with the Dissolve Field input specified as the “Category” column.
üü Then, the Intersect tool is used to identify the administrative regions that intersect with each probabilistic
rainfall category (Figure 10).
üü The output may be transferred to a spreadsheet (or similar software) in which the provinces facing 50mm
and 100mm probability rainfall over the 24-hour and 48-hour lead times are identified (see Table 1 example
output).
Figure 10: View of attribute table of the Viet Nam province data layer, with each province assigned
a forecasted maximum rainfall category
ADM1_EN Category
3 Quang Nam High
4 Quang Ngai High
5 Kon Tum High
6 Gia Lai High
7 Da Nang city High
8 Binh Dinh High
9 Thua Thien Hue Low
10 Soc Trang Low
11 Tay Ninh Low
Assessing the vulnerability of the population exposed to typhoons
Beyond identifying the exposure of the population to hazards, it would be helpful to understand the
vulnerability characteristics of the population exposed, such as the elderly (as demonstrated above), or
other socio-economic vulnerability (such as poverty rates or SHDI). Indicators that reflect socio-economic
vulnerabilities may be used to identify the distribution of vulnerable populations in a country. In this example,
data on poverty rates and SHDI is utilized (Figure 11). This data was gathered on a sub-national (provincial)
level from the Viet Nam General Statistics Office and the United Nations Development Programme (UNDP)
respectively and mapped into a vector format.
How to:
üü The same steps as performed in the fisheries/aquaculture production and livestock density calculations
may be used to generate a list of provinces that face both severe hazard exposure and contain large
vulnerable population groups.
31Manual for Operationalizing Impact-based Forecasting and Warning Services (IBFWS) Figure 11: Poverty rate (left) and HDI (right), overlaid with Typhoon Molave Data Source: Viet Nam General Statistics Office and UNDP Due to the lack of higher resolution data on these indicators, provincial/sub-national level data is used in this manual for demonstration purposes. If more disaggregated data is available, such as from government records or census for sub-districts or communities, then higher resolution vulnerability maps can be produced for use in conjunction with hazard maps. This can help further identify areas with a high concentration of vulnerable groups which can be targeted for disaster mitigation and response measures. Assessing agricultural exposure to typhoons Impact-based forecasting can also provide information on potential impacts on agricultural and maritime production. Data on the spatial distribution of agricultural production and value (or alternative indicators) is required. This example uses data by the Spatial Production Allocation Model (SPAM) of the Food and Agriculture Organization (FAO), which produces gridded data on estimated agricultural production and value, based on the type of agricultural products. These maps may be overlaid with the hazards data to visually display the exposed regions (Figure 12). If available, data records held by agricultural ministries or agencies can be used in lieu of global datasets, as locally or nationally collected data is expected to be more accurate. 32
Module 2
                                                                                           Impact-based Forecasting for Typhoons

Figure 12: Agricultural production data overlaid with hazard data

Data Source: Spatial Production Allocation Model by the FAO

Figure 13: Areas exposed in terms of agricultural production to extreme rainfall

                                                                      mm/day              % of areas exposed in terms of
                   Lead time
                                                              (50% probability or more)      agricultural production

                                                                         50                           4.74%
               24-hour lead time
                                                                        100                           1.41%

                                                                         50                           8.11%
               48-hour lead time
                                                                        100                           4.44%

                                                                         50                           1.79%
               72-hour lead time
                                                                        100                           0.08%

Figure 13 shows the estimated percentage of agricultural areas exposed to extreme rainfall, in terms of
agricultural production quantity. It was found that areas attributed with 6.2 percent, 12.6 percent, and 1.8
percent of agricultural production are exposed to 50mm or more rainfall (50% or higher probability) with
24-, 48- and 72-hour lead times respectively. It shall be noted that the agricultural production data used
in this example consists of yearly estimates, and therefore does not reflect the specific local agricultural
conditions at the time of typhoon landfall. However, given the lack of higher resolution data, this analysis
can shed light on potential impacts on the agricultural sector.

                                                                                                                          33
Manual for Operationalizing
Impact-based Forecasting and Warning Services (IBFWS)
How to:
üü As the SPAM data is in the same format as the Worldpop data explained above, the same steps for analysis
can be performed to calculate the amount of agricultural value exposed to each category of wind speed
and probabilistic rainfall forecast.
üü This entails using the Zonal Statistics tool to sum the value of agricultural production in each hazard
vector (e.g., administrative region).
üü The same steps may be performed with the agricultural production data to identify exposed agricultural
production values.
Other examples of datasets that may be used to characterize exposure are production data on fishery and
aquaculture production or spatial distribution of livestock density (Figure 14). Fishery and aquaculture
production and the number of livestock in the areas expected to be hit by Typhoon Molave were at medium
levels. Provinces on the coast had from 15,000 to 150,000 tons of fishery and aquaculture production, and
raised between 5,000 and 10,000 livestock in 2019. As some provinces may span across multiple wind
speed probabilities, those provinces may be displayed multiple times. For example, the Kon Tum, Binh Dinh,
Gia Lai, and Quang Nam provinces extend across all wind speed probability categories. Of these, the Binh
Dinh and Quang Nam provinces contain the highest concentration of livestock. Da Nang City is revealed
to be fully situated in the least severe wind speed category, as well as with the lowest concentration of
livestock, thereby indicating both low hazard and livestock exposure.
Figure 14: Fishery and aquaculture (left) production and livestock (right)
Data Source: Viet Nam General Statistics Office
34You can also read