Byres Road Vitality and Viability Report
←
→
Page content transcription
If your browser does not render page correctly, please read the page content below
Byres Road Vitality and Viability
Report

Report for Byres Road Traders Association and
Glasgow City Council

December 2014

EKOS Limited, St. George’s Studios, 93-97 St. George’s Road, Glasgow, G3 6JA
Reg 145099

Telephone: 0141 353 1994
Web: www.ekos-consultants.co.uk
Direct enquiries regarding this report should be submitted to: Mhairi Donaghy, Associate Director, EKOS Email: mhairi.donaghy@ekos.co.uk Tel: 0141 353 8309 As part of our green office policy all EKOS reports are printed double sided on 100% sustainable paper
Contents

1.   Introduction                          1

2.   Area Diversity                        6

3.   Shopper Survey                       16

4.   Socio-Economic Baseline              36

5.   Assets Base and Future Development   51

6.   Conclusions and Recommendations      57
1. Introduction
         EKOS Economic and Social Development was commissioned by the Byres Road
         Traders Association (BRTA) to undertake ‘Vitality and Viability’ research, focusing on
         economic issues. The output from the research enhances the evidence base to
         establish a Business Improvement District (BID) for Byres Road, but also informs a
         Strategy and Action Plan being prepared by Glasgow City Council for the future
         development of Byres Road.

         BRTA has been awarded seedcorn grant funding by the Scottish Government to
         develop a proposal to establish a BID for Byres Road.

          A BID is a precisely defined geographic area where the businesses have come
          together to invest collectively in local improvements. It is not a substitute for
          central or local government investment, but an additional investment that will
          strengthen the local economy and give local businesses a unified voice. It helps
          to create an arena for businesses and local authorities to increase their
          understanding of each other’s priorities.

1.1 Byres Road – Area Context

         Byres Road is the main high street of the West End of Glasgow and the most
         important retail street outside the city centre. The wider Partick/Byres Road area is
         identified as a Strategic Centre in the Structure Plan 1 and a Tier 2 Centre in City
         Plan 22.

         From the Botanic Gardens in the north to Partick Cross in the south, it is a busy
         commercial street that, along with its network of back lanes, attracts a large day and
         night time visitor population that uses the convenience and specialist shops, bars,
         restaurants and cinema. This diversity has a significant impact on the character and
         feel of the area, as well as on the local economy.

         Byres Road is not just a retail destination, but also provides an important social and
         leisure function with a wide range of functions and facilities for local residents and
         attractions for visitors and, as such, plays the dual roles of serving the highly dense

1 Glasgow and the Clyde Valley Strategic Development Plan
2 Glasgow City Council City Plan 2, December 2009

Byres Road Vitality and Viability: BRTA and GCC
                                                                                                   1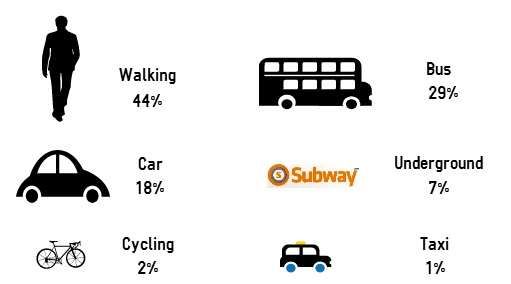
locality as well as contributing to the city’s tourism economy. The catchment
         population for the wider Partick/Byres Road area is around 45,000 local residents,
         but there are major issues with retail expenditure leakage – primarily to the City
         Centre but also large volumes to Braehead Shopping Centre 3.

         Visitors are attracted from the wider city region for the area’s different shopping offer
         (specialist independent shops), range of cafés and the setting within the wider
         ‘charming’ west end. The street is also close to an impressive range of visitor
         attractions, including the Botanic Gardens, Kelvingrove Art Gallery and Museum, the
         Hunterian Museum and the Riverside Museum – all of which are recognised as
         international visitor attractions.

         Glasgow University’s main campus adjoins Byres Road and a large number of
         students and staff live in the local area, which has contributed to a slightly bohemian
         character over many years. Glasgow University is currently preparing a Campus
         Development Framework to guide the future development and expansion of its
         campus, which will include the recently acquired site of the former Western Infirmary
         that adjoins Byres Road to the south.

         Byres Road has a vibrant buzz and feel of a traditional high street, although its
         character is different from top to bottom. The part of the street north of University
         Avenue is a Conservation Area. It contains larger retail floor plates and is
         designated as the ‘Principal Retail Area’ in Glasgow’s City Plan 2 (and emerging City
         Plan 3), with a limit of no more than 20% ground floor non-Class 1 retail uses.

         The area south of University Avenue contains no such designations and is
         characterised by smaller floor plates, fewer bars/cafés, more estate agents and
         small local shops and services (e.g. hairdressers and beauty salons). Consequently,
         visitors tend to focus on the upper half of Byres Road and the lower half is quieter
         both in terms of traffic and pedestrians. The southern end of Byres Road gives the
         appearance of poorer quality, partly influenced by the derelict site of the former
         swimming baths and the blank wall of the Western Infirmary.

         Byres Road is very well served by public transport – there are a range of bus
         services, two underground stations and a train station at Partick (c. ten minute walk
         from the southern end of Byres Road). This good connectivity with the city centre

3 Partick/Byres Road Town Centre Profile, Glasgow City Counil

Byres Road Vitality and Viability: BRTA and GCC
                                                                                                     2
and the rest of Glasgow means that many visitors use the area as a cultural
attraction and day/evening destination.
1.2 Byres Road – Issues
Byres Road has retained a good mix of local traders and multi-national retailers.
However, like many areas the impact of the recession has led to an increase in
vacant retail units and greater uptake by charity shops. While it is important that the
area retains its key retailing function, it is important to take account of changes in
shopper needs and behaviour (creating less demand for traditional retail floorspace)
and identify alternative uses for property that add to the mix of uses and create
footfall (increased demand for food and drink outlets).
Local traders have expressed concern regarding high rent and rates, which they
believe is displacing activity from Byres Road into surrounding areas that are
deemed more affordable e.g. Kelvinbridge, Queen Margaret Drive, Hyndland and
Finnieston. Increasingly difficult trading conditions for retail businesses has led to a
decline in the number of independent retailers operating on Byres Road – this has
affected the character and USP of the street i.e. the reason that people visit.
Concerns have also been voiced about the higher proportion of multi-national chains
as well as an increasing proportion of cafés, bars and restaurants in comparison to
retail outlets.
The street has also been affected by infrastructure and public service changes, such
as the withdrawal of the BBC from Queen Margaret Drive and the ongoing gradual
withdrawal of the Western Infirmary, its staff and patients, from the bottom of the
street. These are having, and will continue to have, an impact on footfall and
revenue generation.
The street current suffers from poor ‘place quality’ – traffic dominance, narrow
pavements, street clutter (poles, signs, etc) and poor/cracked/deteriorating paving
make for a poor pedestrian experience and detracts from the attractiveness of the
area as a destination for shoppers and visitors.
Byres Road Vitality and Viability: BRTA and GCC
31.3 Byres Road BID and Place-Making Enhancements
In response to the issues outlined above, and concerns expressed by local traders
and the wider community, two main strands of work have commenced –
development of a BID and preparation of a Place-Making Strategy and Action Plan.
These two projects reflect a renewed vigour in the area and a desire by stakeholders
to prevent further decline of Byres Road and ensure that it thrives in the future.
Byres Road BID
Local traders have formed the BRTA and initiated a BID, which is now in
development. A BID Project Manager has been appointed to work with local
businesses to identify the issues/opportunities, and to develop a Business Plan that
will form the basis of BID investment.
The Byres Road and Lanes Business Improvement District is now formally working
toward a ballot in 2015. The BID area covers Byres Road and the lanes extending
from Great Western Road to Chancellor Street.
Over the recent months the BID Steering Group and Project Manager have finalised
the formal proposal, outlined in the Business Plan, which forms the basis of a ballot
amongst local businesses. The ballot date is provisionally set for 26th February
2015. In total there are 204 properties included in the BID area, of which 7 are
identified as empty, a vacancy rate of 3.4% 4.
Byres Road Place-Making Strategy and Action Plan
Glasgow City Council (GCC) is currently preparing a Strategy and Action Plan to
improve Byres Road and guide its future development. This work has been informed
by, and responds to the issues raised at, community place-making workshops. The
strategy will recommend intervention for the public realm (to reduce traffic
dominance, widen pavements, create civic spaces for people to sit and linger), and
will advise on addressing shop vacancies and a future sustainable range of uses.
Allied to the strategy, GCC is keen to progress activity in the area and improvement
works are currently underway on the lanes adjacent to Byres Road. These works
4 Data taken from BID area baseline, provided December 2014.
Byres Road Vitality and Viability: BRTA and GCC
4will improve the image and perception of Byres Road and create a more attractive
environment against which future activity can build.
Byres Road Vitality and Viability: BRTA and GCC
52. Area Diversity
This section examines the retail offering present in the Byres Road area and how it
fits into existing planning regulations. It also offers comparison with two other city
retail centres – Shawlands (Tier 2 Centre) and Finnieston (Tier 3 Centre).
Retail outlets are classified as follows:
Class 1: retail sale of goods, hairdressers, undertakers, travel and ticket
agencies, post offices, dry cleaners, laundrettes, cold food consumption on
premises, display of goods for sale, hiring out of domestic goods or articles,
reception of goods to be washed;
Class 2: financial, professional or any other service expected in shopping
areas .e.g betting offices, lawyers, accountants, estate agents, health centres,
surgeries of dentists, doctors and vets;
Class 3: restaurants, cafés, snack bars (use for sale of food or drink on the
premises);
Sui Generis: uses not otherwise classified, including public houses, hot food
takeaway, sale or display of motor vehicles, amusement centres, taxi
businesses, vehicle hire; or
Other classes: there are a small number of units on Byres Road that do not fit
under these classifications e.g. Hilton Hotel, Grosvenor Cinema, Skills
Development Scotland office.
Outlets can also be classified by retail categories which are either:
Convenience: units that primarily sell goods that consumers buy frequently
without having to go through a complex decision-making process e.g. food,
beverages, newspapers and hot food takeaway;
Comparison: units that primarily sell goods that consumers buy infrequently
and that they are likely to consider multiple times before making a purchase
e.g. clothing, household appliances, toys, jewellers, etc; or
Service: units that provide a service or good to be consumed on-site rather
than to be taken away e.g. pubs, restaurants, hairdressers, bookmakers,
banks, estate agents, etc.
Byres Road Vitality and Viability: BRTA and GCC
62.1 Byres Road Area
Based on data provided by BRTA, Figure 2.1 outlines the retail classifications and
categories for the whole of the Byres Road area – it is important to note that this
data is based on actual use of the units rather than planning classification.
Just over half of all properties are Class 1 retail units, with the remainder split fairly
evenly between the remaining classifications. Byres Road’s vacancy rate of 7.4%5 is
considerably below the average Scottish rate of 12.2% and UK rate of 12.3%6.
With regards to retail categories, almost half of units provides services, whilst
comparator units outnumber convenience units significantly.
Figure 2.1 Byres Road by Retails Classification
Vacant
Vacant
7%
7%
Sui Generis
9% Convenience
10%
Other Class
7%
282 282 Service
Units Units
Class 1 46%
51%
Class 3
15%
Comparator
36%
Class 2
11%
There are clear differences in the retail use between upper and lower Byres Road 7,
most notably the higher use of Class 1 retail and Other Class in Upper Byres Road
and a greater proportion of Class 2 and Sui Generis usage in lower Byres Road,
Figure 2.2, over. Perhaps surprisingly, due to the image of the lower end being
more dilapidated than the upper end, there is little difference in the vacancy rate.
The large proportion of Class 2 uses in lower Byres Road is due to the high number
of estate agents, whilst the larger number of Sui Generis units is due to a number of
hot food takeaways, rather than a higher numbers of pubs. These types of units are
5 This vacancy rate is based on the database provided by Byres Road BID Manager – it records a different (slightly
lower) rate than the data provided by Glasgow City Council in the vacancy analysis text.
6 http://www.localdatacompany.com/ H2 2013 – this is the most up-to-date data available at the publication date for
this report, December 2014.
7 Where the dividing line is University Avenue/ Highburgh Road
Byres Road Vitality and Viability: BRTA and GCC
7indicative of a retail offering primarily servicing local demand rather than a
destination centre that people will travel to.
This picture is reinforced by looking at retail categories, with a higher proportion of
comparison retail in upper Byres Road and higher proportion of services in lower
Byres Road.
Figure 2.2 Upper (168 units) and Lower (114 units) Byres Road Retail Classification
Vacant Vacant
7% 8%
Sui Generis
Sui Generis
7%
12%
Other Class Other Class
11%
168 2% 114 Class 1
Units Units
Class 1 45%
54%
Class 3
Class 3 15%
15%
Class 2 Class 2
6% 18%
Vacant Vacant
7% 8%
Convenience
10% Convenience
11%
168 Service 114 Service
Units Units
42% 50%
Comparator
Comparator
41%
30%
Byres Road Vitality and Viability: BRTA and GCC
8Figure 2.3, below, shows the trend for the vacancy rate on Byres Road, Ashton Lane
and Cresswell Lane. The number of vacant units begins very low at just 2/3% at the
start of the ten-year period, although this increases rapidly after 2008. This is likely
due to the impact of the economic recession. However, it has since levelled off at
around 8%. The sharp decrease after 2009 is also down to a number of units on
Cresswell Lane, which were classified as vacant in 2008-9, not appearing in data for
subsequent years.
Figure 2.3 Vacancy Rates
14%
12%
12% 11%
10% 9% 9%
% vacant units
8% 8% 8%
8%
6% 5%
4% 3%
2%
2%
0%
2005 2006 2007 2008 2009 2010 2011 2012 2013 2014
N= varies per year between 180 and 189
Figure 2.4, over shows the composition of units over this ten year period. A trend
emerges of a gradual decline in the number of Class 1 units, from 57% to 49%, while
there is also a slight decrease in the number of Class 2 units. Consequently, there is
an overall increase in the number of Class 3 and vacant units, while the Sui Generis
category remains steady at c. 8%. A total of 38 units have been identified as
‘consistently vacant’, meaning they were vacant for two years or longer during the
period examined. However, it should be noted that 10 of these units are on
Cresswell Lane. Eleven units were vacant for four years or more, although not
necessarily consecutively.
Byres Road Vitality and Viability: BRTA and GCC
9Figure 2.4 Composition of units
80%
60%
40%
20%
0%
2005 2006 2007 2008 2009 2010 2011 2012 2013 2014
CLASS 1 CLASS 2 CLASS 3
OTHER CLASS SUI GENERIS VACANT (CLASS 1)
VACANT (OTHER)
N= varies per year between 180 and 189
Planning regulations are in place to limit a change in character of the area, with the
west side of upper Byres Road and the east side between University Avenue and
Cresswell Street classified as the Byres Road Principal Retail Area and covered by
stricter regulations. Figure 2.3, over, presents the class breakdown of retails units in
this zone, with a larger proportion of Class 1 and Class 3 retail than Byres Road as a
whole. There is also a notably larger proportion of convenience units in the principal
retail area.
Figure 2.5 Principal Retail Area
Vacant Vacant
Sui Generis 6% 6%
3%
Convenience
16%
Class 3
63
18%
63 Service
39%
Units Class 1
60% Units
Class 2
13%
Comparator
39%
The planning restrictions state that if the percentage of units that are Class 1 is
below 80% then any changes of existing Class 1 premises to other uses “will not be
considered favourably”. Exceptions are made in the cases of banks or building
societies expanding into neighbouring Class 1 premises or businesses relocating
Byres Road Vitality and Viability: BRTA and GCC
10from existing non-Class 1 premises within the principal retail area under the
condition that the vacated premises can only be used for Class 1 activities.
The restriction is designed to maintain the number of Class 1 premises at its existing
level, however, there is no pressure on non-Class 1 units to be reclassified for retail
use.
There are other restrictions in place outside of the Principal Retail Area:
if the proportion of Class 1 units falls below 70%, vacant units must be
advertised for at least 12 months as Class 1 before consideration will be
given to a change of classification, unless there is a long-term pattern of
class 1 vacancy;
if the proportion of Class 1 units falls below 50% then consideration must be
given to its role as a strategic town centre; and
two adjacent non Class 1 units are not permitted within a street block and
more than 30% of class 1 units in a given block should not be in non-retail
use, unless there are significant vacancy problems.
Planning restrictions outside of the Principal Retail Area are considerably more
flexible, whereby Class 1 units can be changed to another classification if evidence
of a lack of demand for Class 1 units can be provided. This may partially explain the
comparable levels of vacancy within the Upper and Lower sections of Byres Road,
as per Figure 2.2.
Figure 2.6 shows the class breakdown of retail units outside the Principal Retail
Area. This shows considerably less Class 1 units than the Principal Retail Area,
mostly due to the higher numbers of Other Class and Sui Generis units. The
numbers of Class 1 units combined with the vacant units 8 gives a percentage of
Class 1 at 56%, therefore the 70% status, as outlined in the previous bullet points,
applies.
8 In our analysis we have assumed that all vacant units are classified as Class 1.
Byres Road Vitality and Viability: BRTA and GCC
11Figure 2.6 Units Outwith the Principal Retail Area
Vacant Vacant
8% 8%
Sui Generis Convenience
11% 9%
Other Class
9% 219 Class 1
219 Service
Units 48%
Units 47%
Comparator
Class 3 36%
15%
Class 2
10%
The combined 56% Class 1/vacant uses equates to only 13 units above the 50%
threshold whereby consideration of town centre status would need to be given,
therefore any further change away from Class 1 should be considered carefully.
Both within and outwith the Primary Retail Area, the number of Class 1 units is far
below the level for which planning regulations apply. Within the PRA 66% of units
appear to be Class 1/vacant against a target of 80%, whilst outside the PRA 56%
are Class 1/vacant with a target of 70%.
The fact that this is so far away from the target suggests that there is an issue in
relation to the demand for Class 1 retail, against demand for other uses on Byres
Road. This needs to be considered in relation to the resurgence of areas like
Finnieston and sustained occupation of areas like Shawlands – in reviewing these
areas it is clear that bars, restaurants and cafés play an important role both in
occupying properties, and also in generating footfall.
It is therefore important that GCC reviews its 80/20 policy for Byres Road to ensure
that the area continues to compete effectively for occupiers. This policy may no
longer be appropriate given:
changes in retail patterns from consumers – particularly the significant rise in
online shopping, with further growth forecast;
rise in demand for food & drink outlets and for beauty/personal services i.e.
items and services that cannot be purchased online; and
Byres Road Vitality and Viability: BRTA and GCC
12 recognition from a wide range of industry commentators that retail can no
longer be relied upon as the primary sector for town centres – this is covered
by the Scottish Government under the ‘Pro-active Planning’ theme in its
response9 to the National Review of Town Centres, 2013. Within this review
the Government “fully embraces the review recommendation for a simple,
encouraging and pro-active planning policy in support of town centres” and
“Our intention is to ensure that planning policy is efficient, inclusive, fit for
purpose and sustainable to enable action for our town centres”.
As shown in the vacant unit trend analysis (Figure 2.4) the percentage of Class 1,
and to a lesser extend Class 2, units has been gradually decreasing over recent
years, mirrored by a rise in Class 3 units.
2.2 Shawlands
Shawlands, like Byres road is a Tier 2 town centre, containing a principal retail area
with the same planning restriction as discussed above. In Shawlands’ case the
principal retail area is 14 – 128 Kilmarnock Road and all of Shawlands Arcade.
Based on data gathered by EKOS in 2012, Shawlands has a slightly higher
proportion of Class 1 units and a particularly large proportion of Class 2 units
compared to Byres Road. On the other hand there are fewer Class 3, Other Class
and Sui Generis units. Vacancy rates are slightly higher in Shawlands, Figure 2.6.
Furthermore, Shawlands has much less comparison retail units and more
convenience and service units, indicating that a greater proportion of the retail space
in Shawlands is used for servicing local needs.
9 National Review of Town Centres, Town Centre Action Plan – the Scottish Government response, 2013
http://www.scotland.gov.uk/Resource/0043/00437686.pdf
Byres Road Vitality and Viability: BRTA and GCC
13Figure 2.6 Shawlands by Retail Classification
Vacant Vacant
8% 8%
Sui Generis
9% Convenience
16%
Other Class
3%
Class 3
281 Class 1 281 Service
Units Units
9% 52% 50%
Comparator
Class 2
26%
20%
Compared to Byres Road and Shawlands as a whole, the Shawlands Principal Retail
Area is struggling, with fewer Class 1 units than the wider area, higher vacancy rates
and higher number of Class 2 premises, Figure 2.7.
Figure 2.7 Shawlands Principal Retail Area
Vacant Vacant
12% 12%
Sui Generis
7% Convenience
10%
Other Class
5% 41 41 Service
Units
Class 3 Class 1
3% Units 51%
41%
Class 2
Comparator
22%
37%
Overall, Byres Road has a much stronger night time offering in terms of bars and
restaurants than Shawlands. However, there is a similar proportion of Class 1 retail
units and vacancy rates between the two areas, indicating similar levels of retail
demand. The higher preponderance of comparison retail units indicates that Byres
Road is more of a retail destination that a servicer of local demand.
With regards to the principal retail areas, Byres Road performs better, likely due to
the interior of Shawlands Arcade having high level vacancy at the time of the survey.
Byres Road Vitality and Viability: BRTA and GCC
142.3 Finnieston
Finniestion is classified as a Tier 3 town centre and is called Cranstonhill/Yorkhill in
the City Plan 2, but is more commonly known as Finnieston. The area has recently
gained a reputation for its lively and vibrant night time economy10, spurred by its
proximity to the SECC and the newly constructed Hydro, and cheaper rents/rates
compared to Byres Road.
Finnieston has a large proportion of Class 3 and Sui Generis uses, while retail is
primarily geared towards local residents, with a high proportion of convenience over
comparison outlets, barring the PC World, Staples and car showrooms around the
Exhibition Centre Train Station. There has, however, been a recent trend towards
small ‘quirky’ and vintage shops of the type for which Byres Road is famous.
With its rapidly evolving offer of bars and restaurants, the Finnieston area is now
increasingly recognised as a vibrant evening destination, with the offering at Byres
Road seeming somewhat conservative by contrast. Further growth at Finnieston
will, however, likely be constrained by its narrow and cluttered pavements, and the
high traffic volume on Dumbarton Road that can make it difficult to cross.
10 As can be seen in The Guardian and The Herald
Byres Road Vitality and Viability: BRTA and GCC
153. Shopper Survey
3.1 Introduction
An in-street survey was conducted at three locations in Byres road between 28 th May
and 3rd June. A total of 200 people were randomly surveyed.
Roughly one third of respondents were interviewed at the three locations, with
slightly more interviews at the middle of Byres Road and slightly less at the
Dumbarton Road end, Figure 3.1.
Figure 3.1 Location of Interview
Area around junction Area around junction
Area adjacent to
of Byres Road and of Byres Road and
Oxfam bookshop
University Avenue Dumbarton Road
33%
36% 31%
N=200
More interviews were conducted on weekdays, however proportionately more were
conducted on weekends with 39 per day compared to 25 per day during the week,
Figure 3.2.
Figure 3.2 Day of Interview
Weekday 62% Weekend 39%
N=200
Almost all of the interviews (86%) were conducted between 12pm and 5pm with 10%
conducted before 12pm and 5% between 5pm and 7pm.
Byres Road Vitality and Viability: BRTA and GCC
163.2 Respondent Profile
A higher number of females were interviewed than males, with around three fifths of
respondents being female, Figure 3.3.
Figure 3.3 Gender
62% Female 38% Male
N=200
Over half of those surveyed lived locally, with around one third coming from other
parts of Glasgow and the remainder outside of Glasgow, but within West Central
Scotland, Figure 3.4.
Figure 3.4 Area of Residence
Glasgow West End 57%
Other Glasgow 30%
Other West Central Scotland 14%
N=200
Of those residing other parts of Glasgow, almost half (47%) lived in the west of the
city, indicating that Byres Road is a major shopping centre for the wider west end11
area, Figure 3.5.
11 Areas included were Anniesland, Bearsden, Clydebank, Drumchapel, Kelvindale, Maryhill, Partick and Yorkhill
Byres Road Vitality and Viability: BRTA and GCC
17Figure 3.5 Area of Residence, Other Glasgow
West Glasgow 22
East End 10
Southside 7
City Centre 4
North Glasgow 3
N=46
As with the others in Glasgow, visitors from the rest of Scotland were more likely to
come from the West12 (52%), Figure 3.6.
Figure 3.6 Area of Residence, Other West of Scotland
West Dunbartonshire 7
Renfrewshire 5
North Lanarkshire 5
East Dunbartonshire 4
South Lanarkshire 3
East Renfrewshire 1
N=25
The age of respondents is relatively evenly spread over the age groups with slightly
more in the 18-25 bracket, Figure 3.7.
12 Defined as West Dunbartonshire, Renfrewshire and East Renfrewshire
Byres Road Vitality and Viability: BRTA and GCC
18Figure 3.7 Respondent Age
22%
15% 16%
14% 14%
11%
7%
3%
16-17 18-25 26-35 36-45 46-55 56-65 66-75 Over 75
N=200
Most respondents are either employed full-time, retired or in full time education,
Figure 3.8.
Figure 3.8 Employment Status
Employed full time 35%
Retired 27%
Student 20%
Employed part time 8%
Unemployed 3%
Looking after home and / or family 3%
Long term sick / disabled 2%
Other 2%
N=196
The annual household income of almost all (85%) of those who specified was
£25,000 or under, however, almost half (49.5%) preferred not to specify their
income, Figure 3.9.
Byres Road Vitality and Viability: BRTA and GCC
19Figure 3.9 Household Income
Under £15,000 45%
£15,000 to £25,000 40%
£25,001 to £40,000 11%
£40,001 to £55,000 3%
£55,001 to £70,000 0%
£70,001 to £100,000 2%
Over £100,000 0%
N=101
The figure records very low average annual household income for respondents.
Using midpoint range assumptions13 we have estimated the average household
income of respondents at around £19,000, well below the median Scottish
household income in 2012/13 at £23,00014.
Given the socio-economic analysis presented at Chapter 4, and in particular the
SIMD analysis (Section 4.8) we would have expected a higher than average
household income for shoppers in the Byres Road area. Three factors in particular
are likely to have influenced the results:
people are often unwilling to disclose their income, our experience suggests
that this is more likely for those at the upper end of the spectrum – in this
instance half of all respondents did not disclose;
almost half of all respondents (47%) were either retired or students, with
only 35% being full-time employees – this compares with Scottish/Glasgow
average of 24% and 25% respectively, and with the socio-economic profile
for the area (as covered at Section 4) of 30% retired/student residents; and
there were a large number of student respondents to the survey and also a
large number of flats and HMOs in the catchment area (see Section 4.7) – it
is likely that a sizeable proportion of respondents will be reporting individual
incomes in response to this question.
13 We have assumed £10,000 income for the ‘Under £15,000’ range.
14 Source: Poverty and Income Inequality in Scotland: 2012/13, Scottish Government.
Byres Road Vitality and Viability: BRTA and GCC
20We therefore suggest that average income for Byres Road shoppers is likely to be
higher than that indicated at Figure 3.9 above.
3.3 Frequency of Visits
Figure 3.10, shows how often respondents visit Byres Road both during the day and
at night, with respondents visiting much more frequently during the day. However,
this corresponds with most of the interviews being conducted during the day.
Figure 3.10 Frequency of visit
Every day 34%
3%
Most days 23%
4%
8%
Three or four times a week
10%
23%
Once or twice a week
23%
10%
Once or twice a month
30%
4%
A few times a year
4%
1%
Less often
15%
0%
Never
12%
Day Night
N=200
The majority of respondents visit Byres Road about the same as ever, both day and
night, however, more people are visiting less than more often at night (15%
compared to 7%), whilst the opposite is the case for day visitors (10% compared to
9%), Figure 3.11.
Byres Road Vitality and Viability: BRTA and GCC
21Figure 3.11 Change in Frequency of Visit
10%
Now visit more often
7%
82%
Now visit about the same
77%
9%
Now visit less often
15%
Day Night
N=200
Tables 3.1 and 3.2 list the most common reasons for a change in the frequency of
visits, with people in general visiting more often due to a change in circumstances,
whilst people visit less often due to going elsewhere or not going out at all.
Table 3.1 Reason for change of Visits Frequency - Day
More often (19) Less often (15)
Work here now (eight) Busy with work/ study (four)
Like the shops (three) Go elsewhere (two)
Friends/ family live here now (two) Lower income (two)
Now retired – have more time (two) Getting older – not as fit (two)
Table 3.2 Reason for change of Visits Frequency - Night
More often (11) Less often (26)
Friends/ family live here now (three) Don’t go out as much anymore (seven)
Like the restaurants/ bars (three) Prefer to go elsewhere (seven)
It’s local (two) Getting older – not as fit (three)
Byres Road Vitality and Viability: BRTA and GCC
22Few visitors (around one fifth) spend less than an hour on a typical visit, with visitors
at night tending to make longer visits, Figure 3.12.
Figure 3.12 Length of time spent on typical visit
20%
Less than one hour
22%
52%
Between 1 and 3 hours
39%
29%
More than 3 hours
40%
Day N=200, Night N=176
3.4 Reason for visiting
The most popular things to visit Byres Road for are bars/restaurants/cafes, shopping
and bank/solicitor etc, Figure 3.13.
The figure outlines responses to a range of potential uses, recording the number of
instances that respondents visit for that purpose. This question allowed multiple
responses to be made, therefore undertaking wider analysis we can show that an
average trip to Byres Road includes elements of bar/restaurant /café, shopping,
bank/solicitor and meeting friends/relatives. In total 56% of all respondents selected
three out of these four reasons to visit, while a fifth of respondents selected all four.
Byres Road Vitality and Viability: BRTA and GCC
23Figure 3.13 Reason for Visit
N=199, Multiple answers possible
However, when asked about their primary reason for visiting Byres Road, where only
one single purpose was allowed, shopping becomes the most dominant, whilst
reasons due to proximity to friends, family, employment and residence become
much more important, Figure 3.14.
Byres Road Vitality and Viability: BRTA and GCC
24Figure 3.14 Primary Reason for Visit
N=195
The most popular types of shops visited on Byres Road are the supermarkets, with
more than half of respondents using these. Other convenience retail shops were
also popular, with over one third using newsagents and other food shops. Of the
comparator shops, the most popular are charity shops, closely followed by the small
independent shops common in the Lanes, Figure 3.15.
This figure outlines responses to a range of potential retail functions, recording the
number of instances that respondents visit for that purpose. This question allowed
multiple responses to be made, therefore undertaking wider analysis we can show
that a common shopping trip to Byres Road includes elements of supermarkets,
charity shops, the shops in the lanes and newsagent/confectioners – 33% of
respondents normally visit at least three of these.
Byres Road Vitality and Viability: BRTA and GCC
25Figure 3.15 Types of shop visited
Food (supermarket / grocery) 59%
Charity shops 45%
The Lanes 42%
Newsagent / confectioner 38%
Food (deli / bakery) 38%
Chemist 37%
Food (specialist fish / meat / cheese) 34%
Vintage shops 30%
Music - CDs / DVDs / books 24%
Shopping not part of usual visit 18%
Specialist card / gift shops 16%
Clothing 14%
Jewellers 8%
Footwear 8%
Hairdresser / beautician 4%
Other 4%
N=192
The importance of having friends, working or living near Byres Road and the
popularity of supermarkets, newsagents and other food shops indicate that
convenience shopping is more important to Byres Road that the number of units
outlined in Chapter 2 suggests, perhaps due to the large number of customers
concentrated in the small number of supermarkets.
The most common typical spend is between £11 and £25 (38%), with similar
numbers of respondents spending between £5 and £10 (28%) and between £26 and
£50 (26%), Figure 3.16.
Using mid-point range analysis we have estimated that the average spend per head
per trip for survey respondents is around £25. This is comparable with survey
results for other in-street shopper surveys that EKOS has undertaken, and is within
the typical range of people on a day-trip.
Byres Road Vitality and Viability: BRTA and GCC
26Figure 3.16 Typical Spend
Under £5 3%
£5 to £10 28%
£11 to £25 38%
£26 to £50 26%
£51 to £100 5%
Over £100 1%
N=194
Around three quarters of those that have shopped in Byres Road spend about the
same as they did three years ago, with slightly more respondents spending more
money rather than less, Figure 3.17.
Figure 3.17 Change in Spend
Spend about the same now 73%
Spend more now 16%
Spend less now 10%
N=173
The respondents that spend more money now on a typical trip record an average of
£25 per trip (ranging from £4 to £60); whilst those that spend less now record an
average of £15 (ranging from £10 to £30).
Table 3.3 outlines the reasons people have changed their spending with the most
common causes being a change in income or prices.
Byres Road Vitality and Viability: BRTA and GCC
27Table 3.3 Reasons for Change in spend
Spend More (28) Spend Less (18)
Higher prices (seven) Fall in income (12)
Prefer to shop locally (four) Go elsewhere (five)
Increased income (four)
In the area more often (three)
More things to buy (two)
3.5 Transport and safety
The most popular method of travelling to Byres Road was walking, with most of
these people living locally. The other popular methods of transport were bus, car
and underground, Figure 3.18, with travellers coming from a variety of locations.
Figure 3.18 Methods of Transport
N=195
Just over half of those who drive to Byres Road reported that they find it difficult or
very difficult to park, Figure 3.19.
Byres Road Vitality and Viability: BRTA and GCC
28Figure 3.19 Ease of Parking
Difficult or very difficult Easy or very easy
57% 43%
N=35
The vast majority of people always or usually feel safe in Byres Road both day and
night, however, there is a substantial minority (28%) who usually feel safe rather
than always feel safe at night, Figure 3.20.
Figure 3.20 Safety
90%
Always feel safe
69%
9%
Usually feel safe
28%
1%
Occasionally feel unsafe
3%
Day N=196, Night N=177
Byres Road Vitality and Viability: BRTA and GCC
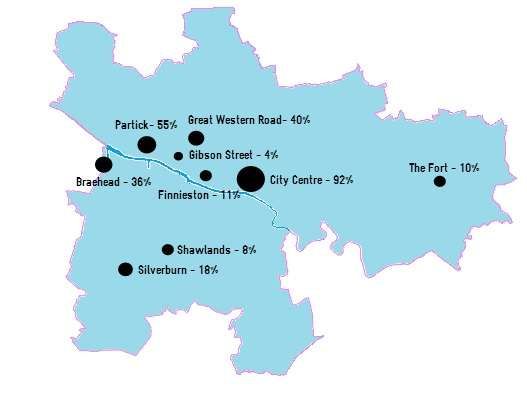
293.6 Competitor Areas
The most popular places where respondents go shopping regularly are the City
Centre, Partick, Great Western Road and Braehead, Figure 3.21.
Figure 3.21 Alternate Shopping Destinations
N=197
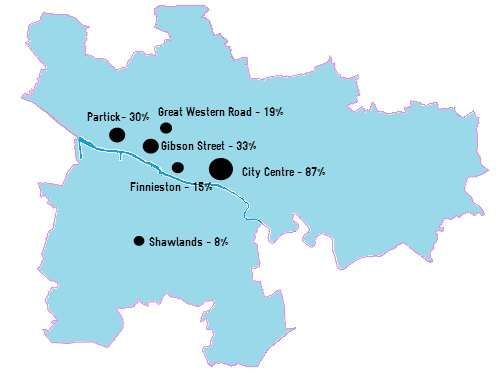
With regards to nights out, the City Centre remains by far the most popular, followed
by Gibson Street and Partick, with Great Western Road and Finnieston also being
frequent destinations, Figure 3.22.
As reported at Section 2.3, Finnieston has significant potential to grow as an
attractive evening destination with a wide range and vibrant selection of bars and
restaurants (Class 3). The growing reputation of this area, together with its proximity
to the SECC, Clyde Auditorium and Hydro performance venues, means that it will
increasingly compete for customer footfall (particularly evening economy users) who
might otherwise have traditionally gone to the Byres Road area.
Byres Road Vitality and Viability: BRTA and GCC
30Figure 3.22 Alternate Night Out Destinations
N=177
Almost three quarters of respondents frequent these other locations as much as they
did three years prior. Similar proportions frequent and spend more or less in the
other locations, Figure 3.23.
Figure 3.23 Changes in Frequency of Visit and Spending in other Locations
13%
More now
15%
72%
No change
69%
15%
Less now
16%
Frequency of visit Spending
N=199
Byres Road Vitality and Viability: BRTA and GCC
31The most important reason for people visiting Byres Road over the other locations is
its proximity to their house or workplace, with the vibe of the area the next most
significant factor, Figure 3.24.
Figure 3.24 Reasons for Visiting Byres Road over other Locations
The location: it's near to where I live/work/stay 66%
The vibe of the area: it's more quirky and
51%
interesting than other places
There's a good choice of shops, bars and
46%
restaurants
There's a good mix in the area: shops, food &
38%
drink, parks and museums
The unique character: independent shops and
38%
retailers
Other 3%
N=200
The majority of people make limited or no internet purchases of high street goods
(55%) or internet only goods (82%), Figure 3.25.
Figure 3.25 Internet Purchases
Zero, no purchases 52%
37%
Limited, occasional purchases 30%
18%
8%
Under £10 per month
7%
5%
£10 to £25 per month
21%
3%
£26 to £50 per month
9%
1%
£51 to £100 per month
8%
1%
Over £100 per month
1%
Internet only items High street items
N=198
Byres Road Vitality and Viability: BRTA and GCC
32Younger respondents were found to be much more likely to shop online. A total of
68% of under-35s shop online every month, with a further 15% making less regular
purchases. In comparison, only 18% of over-55s buy items online on at least a
monthly basis, with 65% of respondents from this age category stating that they
never shop online.
Opinion was mixed on the desirability of a click and collect service in Byres Road
with 43% interested and 57% not, Figure 3.26. Some online order collection services
are already available on Byres Road. This includes Waitrose, which offers
collections for John Lewis orders, and McColls newsagent, which offers the Collect
Plus parcel service that a number of online retailers use.
Figure 3.26 Click and Collect Interest
Very interested 13%
Quite interested 30%
Not interested 18%
Not at all interested 40%
N=167
3.7 Views and Opinions
Figure 3.27 outlines respondent’s views and opinions on various aspects of Byres
Road. People were generally positive about everything with over 74% rating all but
one measure as good or very good.
Five of the aspects were rated good or very good by over 90% of respondents and
these were the atmosphere, the range of bars, cafes and restaurants, people friendly
area, pleasant environment and easy to get there.
The one aspect that received any significant negativity was whether the area was
well marketed with 11% rating it as poor and 32% rating it as neither good nor poor.
Byres Road Vitality and Viability: BRTA and GCC
33Figure 3.27 Ratings of Byres Road
Good atmosphere: buzz and activity (196) 3% 33% 64%
Range of bars, cafes and restaurants (197) 4% 34% 62%
People-friendly area: easy to walk and cycle around 4% 39% 57%
(196)
Pleasant environment: attractive places to linger
6% 41% 52%
(195)
Easy to get there: car / public transport (196) 7% 40% 53%
Clean and tidy streets (196) 5% 7% 55% 34%
The area being well lit (196) 3% 9% 56% 33%
Range and quality of shops (198) 10% 52% 36%
Range of activities and events (190) 17% 56% 25%
Range and quality of services (personal, beauty,
25% 48% 26%
health etc.) (198)
The area being well marketed (196) 11% 32% 36% 21%
Poor/ Very poor Neither good nor poor Good Very good
The most significant factor that would encourage more visits, both day and night,
would be better environment: seats, pavement and greenery. Further factors that
would encourage day visitors would be a wider range of shops, less traffic and better
parking, Table 3.4.
There is less consensus on what would encourage more visits at night, but the most
mentioned were a safer environment and less traffic.
Byres Road Vitality and Viability: BRTA and GCC
34Table 3.4 Factors That Would Encourage More Visits
Day (131) Night (86)
Better environment: seats, pavements, greenery 45% 44%
Wider range of shops: type and quality 26% 10%
If there was less traffic 24% 16%
Better parking: more spaces, cheaper cost 21% 10%
More events and activities: fair, market days etc. 11% 13%
Safer environment: lighting, policing, security 9% 17%
If it was easier to walk and cycle around 7% 5%
Other 7% 7%
Less charity shops 5% 0%
Less beggars 5% 3%
More cafes, bars and restaurants: type and quality 5% 6%
Choice of personal services: hairdressers / beauty 2% 0%
Better public transport links 2% 5%
The factors that discourage visitors are similar to those in the previous question, with
the most important being a poor environment: seats, pavements and greenery.
However, night time visitors are slightly more put off by a poor environment in terms
of lighting, policing and security, which ties in with Figure 3.20, where concern was
expressed regarding safety at night, Table 3.5, over. Other factors discouraging day
visitors are traffic and poor parking whilst night visitors are put off by the choice of
cafes, bars and restaurants and poor parking.
Table 3.5 Factors That Discourage More Visits
Day (108) Night (79)
Poor environment: seats, pavements, greenery 45% 33%
Too much traffic 20% 6%
Poor parking: amount cost, location 19% 10%
Choice of shops: type and quality 9% 3%
Too many beggars 8% 5%
Poor environment: lighting, policing, security 6% 37%
Choice of cafes, bars, restaurants - type and quality 6% 13%
Other 4% 5%
Too many charity shops 2% 0%
Poor infrastructure for cycling 2% 3%
Poor transport links 1% 5%
Choice of personal services: hairdressers / beauty 1% 1%
Byres Road Vitality and Viability: BRTA and GCC
354. Socio-Economic Baseline
4.1 Introduction
This section presents a statistical baseline of demographic and economic features of
Byres Road, the surrounding area and Glasgow. Part of this will update an existing
baseline conducted in 2003, however this baseline will examine a greater number of
issues than were addressed there.
The Byres Road area is made up of eleven datazones 15 in the immediate areas of
Byres Road, whilst the Wider Area is made up of ten postcode districts16. Figure 4.1
presents the area covered by Byres Road (light blue) and the Wider Area (dark
blue).
Figure 4.1 Area Map
Postcode sector data is not always available for a number of measures, and
therefore the multi-member wards of Hillhead and Partick West will be used as a
substitute.
15 S01003460, S01003470, S01003484, S01003497, S01003509, S01003513, S01003514, S01003521,
S01003522, S01003542, S01003545, S01003555
16 Kelvinside: G11 5, G12 0, G12 9, G20 8, Hillhead: G12 8, G20 6, G3 6, G3 7, Partick: G11 6, G3 8
Byres Road Vitality and Viability: BRTA and GCC
364.2 Population
Current
Population across all three areas has increased over the last ten years, with Byres
Road and the Wider Area growing at about double the rate of Glasgow as a whole,
Table 4.1. Due to the unavailability of postcode sector data, the alternative definition
of the Wider Area is used for population data.
Table 4.1 Population
2001 2006 2011 Change %
Byres Road 9,933 10,059 10,525 592 6%
Wider Area 55,317 55,355 58,890 3,573 6%
Glasgow 578,710 580,690 598,830 20,120 3%
Source: Scottish Neighbourhood Survey (SNS), Census 2011
Figure 4.2 shows the change in population over time, with spikes in the local area in
2002 and 2009.
Figure 4.2 Population Change over Time, 2003 = 1
1.07
1.06
1.05
1.04
1.03
1.02
1.01
1
0.99
2001 2002 2003 2004 2005 2006 2007 2008 2009 2010 2011
Byres Road Wider Area Glasgow
Source: SNS, Census 2011
Byres Road Vitality and Viability: BRTA and GCC
37The area around Hillhead has a higher proportion of its population at working age
(84%) than the Wider Area (78%) which in turn has a larger proportion than Glasgow
as a whole (68%), Table 4.2.
Table 4.2 Population by Age
2001 2006 2011
Children 932 (9%) 1,028 (9%) 866 (8%)
Working Age 8,142 (82%) 8,172 (81%) 8,838 (84%)
Byres
Road Pensionable Age 859 (9%) 859 (9%) 821 (8%)
Children 6,897 (12%) 6,785 (12%) 6,507 (11%)
Working Age 41,123 (74%) 41,843 (76%) 45,728 (78%)
Wider
Area Pensionable Age 7,297 (13%) 6,727 (12%) 6,655 (11%)
Children 106,342 (18%) 97,334 (17%) 98,116 (16%)
Working Age 381,723 (63%) 398,887 (67%) 422,142 (68%)
Glasgow Pensionable Age 90,645 (18%) 84,469 (17%) 78,572 (15%)
Source: SNS, Census 2011
This larger proportion of working age people is largely explained by the presence of
high numbers of student attracted to the area surrounding Glasgow University as
can be seen in Figure 4.3, with greater concentrations of young people, in particular
those in the 20 – 24 age bracket, in Byres Road and the Wider Area.
Figure 4.3 Concentrations of Young People 2011
24%
17%
13% 13%
10%
9%
7%
5% 5%
16-19 20-24 25-29
Byres Road Wider Area Glasgow
Source: SNS, Census 2011
Byres Road Vitality and Viability: BRTA and GCC
38Projections
Population projections are only available at the local authority level, and are
therefore only presented for Glasgow. The population is predicted to increase by
11% by 2035, with a particularly large rise amongst those of pensionable age, Table
4.3.
Table 4.3 Population Projections
2010 2015 2020 2025 2030 2035 Change %
Children 97,236 101,793 108,019 108,206 103,736 98,729 1,493 2%
Working Age 414,721 426,784 431,893 435,422 438,215 442,840 28,119 7%
Pensionable Age 80,863 81,495 85,338 95,111 108,074 118,436 37,573 46%
Total 592,820 610,072 625,250 638,739 650,025 660,005 67,185 11%
Source: General Records Office Scotland (GROS)
4.3 Employment
Economic activity status differs around Byres Road to the city as a whole, with a
much higher proportion of students and fewer economically inactive, Figure 4.4.
Figure 4.4 Economic Activity Ages 16 – 74, 2011
47% 47%
42%
38%
27%
24%
17%
14%
10%
6% 7% 5% 6%
3% 4%
Employee Student Self-Employed Unemployed Economically
Inactive
Byres Road Wider Area Glasgow
Source: Census 2011
Byres Road Vitality and Viability: BRTA and GCC
39Around three quarters of employment in the Byres Road area is taken up by the
University of Glasgow and the Western Infirmary, however, disclosure issues with
the dataset prevent us from presenting the exact numbers. Data provided by GCC
shows that the hospital alone accounts for around 3,500 direct staff, but it is likely to
have a major indirect, or off-site, employment impact through the spending patterns
of patients and visitors. This will be a major issue to address as the hospital is
scheduled for closure in 2015, although redevelopment of the site to accommodate
additional Glasgow University functions will offset some of this lost activity.
The only other two industries with significant level of employment are retail and
accommodation and food services, taking in employment in the shops, restaurants
and bars of Byres Road, Table 4.5.
Table 4.5 Byres Road Employment
2009 2010 2011 2012 Change %
Agriculture, forestry & fishing 0 0 0 0 0 -73%
Mining, quarrying & utilities 0 0 0 0 0 -100%
Manufacturing 0 0 0 100 0 183%
Construction 0 0 100 0 0 75%
Motor trades 0 0 0 0 0 -50%
Wholesale 0 0 0 0 0 -87%
Retail 600 700 700 600 0 0%
Transport & storage (inc postal) 0 0 0 0 0 467%
Accommodation & food services 1,600 1,400 1,400 1,500 0 0%
Information & communication 100 100 100 100 0 -4%
Financial & insurance 100 200 100 100 0 10%
Property 100 0 100 100 0 62%
Professional, scientific & technical 500 400 400 400 0 -6%
Business administration & support
services 100 100 100 200 100 98%
Public administration & defence 0 0 0 0 0 27%
Education n/d n/d n/d n/d n/d n/d
Health n/d n/d n/d n/d n/d n/d
Arts, entertainment, recreation &
other services 400 500 400 500 100 20%
Total 14,300 13,700 13,500 13,900 -400 -3%
Source BRES
Byres Road Vitality and Viability: BRTA and GCC
40Table 4.5 presented workplace-based employment within the area, whilst Table 4.6,
presents resident-based employment. There are many more people working in the
area than live in the area. In particular, the large majority of those working at the
hospital, the University and in accommodation and food services live elsewhere,
whilst many working in ‘Information & communication’, ‘Public administration &
defence’, ‘Financial & insurance’ and ‘Professional, scientific & technical’ live in the
area but work elsewhere.
Table 4.5 Residence Based Employment
2011
Agriculture, forestry & fishing 11
Mining, quarrying & utilities 18
Manufacturing 181
Construction 44
Motor trades 9
Wholesale 158
Retail 582
Transport & storage (inc postal) 120
Accommodation & food services 521
Information & communication 361
Financial & insurance 282
Property 78
Professional, scientific & technical 531
Business administration & support services 172
Public administration & defence 251
Education 834
Health 985
Arts, entertainment, recreation & other services 398
Total 5,536
Source: Census 2011
Comparing this data with population for Byres Road area of 10,525 in 2011 shows
that 53% of all residents are in full or part-time employment. This compares with the
Glasgow and Scottish averages of 52% and 60% respectively (source: 2011
Census), and reflects the large proportion of students living in the area.
Byres Road Vitality and Viability: BRTA and GCC
41The Wider Area is also characterised by large ‘Health’ and ‘Education’ sectors,
although they only take up 52% of employment. ‘Retail’ and ‘Accommodation and
food services’ are other large employers, whilst ‘Public administration and defence’
has added a large number of jobs in recent years, Table 4.6.
Table 4.6 Wider Area Employment
2009 2010 2011 2012 Change %
Agriculture, forestry & fishing - - - - 0 -60%
Mining, quarrying & utilities - - - - 0 21%
Manufacturing 600 500 500 500 -100 -23%
Construction 500 400 500 500 0 6%
Motor trades 800 900 700 800 -100 -8%
Wholesale 800 500 500 500 -300 -34%
Retail 2,700 2,700 2,800 2,500 -100 -5%
Transport & storage (inc postal) 400 400 300 300 -100 -27%
Accommodation & food services 3,500 3,000 2,800 2,900 -600 -18%
Information & communication 600 600 500 600 0 0%
Financial & insurance 300 400 300 300 0 -3%
Property 400 300 400 400 0 11%
Professional, scientific & technical 1,800 1,600 1,800 1,600 -200 -10%
Business administration & support
services 1,900 1,900 2,000 1,600 -400 -19%
Public administration & defence 300 1,300 700 1,500 1,100 345%
Education 8,400 7,900 8,300 7,700 -600 -8%
Health 10,400 10,100 10,600 9,800 -600 -6%
Arts, entertainment, recreation &
other services 1,500 1,600 1,500 1,800 300 20%
Total 35,000 34,500 34,300 33,400 -1,600 -5%
Source BRES
Byres Road Vitality and Viability: BRTA and GCC
42Glasgow has lost a considerable number of jobs since 2009, particularly in
‘Professional, scientific and technical’ industries, however, ‘Construction’ and
‘Business administration & support services’ have also seen big declines, Table 4.7.
Table 4.7 Glasgow Employment
2009 2010 2011 2012 Change %
Agriculture, forestry & fishing 0 100 0 0 0 -18%
Mining, quarrying & utilities 5,900 6,400 6,500 5,900 -100 -1%
Manufacturing 20,800 19,900 19,800 19,800 -1,000 -5%
Construction 19,800 17,100 17,300 15,600 -4,200 -21%
Motor trades 5,200 5,300 4,800 4,600 -600 -12%
Wholesale 11,500 10,000 9,800 9,600 -1,900 -17%
Retail 37,800 38,300 39,500 39,100 1,300 3%
Transport & storage (inc postal) 14,800 13,900 14,200 12,700 -2,100 -14%
Accommodation & food services 26,800 25,600 25,100 24,800 -2,000 -7%
Information & communication 13,900 13,500 12,900 13,900 0 0%
Financial & insurance 22,300 20,800 21,900 22,300 0 0%
Property 8,700 7,200 9,300 9,000 300 3%
Professional, scientific & technical 41,200 31,100 31,100 29,600 -11,600 -28%
Business administration & support
services 53,400 47,500 48,100 50,100 -3,300 -6%
Public administration & defence 26,400 27,900 25,800 23,700 -2,700 -10%
Education 30,100 29,700 29,000 28,000 -2,100 -7%
Health 62,000 61,400 61,400 59,400 -2,600 -4%
Arts, entertainment, recreation &
other services 17,500 17,600 17,800 17,100 -400 -2%
Total 418,200 393,200 394,200 385,200 -33,000 -8%
Source BRES
Byres Road Vitality and Viability: BRTA and GCC
43Using location quotient analysis we can see which industry an area is particularly
reliant on, compared to the Scottish average. Any number above 1.2 indicates a high
concentration, and below 0.8, a low concentration.
As already discussed, Byres Road is particularly reliant upon ‘Education’ due to the
University, and also ‘Health’ and ‘Accommodation and food services’.
Table 4.8 Location Quotient
Byres Wider
Road Area Glasgow
Agriculture, forestry & fishing 0.01 0.01 0.01
Mining, quarrying & utilities 0.00 0.21 0.55
Manufacturing 0.06 0.17 0.66
Construction 0.06 0.29 0.80
Motor trades 0.00 1.41 0.75
Wholesale 0.01 0.52 0.81
Retail 0.45 0.77 1.02
Transport & storage (inc postal) 0.03 0.20 0.82
Accommodation & food services 1.63 1.25 0.94
Information & communication 0.28 0.68 1.45
Financial & insurance 0.24 0.21 1.48
Property 0.54 1.00 1.78
Professional, scientific & technical 0.43 0.69 1.09
Business administration & support services 0.17 0.60 1.67
Public administration & defence 0.02 0.70 0.98
Education 5.86 2.99 0.94
Health 1.74 1.83 0.96
Arts, entertainment, recreation & other services 0.69 1.18 0.95
Source BRES
Byres Road Vitality and Viability: BRTA and GCC
44You can also read