The oncofetal RNA-binding protein IGF2BP1 is a druggable, post-transcriptional super-enhancer of E2F-driven gene expression in cancer
←
→
Page content transcription
If your browser does not render page correctly, please read the page content below
8576–8590 Nucleic Acids Research, 2020, Vol. 48, No. 15                                                             Published online 6 August 2020
doi: 10.1093/nar/gkaa653

The oncofetal RNA-binding protein IGF2BP1 is a
druggable, post-transcriptional super-enhancer of
E2F-driven gene expression in cancer
Simon Müller1,* , Nadine Bley1 , Bianca Busch1 , Markus Glaß1 , Marcell Lederer1 ,
Claudia Misiak1 , Tommy Fuchs1 , Alice Wedler1 , Jacob Haase1 , Jean Borges Bertoldo1 ,
Patrick Michl2 and Stefan Hüttelmaier 1,*

                                                                                                                                                              Downloaded from https://academic.oup.com/nar/article/48/15/8576/5881798 by guest on 25 November 2020
1
 Institute of Molecular Medicine, Section for Molecular Cell Biology, Faculty of Medicine, Martin Luther University
Halle-Wittenberg, 06120 Halle, Germany and 2 Department of Internal Medicine I, Faculty of Medicine, Martin Luther
University Halle/Wittenberg, 06120 Halle, Germany

Received April 16, 2020; Revised July 02, 2020; Editorial Decision July 25, 2020; Accepted July 27, 2020

ABSTRACT                                                                        Despite promiscuous RNA-binding properties and dis-
                                                                                tinct, partially oncofetal expression patterns, all IGF2BP
The IGF2 mRNA-binding protein 1 (IGF2BP1) is a                                  paralogues show an ‘oncogenic’ potential in cancer (6,7).
non-catalytic post-transcriptional enhancer of tu-                              However, among IGF2BPs, only IGF2BP1 shows strong
mor growth upregulated and associated with ad-                                  conservation of oncogenic potential in cancer-derived cell
verse prognosis in solid cancers. However, con-                                 lines (8,9). This was largely attributed to the inhibition of
served effector pathway(s) and the feasibility of                               MYC mRNA decay by IGF2BP1 (10). This regulation,
targeting IGF2BP1 in cancer remained elusive. We                                however, is an exception, since all IGF2BPs impair MYC
reveal that IGF2BP1 is a post-transcriptional en-                               mRNA turnover due to hindering cleavage by endonu-
hancer of the E2F-driven hallmark in solid can-                                 cleases in the coding region of MYC (11,12). The main
cers. IGF2BP1 promotes G1/S cell cycle transition                               role of IGF2BP1 in cancer cells is the impairment of
by stabilizing mRNAs encoding positive regulators                               miRNA/RISC-directed mRNA decay by safe-guarding
                                                                                target mRNAs in cytoplasmic mRNPs (8,13–15). Recently,
of this checkpoint like E2F1. This IGF2BP1-driven
                                                                                IGF2BPs were identified as m6 A-readers, associating
shortening of the G1 cell cycle phase relies on                                 preferentially with N6 -methyladenosine modified target
3 UTR-, miRNA- and m6 A-dependent regulation and                               mRNAs (12). Validated for two mRNAs, MYC and SRF,
suggests enhancement of cell cycle progression                                  m6 A-enhanced mRNA association of IGF2BPs results in
by m6 A-modifications across cancers. In addition                               elevated mRNA stabilization and enforced expression of
to E2F transcription factors, IGF2BP1 also stabi-                               MYC and SRF, respectively (12,16). Despite consistent
lizes E2F-driven transcripts directly indicating post-                          stimulation of tumor cell proliferation and tumor growth
transcriptional ‘super’-enhancer role of the protein                            by IGF2BP1, conserved effector pathways remained un-
in E2F-driven gene expression in cancer. The small                              known. Here, we reveal that IGF2BP1 stabilizes E2F1–3
molecule BTYNB disrupts this enhancer function by                               mRNAs leading to enhanced E2F-driven gene expression
impairing IGF2BP1-RNA association. Consistently,                                and cell cycle progression in cancer cells. E2F-dependent
                                                                                regulation is frequently deregulated in cancer and tightly
BTYNB interferes with E2F-driven gene expression
                                                                                linked to the control of self-renewal versus differentiation
and tumor growth in experimental mouse tumor mod-                               potential of pluripotent stem cells (17,18). In cancer as well
els.                                                                            as progenitor cells, E2F expression is subjected to largely
                                                                                conserved regulation by various microRNAs (17,19).
INTRODUCTION                                                                    Surprisingly, regulation of E2F expression by RBPs was
RNA-binding proteins (RBPs), including the IGF2                                 only reported for pumilio proteins (20). PUM1 and 2 were
mRNA-binding protein (IGF2BP) family are crucial                                shown to impair E2F3 mRNA translation and promote
regulators of tumor and stem cell fate (1–3). CLIP (cross-                      miRNA-directed silencing of E2F3 expression in cancer
linking immunoprecipitation) studies suggest a plethora                         cells, suggesting a rather tumor-suppressive role of both
of mostly overlapping IGF2BP target mRNAs (4,5).                                RBPs. In contrast, IGF2BP1 is considered to act in an

* To
   whom correspondence should be addressed. Tel: +49 345 5573959; Fax: +49 345 5527126; Email: stefan.huettelmaier@medizin.uni-halle.de
Correspondence may also be addressed to Simon Müller. Email: simon.mueller@medizin.uni-halle.de


C The Author(s) 2020. Published by Oxford University Press on behalf of Nucleic Acids Research.
This is an Open Access article distributed under the terms of the Creative Commons Attribution License (http://creativecommons.org/licenses/by/4.0/), which
permits unrestricted reuse, distribution, and reproduction in any medium, provided the original work is properly cited.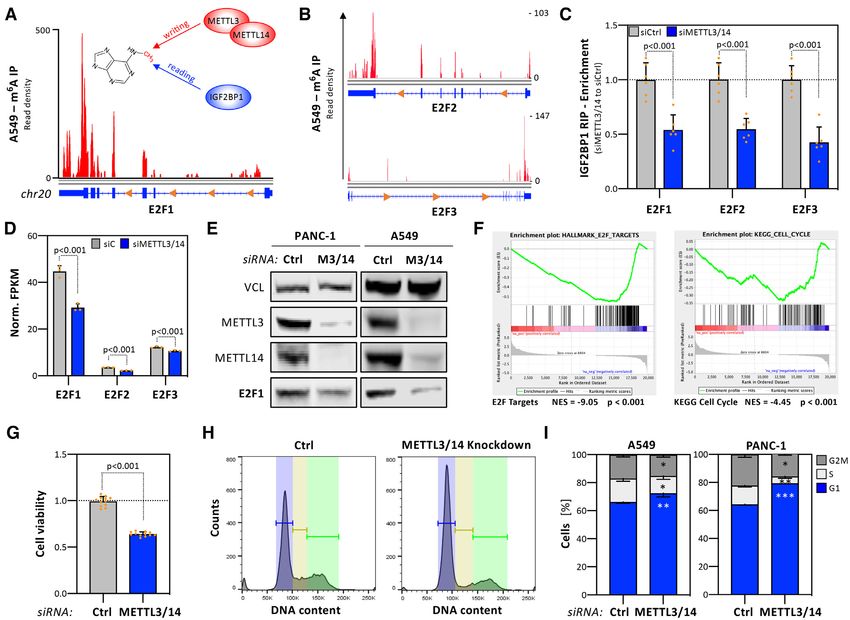
Nucleic Acids Research, 2020, Vol. 48, No. 15 8577
oncogenic manner. Accordingly, a small molecule inhibitor cuCyte S3; Sartorius). Single cell tracking was subsequently
of the protein, termed BTYNB (21), was recently reported. processed using ImageJ.
BTYNB was shown to impair the association of IGF2BP1
with the MYC RNA in vitro and 2D proliferation of various
Cell culture and transfections
tumor cells. However, if BTYNB also interferes with other,
conserved effector pathways of IGF2BP1 in cancer cells HepG2 (ATCC, RRID: CVCL 0027), A549 (ATCC,
and impacts tumor growth remained largely elusive. RRID: CVCL 0023), ES-2 (ATCC, RRID: CVCL 3509),
MV3 (RRID: CVCL W280) and PANC-1 (ATCC,
MATERIALS AND METHODS RRID: CVCL 0480) and HEK293T/17 (ATCC,
RRID:CVCL 1926) were cultured in Dulbecco’s mod-
Animal handling and ethics approvals ified Eagle’s medium (DMEM) supplemented with 10%
Immunodeficient athymic nude mice (FOXN1nu/nu ) were fetal bovine serum (FBS) at 37◦ C and 5% CO2 .
obtained from Charles River. Animals were handled ac- Transfection of cells with DNA or siRNAs was per-
Downloaded from https://academic.oup.com/nar/article/48/15/8576/5881798 by guest on 25 November 2020
cording to the guidelines of the Martin Luther Univer- formed using Lipofectamine 3000 or Lipofectamine
sity. Permission was granted by a local ethical review com- RNAiMAX (Thermo Fisher Scientific) according to the
mittee. For subcutaneous xenograft assays 1 × 10⁵ iRFP- manufacturer’s instructions. For the production of lentivi-
labeled ES-2 cells or 2.5 × 10⁵ iRFP-labeled A549 cells ral particles 2.8 × 10⁶ HEK293T/17 cells were transfected
(stably transduced using iRFP encoding lentiviruses) were using Lipofectamine 3000, the packaging plasmids psPax2
harvested in media supplemented with 50% (v/v) matrigel (Addgene: Plasmid #12260) and pMD2.G (Addgene:
(Sigma) and injected into the left flank of six-week old fe- Plasmid #12259) and the lentiviral expression pLVX vector
male immunodeficient athymic nude mice. For intraperi- encoding iRFP, GFP, GFP-IGF2BP1 or GFP-IGF2BP1
toneal assays 1 × 10⁵ iRFP-labeled ES-2 cells were har- KHmutant. For luciferase reporter studies 1 × 10⁵ cells
vested in PBS and injected into six-week old female im- were transfected using Lipofectamine 3000 and pmir-
munodeficient athymic nude mice. Mice were held with ac- GLO or NanoLuc plasmids. For genomic deletions via
cess to chlorophyll-free food to avoid background noise CRISPR/Cas9 5 × 10⁵ cells were transfected using Lipo-
in iRFP image acquisition. Subcutaneous tumor growth fectamine 3000, Cas9- and sgRNA-encoding plasmids (see
and volume were measured and monitored by non-invasive CRISPR/Cas9 section). For the gene-specific depletion
near-infrared imaging using a Pearl Trilogy Imaging Sys- with siRNAs 5 × 10⁵ cells were transfected using 9 l
tem (LI-COR). Tumor volume was calculated using the for- Lipofectamine RNAiMAX and 15nM siRNAs. Plasmids
mula 0.52 × L1 × L2 × L3 . The mice were sacrificed, once and siRNAs used are summarized in Supplementary Table
the first tumor reached a diameter of 1.5 cm. For monitor- S10.
ing intraperitoneal tumor growth, isofluran-anaesthetized The inhibitors BTYNB (Cayman Chemical) or Palboci-
mice were weekly monitored by near-infrared imaging. In- clib (Selleckchem) were used at indicated concentrations.
traperitoneal fluorescence intensity of iRFP-labeled cells For RNA decay analyses, cells were treated with actino-
was quantified using the Image Studio software (LI-COR). mycin D (5 M, Sigma Aldrich) for indicated time points
Where indicated, ES-2 cells were pre-incubated with DMSO 72 h upon transfection.
or 5 M BTYNB for 24 h prior to injection, in suspension
containing DMSO or BTYNB, into athymic nude mice. Lentiviral transduction
Prior injection, viable cells were counted using trypan blue
and a TC20 Cell Counter (Bio-Rad). Lentiviral particle-containing supernatants were collected
24 and 48 h upon transfection of HEK293T/17 cells. Titers
were analyzed 48 h post-infection of HEK293T/17 cells
Cell cycle analyses
and determined by flow cytometry (GFP or iRFP) using a
For cell cycle analyses, cells were harvested with trypsin MACS Quant Analyzer (Miltenyi BioTec). Lentiviral trans-
(72 h post-transfection or otherwise indicated), fixed duction for downstream experiments was accomplished at
overnight in 70% ethanol at −20◦ C. DNA was stained with 10 MOI (multiplicity of infection).
propidium iodide (Miltenyi Biotec; diluted 1:1000) at 37◦ C
for 30 min in PBS supplemented with RNAse A (2 g/ml;
CRISPR/Cas9-mediated genomic deletions
Sigma Aldrich) to deplete RNA. The DNA content was
measured by flow cytometry using a MACS Quant An- For the CRISPR/Cas9-mediated genomic deletions in the
alyzer (Miltenyi Biotec) and analyzed using FlowJo. The IGF2BP1 and METTL3 loci, A549 cells were transfected
FUCCI system was used to analyze the length of cell cy- with two CRISPR sgRNA-encoding plasmids (IGF2BP1:
cle phases. ES-2 cells, stably transduced with IncuCyte® psg RFP IGF2BP1 Ex6, psg RFP IGF2BP1 Ex7;
Cell Cycle Red/Green Lentivirus Reagent (Sartorius), were METTL3: psg RFP METTL3 Ex3–1,
transfected with indicated siRNAs. Cells in the G2/M phase psg RFP METTL3 Ex3–2) and a Cas9 nuclease-
were enriched by FACS based on their green fluorescence encoding plasmids (pcDNA Cas9 T2A GFP). For the
using a FACS Melody sorter (BD Bioscience) 24 h post- genomic deletion of the E2F1 3 UTR locus, PANC-1 cells
transfection. Cell cycles phases were monitored based on were transfected with two CRISPR sgRNA-encoding
their fluorescence using an IncuCyte S3 (Sartorius) starting (psg RFP E2F1 3p1, psg RFP E2F1 3p2, encoding sgR-
immediately after sorting. Cell segmentation and quantifi- NAs targeting the last exon of E2F1 downstream of the
cation was performed using the Cell-By-Cell module (In- stop-codon and upstream of the polyA-signal) and a Cas9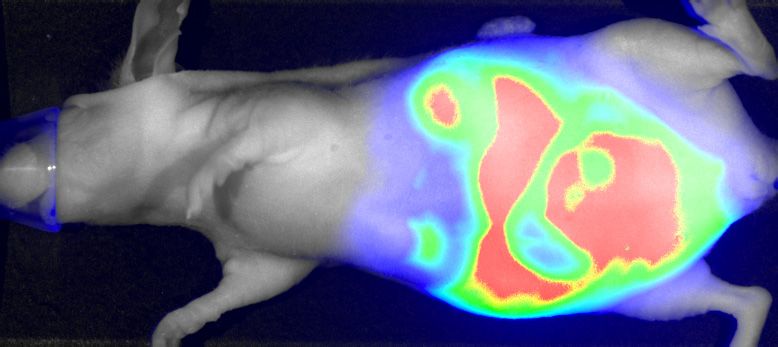
8578 Nucleic Acids Research, 2020, Vol. 48, No. 15
nuclease-encoding plasmids (pcDNA Cas9 T2A GFP). expression (DE) was determined by edgeR (V 3.12) using
Single cell clones were generated by seeding one RFP- and TMM normalization, as described previously (8).
GFP-positive cell per well using a FACS Melody sorter
(BD Bioscience) 48 h post-transfection. The deletion of
Kaplan–Meier analyses
IGF2BP1 and METTL3 was validated by western blotting.
The bi-allelic deletion of the E2F1 3 UTR in the E2F1 gene For survival analyses, Kaplan–Meier plots and Hazard ra-
locus was validated by PCR on isolated genomic DNA of tios (HR) were determined using GEPIA 2 (http://gepia2.
single cell clones. CRISPR sgRNAs, plasmids and PCR cancer-pku.cn/#survival) based on the expression status of
primer are summarized in Supplementary Table S10. indicated genes in TCGA data sets with median group cut-
off.
Luciferase assays
The E2F1–3 UTR (NM 005225.3) was amplified on MicroRNA–Target predictions
Downloaded from https://academic.oup.com/nar/article/48/15/8576/5881798 by guest on 25 November 2020
genomic DNA and cloned in the pmirGLO plasmid miRWalk 2.0 (http://zmf.umm.uni-heidelberg.de/apps/zmf/
(Promega, pmirGLO E2F1 3p). Dual-GLO Luciferase mirwalk2/), (22) was used for the analysis of miRNA-
reporter analyses were performed according to manufac- targeting in the 3 UTR of the E2F1 transcript (NM:
turer’s protocols. Luciferase activities (Firefly and Renilla) 0055225.3). The following databases were considered: miR-
were determined 48 h post-transfection of reporters. Walk, miRDB, PITA, MicroT4, miRMap, RNA22, mi-
Reporters containing a minimal vector-encoded 3 UTR Randa, miRNAMap, RNAhybrid, miRBridge, PICTAR2
(MCS) served as normalization controls. For luciferase and Targetscan (Supplementary Table S6).
reporter studies on the E2F-transcriptional activity, four
E2F binding elements were cloned upstream of a minimal,
NanoLuc-driving promoter (Promega, pNL3.1 4xE2F). IGF2BP1-CLIP and m6 A-RIP- data analysis
NanoLuc reporter analyses were performed according IGF2BP1 CLIP data were analyzed as previously de-
to manufacturer’s protocols. Luciferase activities were scribed (8). In brief, peak genomic coordinates from
determined 48 h post-transfection of reporters. Reporters publicly available IGF2BP1-CLIP data (4,5,23) were ob-
containing a minimal promoter served as normalization tained from ENCODE (24), NCBI GEO (4) and CLIPdb
controls. (25), were mapped to all annotated genes (RefSeq hg19)
using bedtools (26). For IGF2BP1-binding, the follow-
Plasmids and cloning ing number of datasets was considered: two PAR-CLIP
Cloning strategies including plasmids, oligonucleotides (HEK293), two eCLIP (hESCs), two eCLIP (HepG2) and
used for PCR and restriction sites are summarized in Sup- two eCLIP (K562). For the analysis of transcript-specific
plementary Table S10. All constructs were validated by se- m6 A-modification, m6 A-RIP-seq data, performed in A549
quencing. cells, were considered and obtained from MeT-DB (V2.0,
(27)).
RNA sequencing and differential gene expression
Gene expression and correlation analysis
Libraries for RNA-sequencing (RNA-seq) were generated
according to the manufacturer’s instructions. For total We obtained gene-level RNA-seq read counts of TCGA pri-
RNA-seq, 1 g of total RNA served as input for rRNA mary tumor samples and GTEx V7 normal tissue via the
depletion using RiboCop v1.2 (Lexogen). The Ultra Direc- GDC data portal (portal.gdc.cancer.gov) and the GTEx
tional RNA Library kit (NEB) was used for strand-specific portal (gtexportal.org), respectively, for the indicated tu-
library generation. Library preparation and sequencing was mor cohorts. Differential gene expression was assessed us-
performed on an Illumina NextSeq 500 platform at the ing R/edgeR (pmid: 19910308) by applying TMM normal-
Deep Sequencing Group (TU Dreseden). For the prepa- ization. Respective tumor and normal tissue sample data
ration of small RNA-seq libraries, 50 ng of total RNA were normalized together to avoid composition bias. CPM
served as input using the NEXTflex Small RNA Library transformation was utilized to obtain normalized expres-
Prep Kit v3 (Bio Scientific). Sequencing was performed on sion values. For correlation analyses, RNA-seq data sets for
the Illumina HighSeq 2000 platform at the Deep Sequenc- protein-coding genes were log2 -(FPKM+1)-transformed
ing Group (TU Dreseden). For mRNA-seq libraries, total and the Pearson correlation coefficient with IGF2BP1 was
RNA served as input for a polyA-enrichment using oligo dT determined.
beads. Library preparation and sequencing was performed
by Novogene (Hong Kong) on an Illumina HiSeq platform.
Gene set enrichment analysis (GSEA)
First, Low quality read ends as well as remaining parts of se-
quencing adapters were clipped off using Cutadapt (V 1.6). Gene set enrichment analyses (GSEA) were performed
For total and small RNA-seq analyses reads were aligned to on pre-ranked lists using the GSEA-software (V3.0, (28))
the human genome (UCSC GRCh37/hg19) using TopHat2 with MSigDB (V7.0, (29)) gene sets for Hallmarks and
(V 2.0.13) or Bowtie2 (V 2.2.4), respectively. FeatureCounts KEGG pathways. All protein-coding genes were ranked
(V 1.4.6) was used for summarizing gene-mapped reads. En- according to the correlation coefficient with IGF2BP1 in
sembl (GRCh37.75) or miRBase (V 20) were used for anno- TCGA RNA-seq data or the fold change determined upon
tations (see supplementary table T1A). Differentially gene IGF2BP1 knockdown or knockout by RNA-seq.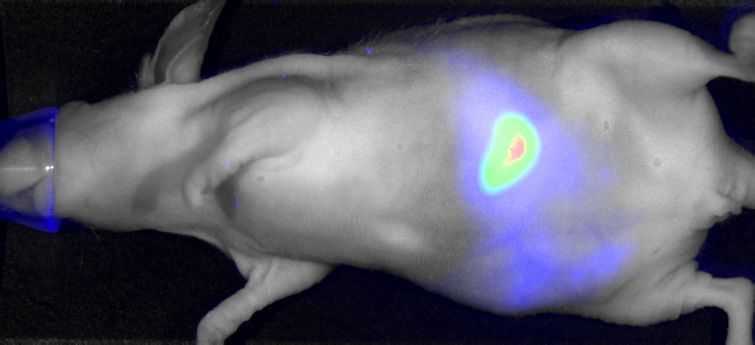
Nucleic Acids Research, 2020, Vol. 48, No. 15 8579
Cell proliferation, spheroid, self-renewal and clonogenic as- Nascent RNA capture
says
The Click-iT Nascent RNA Capture Kit (Thermo Fisher)
For the assessment of cell proliferation in 2D culture sys- was used for the purification of newly synthesized RNAs ac-
tems, 2.5 × 10⁴ cells were plated 24 h upon transfection and cording to manufacturer’s protocol. In brief, PANC-1 cells
the amount of cells as well as propidium iodide-negative/- were transfected with control or IGF2BP1-directed siRNAs
positive cells were determined by flow cytometry at indi- for 72 h. Cells were further incubated with 0.2 mM 5-ethynyl
cated time points using a MACS Quant Analyzer (Miltenyi uridine (EU) for 4 h. Total RNA was prepared using TRI-
Biotec). In addition, cell confluency and vitality were de- zol. 10 g of total RNA served as input for the biotinylation
termined by using an IncuCyte S3 system (Sartorius) with of the EU-labeled RNA by click reaction using 1 mM biotin
10× magnification and CellTiter Glo (Promega) accord- azide. 1 g of biotinylated RNA served as input for the pu-
ing to manufacturer’s protocols. For spheroid growth in rification of nascent RNAs using Streptavidin T1 magnetic
3D culture systems, 1 × 10³ cells were seeded in 96-well beads. Total RNA and purified nascent RNA served as tem-
Downloaded from https://academic.oup.com/nar/article/48/15/8576/5881798 by guest on 25 November 2020
round-bottom ultra-low attachment plates (Corning) 24 h plates for cDNA-synthesis and qPCR analysis.
post-transfection. Spheroid formation was induced by cen-
trifugation for 3 min at 300 g. Spheroid growth was mon-
RNA co-Immunoprecipitation (RIP)
itored for five additional days by bright-field microscopy
using an IncuCyte S3 system (Sartorius) with 10× magni- For RNA co-immunoprecipitations (RIP) cell extracts (1 ×
fication. Additionally, cell viability was determined by us- 107 per condition) were prepared on ice using RIP buffer (10
ing CellTiter Glo (Promega). For anchorage-independent mM HEPES, 150 mM KCl, 5 mM MgCl2 , 0.5% NP40, pH
growth and self-renewal, 1 × 10³ cells were seeded 24 h post- 7.0). Cleared lysates were incubated with indicated antibod-
transfection in a layer of soft agar mixed with cell culture ies (anti-IGF2BP1- or anti-AGO2-antibodies) and Protein
medium (0.35% agar) on another layer of soft agar contain- G Dynabeads (Life Technologies) for 60 min at room tem-
ing a higher concentration (0.5% agar). Growth and colony perature (RT). After three washing steps with RIP buffer,
formation were monitored for 14 days with medium ex- protein–RNA complexes were eluted by addition of 1%SDS
change every 3 days, as described previously (30). Colonies and 65◦ C/10 min. Protein enrichment was analyzed by
were stained using MTT (Sigma-Aldrich). The number of western blotting. Co-purified RNAs were extracted using
colonies was determined by using the 2D Colony Analyzer TRIZOL and analyzed by RT-q-PCR.
tool of the MiToBo package for the Fiji software (http:
//fiji.sc). For clonogenic assays, 200 cells were seeded in six-
Western blotting
well plates 24 h post-transfection. Colony formation was
analyzed 14 days upon seeding. Colonies were stained by Infrared western blotting analyses were performed as previ-
using 0.01% crystal violet for 60 min. Number of colonies ously described (8). In brief, total protein of harvested cells
were determined by using the 2D Colony Analyzer tool of was extracted in lysis-buffer (50 mM Tris–HCl (pH 7.4), 50
the MiToBo package for the Fiji software. mM NaCl, 2 mM MgCl2 , 1% SDS) supplemented with pro-
tease and phosphatase inhibitor cocktails (Sigma-Aldrich).
Drug synergy matrix screen Protein expression was analyzed by Western blotting with
indicated primary antibodies by using fluorescence-coupled
For the analysis of synergy between BTYNB and Palboci- secondary antibodies and an infra-red scanner (LICOR).
clib, the viability of ES-2 cells was determined 72 h upon Antibodies used are indicated in Supplementary Table S10.
drug exposure using CellTiter GLO in a drug matrix screen
at indicated concentrations. Synergy relief maps were gen-
erated using the SynergyFinder web application (https:// Statistics
synergyfinder.fimm.fi, (31)) and the ZIP (Zero interaction All experiments were performed at least in biological trip-
potency) method. licates. Statistical significance was tested by a parametric
Student’s t-test on equally distributed data. Otherwise, a
RNA isolation and RT-q-PCR non-parametric Mann–Whitney-test was performed. For
Kaplan–Meier analyses, statistical significance was deter-
Total RNA from cell line experiments was isolated by using
mined by log-rank analyses.
TRIzol. RNA integrity was determined on a Bioanalyzer
2100 (Agilent). For cDNA synthesis, two g total RNA
served as a template using M-MLV Reverse Transcriptase RESULTS
(Promega) and random hexamer primers following man-
IGF2BP1 is a conserved enhancer of tumor cell proliferation
ufacturer’s protocols. qPCR analysis was performed us-
ing a LightCycler 480 II (Roche) with the ORA™ qPCR The IGF2 mRNA-binding protein 1 (IGF2BP1) promotes
Green ROX L Mix (highQu) using following PCR reac- the proliferation and in vivo growth of tumor cells de-
tions: 5 min / 95◦ C, 45 cycles of 10 s/95◦ C, 10 s/60◦ C and 20 rived from a variety of solid cancers (8,9,32). In agree-
s/72◦ C. Primer pairs spanning an exon/exon borders were ment, the meta-analysis of 33 TCGA-provided cancer tran-
selected using Primer Blast (https://www.ncbi.nlm.nih.gov/ scriptome data sets, including 9282 tumor samples, indi-
tools/primer-blast/). Sequences are summarized in Supple- cated that high IGF2BP1 expression is associated with
mentary Table S10. Relative RNA abundance was deter- reduced overall survival probability (Figure 1A). For 9
mined by the Ct method, as previously described (8). out of 33 cancers, high IGF2BP1 mRNA expression was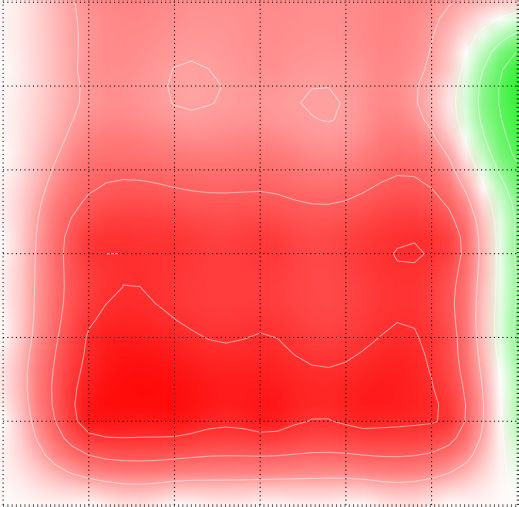
8580 Nucleic Acids Research, 2020, Vol. 48, No. 15

    A                                                                           B

                                                                                                                                                          Downloaded from https://academic.oup.com/nar/article/48/15/8576/5881798 by guest on 25 November 2020
     C                                                    D                         E

Figure 1. IGF2BP1 is a conserved pro-oncogenic RBP in human cancer. (A) Kaplan–Meier plots of overall survival analyses (median cutoff) based on
IGF2BP1 mRNA expression. Overall survival was analyzed for all TCGA (The Cancer Genome Atlas) tumor cohorts (9282 patients, left) and the PAAD
cohort (Pancreatic Adenocarcinoma, 178 patients, right). Red, high expression of IGF2BP1; Blue, low expression of IGF2BP1. HR, hazard ratio; p, logrank
p value. (B) Box plots showing the IGF2BP1 expression in tumor and normal tissues for indicated cancers. Data were derived from the TCGA (T, red boxes)
and GTEx (N, blue boxes) portal. The number (n) of analyzed samples is indicated. LIHC, liver hepatocellular carcinoma; LUAD, lung adenocarcinoma;
OV, ovarian carcinoma; SKCM, skin cutaneous melanoma; PAAD, pancreatic adenocarcinoma). (C) Heatmap of correlation coefficients (R) determined
for protein-coding gene and IGF2BP1 expression. R values were determined in indicated TCGA data sets and ranked according to median correlation
coefficient. Scale bar in lower panel. (D) Box plots of experiments indicating IGF2BP1 CLIP hits in the 3 UTR of mRNAs showing positive (R+; R > 0.15,
n = 2039) or negative (R–; R←0.15, n = 155) association with IGF2BP1 expression in cancers analyzed in (C). (E) Gene set enrichment analysis (GSEA) of
IGF2BP1-correlated gene expression in the five cancers analyzed in (C). GSEA was performed on ranked median correlation coefficient determined in (C).
KEGG pathway ‘Cell Cycle’ (left) and the Hallmark pathway ‘E2F Targets’ (right) are shown. NES, normalized enrichment score. Statistical significance
was determined by Mann–Whitney test.

significantly (P < 0.05) associated with adverse progno-                      IGF2BP1 (Supplementary Figure S1C, D). This suggested
sis (Supplementary Figure S1A). This included pancreatic                      that IGF2BP1 acts via largely cancer-specific pathways or
adenocarcinoma (Figure 1A; PAAD). In the vast major-                          that its most conserved effector pathway(s) across cancer
ity of cancers, IGF2BP1 synthesis was substantially up-                       types remained unknown.
regulated, supporting its oncofetal expression and con-                          Aiming to identify key candidate effector pathways,
served prognostic relevance. Among cancers with substan-                      IGF2BP1-associated expression of protein-coding genes
tially upregulated IGF2BP1 expression were four with re-                      was investigated in the aforementioned five cancers (Sup-
ported pro-oncogenic roles of IGF2BP1 (LIHC, LUAD,                            plementary Table S1). The median correlation coefficient
OV and SKCM) as well as PAAD (Figure 1B). In these                            was used to rank genes and distinguish two major groups,
five cancers, IGF2BP1 followed by LIN28B were the in av-                      genes showing positive (R+) or negative (R–) correlation
erage most upregulated mRNA-binding proteins (mRBPs)                          with IGF2BP1 expression (Figure 1C). The investigation
among 660 detected and reported by the RBP census (Sup-                       of IGF2BP1–3 UTR association, re-analyzed in eight inde-
plementary Figure S1B) (33). IGF2BP1 is a known reg-                          pendent CLIP studies performed in four distinct cell types
ulator of mRNA stability and associated with a plethora                       (8), suggested an enrichment of conserved 3 UTR-binding
of mRNAs. CLIP studies in different cell types suggested                      among the positively correlated (R+) transcripts (Figure
thousands of IGF2BP1-bound mRNAs. So far, many stud-                          1D). This supported IGF2BP1’s role as a mainly 3 UTR-
ies focused on the IGF2BP1-dependent stabilization of the                     dependent mRNA-stabilizing mRBP in cancer. Gene set
MYC mRNA. Surprising in view of the reported MYC/N-                           enrichment analyses (GSEA) of genes ranked by their de-
enhancing role of IGF2BPs (10,12,34), no significant as-                      termined median association with IGF2BP1 expression in
sociation of IGF2BP1 and MYC was observed across 33                           the five investigated solid cancers demonstrated a striking
cancers or the five cancers (LIHC, LUAD, OV, SKCM and                         enrichment of R+-genes in the E2F TARGETS hallmark
PAAD) with expected or validated pro-oncogenic roles of                       as well as the KEGG CELL CYCLE gene sets (Figure 1E;
Nucleic Acids Research, 2020, Vol. 48, No. 15 8581

Supplementary Table S2). This significant enrichment was          IGF2BP1 depletion by RNA-seq in five tumor cell lines
also observed in each of the five investigated cancers sug-       (Supplementary Table S3). For GSEA, protein-coding
gesting E2F-driven gene expression as a conserved effec-          genes were ranked by their median or cell-specific fold
tor pathway of IGF2BP1 in cancer (Supplementary Figure            change of expression (Figure 3A). This indicated conserved
S2A–C; Table S2).                                                 and significant downregulation of the E2F TARGET and
                                                                  KEGG cell cycle gene sets in median and all individual
IGF2BP1 promotes cell cycle progression in cancer-derived         cell models, including IGF2BP1-KO A549 cells (Figure 3B,
cells                                                             C; Supplementary Figure S5A; Supplementary Table S4).
                                                                  In agreement, IGF2BP1 depletion resulted in the largely
If and how IGF2BP1 controls E2F-dependent cell cy-
                                                                  conserved downregulation of factors promoting G1/S tran-
cle control and proliferation was initially investigated in
                                                                  sition (Figure 3D, left panel; Supplementary Table S5).
PAAD-derived PANC-1 cells. IGF2BP1 depletion impaired
                                                                  These genes also showed significant and concise associa-
spheroid growth, significantly decreased 2D cell prolifer-
                                                                  tion with IGF2BP1 expression in the five respective pri-

                                                                                                                                     Downloaded from https://academic.oup.com/nar/article/48/15/8576/5881798 by guest on 25 November 2020
ation and elevated doubling time approximately twofold
                                                                  mary cancers (Figure 3D, right panel). No evidence for
(Figure 2A; Supplementary Figure S3A, B). Cell cycle pro-
                                                                  IGF2BP1-dependent regulation of factors impairing G1/S
gression analyses showed that IGF2BP1 knockdown led
                                                                  transition, e.g. RB1, was observed. Surprisingly, significant
to an enrichment of cells in G1 (Figure 2B, C). Impor-
                                                                  downregulation of MYC mRNA abundance was only de-
tantly, IGF2BP1 depletion was not associated with in-
                                                                  termined in HepG2 and MV3 cells, supporting previous
creased apoptosis, as indicated by barely observed subG1
                                                                  studies (9,12). In view of lacking correlation of IGF2BP1
cell fractions or dead cells, monitored by PI-labeling (Sup-
                                                                  and MYC mRNAs across cancers (see Supplementary Fig-
plementary Figure S3C). IGF2BP1 knockdown also im-
                                                                  ure S1C and S1D), this provided further evidence that
paired colony formation and clonogenicity suggesting a piv-
                                                                  IGF2BP1-dependent regulation of MYC mRNA levels is
otal role of cell cycle control and sustained self-renewal po-
                                                                  rather cell-type specific. In contrast, these findings indicated
tential (Supplementary Figure S3D, E). Impaired G1/S-
                                                                  a pivotal role of IGF2BP1 in regulating E2F-driven tran-
progression upon IGF2BP1 depletion was also observed
                                                                  scription in a concise manner across different cancers and
in four cell lines derived from the four other cancers in-
                                                                  tumor cell lines. This was tested further for the E2F1–3 tran-
vestigated here (Figure 2D; Supplementary Figure S4A).
                                                                  scription factors, well known enhancers of G1/S transition
The monitoring of cell cycle progression at the single
                                                                  (17). In all analyzed cancer cells, IGF2BP1 depletion sig-
cell level (65 divisions) in IGF2BP1-depleted ES-2 cells
                                                                  nificantly reduced E2F1–3 mRNA levels, with the excep-
(OV-derived), using the FUCCI technology (35), demon-
                                                                  tion of A549 cells where E2F3 transcripts were modestly
strated that IGF2BP1 depletion exclusively prolonged the
                                                                  elevated (Figure 3D). In agreement with decreased mRNA
G1 phase, approximately twofold (Figure 2E, F). Popula-
                                                                  abundance, E2F1 protein expression was substantially re-
tion analyses over 72 h including 4800 cells confirmed this
                                                                  duced in all tested cancer cell lines upon IGF2BP1 deple-
by indicating a substantial increase of cells in G1 and de-
                                                                  tion (Figure 3E). Likewise, E2F2 and E2F3 protein levels
crease in the S phase upon knockdown (Supplementary Fig-
                                                                  were decreased by IGF2BP1 knockdown in PANC-1 cells
ure S4B, C). This was further evaluated by IGF2BP1 dele-
                                                                  (Supplementary Figure S5C). Notably, downregulation of
tion (KO) in LUAD-derived A549 cells. IGF2BP1-KO im-
                                                                  E2F1 protein was also observed in A549 IGF2BP1-KO cells
paired spheroid growth (Supplementary Figure S4D), as
                                                                  (Supplementary Figure S5D). Furthermore, E2F1 mRNA
previously observed in other cancer-derived cells (8). Fur-
                                                                  levels were strongly reduced in xenograft tumors lack-
thermore, spheroid growth was significantly enhanced in
                                                                  ing IGF2BP1 (Figure 3F). In GFP-expressing A549 cells
A549 knockout cells by the re-expression of wild type (WT)
                                                                  deleted for IGF2BP1, E2F1 mRNA and protein levels were
GFP-tagged IGF2BP1 (Supplementary Figure S4E). Com-
                                                                  reduced nearly twofold compared to parental cells (Figure
pared to GFP re-expressing controls, viability remained
                                                                  3G, GFP; Supplementary Figure S5E). The re-expression
essentially unchanged by the re-expression of an RNA-
                                                                  of wild type IGF2BP1 restored E2F1 mRNA and protein
binding deficient mutant GFP-IGF2BP1 (MUT). This in-
                                                                  expression (Figure 3G, WT; Supplementary Figure S5E).
dicated the importance of the IGF2BP1’s RNA-binding ca-
                                                                  This was not observed upon the re-expression of RNA-
pacity in controlling tumor cell proliferation and spheroid
                                                                  binding deficient IGF2BP1, suggesting that IGF2BP1 con-
growth. In nude mice, IGF2BP1 deletion substantially in-
                                                                  trols E2F1 expression in an RNA-binding dependent man-
terfered with the growth of A549-derived xenograft tu-
                                                                  ner (Figure 3G, MUT; Supplementary Figure S5E (8)).
mors (Figure 2G). Concise with its depletion, IGF2BP1
loss resulted in an increase of A549 cells in G1 without en-
hanced subG1 cell fractions (Figure 2H, I). This indicated,       IGF2BP1 regulates E2F1 expression in a 3 UTR- and
IGF2BP1 is a conserved regulator of G1/S-transition in            miRNA-dependent manner
cancer cells, controlling tumor cell proliferation in vitro and
                                                                  IGF2BP1’s main and conserved role in cancer-derived cells
tumor growth in vivo.
                                                                  relies on the 3 UTR- and miRNA-dependent regulation
                                                                  of mRNA turnover (8). IGF2BP1-mRNA association re-
IGF2BP1 regulates the E2F-dependent control of G1/S-
                                                                  ported by CLIP indicated conserved binding to the 3 UTR
transition
                                                                  of the E2F1 mRNA (Figure 4A). Preferred 3 UTR-binding
To identify conserved key effector-encoding mRNAs of              was also observed for other transcripts encoding positive
IGF2BP1-dependent control of G1/S-transition, the ex-             regulators of G1/S transition (Supplementary Figure S5B).
pression of protein-coding genes was monitored upon               3 UTR-dependent regulation was tested for E2F1 using
8582 Nucleic Acids Research, 2020, Vol. 48, No. 15
Downloaded from https://academic.oup.com/nar/article/48/15/8576/5881798 by guest on 25 November 2020
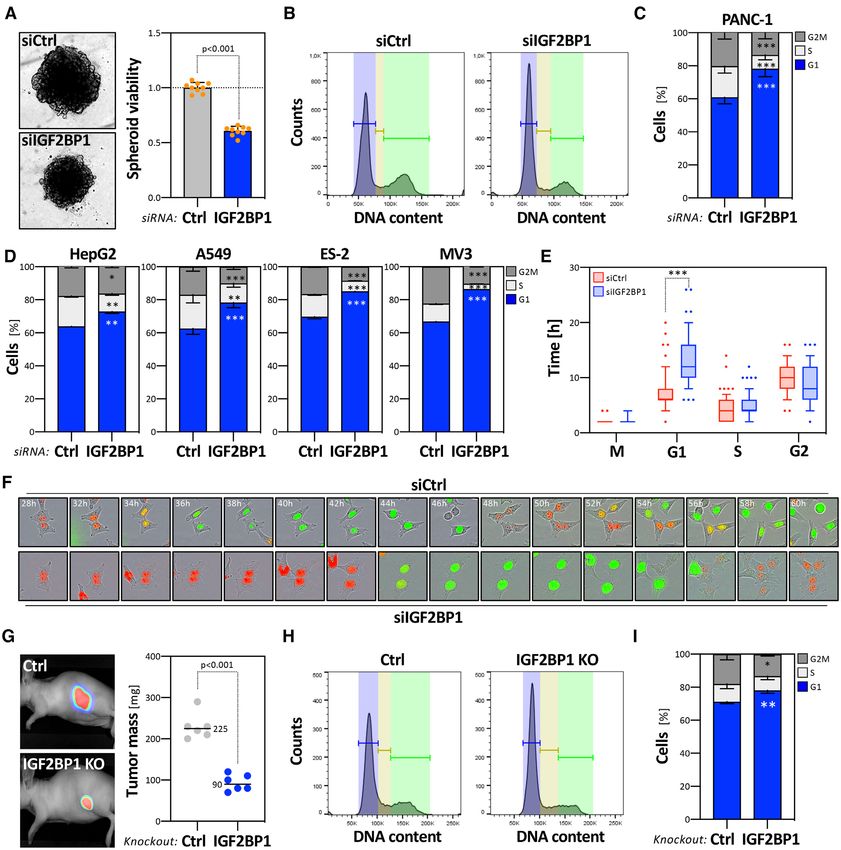
Figure 2. IGF2BP1 promotes proliferation and cell cycle progression in cancer cells. (A) PANC-1 cells were transfected with control (siCtrl, gray) or
IGF2BP1-directed siRNA pools (siIGF2BP1, blue). Representative PANC-1 spheroids 6 days post-transfection are indicated in the left panel. The viability
of PANC-1 spheroids was determined by CellTiter GLO (right panel). Orange dots represent median-normalized values of three spheroids analyzed in
three independent studies. (B–D) PANC-1 cell cycle phase distribution upon transfection with control (B, left panel) or IGF2BP1-directed (B, right panel)
siRNAs, as determined by PI-labeling and flow cytometry. Fractions of PANC-1 (C) or HepG2, A549, ES-2 and MV3 (D) cells in each cell cycle phase
were quantified in three independent knockdown analyses. (E) Box plots showing the duration of cell cycle phases upon control (siCtrl, red) or IGF2BP1-
depletion (siIGF2BP1, blue). ES-2 cells were stably transduced with the FUCCI system (Sartorius). The length of cell cycle phases was determined over
66 (control, red) and 80 (IGF2BP1-depleted, blue) cell divisions. (F) Representative images of cells with segmentation mask overlays analyzed in (E) at
indicated time post transfection with control- (upper panel) or IGF2BP1-directed (bottom panel) siRNAs. Red, G1 phase; Green, G2 phase; Yellow, S
phase. (G) Parental (Ctrl) and IGF2BP1-deleted (KO) A549 cells expressing iRFP were injected (sc) into nude mice (6 mice per condition) and the growth
of xenograft tumors was monitored by near-infrared imaging. Representative images are shown in the left panel (42 days post-injection). Final tumor mass
is shown by box plots (right panel). (H, I) Cell cycle analysis, as presented in (B, C) of parental and IGF2BP1-deleted A549 cells. Statistical significance
was determined by Mann–Whitney test: *P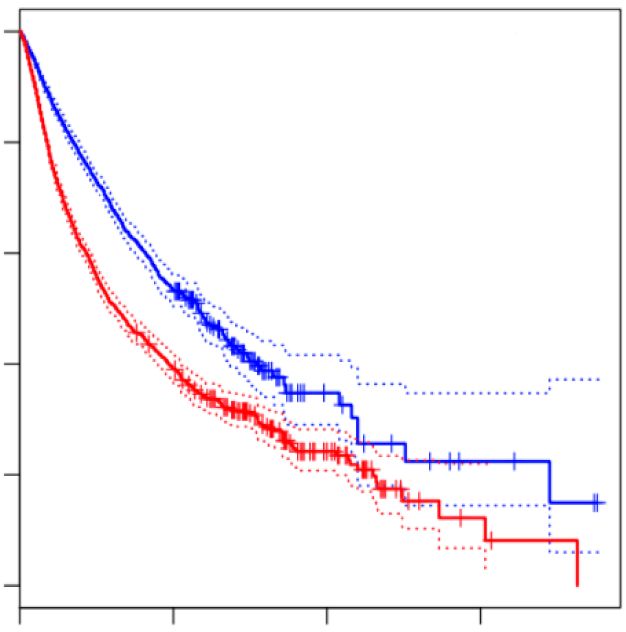
Nucleic Acids Research, 2020, Vol. 48, No. 15 8583

    A                                                    B                                           C

                                                                                                                                                            Downloaded from https://academic.oup.com/nar/article/48/15/8576/5881798 by guest on 25 November 2020
     D                                                           E

                                                                 F                                             G

Figure 3. IGF2BP1 controls G1/S cell cycle transition of cancer cells. (A) Heatmap indicating the fold change (FC) of mRNAs upon IGF2BP1-depletion in
indicated cancer cell lines 72 h post-transfection of siRNAs. The abundance of mRNAs was monitored by RNA sequencing. Genes were ranked according
to their median FC determined in five cancer cell lines. (B, C) Gene set enrichment analysis (GSEA) of median FC of protein-coding genes upon IGF2BP1
depletion in five cancer cell lines (B) or upon IGF2BP1 knockout in A549 cells (C). Results for the KEGG pathway ‘Cell Cycle’ (left) and the Hallmark
pathway ‘E2F Targets’ (right) are shown. NES, normalized enrichment score. (D) Heatmap depicting the fold change of indicated mRNAs upon IGF2BP1
depletion in cancer cells (left) and their correlation (coefficient) with IGF2BP1 mRNA expression in indicated cancers (right). Median fold change or
correlation coefficients are indicated in most right columns. (E) Representative Western blot analyses of E2F1 upon IGF2BP1 depletion in indicated cancer
cell lines. Vinculin (VCL) served as a loading and normalization control. Average fold change and standard deviation of E2F1 protein levels, determined
in three independent analyses are indicated in bottom panel. (F) RT-q-PCR analysis of E2F1 mRNA levels in excised xenograft tumors (Figure 2G).
Representative images of tumors are shown in the left panel. E2F1 expression was determined in three control and IGF2BP1-KO tumors by normalization
to GAPDH. (G) RT-q-PCR analysis of E2F1 mRNA levels in IGF2BP1-KO A549 cells expressing GFP, GFP-IGF2BP1 (WT) or an RNA-binding deficient
GFP-IGF2BP1 (MUT) normalized to parental A549 cells. RPLP0 served as normalization control. Statistical significance was determined by Student’s
t-test.

E2F1–3 UTR containing luciferase reporters. IGF2BP1 de-                       by actinomycin D (Figure 4E; ActD). Notably, although
pletion resulted in conserved downregulation of reporter                       IGF2BP1 depletion reduced total E2F1 mRNA levels, the
activity in all analyzed cancer cell lines (Figure 4B). This                   synthesis of nascent E2F1 mRNAs remained essentially un-
was further investigated by deleting the E2F1–3 UTR in                        changed (Supplementary Figure S6A). Together, this in-
PANC-1 cells by sgRNAs directing Cas9-cleavage 3 -to the                      dicated that IGF2BP1 exclusively controls E2F1 mRNA
stop codon and 5 -to the polyadenylation signal (Figure                       turnover without substantial deregulation of E2F1 mRNA
4C). IGF2BP1 expression remained unaffected by homozy-                         synthesis.
gous deletion of the bulk E2F1–3 UTR. However, 3 UTR-                           E2F1 expression is controlled at various levels includ-
deletion abolished downregulation of E2F1 mRNA levels                          ing miRNA-directed inhibition via the 3 UTR (17,19). To
observed upon IGF2BP1 knockdown in parental PANC-                              identify conserved miRNAs controlling E2F1 synthesis, the
1 cells (Figure 4D). These findings strongly suggested that                    expression of miRNAs was monitored in the five investi-
IGF2BP1 controls E2F1 mRNA turnover via the 3 UTR.                            gated cell lines (Supplementary Table S6). MiRNA abun-
In accord, IGF2BP1 knockdown significantly enhanced                            dance was then plotted over the number of databases, ana-
decay of the E2F1 mRNA upon blocking transcription                             lyzed via MiRWalk2.0, predicting miRNA targeting at the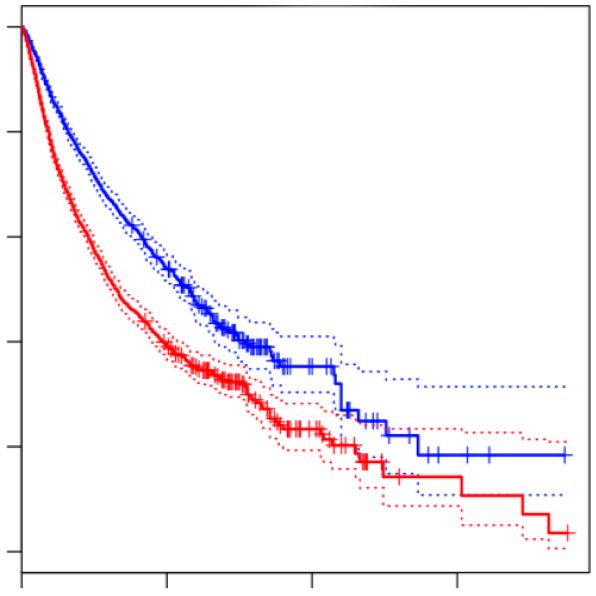
8584 Nucleic Acids Research, 2020, Vol. 48, No. 15

    A                               B                                        C                                     D

    E                                   F                                          G                                    H

                                                                                                                                                           Downloaded from https://academic.oup.com/nar/article/48/15/8576/5881798 by guest on 25 November 2020
Figure 4. IGF2BP1 enhances E2F1 mRNA stability in a 3 UTR- and miRNA-dependent manner. (A) IGF2BP1 CLIP profile of the E2F1 mRNA.
The 3 UTR is highlighted by dashed lines. (B) E2F1 3 UTR luciferase activity in indicated cancer cells upon control- or IGF2BP1-depletion. Reporter
activities, normalized to a control reporter, were determined in four independent experiments. (C) Experimental strategy of the genomic deletion of the
E2F1 3 UTR by the Cas9 nuclease using indicated CRISPR guide RNAs (sgRNAs) (Top panel). Representative PCR analysis on genomic DNA of parental
PANC-1 (WT) and an E2F1 3 UTR-deleted PANC-1 cell clone (KO). (D) RT-q-PCR analysis of E2F1 mRNA levels upon IGF2BP1 depletion in parental
PANC-1 (WT, blue) or the E2F1 3 UTR-deleted PANC-1 cell clone (3 UTR, grey) normalized to control-transfected cells. RPLP0 served as internal
normalization control. (E) E2F1 mRNA decay was monitored by RT-q-PCR in control- (black) or IGF2BP1-depleted (blue) PANC-1 cells upon indicated
time of Actinomycin D (ActD) treatment. Error bars indicated standard deviation. Average mRNA half-life, determined in three independent studies, is
indicated. (F) The graph depicts the number of CLIP studies showing overlapping IGF2BP1-CLIP sites (left axis, red; CLIP hits) and the position (x-axis)
of miRNA targeting sites (blue) in the E2F1 3 UTR. MiRNA abundance (right axis, blue) is indicated as median log2 cpm determined by small RNA-seq of
indicated cell lines. Luciferase reporter comprising indicated regions of the E2F1–3 UTR (LUC-miR-93, LUC-miR-29a) and analyzed in (G), are indicated
in the top panel. (G) Luciferase reporter analysis demonstrating activity of indicated reporters in parental (Ctrl, red) or IGF2BP1-knockout (blue) A549
cells. Reporter activities, normalized to a control reporter without miRNA targeting site (Empty), were determined in three independent experiments
with two technical replicates each. (H) Co-purification of mRNAs with AGO2 in parental (Ctrl) or IGF2BP1-knockout A549 cells was analyzed by
immunoprecipitation using anti-AGO2 antibodies and RT-q-PCR analysis (right panel). HIST2 and RPLP0 served as negative controls. HIST1 served as
normalization control. Statistical significance was determined by Student’s t-test: *P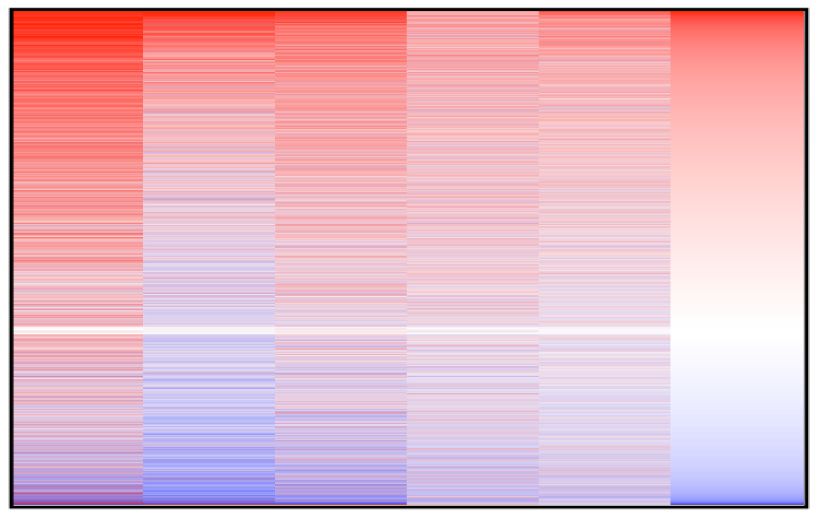
Nucleic Acids Research, 2020, Vol. 48, No. 15 8585

                                                                                                                                                        Downloaded from https://academic.oup.com/nar/article/48/15/8576/5881798 by guest on 25 November 2020
Figure 5. The E2F-dependent cell cycle progression controlled by IGF2BP1 is m6 A-dependent. (A, B) N6 -Methyladenosine RIP-seq profile of the E2F1
(A), E2F2 and E2F3 (B) mRNAs determined in A549 cells. Data were obtained from MeT-DB V2.0. The m6 A-writing enzymes METTL3 and METTL14 as
well as IGF2BP1 as an m6 A-reader are indicated. (C) Co-purification of indicated mRNAs with IGF2BP1 in control- (gray, siCtrl) or METTL3/14-depleted
(blue, siMETTL3/14) PANC-1 cells was analyzed by RIP using anti-IGF2BP1 antibodies and RT-q-PCR analysis. HIST1 served as normalization control.
(D) Abundance of E2F1–3 mRNAs determined by RNA-seq upon transfection of indicated siRNAs in PANC-1 cells as shown in (C). (E) Representative
Western blot analysis of indicated proteins upon control- and METTL3/14 depletion in PANC-1 (left) and A549 (right) cells. VCL served as loading
control. (F) Gene set enrichment analysis (GSEA) of protein-coding genes upon METTL3/14 co-depletion in PANC-1 cells. Protein-coding genes were
ranked by their fold change of mRNA abundance determined by RNA-seq as shown in (D). Results for the Hallmark pathway ‘E2F Targets’ (left) and
the KEGG pathway ‘Cell Cycle’ (right) are shown. NES, normalized enrichment score. (G) PANC-1 cells were transfected with indicated siRNAs (grey,
siCtrl; siMETTL3/14, blue). The viability of PANC-1 spheroids was determined 6 days post-transfection by CellTiter GLO, as described in Figure 2A.
(H, I) Cell cycle progression analyses of control- or METTL4/14-depleted PANC-1 and A549 cells (I), as described in Figure 2B, C. Representative cell
cycle phase distribution in PANC-1 cells is shown in (H). Statistical significance was determined by Mann–Whitney test: *P < 0.05; **P < 0.01; ***P <
0.001.

and show conserved 3 UTR-association in IGF2BP1-CLIP                        mentary Table S8). This was associated with impaired cell
studies (Figure 3D, 4A; Supplementary Figure S5B). In                        viability and cell cycle progression, evidenced by accumula-
PANC-1 cells, IGF2BP1-RIP studies demonstrated that co-                      tion of cells in G1 (Figure 5G–I). Furthermore, the expres-
depletion of METTL3/14, crucial for m6 A-modification of                     sion of IGF2BP1, METTL3 and METTL14 is strongly cor-
mRNAs, significantly reduced IGF2BP1-association of all                      related with E2F1–3 expression (R = 0.4) across 33 TCGA
three mRNAs (Figure 5C). In PANC-1 cells, METTL3/14                          tumor cohorts (Supplementary Figure S6G). In sum, this
co-depletion resulted in reduced E2F1–3 mRNA and pro-                        indicated that IGF2BP1 promotes E2F-driven G1/S tran-
tein levels (Figure 5D, E; Supplementary Figure S6E and                      sition in an m6 A-dependent manner.
Table S7). The co-depletion of METTL3/14 and METTL3-
deletion by CRISPR/Cas9 in A549 cells led to reduced
E2F1 expression without affecting IGF2BP1 abundance                          IGF2BP1 is a post-transcriptional super-enhancer of E2F-
(Figure 5E; Supplementary Figure S6F). GSEA of gene ex-                      dependent transcription
pression determined by RNA-seq upon METTL3/14 co-                            Our studies suggested that IGF2BP1 is a conserved post-
depletion confirmed significant downregulation of E2F                        transcriptional enhancer of E2F-driven transcription in
target and KEGG cell cycle gene sets (Figure 5F; Supple-                     cancer. In agreement, the activity of E2F-promoter lu-
8586 Nucleic Acids Research, 2020, Vol. 48, No. 15
ciferase reporters was consistently decreased by IGF2BP1 currently in phase 4 clinical trials (Supplementary Figure
depletion in all here investigated cancer cell lines (Fig- S8B, C). These findings suggested that BTYNB impairs
ure 6A). The evaluation of IGF2BP1-CLIP studies re- IGF2BP1-association with the E2F1 mRNA. Consistently,
vealed enriched 3 UTR-association of E2F TARGET tran- BTYNB also led to significantly reduced activity of E2F1–
scripts among mRNAs downregulated by IGF2BP1 deple- 3 UTR luciferase reporters and decreased E2F1 expression
tion in five cancer cell lines (Figure 6B, dark to light blue). at the protein as well as mRNA level (Figure 7C, D). Like-
Moreover, E2F TARGET genes showed a strong correla- wise, BTYNB decreased E2F1 expression and vitality of all
tion of downregulation upon IGF2BP1 depletion in cancer other here investigated cancer cell lines without affecting
cell lines and IGF2BP1-associated expression in the cor- IGF2BP1 abundance (Figure 7E; Supplementary Figure
responding primary cancers (Figure 6C). This suggested S8A). If BTYNB also impacts the expression of prior iden-
that IGF2BP1 promotes the synthesis of E2F-driven gene tified E2F1-driven target transcripts of IGF2BP1 (DSCC1,
expression via E2Fs and stabilizes the respective mRNAs. BUB1B, MKI67 and GINS1) was analyzed by IGF2BP1-
This was analyzed for four E2F-driven transcripts: DSCC1, RIP and monitoring steady state mRNA levels in A549
Downloaded from https://academic.oup.com/nar/article/48/15/8576/5881798 by guest on 25 November 2020
BUB1B, MKI67 and GINS1 (Figure 6C, red). These were cells. In agreement with reduced IGF2BP1-association of
among 31 transcripts (black and red) showing association the four mRNAs, steady state levels of all four transcripts
with IGF2BP1 in primary tumors (R > 0.15) and consistent were markedly reduced upon BTYNB exposure of A549 as
downregulation (log2 FC < –0.5) upon IGF2BP1 depletion well as all other cancer cell lines investigated (Figure 7F;
in cancer cells (Figure 6C, dashed lines). IGF2BP1-CLIP Supplementary Figure S8D, E).
indicated conserved and 3 UTR-directed association for all How BTYNB treatment impairs tumor initiation and
four mRNAs (Supplementary Figure S7A). Notably, one growth was analyzed in iRFP-labeled (near infrared red
transcript, the proliferation marker Ki-67 (MKI67), is sta- fluorescent protein) ES-2 cells. In these, the deletion of
bilized by IGF2BP1 in hepatocellular carcinoma (9). RNA- IGF2BP1 impaired the growth of subcutaneous (s.c.)
seq confirmed that all four mRNAs were downregulated xenograft tumors and interfered with metastasis (8). ES-2
by IGF2BP1 knockdown and the co-depletion of E2F1– cells exposed to BTYNB, prior (24 h) and during s.c. in-
3 (Figure 6D; Supplementary Table S9). Co-depletion of jection of viable tumor cells, formed tumors at the same
E2F1–3 resulted in severely impaired 2D proliferation and efficiency observed for DMSO-treated controls (Figure
spheroid growth, as expected (Supplementary Figure S7B, 7G; Supplementary Figure S8F). However, already 7 days
C). The analysis of mRNA turnover upon blocking tran- post s.c. injection tumor growth was markedly reduced by
scription indicated significant destabilization of all four BTYNB. This was observed up to 3 weeks post last BTYNB
transcripts upon IGF2BP1 knockdown (Figure 6E). Like treatment. A major problem of ovarian cancer progression
observed for IGF2BP1 (see Figure 1A), the mRNA expres- is the rapid spread of malignancies in the peritoneum. If
sion of the 31 identified E2F/IGF2BP1-driven factors was BTYNB also interferes with the peritoneal growth of ES-
associated with a significantly reduced survival probabil- 2 cells was monitored upon intraperitoneal (i.p.) injection.
ity across 33 cancers (Figure 6F). Moreover, these genes BTYNB treatment impaired both, the growth and spread
showed conserved association with IGF2BP1 expression of tumor cells with reduced tumor burden observed up to 2
across these 33 cancers as well as the aforementioned five weeks after the last treatment (Figure 7H; Supplementary
cancers primarily investigated here (Supplementary Fig- Figure S8G).
ure S7D). In conclusion, this indicated that IGF2BP1 is Our studies implied that the indirect, IGF2BP1-directed
a post-transcriptional ‘super’-enhancer of E2F-driven gene impairment of E2F-driven gene expression by BTYNB syn-
expression. The protein promotes the E2F hallmark path- ergizes with other cell cycle inhibitors like Palbociclib, tar-
way by enhancing E2F1–3 abundance and stabilizes E2F- geting activating kinases upstream of E2Fs. This was tested
driven oncogenic transcripts. by matrix analysis of combinatorial treatment in ES-2 cells.
These analyses revealed synergy scores larger than 7, indi-
cating additive effects (Synergy score between –10 and 10)
BTYNB inhibits enhancement of E2F-driven gene expression
of BTYNB and Palbociclib according to the ZIP (zero in-
by IGF2BP1
teraction potency) synergy model (Figure 7I). Notably ad-
Previous studies reported a small molecule inhibitor, ditivity or even synergy was observed already at low con-
BTYNB (21), impairing association of IGF2BP1 with centrations of both compounds, providing promising evi-
the MYC RNA in vitro. BTYNB interfered with can- dence that the inhibition of IGF2BP1-RNA association by
cer cell proliferation and expression of some prior known BTYNB is beneficial in combined treatment aiming to im-
IGF2BP1 target transcripts. This suggested that this lead pair tumor cell proliferation.
compound may as well disrupt E2F/IGF2BP1-driven gene
expression. BTYNB exposure (48 h) impaired the viability
DISCUSSION
of LUAD-derived A549 cells (Figure 7A). IGF2BP1-RIP
analyses demonstrated that BTYNB treatment for 24 h, Our studies reveal that IGF2BP1 is the first RBP acting
when cell vitality was barely affected (data not shown), as a conserved post-transcriptional enhancer of E2F-driven
is associated with reduced binding of IGF2BP1 to the gene expression and G1/S-transition in cancer cells and tu-
E2F1 mRNA (Figure 7B; Supplementary Figure S8B). In mors. In consequence, IGF2BP1 promotes tumor cell pro-
contrast, IGF2BP1-association with the E2F1 mRNA re- liferation in vitro and tumor growth in vivo. The concisely
mained essentially unaffected by treatment (24 h) with observed, proliferation-stimulating role of IGF2BP1 was
Palbociclib (36), a CDK4/6-targeting cell cycle inhibitor largely attributed to the m6 A-dependent stabilization ofNucleic Acids Research, 2020, Vol. 48, No. 15 8587
A B C
Downloaded from https://academic.oup.com/nar/article/48/15/8576/5881798 by guest on 25 November 2020
D E F
Figure 6. IGF2BP1 is a post-transcriptional enhancer of E2F-driven genes. (A) E2F-responsive promoter studies. Luciferase activities, normalized to
minimal promoter activity, were determined in indicated cancer cells upon control- (gray) or IGF2BP1-depletion (blue) in four independent experiments.
(B) Box plots of IGF2BP1 CLIP hits in the 3 UTR of mRNAs showing a median log2 FC < –0.5 upon IGF2BP1 depletion, as determined in five cancer
cell lines (see Figure 3A). E2F Targets, n = 196; All, n = 1280. (C) The median correlation coefficient (R) of E2F target genes with IGF2BP1 in indicated
primary cancers was plotted against the median log2 FC observed upon IGF2BP1 depletion in indicated cancer cells. Dashed lines distinguish genes with
R > 0.15 and log2 FC←0.5 (n = 31). (D) Log2 FC of DSCC1, BUB1B, MKI67 and GINS1 upon E2F1/2/3- or IGF2BP1-depletion in PANC-1 cells,
as determined by RNA seq. (E) mRNA decay of indicated genes was monitored by RT-q-PCR in control- (gray) or IGF2BP1-depleted (blue) PANC-
1 cells upon 4h of Actinomycin D (ActD) treatment and normalized to RNA levels prior ActD treatment. Error bars indicated standard deviation in
three independent studies. RPLP0 served as internal normalization control. (F) Kaplan–Meier plots of overall survival analyses (median cutoff) based on
the expression of 31 IGF2BP1 and E2F target mRNA (as shown in C) expression. Overall survival was analyzed for all 33 TCGA tumor cohorts (9282
patients). HR, hazard ratio; P, logrank P value. Statistical significance was determined by Mann–Whitney test: *P < 0.05; **P < 0.01; ***P < 0.001.
the MYC mRNA (9,10,12). However, IGF2BP1 and MYC miRNAs relies on their recruitment to miRNA/RISC-
mRNA expression appear barely correlated in most can- devoid IGF2BP1-mRNPs (14). The expression of posi-
cers and IGF2BP1 ablation results in conserved and ex- tive regulators of G1/S transition, including E2Fs, is sub-
clusive impairment of G1/S transition. In contrast, dis- stantially impaired by abundant miRNAs emphasizing the
turbed cell cycle progression upon MYC depletion is vari- potency of post-transcriptional control of cell cycle pro-
able, primarily leading to the enrichment of cancer cells in gression in cancer and stem cells (17,19,38). In addition
the S or G2/M phases (37). This clearly indicates that the to E2F1, IGF2BP1 directly stabilizes E2F-driven tran-
specific role of IGF2BP1 in promoting G1/S-transition in- scripts encoding cell cycle regulators like Ki-67. This iden-
volves additional effector pathways controlling this check- tifies IGF2BP1 as a conserved post-transcriptional super-
point. We reveal that IGF2BP1 is a conserved regulator enhancer of E2F-transcritpion, promoting E2F activity
of E2F-driven gene expression, promoting the expression over the cell type and mitogen-dependent restriction point
of E2F transcription factors and other positive regulators of G1/S transition (17). Thus, our studies also provide an
of G1/S transition like CDK2/4/6 as well as CCNE1 in explanation for the conserved role of IGF2BPs in promot-
an RNA-binding dependent manner. The only prior re- ing the self-renewal of stem-like cells (2,39). E2F-driven
ported RBPs controlling E2F expression are PUM1 and transcription serves multiple roles in stem cells, includ-
2, which promote miRNA-dependent repression of E2F3 ing potentially cell cycle-independent regulation (18). In-
mRNA translation (17,20). In contrast, IGF2BP1 impairs triguingly, however, the ‘cell cycle length hypothesis’ im-
downregulation of the E2F1 mRNA by miRNAs. This plies that expanded time spent in the G1 phase increases
unravels the first, conserved post-transcriptional enhancer the probability of guidance cues to induce differentiation
of E2F-dependent cell cycle progression. The IGF2BP1- of progenitor cells (40). Consistently, the overexpression of
directed inhibition of target mRNA downregulation by CDK4/cyclinD1 shortens G1 and promotes both, the gen-8588 Nucleic Acids Research, 2020, Vol. 48, No. 15
A B C D
Downloaded from https://academic.oup.com/nar/article/48/15/8576/5881798 by guest on 25 November 2020
E F
G H I
Figure 7. BTYNB impairs IGF2BP1’s post-transcriptional super-enhancer function in E2F-driven gene expression. (A) A549 cells were treated with
DMSO (red) or 5 M BTYNB (blue) for 48 h. Representative images are indicated in the left panel. Cell confluency and viability were determined by an
IncuCyte S3 analyzer and CellTiter GLO (right panel). (B) Co-purification of mRNAs with IGF2BP1 in A549 cells upon treatment with 5 M BTYNB
(48 h) was analyzed by immunoprecipitation using anti-IGF2BP1 antibodies and RT-q-PCR analysis. HIST2 and RPLP0 served as negative controls.
HIST1 served as normalization control. (C) E2F1 3 UTR luciferase activity in A549 cells upon DMSO- or BTYNB (5 M) treatment. Reporter activities
were determined in three independent experiments, including three technical replicates each, as described in Figure 4B. (D, E) Western blot analysis of E2F1
protein level upon DMSO or BTYNB (5 M, 48 h) treatment in indicated cancer cells. The fold change of E2F1 protein and mRNA levels, determined
by RT-q-PCR, upon BTYNB treatment is indicated in bottom panel. (F) Heatmap showing log2 FC of indicated mRNAs upon 5 M BTYNB treatment
(left) or IGF2BP1 depletion (right) in indicated cancer cells. (G, H) iRFP-labeled ES-2 cells were treated with DMSO or 5 M BTYNB for 24h and
injected sc (G) or ip (H) into nude mice (5 mice per condition). The mass of final sc tumors (G) is shown by box plots. Representative images indicating
iRFP-labeled intraperitoneal tumors are shown in the left panel (H). The total, final iRFP fluorescence intensity (FI) of ip tumor burden is indicated by
box plots (H, right panel). (I) Relief plot showing the ZIP synergy for combined treatment with BTYNB and Palbociclib (72 h) at indicated concentrations
in 2D-cultured ES-2 cells. Cell viability was determined using Cell Titer GLO. Synergy maps were generated using the SynergyFinder web application
(https://synergyfinder.fimm.fi, (31)). ZIP (zero interaction potency) synergy scores were determined in four independent experiments. Synergy scores are
color-coded (scores < –10, antagonistic, green; scores > 10, synergistic, red). Statistical significance was determined by Mann–Whitney test: *PYou can also read