Single cell and bulk transcriptomics of the liver reveals potential targets of NASH with fibrosis
←
→
Page content transcription
If your browser does not render page correctly, please read the page content below
www.nature.com/scientificreports
OPEN Single‑cell and bulk transcriptomics
of the liver reveals potential targets
of NASH with fibrosis
Zhong‑Yi Wang1*, Adrian Keogh2, Annick Waldt1, Rachel Cuttat1, Marilisa Neri1,
Shanshan Zhu3, Sven Schuierer1, Alexandra Ruchti1, Christophe Crochemore1,
Judith Knehr1, Julie Bastien1, Iwona Ksiazek1, Daniel Sánchez‑Taltavull2, Hui Ge3, Jing Wu3,
Guglielmo Roma1, Stephen B. Helliwell1,4, Deborah Stroka2 & Florian Nigsch1*
Fibrosis is characterized by the excessive production of collagen and other extracellular matrix (ECM)
components and represents a leading cause of morbidity and mortality worldwide. Previous studies
of nonalcoholic steatohepatitis (NASH) with fibrosis were largely restricted to bulk transcriptome
profiles. Thus, our understanding of this disease is limited by an incomplete characterization of liver
cell types in general and hepatic stellate cells (HSCs) in particular, given that activated HSCs are the
major hepatic fibrogenic cell population. To help fill this gap, we profiled 17,810 non-parenchymal
cells derived from six healthy human livers. In conjunction with public single-cell data of fibrotic/
cirrhotic human livers, these profiles enable the identification of potential intercellular signaling
axes (e.g., ITGAV–LAMC1, TNFRSF11B–VWF and NOTCH2–DLL4) and master regulators (e.g.,
RUNX1 and CREB3L1) responsible for the activation of HSCs during fibrogenesis. Bulk RNA-seq
data of NASH patient livers and rodent models for liver fibrosis of diverse etiologies allowed us to
evaluate the translatability of candidate therapeutic targets for NASH-related fibrosis. We identified
61 liver fibrosis-associated genes (e.g., AEBP1, PRRX1 and LARP6) that may serve as a repertoire
of translatable drug target candidates. Consistent with the above regulon results, gene regulatory
network analysis allowed the identification of CREB3L1 as a master regulator of many of the 61 genes.
Together, this study highlights potential cell–cell interactions and master regulators that underlie HSC
activation and reveals genes that may represent prospective hallmark signatures for liver fibrosis.
There has been a steady rise in the worldwide prevalence of nonalcoholic fatty liver disease (NAFLD)1. NAFLD
and its advanced form nonalcoholic steatohepatitis (NASH) are the most common etiologies of hepatic fibrosis
and represent a significant health b urden1. As the largest internal organ in the human body, the liver performs
many diverse functions that are essential for health, mainly carried out by hepatocytes, the parenchymal c ells2.
Liver non-parenchymal cells (NPCs) consisting of endothelial cells (ECs), hepatic stellate cells (HSCs), Kupffer
cells (KCs), lymphocytes and cholangiocytes support hepatocyte function. Depending on the etiology of liver
disease, HSCs and, to a lesser extent, portal fibroblasts and mesothelial cells (MCs) have long been closely linked
to driving the development of hepatic fi brosis3. Under healthy conditions, HSCs maintain plasticity and respond
to fluctuations in tissue p hysiology4. However, cytokines and growth factors secreted from adjacent or remote
cells can trigger the trans-differentiation of quiescent HSCs (qHSCs) into fibrogenic activated HSCs (aHSCs).
aHSCs produce excessive amounts of collagen and other extracellular matrix (ECM) components that impede
the exchange of molecules between hepatocytes and the blood5,6.
In view of this, attenuation of fibrosis represents a major therapeutic goal, where antifibrotic agents can either
inhibit fibrogenesis (ECM synthesis and deposition) or induce fibrolysis (removal of excessive ECM)7. Our
understanding of the mechanisms underlying NASH with fibrosis has advanced steadily in the past two decades.
Generally, anti-fibrotic therapies can be divided into agents that elicit anti-fibrotic effects by (1) hepatocyte
protection, (2) immune modulation, or (3) inhibition of HSC activation and fibrotic scar evolution8. However,
despite the enormous work and resources that have gone into the study of this disease and the fact that many
mechanisms of liver fibrosis have been described5,9, there are currently no drugs approved specifically for NASH
1
Novartis Institutes for BioMedical Research, 4056 Basel, Switzerland. 2Visceral Surgery and Medicine, Inselspital,
Bern University Hospital, Department for BioMedical Research, University of Bern, 3008 Bern, Switzerland. 3China
Novartis Institutes for BioMedical Research, Shanghai 201203, China. 4Present address: Rejuveron Life Sciences
AG, 8952 Schlieren, Switzerland. *email: zhongyi.wang@novartis.com; florian.nigsch@novartis.com
Scientific Reports | (2021) 11:19396 | https://doi.org/10.1038/s41598-021-98806-y 1
Vol.:(0123456789)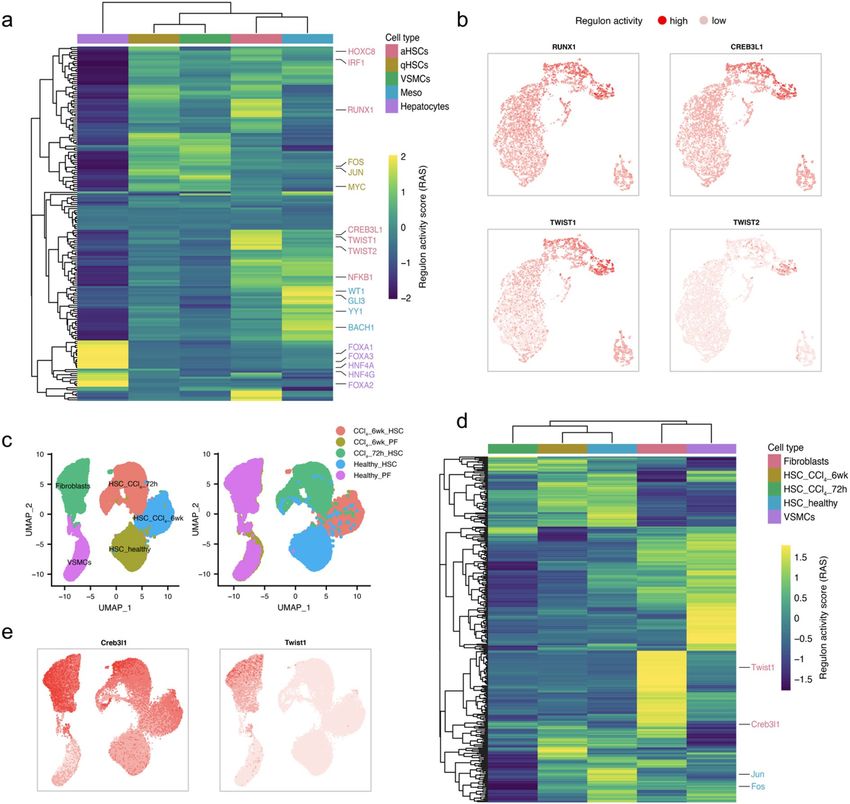
www.nature.com/scientificreports/

          Scientific Reports |   (2021) 11:19396 |   https://doi.org/10.1038/s41598-021-98806-y   2

Vol:.(1234567890)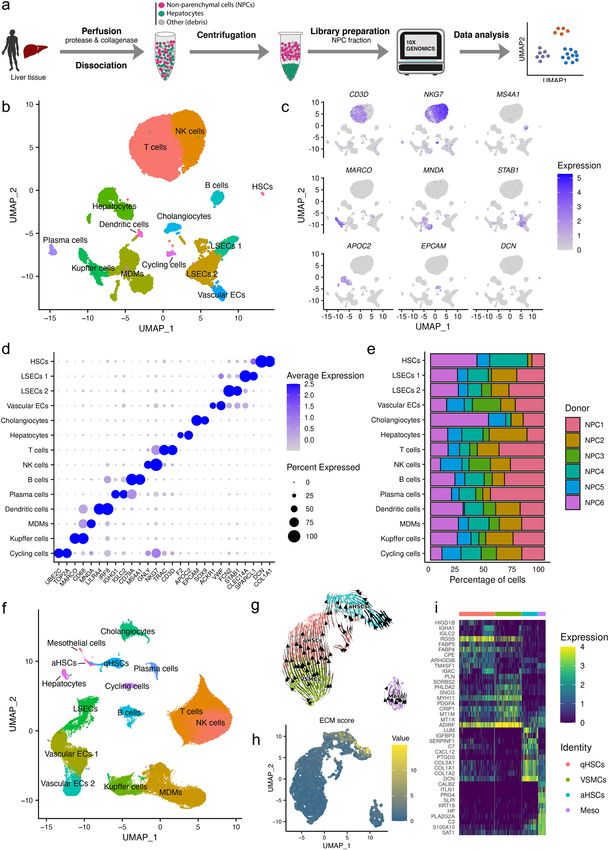
www.nature.com/scientificreports/
◂Figure 1. Generation of scRNA-seq data for human liver non-parenchymal cells. (a) Workflow of sample
preparation, sequencing and bioinformatic analysis. (b) UMAP visualization of single cells profiled in this study.
Each dot represents a cell that is color-coded by cell type. HSCs, hepatic stellate cells; LSECs, liver sinusoidal
endothelial cells; Vascular ECs, vascular endothelial cells; MDMs, monocyte-derived macrophages; NK
cells, natural killer cells. (c) Representative gene expression and distribution of known marker genes for each
population in UMAP plots. Normalized expression values are shown. (d) Dotplot displaying the top two marker
genes for each cell type identified. Size of the dot represents proportion of the cell population that expresses
each gene. Color indicates level of expression. (e) Barplot representing the relative contribution of cells from
each donor for each cell type. NPC, non-parenchymal cells derived from healthy liver. (f) UMAP visualization
of single cells profiled in this study together with human liver cells integrated from Ramachandran et al. (2019).
(g) UMAP visualization of mesenchymal cells. The direction of cell differentiation inferred from estimated RNA
velocities are plotted as streamlines on the UMAP. (h) UMAP visualization of mesenchymal cells. Cells colored
by ECM score. (i) Heatmap showing the top 10 differentially expressed genes for each mesenchymal cell type.
VSMCs, vascular smooth muscle cells; Meso, mesothelial cells.
and liver fibrosis. Initial attempts targeting aHSCs directly through inhibition of tyrosine kinase receptors (e.g.,
PDGFRα/β) or TGF-β receptors were abandoned because of likely adverse reactions due to pleiotropic expres-
sion of these r eceptors10. To date, very few efforts focusing on inhibiting fibrogenesis have advanced into clinical
trials. For example, simtuzumab, a humanized IgG4 anti-lysyl oxidase like 2 (LOXL2) monoclonal antibody was
discontinued after a phase 2 clinical trial in NASH patients with liver fibrosis (clinicaltrials.gov—NCT01672879).
Multiple factors may have contributed to this failure to clinically translate the overall positive preclinical results11.
Another approach to promote stellate cell apoptosis through a siRNA targeting heat shock protein 47 (HSP47),
a collagen 1 chaperone, was tested in phase 1 in patients with moderate to extensive fibrosis (clinicaltrials.gov—
NCT02227459). More studies on collagen inhibitors are expected to start in the next years8. Fibrolysis-inducing
strategies, including (1) upregulation of expression and/or activity of matrix metalloproteinases (MMPs) or
(2) downregulation of expression and/or activity of tissue inhibitors of MMPs (TIMPs), also have promise12.
However, no therapy that accelerates fibrolysis has reached clinical trials.
To achieve a broader understanding of fibrotic processes and deciphering the molecular mechanisms that
accompany NASH-associated fibrosis, many transcriptomic studies in model organisms and humans have been
performed13–18. Yet, these studies were largely restricted to sequencing RNA from mixed cell populations, heav-
ily biased towards hepatocytes, which likely vary dependent upon the stage of disease. Therefore, despite the
successful identification of many fibrosis-related genes and pathways5, these transcriptomic studies could not
differentiate the common fibrogenic changes experienced across all liver cells from those that may be cell-type
specific. Thus, cell-type specific gene expression studies of liver cell types from pathologic settings are crucial to
uncover cellular crosstalk during HSC activation and to provide new therapeutic avenues.
The power and utility of single-cell RNA-sequencing (scRNA-seq) for gene-expression analyses have been
shown in studies to identify previously unknown cell types and subtypes in normal and diseased liver19,20. To
date, scRNA-seq has been conducted on whole liver or NPCs from h umans21–24 and m ice25–30. However, thus far
only one human study has investigated hepatic injury in the context of cirrhosis22.
In this study, we isolated and profiled NPCs from healthy human livers, and integrated public scRNA-seq
data derived from fibrotic/cirrhotic human livers. We also generated time-course RNA-seq data for both thio-
acetamide (TAA) and bile duct ligation (BDL)-induced liver fibrosis rat models. Additionally, we reanalyzed
public transcriptomic data from in vivo and in vitro mouse models of liver fibrosis to determine the key genes
associated with HSC activation in liver fibrosis of different etiologies.
Results
Single‑cell profiling and unbiased clustering of human liver cells. To examine the heterogeneity
and dynamic crosstalk of liver NPCs, we generated scRNA-seq data for human liver using the 10× Genomics
Chromium platform. Since hepatocytes constitute approximately 60% of the cells in the liver2, to enrich for
NPCs we adopted a m ethod31 to remove hepatocytes prior to sequencing library preparation (Fig. 1a, “Meth-
ods”).
We isolated and profiled 17,810 cells from six healthy human livers. After removing low-quality cells, a total
of 15,299 cells (1449–4821 per sample) were retained for further analysis. A median of 1141 genes per cell was
detected. To identify cells with distinct lineage identities and transcriptional states, we performed unbiased
clustering on the cells using the Seurat R package32. NPCs were represented by a total of 13 distinct cell lineages
(Fig. 1b), which correspond to hepatic stellate cells (HSCs; COL1A1+DCN+), liver sinusoidal endothelial cells
(LSECs 1: zone 1, SPARCL1+CLEC14A+; LSECs 2: zone 2 and 3, STAB1+FCN2+), vascular ECs (VWF+ACKR1+),
cholangiocytes (SOX9+EPCAM+), T cells (CD3D+TRAC+), natural killer (NK) cells (NKG7+GNLY+), B cells
(MS4A1+CD79A+), plasma cells (IGLC2+IGHG1+), dendritic cells (IRF8+LILRA4+), monocyte-derived mac-
rophages (MDMs; CD68+MNDA+), Kupffer cells (CD68+MARCO+) and cycling cells (TOP2A+UBE2C+)
(Fig. 1c,d). Because hepatocytes were not fully removed during the centrifugation step, there was also a small
cluster of hepatocytes (APOC2+F2+) (Fig. 1b–d). All 14 cell types contained cells derived from each of the six
liver donors (Fig. 1e). We also further examined our cell type annotations with S ingleR33—a computational
framework that compares the transcriptomic profile of each single cell to reference datasets to determine cellular
identity (Supplementary Fig. 1).
Scientific Reports | (2021) 11:19396 | https://doi.org/10.1038/s41598-021-98806-y 3
Vol.:(0123456789)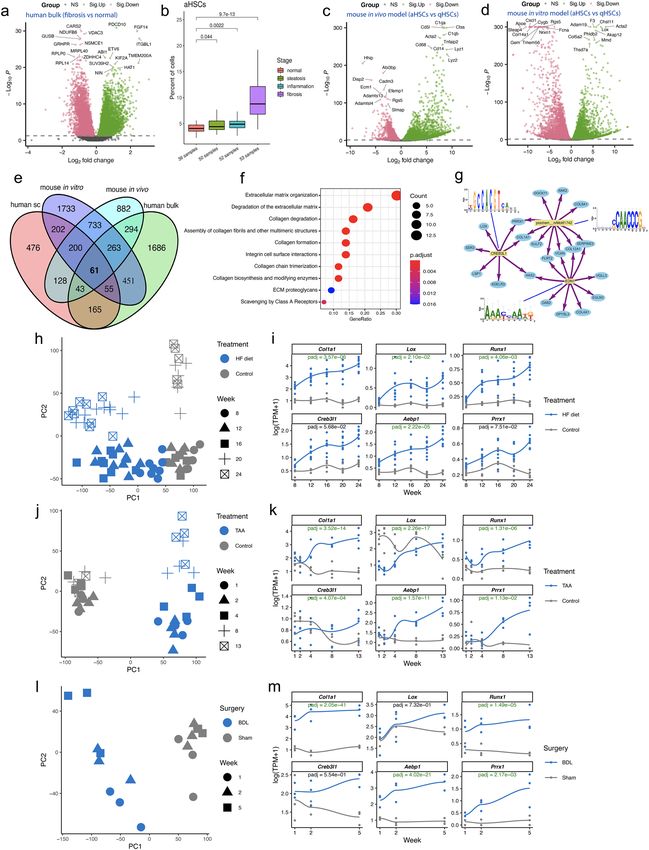
www.nature.com/scientificreports/
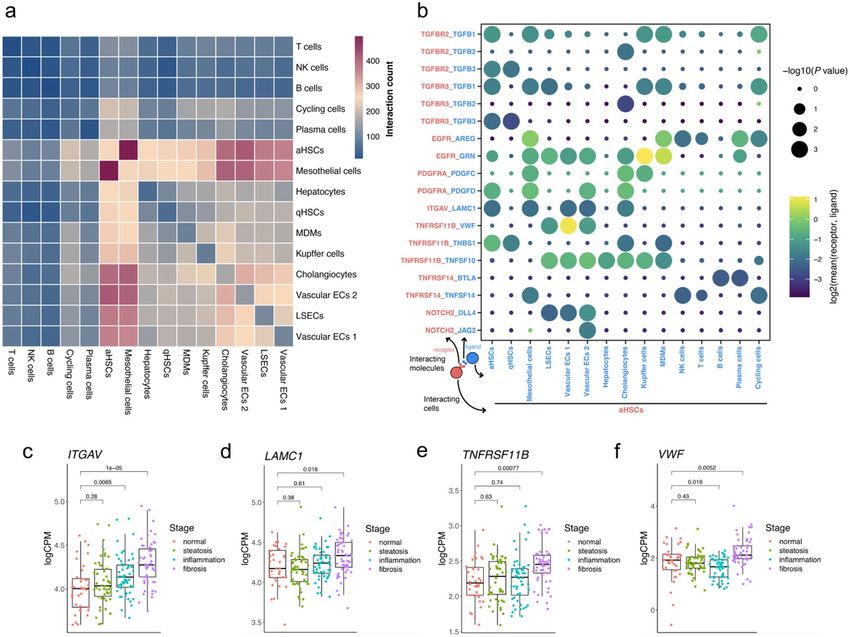
Figure 2. Intercellular communications in the sinusoidal signaling niche. (a) Heatmap showing the number
of potential ligand-receptor pairs between any two liver cell types predicted by CellphoneDB. (b) Dotplot
displaying putative ligand-receptor interactions between aHSCs and other cell types. Dot size represents
statistical significance of the indicated interactions. Dot color indicates the average expression level ( log2-
transformed) of the receptor from aHSCs and the ligand from another cell type. (c–f) Gene expression of
ITGAV, LAMC1, TNFRSF11B, and VWF at progressive disease stages. The RNA-seq data were downloaded
and reanalyzed from Gerhard et al. (2018). Mann–Whitney U tests (two-sided) were performed for statistical
comparisons. logCPM, log-transformed counts per million.
To gain insight into the activation of HSCs, we aggregated 157,619 cells from four healthy and importantly
ataset22. A total of 175,429 cells were then analyzed (“Methods”).
also three cirrhotic human livers of a public d
20 populations and 15 distinct cell lineages were subsequently identified (Fig. 1f, Supplementary Fig. 2).
Since in the current study the main focus is mesenchymal cells (also known as ECM-producing cells, includ-
ing HSCs, portal fibroblasts and perivascular cells), we carried out subclustering of these populations and per-
formed RNA velocity analysis (Fig. 1g, “Methods”). This analysis revealed that the robustness of developmental
trajectories from RGS5-expressing qHSCs to COL1A1-expressing aHSCs was supported. ECM scores, calculated
based on the expression values of co-expressed ECM-related genes (“Methods”), also demonstrated a clear shift
towards higher ECM expression in mesenchymal cells from the cirrhotic patient samples, with aHSCs exhibit-
ing the highest ECM expression (Fig. 1h). We then identified the marker genes for each cell type by performing
differential gene expression analysis (Fig. 1i). Among the most differentially expressed genes for aHSCs there
were well-known fibrosis markers, e.g., COL1A1, COL1A2, DCN and LUM.
Identification of liver fibrosis‑related intercellular communication. Cell–cell signaling is critical
in cell development, tissue homeostasis and disease d evelopment34. HSC activation is a process that is coordi-
nated by intercellular signaling effectors that modulate the activity of downstream gene regulatory networks5,6.
By leveraging the transcriptional profiles of each cell population, we built a comprehensive intercellular network
of potential ligand-receptor interactions between different cell types using C ellPhoneDB35 with curated known
35 36
ligand-receptor pairs from databases and literature (Fig. 2a). The number of potential interactions between
aHSCs and other cell types is significantly larger than that between qHSCs and other cell types (paired Student’s
t-test, P = 9.12e-7; Fig. 2a). We focused specifically on interactions that involve HSCs and used the interaction
pairs between qHSCs and other cells as references to pinpoint aHSC-specific interactions that may represent
Scientific Reports | (2021) 11:19396 | https://doi.org/10.1038/s41598-021-98806-y 4
Vol:.(1234567890)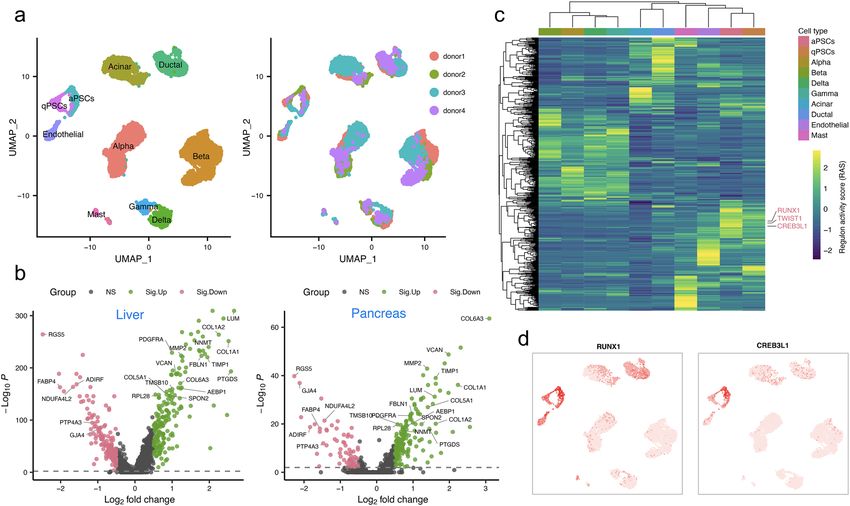
www.nature.com/scientificreports/
potential key mediators involved in the initiation or perpetuation of liver fibrosis. Figure 2b shows selected sig-
nificant (P < 0.05) ligand-receptor pairs that are specific to aHSCs.
The most significant specific interactions were predicted to happen in the sinusoidal signaling niche, where
HSCs are in close proximity to KCs/MDMs, LSECs and vascular ECs. The transforming growth factor (TGF)-β
signaling pathway is associated with liver fibrosis and HSC activation37 and was indeed present in our results
(Fig. 2b). Ligands potentially binding to epidermal growth factor receptor (EGFR) on aHSCs include amphiregu-
lin (AREG) and progranulin (GRN) (Fig. 2b). Robust expression of AREG in MDMs and other immune cells
raises the possibility of EGFR signaling. Consistently, the EGFR–AREG signaling axis has indeed been implicated
in HSC fibrogenic activity, and AREG was upregulated in murine and human NASH38. KCs and MDMs may
also activate HSCs by secreting GRN that modulates EGFR signaling, and GRN was shown to function as a HSC
survival signal by stimulating EGFR signaling through ephrin receptor A239. Erlotinib could attenuate EGFR
phosphorylation in HSCs and subsequently reduce the total number of aHSCs40. PDGFC secreted from KCs
and cholangiocytes could bind to the platelet-derived growth factor receptor α (PDGFRα) of HSCs and then
trigger the PDGF signaling pathway (Fig. 2b). This is in line with previous studies showing that PDGF signal-
ing pathway exerts persistent activation in response to a variety of stimuli and facilitates HSC activation and
fibrosis progression41. HSC activation may also be amplified through autocrine signaling (PDGFD–PDGFRα)
(Fig. 2b). Interestingly, PDGF-C and -D levels increased during the trans-differentiation of qHSCs into aHSCs
and persisted upon activation perpetuation, suggesting a role of these subunits in the late phase of fibrogenesis42.
Previous studies suggested that integrin-alpha V (ITGAV) may serve as a master driver of fibrosis in multi-
ple mouse organs43. Of the potential alpha subunits, only ITGAV has been shown to be critical for binding and
activating TGF-β, which plays a critical role in HSC a ctivation44. Laminin subunit gamma 1 (LAMC1) secreted
from neighboring cells could interact with ITGAV to trigger HSC activation (Fig. 2b), which is in agreement
with our observation of increased RNA expression for both genes from healthy to fibrotic livers (Fig. 2c,d). TNF
receptor superfamily member 11B (TNFRSF11B) on the surface of HSCs may be modulated by ligands including
von Willebrand factor (VWF), thrombospondin 1 (THBS1) and TNFSF10 that are secreted from ECs, epithelial
cells and KCs/MDMs (Fig. 2b). The TNFRSF11B–VWF signaling axis might serve as a novel interaction that
could play a role in HSC activation, and VWF deficiency has been demonstrated to attenuate chronic carbon
tetrachloride (CCl4)-induced liver fibrosis45. This is further bolstered by the gene expression comparisons of both
genes in healthy and fibrotic human livers (Fig. 2e,f). Furthermore, B- and T-lymphocyte attenuator (BTLA) and
TNFSF14 secreted by immune cells potentially interact with TNFRSF14, emphasizing the proinflammatory and
proliferative roles aHSCs may play at the site of injury (Fig. 2b). Consistent with the l iterature46, we also found
NOTCH signaling pathway to be involved in fibrogenesis, highlighting two potential interaction pairs between
NOTCH2 on aHSCs and ligands DLL4 and JAG2 expressed in ECs (Fig. 2b). A recent study showed that DLL4
knockdown alleviated LSEC capillarization and provided protection against C Cl4-induced fibrosis47.
Single‑cell regulatory network inference for liver mesenchymal cells. Gene regulatory networks
define and maintain cell-type specific identity, which in turn determines cellular function. For this analysis,
we specifically focused on the mesenchymal cells (Fig. 1g–i). To identify the master regulators for each cell, we
applied the SCENIC pipeline48. Briefly, SCENIC predicts the transcription factors (TFs) alongside their candi-
date target genes, which are jointly called regulons. Three major steps are involved, namely, co-expression analy-
sis, target gene motif enrichment analysis, and regulon activity evaluation. To examine whether this approach
is effective, we included hepatocytes as their core gene regulatory networks have been well-characterized49. The
analysis yielded cell-type specific regulons along with their respective regulon activity scores (RAS). The RAS
were then averaged across cells for each cell type. Importantly, the regulon activity dendrogram for the 176
significant regulons containing in total 11,920 target protein-coding genes in Fig. 3a matches well with the clus-
tering defined using all robustly expressed (18,771) protein-coding genes (Supplementary Fig. 3). It has indeed
been suggested to use cell type-specific core regulatory complexes (CoRC) to define cell types50. Consistent with
the literature49, SCENIC successfully identified known hepatocyte-specific regulators, including HNF4A/G and
FOXA1/2/3, as the top regulons for hepatocytes (Fig. 3a).
The success of this approach in identifying critical hepatocyte regulators allowed us to examinate aHSC-
specific regulons with confidence. Notably, we found that regulon RUNX1 was highly active in aHSCs but low
in qHSCs and other cell types (Fig. 3a,b), suggesting that it is a potential master regulator of HSC activation.
Indeed, Runx1 was suggested to play important roles in NASH-associated HSC activation in m ice17, and increased
expression of RUNX1 in human liver biopsies correlated with NASH activity score in patients with NASH51.
Interestingly, Runx1 was also identified as one of the top TFs in lipofibroblasts of fibrotic mouse lungs52.
CREB3L1, also known as OASIS, was identified as another potential master regulator of HSC activation
(Fig. 3a,b), as its predicted target genes include known liver fibrosis-associated genes such as COL1A1 and
LOX. This observation is in agreement with a previous finding that CREB3L1-deficient mice exhibited severe
osteopenia caused by a decrease in the expression of COL1A1 in the bone matrix53. Another study revealed that
inhibition of regulated intramembrane proteolysis of CREB3L1 could prevent excess deposition of collagen in
some fibrotic d iseases54. By leveraging a recent transcriptomic study on human N ASH13, we showed that the
expression of CREB3L1 increases as the disease progresses from healthy to fibrotic liver (Supplementary Fig. 4).
Reanalysis of a mouse single-cell d ataset25 showed specifically high activity in aHSCs for the Creb3l1 regulon
(Fig. 3c–e). In line with a recent study55, other aHSC-associated regulators (i.e., IRF1 and NFKB1) were also
observed in our results.
Furthermore, CREB3L1, HOXC8, TWIST1 and TWIST2 that were identified in this study are also among the
TFs that were shared in fibroblasts of different organ o rigins56 (Fig. 3a,b). While the involvement of HOXC8 in
fibrogenesis still remains unexplored, the role of TWIST1 in various fibrotic diseases has been gradually revealed
Scientific Reports | (2021) 11:19396 | https://doi.org/10.1038/s41598-021-98806-y 5
Vol.:(0123456789)www.nature.com/scientificreports/
Figure 3. Cell type-specific gene regulatory networks (regulons) of liver mesenchymal cells. (a) Heatmap of the
inferred regulons for human liver mesenchymal cells. (b) Regulon activity-based UMAP colored according to
the regulon activity of CREB3L1, RUNX1, TWIST1 and TWIST2 showing the cell type specificity of regulons.
(c) UMAP embedding of mouse liver mesenchymal cells from uninjured and fibrotic (up to 6 weeks of C Cl4
treatment) mouse livers retrieved from Dobie et al. (2019). Left, cells colored by cell type/state. Right, cells
colored by condition/cell origin. (d) Heatmap of the inferred regulons for mouse liver mesenchymal cells. (e)
Regulon activity-based UMAP colored by the regulon activity of Creb3l1 and Twist1 showing the cell type
specificity of regulons.
in recent years57. Activation of TWIST transcription by BRG1, a chromatin remodeling protein, was suggested to
contribute to liver fibrosis in mice and a TWIST1 inhibitor (harmine) exerted anti-fibrogenic effects58. Addition-
ally, we identified specific regulons for other cell types, for example FOS, JUN and MYC for qHSCs, BACH1,
GLI3, WT1 and YY1 for MCs (Fig. 3a). Two full lists of regulons and their scaled activity for each cell type can
be found in Supplementary Tables 1 and 2, for human and mouse, respectively.
Comparison of stellate cells between liver and pancreas. Pancreatic stellate cells (PSCs) share many
morphological and functional characteristics with HSCs; they are thus presumed to share a common o rigin59.
Despite the established role of stellate cells in fibrogenesis, there is currently still a lack of genomic comparison
between stellate cells from liver and pancreas. A microarray-based transcriptomic analysis comparing HSCs to
PSCs revealed that these cells are highly s imilar60. This analysis, however, appeared to be rather limited. scRNA-
seq enables the comparison between HSCs and PSCs at unprecedented resolution to uncover overlapping and
distinct gene expression features. To this end, we retrieved and reanalyzed a public human pancreas scRNA-seq
dataset61, and identified two clusters that correspond to quiescent and activated PSCs (Fig. 4a). We next com-
pared the up- and down-regulated genes in aHSCs and aPSCs (Fig. 4b). Many signature genes were common
Scientific Reports | (2021) 11:19396 | https://doi.org/10.1038/s41598-021-98806-y 6
Vol:.(1234567890)www.nature.com/scientificreports/
Figure 4. Comparison of expression patterns between hepatic and pancreatic stellate cells. (a) UMAP
embedding of human pancreatic cells retrieved from Baron et al. (2016). Left, cells colored by cell type.
Right, cells colored by donor. qPSCs, quiescent PSCs; aPSCs, activated PSCs. (b) Volcano plot of differential
gene expression analysis between activated and quiescent stellate cells for liver (left) and pancreas (right).
Significantly upregulated (Sig.Up) and downregulated (Sig.Down) genes in activated stellate cells are shown
in green and pink, respectively. 16 and 6 genes shared among the top 50 up- or down-regulated genes between
liver and pancreas are labelled, respectively. (c) Heatmap of the inferred regulons for human pancreatic cells. (d)
Regulon activity based UMAP colored according to the regulon activity of CREB3L1 and RUNX1 showing the
cell type specificity of regulons.
for stellate cells in both organs, for example RGS5, FABP4 and ADIRF for quiescent stellate cells and AEBP1,
COL1A1, COL1A2, LUM, TIMP1 and VCAN for activated stellate cells (Fig. 4b).
Another question of interest is whether cells of the same type from different organs may share gene regula-
tory circuitries. To this end, we also performed the SCENIC analysis on all pancreatic cells. Indeed, we found
that the stellate cells from both organs share certain regulon activities (Fig. 4c). Consistent with the findings for
aHSCs, the regulon activities of RUNX1, CREB3L1 and TWIST1 were significantly higher in aPSCs in com-
parison to qPSCs (Fig. 4c,d). A full list of regulons and their scaled activity for each cell type can be found in
Supplementary Table 3.
Evaluating translatability of liver fibrosis‑associated genes. We next sought to explore our find-
ings with a focus on translatability. The need for effective and safe therapy has spurred the development of
in vitro and in vivo models to study the relevance of specific genes for the development and progression of NASH
and to evaluate potential therapeutic agents prior to human studies7,62. By leveraging bulk RNA-seq data of
NASH patient livers and rodent models for liver fibrosis of diverse etiologies, we were able to evaluate the trans-
latability of candidate therapeutic targets for NASH with fibrosis. An analysis of a human NASH-related RNA-
seq dataset13 confirmed that many of the aHSC-specific genes were indeed upregulated in fibrotic compared to
healthy livers (Fig. 5a). Consistent with this finding, computational deconvolution of this dataset showed an
upward trend in the proportion of aHSCs over the course of disease development (Fig. 5b). Next, to evaluate
the translatability of potential novel therapeutic targets that were identified based on human data, we integrated
public RNA-seq datasets from mouse models of C Cl4-induced fibrosis and in vitro HSC a ctivation17. For the
in vivo mouse model, qHSCs and aHSCs were sorted separately from healthy and fibrotic livers after 8 weeks of
CCl4 treatment. For the in vitro mouse model, healthy liver-derived primary qHSCs were cultured and activated
on plastic for 12 days. Differential gene expression analyses between aHSCs and qHSCs were subsequently car-
ried out (Fig. 5c,d). In total, we identified 61 significantly upregulated and 13 downregulated genes that behave
similarly in human aHSCs and fibrotic liver tissues, as well as in mouse aHSCs from in vivo and in vitro models
of liver fibrosis (Fig. 5e, Supplementary Tables 4 and 5).
Scientific Reports | (2021) 11:19396 | https://doi.org/10.1038/s41598-021-98806-y 7
Vol.:(0123456789)www.nature.com/scientificreports/
Scientific Reports | (2021) 11:19396 | https://doi.org/10.1038/s41598-021-98806-y 8
Vol:.(1234567890)www.nature.com/scientificreports/
◂Figure 5. Meta-analysis of existing RNA-sequencing data sets for NASH and liver fibrosis. (a) Differential
gene expression analysis between fibrotic and healthy (as reference) livers. Only the top 10 up- or down-
regulated genes are labelled with gene symbols. Significantly upregulated (Sig.Up) and downregulated (Sig.
Down) genes are shown in green and pink, respectively. (b) Computational deconvolution of bulk RNA-seq
data of 191 human liver samples (normal, 36; steatosis, 50; inflammation, 52; fibrosis, 53). The RNA-seq data
were retrieved from Gerhard et al. (2018). Mann–Whitney U tests (two-sided) were performed for statistical
pairwise comparisons. (c) Differential gene expression analysis between aHSCs and qHSCs (as reference)
isolated from healthy and fibrotic ( CCl4) mouse livers. The RNA-seq data were retrieved from Marcher et al.
(2019). Significantly upregulated (Sig.Up) and downregulated (Sig.Down) genes are shown in green and pink,
respectively. Only the top 10 up- or down-regulated genes are labelled with gene symbols. (d) Differential gene
expression analysis between aHSCs and qHSCs (as reference). Healthy liver-derived qHSCs were activated on
plastic in vitro. The RNA-seq data were retrieved from Marcher et al. (2019). Significantly upregulated (Sig.Up)
and downregulated (Sig.Down) genes are shown in green and pink, respectively. Only the top 10 up- or down-
regulated genes are labelled with gene symbols. (e) Venn diagram showing all possible logical relations between
three sets of up-regulated genes in aHSCs compared with qHSCs, and a set of up-regulated genes in bulk human
fibrotic livers in comparison to healthy controls. Only the 15,252 protein-coding one-to-one orthologs for
human, mouse, and rat were considered in this analysis (Supplementary Table 6). (f) Functional enrichment
analysis for the 61 shared upregulated genes. (g) Regulatory gene network of the top three regulators (motifs)
and their corresponding target genes among the 61 genes. (h–m) Contextualization of candidate therapeutic
targets for liver fibrosis with time-course RNA-seq data. (h,i) High-fat (HF) diet-induced NASH mouse model;
(j,k) Thioacetamide (TAA)-induced liver fibrosis rat model; (l,m) Bile duct ligation (BDL)-induced liver fibrosis
rat model. Left, PCA of the samples studied. Right, expression levels of the genes of interest. TPM, transcripts
per million. Adjusted p-values < 0.05 are colored in green.
We then focused specifically on the 61 significantly upregulated genes. Functional enrichment analysis
revealed pathways where the 61 genes were overrepresented, with the top 10 most enriched pathways including
those related to ECM organization, collagen formation and degradation, and integrin cell surface interactions
(Fig. 5f). Together, this highlights the central roles of ECM and integrins in the development of liver fibrosis,
regardless of the etiological origin of the disease. A gene regulatory network was also built for the 61 DEGs to
better understand potential coregulation by master TFs responsible for the development of fibrosis. Target genes,
the top three motifs and corresponding TFs (if information available) are shown in Fig. 5g. Consistent with the
above regulon results, CREB3L1 is again identified as a master regulator of liver fibrosis-related genes.
We next examined individual genes. Many of these genes, including COL1A1, LOX, MMP14, TGFB3, TIMP1
and VCAN, are known markers for liver fibrosis. Other genes such as AEBP1, PRRX1 and LARP6 have also been
implicated in liver fibrogenesis and could serve as potential drug targets for NASH with fibrosis. Noteworthily,
AEBP1 and PRRX1 are the only two TF genes among the 61 genes. The expression of AEBP1 was significantly
elevated in fibrotic human liver compared to that with lobular inflammation, steatosis, and healthy liver, and
increased with worsening fibrosis in NASH p atients63. AEBP1 is also among the most significantly upregulated
genes in aPSCs compared with qPSCs (Fig. 4b). Interestingly, Aebp1 was specifically expressed in the Col14a1-
producing subpopulation of myofibroblasts in murine fibrotic lungs52. Using rodent models of liver fibrosis,
a previous study uncovered a critical role of Prrx1 in PDGF-dependent HSC migration, and an adenoviral-
mediated Prrx1 short hairpin RNA (shRNA) administration reduced thioacetamide (TAA)-and CCl4-induced
liver fibrosis64. Consistently, PRRX1 was recently identified to be involved in idiopathic pulmonary fibrosis, and
inhibition of PRRX1 activity was sufficient to alleviate the development of pulmonary fi brosis65. As fibrosis is
characterized by excessive accumulation of type I collagen, binding of LARP6 to the 5’ stem-loop structure of
collagen mRNAs is a crucial step for collagen t ranslation66. This makes LARP6 a promising target for liver fibro-
sis, and a recent high throughput screen has yielded a compound (C9) that represents the first LARP6 inhibitor
with significant antifibrotic activity67.
To further explore those genes that we have shown to be involved in liver fibrosis-associated pathways and
gene regulatory circuitries, we leveraged a mouse time-course dataset of high fat (HF) diet-induced NASH16.
Additionally, we generated time-course RNA-seq data for rat models of TAA- and BDL-induced liver fibrosis.
Consistently, the expression of two well-known liver fibrosis-associated genes (e.g., Col1a1 and Lox) among
the 61 shared liver fibrosis-related genes and four TF genes of interest (e.g., Runx1, Creb3l1, Aebp1 and Prrx1)
showed an upward trend as disease worsens across all three rodent models (Fig. 5h–m), further confirming their
translatability across human, mouse and rat for future drug discovery endeavors.
Discussion
Fibrosis is a common sequela following organ injury, and HSC activation plays a pivotal role in liver fibrogenesis
of different etiologies. Although activated HSCs represent an attractive target for antifibrotic therapy, the molecu-
lar mechanisms underlying the activation of HSCs remain poorly characterized. In this study, we performed
scRNA-seq to determine the transcriptional dynamics of non-parenchymal cells of healthy human livers, and a
subsequent integrative analysis of publicly available scRNA-seq data of fibrotic/cirrhotic livers enabled a deep
dive into the mesenchyme, and HSCs in particular.
RNA velocity analysis revealed a clear cell state transition from RGS5-expressing HSCs to myofibroblast-like
aHSCs that express ECM proteins and profibrotic mediators. Our analyses subsequently uncovered underlying
cell–cell interactions and master regulons that potentially drive the activation of HSCs. Immune cells, epithelial
cells (i.e., hepatocytes and cholangiocytes) and endothelial cells that dwell within the fibrotic niche communicate
Scientific Reports | (2021) 11:19396 | https://doi.org/10.1038/s41598-021-98806-y 9
Vol.:(0123456789)www.nature.com/scientificreports/
via secreting ligands that can potentially bind to specific cell surface receptors of HSCs to trigger the downstream
signaling pathways that lead to the expression of liver fibrosis-associated genes. We highlighted three barely-
characterized or entirely novel interactions (ITGAV–LAMC1, TNFRSF11B–VWF and NOTCH2–DLL4) that
could lead to HSC activation or proliferation. For example, apart from our finding of an increased expression
of both TNFRSF11B and VWF in fibrotic versus healthy livers (Fig. 2e,f), VWF deficiency was also previously
demonstrated to attenuate chronic CCl4-induced liver fibrosis45. This suggests that inhibition of VWF may be
a clinically useful anti-fibrotic therapy resulting from a decrease in TNFRSF11B–VWF signaling. Our further
analysis also revealed regulons that are potentially responsible for HSC activation in both humans and mice, such
as CREB3L1 and TWIST1. The comparison of hepatic and pancreatic stellate cells points to shared regulatory
mechanisms across different organs, thereby providing novel avenues for therapeutic target selection: among
the liver fibrosis-associated regulons CREB3L1 was shared not only between species (i.e., human and mouse)
but also between human organs (i.e., liver and pancreas).
Animal models are indispensable tools to study the cellular and molecular mechanisms of liver fibrosis and
to develop specific antifibrotic therapies towards clinical translation. In order to examine the translatability of
potential therapeutic targets, we systematically integrated multiple public or in-house human, mouse and rat
datasets, each pertaining to liver fibrosis of a different etiology. A total of 61 significantly upregulated genes in
aHSCs were identified specific to liver fibrosis independent of etiology. Our analysis prioritized LARP6, AEBP1
and PRRX1 because they have been linked to liver fibrogenesis. Pathway enrichment analysis of the 61 genes
revealed that, despite the diverse causative factors of liver fibrosis, ECM organization and integrin cell surface
interactions are the canonical and common pathological pathways involved in liver fibrosis. Gene regulatory net-
work analysis of the 61 genes allowed the identification of CREB3L1 as a master regulator for fibrosis-associated
genes. Overall, this suggests that CREB3L1 might be a promising novel drug target for liver fibrosis, with estab-
lished translatability in key rodent models, and modulation of it is likely to result in effective anti-fibrotic activity.
TFs have historically been viewed as ‘undruggable’ due to their pleiotropic actions in multiple cell types and
lack of defined ligandable p ockets68. Thanks to recent advances in structural characterization and ligand design
strategies, TFs have been directly targeted by multiple enticing modalities including, for example, small-molecule
protein–protein interaction inhibitors and targeted protein degradation68. CREB3L1 belongs to the CREB (cAMP
response element binding protein) family. Vannam et al.69 recently reported the design and characterization of
dCBP-1, a potent and selective heterobifunctional degrader of the CREB-binding protein (CBP) that is involved
in the transcriptional coactivation of multiple TFs including CREB3L1.
Taken together, our findings provide potential targets for the treatment of NASH with fibrosis and helpful
clues for better understanding the molecular underpinnings of liver fibrosis onset and progression. Our analysis
also sheds light on the common fibrotic gene signatures across human and rodents, and also between human
organs, which demonstrate high translatability for further investigation.
Methods
Liver tissue collection and sequencing of liver non‑parenchymal cells. Physiologically normal
human liver tissues were collected from the periphery of liver specimens from donors undergoing surgical resec-
tion. In all of these cases, the resections were done in a generous way in order to ascertain removal of all affected
tissue. Of the six patients whose tissue we used, three underwent surgery for liver metastasis of rectal adenocar-
cinoma, and there was one patient each for hepatocellular adenocarcinoma (inflammatory type), hepatolithiasis,
and liver hemangioma. All tissue resections were inspected by experts both macroscopically and microscopically
to identify the “most healthy” parts, i.e., most distal of any potential lesions. Overall, through the combina-
tion of careful histopathological assessment and comparisons to for example data derived from hepatocellular
carcinoma, we are confident that our “healthy” tissue is as good a proxy for healthy tissue as is realistically and
ethically achievable. Informed consent of the patients was obtained in accordance with institutional guidelines
and the local ethics committee in Bern, Switzerland. This study was approved by the regional ethics committee
in Basel, Switzerland (Ethikkommission Nordwest- und Zentralschweiz; #2015-391 PB_2017-00323).
Liver tissue was stored at 4 °C and processed within 3 h post resection. Liver non-parenchymal cells (NPCs)
were isolated following a two-step protocol of collagenase/EDTA digestion70. Briefly, hepatocytes were removed
by centrifuging the whole digestion at 50 g for 5 min (pellet removed—hepatocyte fraction, cleaned on Per-
coll), and the supernatant removed and spun again at 50 g for 5 min to remove the remaining hepatocytes, the
supernatant was then pelleted at 300 g for 8 min and used as NPC fraction for downstream sequencing library
preparation. Cell viability of the isolated NPCs was estimated by trypan blue exclusion. Samples of 67–89%
viable cells from each of the liver samples were subjected to single-cell RNA sequencing using the 10× Genomics
Chromium Single Cell 3’ Library & Gel Bead Kit v2 following the manufacturer’s instructions. Approximately
4000 cells were targeted for each sample recovery. Libraries were sequenced on the Illumina HiSeq2500 machine
using paired-end sequencing runs.
Generation of bulk RNA‑seq data for both BDL and TAA‑induced liver fibrosis rat models. All
in vivo animal studies were reviewed and approved by the Institutional Animal Care and Use Committee
(IACUC) of Novartis Institutes for BioMedical Research in Shanghai, China (approval #2013-05-01 (BDL
model); #2016-03-08 (TAA model)). All experiments were performed in accordance with the relevant guidelines
and regulations and in compliance with the ARRIVE guidelines.
To induce hepatic fibrosis, male Sprague Dawley rats (9–12 weeks of age and 380–420 g of weight upon
arrival, supplied by Beijing Vital River laboratory animal Co., Ltd.) either underwent surgery of bile duct ligation
(BDL) or were treated with thioacetamide (TAA). In the BDL model, the bile ducts of Sprague Dawley rats were
ligated after 12 h of fasting and water deprivation. Rat liver samples were collected from three groups of rats at
Scientific Reports | (2021) 11:19396 | https://doi.org/10.1038/s41598-021-98806-y 10
Vol:.(1234567890)www.nature.com/scientificreports/
week 1, 2 and 5 after BDL surgery. Three control groups of rats underwent sham operation, including bile duct
mobilization, but without BDL. Three biological replicates were used for each group. In the TAA model, rat liver
samples were collected from five groups of rats at week 1, 2, 4, 8 and 13 after TAA (300 mg/kg) administration
three times per week while five control groups received the same volume of 0.9% normal saline. Four biological
replicates were used for each group.
Frozen rat liver tissue (~ 2 mm cube) was lysed and homogenized using Trizol reagent in a Qiagen Tissue-
Lyser II. After phase separation of the homogenate, the upper aqueous phase was subject to total RNA purifica-
tion using Qiagen RNeasy Mini spin column with extensive on-column DNase I digestion. Purified total RNA
samples were analyzed by Agilent Bioanalyzer RNA 6000 Nano assay and quantified by Qubit RNA assay. For
construction of sequencing libraries, 1 ug of total RNA (RIN > 8) was subjected to Illumina TruSeq Stranded
Total RNA Sample Prep kit with Ribo-Zero Gold. Libraries were analyzed by Bioanalyzer High Sensitivity DNA
assay and quantified by Qubit DNA assay. Sequencing was performed by Illumina NextSeq 500 or HiSeq 1500.
Single‑cell RNA‑seq data analysis. Library demultiplexing, fastq file generation, read alignment and
unique molecular identifier (UMI) quantification were performed using the Cell Ranger Single Cell Software
Suite v3.1.0 (10× Genomics, Inc.) against the 10× Genomics pre-built GRCh38.93 human reference genome.
Data processing and visualization were performed with the Seurat package v3.1.532 in R v3.6.1 (R Core Team,
2019). The initial dataset contained 175,429 cells, namely, 17,810 cells that we profiled and 157,619 cells obtained
from a public d ataset22 for 33,538 genes. Since in our study we revolve around all liver non-parenchymal cells
with a focus on hepatic stellate cells, for the public dataset we only included the seven donors with both leu-
cocytes (CD45+) and other non-parenchymal cells (CD45−) profiled. Outlier cells were excluded from the
downstream analyses using the isOutlier function from the scater R package. Moving along, we only kept genes
expressed in at least 10 cells and cells with at least 200 genes expressed. Raw UMI counts were log-normalized
and then 2000 highly variable genes were identified with the Seurat function FindVariableFeatures. Scaling was
performed to regress out confounders, i.e., total UMI count, percent of mitochondrial reads and cell cycle score.
Next, principal component analysis was performed using the variable genes for dimensionality reduction using
the Seurat function RunPCA. Clusters were identified with the Seurat function FindClusters using the shared
nearest neighbor modularity optimization based on the first 12 PCs with a clustering resolution set to 0.4. This
method resulted in 20 initial clusters. Of the parameters we tried, most produced a similar UMAP clustering, but
12 PCs generated the best separation between different cell types. For each cell type, marker genes were identi-
fied using the Seurat function FindAllMarkers with the Wilcoxon rank-sum test. The FindAllMarkers function
was also used to identify differentially expressed genes in activated HSCs compared with quiescent HSCs, and
also in activated PSCs compared with quiescent PSCs. Scaled expression data for marker genes were used to
create the heatmap.
Automated annotation of cells with SingleR. We compared our manual annotations of clusters based
on known cell-type-specific marker genes to that produced through automated classification using SingleR33,
which leverages reference transcriptomic datasets (Human Primary Cell Atlas, in the case of our study) of pure
cell types to infer the cell of origin of each of the single cells independently.
ECM score calculation. The extracellular matrix (ECM) score for each mesenchymal cell was calculated
escribed71.
based on the normalized expression values of matrisome genes using the method as previously d
Intercellular communication analysis with CellPhoneDB. To infer ligand-receptor interactions pre-
sent within the liver, we applied CellPhoneDB (v2.1.4), which determines cellular crosstalk based on significant
enrichment of reciprocal expression of ligands and receptors between annotated cell populations35. In brief, we
derived potential ligand-receptor interactions on the basis of the expression of a receptor by one cell population
and a ligand by another; as input to this algorithm, we used all cells, and we considered only ligands and recep-
tors expressed in more than 5% of the cells in any given cell population. Cell population-specific interactions
were identified as follows: (1) randomly permuting the cluster labels of all cells 1,000 times and determining the
mean of the average receptor expression of a cell population and the average ligand expression of the interacting
cell population, thus generating a null distribution for each ligand-receptor pair in each pairwise comparison
between cell populations; (2) calculating the proportion of these means that were ‘as or more extreme’ than the
actual mean, thus obtaining a P value for the likelihood of cell population specificity for a given ligand-receptor
pair; (3) prioritizing interactions that displayed specificity to cell populations interacting within the liver.
Gene regulatory network (regulon) analysis. SCENIC is a computational tool that infers regulons
by analyzing the co-expression of transcription factors and their putative target genes characterized by enrich-
ment of corresponding transcription factor-binding motifs in their regulatory regions48. Regulatory network
and regulon activity analysis were conducted on the mouse (mm10) and human (hg38) datasets separately
using pySCENIC (v0.10.2) with default parameters. Normalized log counts were used as input to identify co-
expression modules by the GRNBoost2 algorithm. Following which, regulons were derived by identifying the
direct-binding TF target genes while pruning others based on motif enrichment around transcription start site
(TSS) with cisTarget databases. Using aucell, the regulon activity score (RAS) was measured as the area under
the recovery curve (AUC). Scaled cell type-averaged RAS > 0.7 was regarded as significant. Overall, we identified
176, 340 and 532 active regulons for human mesenchymal cells, mouse mesenchymal cells and human pancre-
atic cells, respectively.
Scientific Reports | (2021) 11:19396 | https://doi.org/10.1038/s41598-021-98806-y 11
Vol.:(0123456789)www.nature.com/scientificreports/
RNA velocity analysis. RNA velocity analysis was performed as previously described using the velocyto.
py python package for annotating transcripts as spliced or unspliced72, followed by the scVelo pipeline (v0.2.2)73.
Briefly, transcripts are marked as either spliced or unspliced based on the presence or absence of intronic regions
in the transcript. For each gene, a simple model of RNA dynamics is then fit to the data. Finally, the RNA velocity
is estimated for each cell by looking for over- or underrepresentation of spliced to unspliced ratios. RNA velocity
is visualized on a UMAP plot, with vector fields representing the averaged velocity of nearby cells.
Bulk RNA‑seq data analysis. The exon quantification pipeline (EQP)74, a tool based on Bowtie 2.0, was
used to generate count-based gene expression estimates, determined by an alignment of the reads to the human
genome (GRCh38.p10, Ensembl 90, August 2017). Depending on the context, either CPM (counts per million)
or TPM (transcripts per million) was calculated to represent gene expression levels. Differential gene expression
analysis was performed using the DESeq2 R package (v1.22.2)75 in R (v3.6.1) with design =∼ Condition for
pairwise differential expression analysis, and full_model =∼ Condition + Timepoint + Condition : Timepoint
and reduced_model =∼ Condition + Timepoint for time-course differential expression analysis. P-values for
each gene were adjusted using the p.adjust() function in R with the Benjamini–Hochberg method. Genes with
an adjusted P < 0.05 were deemed to be significant.
Deconvolution of publicly available human NASH bulk RNA‑seq data. Computational decon-
uSiC76 with the following parameters: iter.max = 1000,
volution of bulk RNA-seq data was performed using M
nu = 1e-10, eps = 0.01, and normalize = F.
Orthologous gene sets. To evaluate the translatability of potential therapeutic targets across species,
only genes with a one-to-one orthologous relationship across the species investigated (i.e., human, mouse and
rat) were considered. All possible homolog pairs between human, mouse and rat were first downloaded from
Ensembl release 93 via BioMart. We then only kept 15,252 genes with a one-to-one correspondence between any
species pairs (Supplementary Table 6).
Pathway enrichment analysis for differentially expressed genes. The clusterProfiler77 and
ReactomePA78 R packages were used to perform Reactome pathway enrichment analysis for the 61 liver fibrosis-
specific genes independent of causative factors. Fisher’s exact test followed by the Benjamini–Hochberg correc-
tion was performed for statistical analysis, and an adjusted P < 0.05 was set as the cutoff criterion.
Data availability
Single-cell RNA-seq data of human liver are available from the ArrayExpress database under Accession Number
E-MTAB-10553. Bulk RNA-seq data of thioacetamide (TAA)- and bile duct ligation (BDL)-induced liver fibrosis
rat models can be accessed with ArrayExpress Accession Numbers E-MTAB-10547 and E-MTAB-10546, respec-
tively. Publicly available human liver and human pancreas scRNA-seq datasets were obtained from the GEO
database [GSE136103 and GSE84133]. Publicly available human NASH bulk RNA-seq data were retrieved from
the NCBI Bioproject database under Accession PRJNA512027. Publicly available single-cell and bulk RNA-seq
data of liver fibrosis mouse models were downloaded from the GEO database [GSE137720 and GSE116987].
Code availability
No new algorithms were developed for this manuscript. R scripts enabling the main steps of the analysis are
available from the authors upon request.
Received: 15 June 2021; Accepted: 15 September 2021
References
1. Cotter, T. G. & Rinella, M. Nonalcoholic fatty liver disease 2020: the state of the disease. Gastroenterology 158, 1851–1864. https://
doi.org/10.1053/j.gastro.2020.01.052 (2020).
2. Ben-Moshe, S. & Itzkovitz, S. Spatial heterogeneity in the mammalian liver. Nat. Rev. Gastroenterol. Hepatol. 16, 395–410. https://
doi.org/10.1038/s41575-019-0134-x (2019).
3. Kisseleva, T. The origin of fibrogenic myofibroblasts in fibrotic liver. Hepatology 65, 1039–1043. https://doi.org/10.1002/hep.28948
(2017).
4. Birbrair, A. Pericyte Biology in Different Organs (Springer, 2019).
5. Tsuchida, T. & Friedman, S. L. Mechanisms of hepatic stellate cell activation. Nat. Rev. Gastroenterol. Hepatol. 14, 397–411. https://
doi.org/10.1038/nrgastro.2017.38 (2017).
6. Schwabe, R. F., Tabas, I. & Pajvani, U. B. Mechanisms of fibrosis development in nonalcoholic steatohepatitis. Gastroenterology
158, 1913–1928. https://doi.org/10.1053/j.gastro.2019.11.311 (2020).
7. Friedman, S. L., Neuschwander-Tetri, B. A., Rinella, M. & Sanyal, A. J. Mechanisms of NAFLD development and therapeutic
strategies. Nat. Med. 24, 908–922. https://doi.org/10.1038/s41591-018-0104-9 (2018).
8. Roehlen, N., Crouchet, E. & Baumert, T. F. Liver fibrosis: mechanistic concepts and therapeutic perspectives. Cells 9, 875. https://
doi.org/10.3390/cells9040875 (2020).
9. Kisseleva, T. & Brenner, D. Molecular and cellular mechanisms of liver fibrosis and its regression. Nat. Rev. Gastroenterol. Hepatol.
18, 151–166. https://doi.org/10.1038/s41575-020-00372-7 (2021).
10. Frangogiannis, N. Transforming growth factor-beta in tissue fibrosis. J. Exp. Med. 217, e20190103. https://doi.org/10.1084/jem.
20190103 (2020).
11. Klepfish, M. et al. LOXL2 inhibition paves the way for macrophage-mediated collagen degradation in liver fibrosis. Front. Immunol.
11, 480. https://doi.org/10.3389/fimmu.2020.00480 (2020).
Scientific Reports | (2021) 11:19396 | https://doi.org/10.1038/s41598-021-98806-y 12
Vol:.(1234567890)www.nature.com/scientificreports/
12. Afratis, N. A., Selman, M., Pardo, A. & Sagi, I. Emerging insights into the role of matrix metalloproteases as therapeutic targets in
fibrosis. Matrix Biol. 68–69, 167–179. https://doi.org/10.1016/j.matbio.2018.02.007 (2018).
13. Gerhard, G. S. et al. Transcriptomic profiling of obesity-related nonalcoholic steatohepatitis reveals a core set of fibrosis-specific
genes. J. Endocr. Soc. 2, 710–726. https://doi.org/10.1210/js.2018-00122 (2018).
14. Hoang, S. A. et al. Gene expression predicts histological severity and reveals distinct molecular profiles of nonalcoholic fatty liver
disease. Sci. Rep. 9, 12541. https://doi.org/10.1038/s41598-019-48746-5 (2019).
15. Suppli, M. P. et al. Hepatic transcriptome signatures in patients with varying degrees of nonalcoholic fatty liver disease compared
with healthy normal-weight individuals. Am. J. Physiol. Gastrointest. Liver Physiol. 316, G462–G472. https://doi.org/10.1152/ajpgi.
00358.2018 (2019).
16. Gapp, B. et al. Farnesoid X receptor agonism, acetyl-coenzyme a carboxylase inhibition, and back translation of clinically observed
endpoints of de novo lipogenesis in a murine NASH model. Hepatol. Commun. 4, 109–125. https://doi.org/10.1002/hep4.1443
(2020).
17. Marcher, A. B. et al. Transcriptional regulation of Hepatic Stellate Cell activation in NASH. Sci. Rep. 9, 2324. https://doi.org/10.
1038/s41598-019-39112-6 (2019).
18. Govaere, O. et al. Transcriptomic profiling across the nonalcoholic fatty liver disease spectrum reveals gene signatures for steato-
hepatitis and fibrosis. Sci. Transl. Med. 12, eaba4448. https://doi.org/10.1126/scitranslmed.aba4448 (2020).
19. Saviano, A., Henderson, N. C. & Baumert, T. F. Single-cell genomics and spatial transcriptomics: Discovery of novel cell states and
cellular interactions in liver physiology and disease biology. J. Hepatol. 73, 1219–1230. https://doi.org/10.1016/j.jhep.2020.06.004
(2020).
20. Xiong, X., Kuang, H., Liu, T. & Lin, J. D. A single-cell perspective of the mammalian liver in health and disease. Hepatology 71,
1467–1473. https://doi.org/10.1002/hep.31149 (2020).
21. MacParland, S. A. et al. Single cell RNA sequencing of human liver reveals distinct intrahepatic macrophage populations. Nat.
Commun. 9, 4383. https://doi.org/10.1038/s41467-018-06318-7 (2018).
22. Ramachandran, P. et al. Resolving the fibrotic niche of human liver cirrhosis at single-cell level. Nature 575, 512–518. https://doi.
org/10.1038/s41586-019-1631-3 (2019).
23. Aizarani, N. et al. A human liver cell atlas reveals heterogeneity and epithelial progenitors. Nature 572, 199–204. https://doi.org/
10.1038/s41586-019-1373-2 (2019).
24. Payen, V. L. et al. Single-cell RNA sequencing of human liver reveals hepatic stellate cell heterogeneity. JHEP Rep. 3, 100278. https://
doi.org/10.1016/j.jhepr.2021.100278 (2021).
25. Dobie, R. et al. Single-cell transcriptomics uncovers zonation of function in the mesenchyme during liver fibrosis. Cell Rep. 29,
1832–1847. https://doi.org/10.1016/j.celrep.2019.10.024 (2019).
26. Xiong, X. et al. Landscape of intercellular crosstalk in healthy and nash liver revealed by single-cell secretome gene analysis. Mol.
Cell. 75, 644–660. https://doi.org/10.1016/j.molcel.2019.07.028 (2019).
27. Krenkel, O., Hundertmark, J., Ritz, T. P., Weiskirchen, R. & Tacke, F. Single cell RNA sequencing identifies subsets of hepatic stellate
cells and myofibroblasts in liver fibrosis. Cells 8, 503. https://doi.org/10.3390/cells8050503 (2019).
28. Halpern, K. B. et al. Single-cell spatial reconstruction reveals global division of labour in the mammalian liver. Nature 542, 352–356.
https://doi.org/10.1038/nature21065 (2017).
29. Terkelsen, M. K. et al. Transcriptional dynamics of hepatic sinusoid-associated cells after liver injury. Hepatology 72, 2119–2133.
https://doi.org/10.1002/hep.31215 (2020).
30. Lotto, J. et al. Single-cell transcriptomics reveals early emergence of liver parenchymal and non-parenchymal cell lineages. Cell
183, 702–716. https://doi.org/10.1016/j.cell.2020.09.012 (2020).
31. Mederacke, I., Dapito, D. H., Affo, S., Uchinami, H. & Schwabe, R. F. High-yield and high-purity isolation of hepatic stellate cells
from normal and fibrotic mouse livers. Nat. Protoc. 10, 305–315. https://doi.org/10.1038/nprot.2015.017 (2015).
32. Stuart, T. et al. Comprehensive integration of single-cell data. Cell 177, 1888–1902. https://doi.org/10.1016/j.cell.2019.05.031
(2019).
33. Aran, D. et al. Reference-based analysis of lung single-cell sequencing reveals a transitional profibrotic macrophage. Nat. Immunol.
20, 163–172. https://doi.org/10.1038/s41590-018-0276-y (2019).
34. Armingol, E., Officer, A., Harismendy, O. & Lewis, N. E. Deciphering cell-cell interactions and communication from gene expres-
sion. Nat. Rev. Genet. 22, 71–88. https://doi.org/10.1038/s41576-020-00292-x (2020).
35. Vento-Tormo, R. et al. Single-cell reconstruction of the early maternal-fetal interface in humans. Nature 563, 347–353. https://
doi.org/10.1038/s41586-018-0698-6 (2018).
36. Ramilowski, J. A. et al. A draft network of ligand-receptor-mediated multicellular signalling in human. Nat. Commun. 6, 7866.
https://doi.org/10.1038/ncomms8866 (2015).
37. Dewidar, B., Meyer, C., Dooley, S. & Meindl-Beinker, A. N. TGF-beta in hepatic stellate cell activation and liver fibrogenesis-
updated 2019. Cells 8, 1419. https://doi.org/10.3390/cells8111419 (2019).
38. McKee, C. et al. Amphiregulin activates human hepatic stellate cells and is upregulated in non alcoholic steatohepatitis. Sci. Rep.
5, 8812. https://doi.org/10.1038/srep08812 (2015).
39. Neill, T. et al. EphA2 is a functional receptor for the growth factor progranulin. J. Cell Biol. 215, 687–703. https://doi.org/10.1083/
jcb.201603079 (2016).
40. Fuchs, B. C. et al. Epidermal growth factor receptor inhibition attenuates liver fibrosis and development of hepatocellular carcinoma.
Hepatology 59, 1577–1590. https://doi.org/10.1002/hep.26898 (2014).
41. Ying, H. Z. et al. PDGF signaling pathway in hepatic fibrosis pathogenesis and therapeutics (review). Mol. Med. Rep. 16, 7879–7889.
https://doi.org/10.3892/mmr.2017.7641 (2017).
42. Breitkopf, K. et al. Expression patterns of PDGF-A, -B, -C and -D and the PDGF-receptors alpha and beta in activated rat hepatic
stellate cells (HSC). Cytokine 31, 349–357. https://doi.org/10.1016/j.cyto.2005.06.005 (2005).
43. Henderson, N. C. et al. Targeting of alphav integrin identifies a core molecular pathway that regulates fibrosis in several organs.
Nat. Med. 19, 1617–1624. https://doi.org/10.1038/nm.3282 (2013).
44. Sciurba, J. C. et al. Fibroblast-specific integrin-alpha V differentially regulates type 17 and type 2 driven inflammation and fibrosis.
J. Pathol. 248, 16–29. https://doi.org/10.1002/path.5215 (2019).
45. Joshi, N. et al. Von Willebrand factor deficiency reduces liver fibrosis in mice. Toxicol. Appl. Pharmacol. 328, 54–59. https://doi.
org/10.1016/j.taap.2017.05.018 (2017).
46. Adams, J. M. & Jafar-Nejad, H. The roles of notch signaling in liver development and disease. Biomolecules 9, 608. https://doi.org/
10.3390/biom9100608 (2019).
47. Chen, L. et al. Delta-like ligand 4/DLL4 regulates the capillarization of liver sinusoidal endothelial cell and liver fibrogenesis.
Biochim. Biophys. Acta Mol. Cell Res. 1866, 1663–1675. https://doi.org/10.1016/j.bbamcr.2019.06.011 (2019).
48. Aibar, S. et al. SCENIC: Single-cell regulatory network inference and clustering. Nat. Methods 14, 1083–1086. https://doi.org/10.
1038/nmeth.4463 (2017).
49. Lau, H. H., Ng, N. H. J., Loo, L. S. W., Jasmen, J. B. & Teo, A. K. K. The molecular functions of hepatocyte nuclear factors: In and
beyond the liver. J. Hepatol. 68, 1033–1048. https://doi.org/10.1016/j.jhep.2017.11.026 (2018).
50. Arendt, D. et al. The origin and evolution of cell types. Nat. Rev. Genet. 17, 744–757. https://doi.org/10.1038/nrg.2016.127 (2016).
Scientific Reports | (2021) 11:19396 | https://doi.org/10.1038/s41598-021-98806-y 13
Vol.:(0123456789)You can also read